FY2012 2nd Quater Business Results - Yamaha Motor Company · 2017. 11. 21. · 18.6 24.0 48.4 269.6...
33
TMAX (Europe) YZF-R15 (India) FY2012 2 FY2012 2 nd nd Quarter Business Results Quarter Business Results 【Design award winning models】 Yamaha Motor Co., Ltd. Aug 7, 2012
Transcript of FY2012 2nd Quater Business Results - Yamaha Motor Company · 2017. 11. 21. · 18.6 24.0 48.4 269.6...
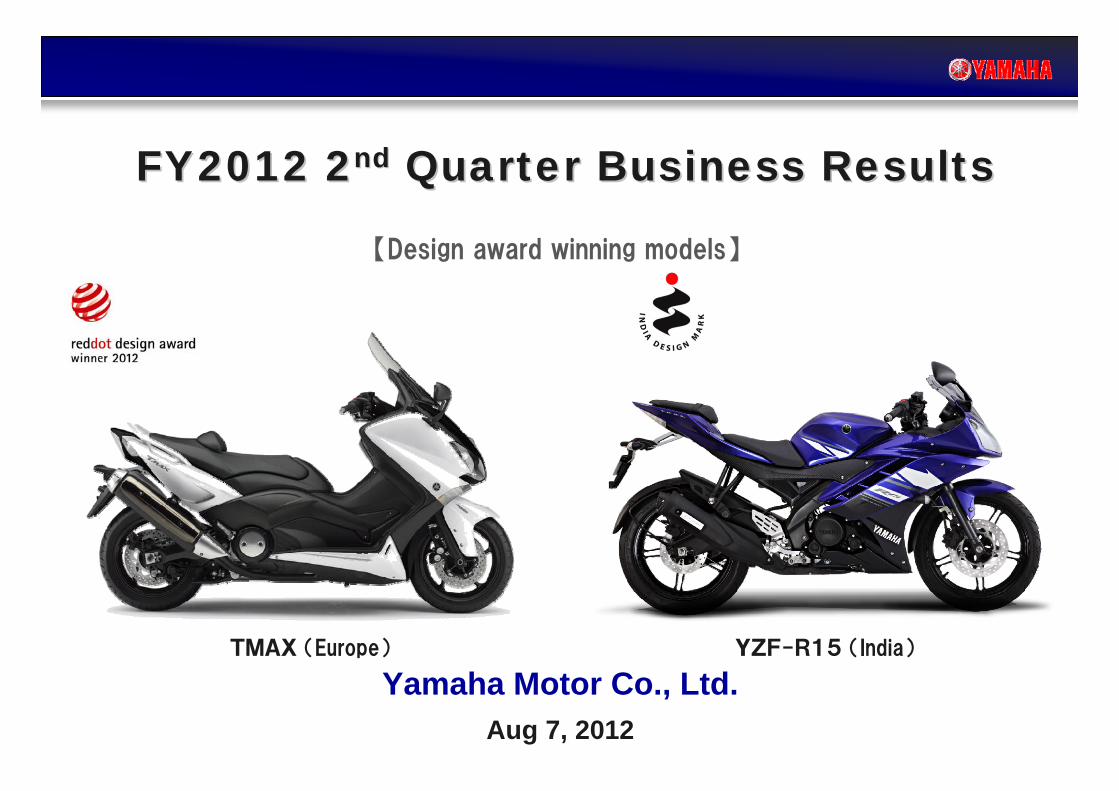
TMAX (Europe) YZF-R15 (India)
FY2012 2FY2012 2ndnd Quarter Business ResultsQuarter Business Results
【Design award winning models】
Yamaha Motor Co., Ltd.Aug 7, 2012

AgendaAgenda
Consolidated Financial Resultsfor the 2nd Quarter of the FY2012
Revised Forecasts of Financial Target for the FY2012
■ Outline - Hiroyuki Yanagi President and CEORepresentative Director
■ Details - Kozo ShinozakiSenior Executive Officer and Director
● Notice regarding the forecast consolidated results: Forecast consolidated results stated herein are based on the management’s assumptions and beliefs in light of the information currently available, and involve risks and uncertainties. Please be advised that actual results may differ significantly from those discussed in the forecast consolidated results.Potential risks and uncertainties include, but are not limited to, general economic conditions in Yamaha Motor’s major markets, changing consumer preferences, and currency exchange rate fluctuations.

OutlineOutline
Hiroyuki YanagiPresident and CEO
Representative Director
Hiroyuki YanagiPresident and CEO
Representative Director
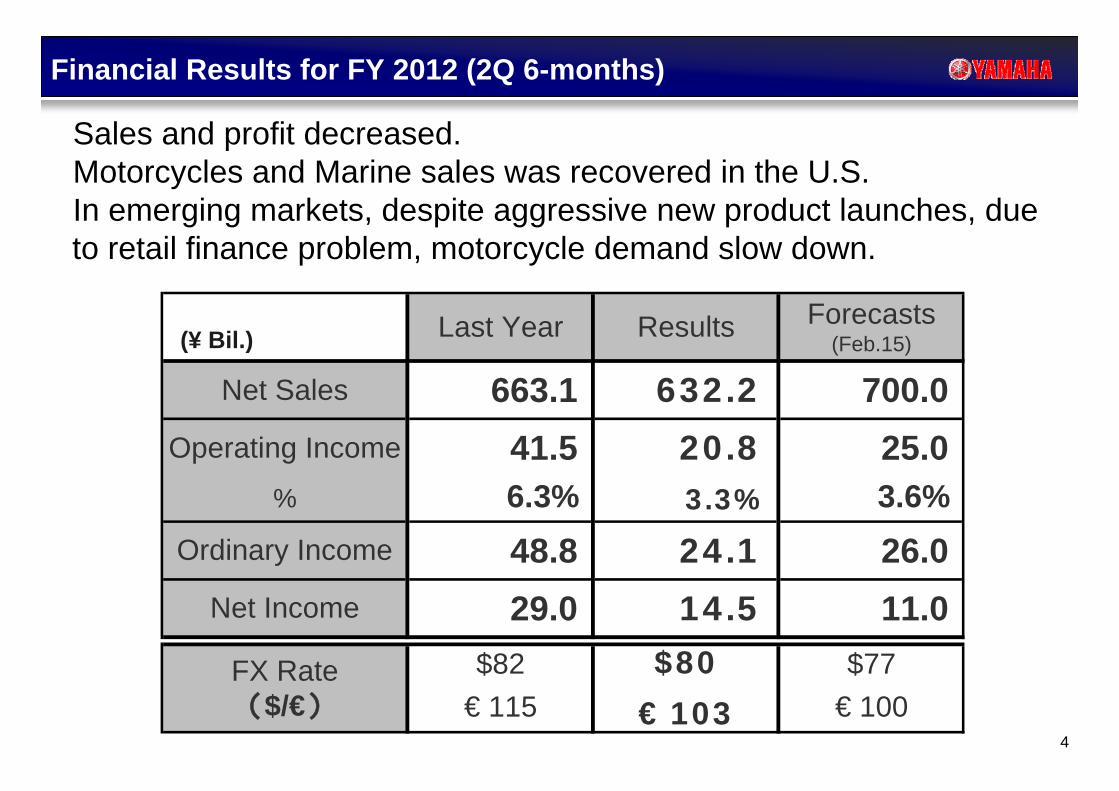
663.1 632.2 700.0 41.5 20.8 25.0 6.3% 3.3% 3.6%
48.8 24.1 26.0 29.0 14.5 11.0 Net Income
FX Rate($/€)
Net Sales
Operating Income
%
Ordinary Income
€ 100$80
€ 103€ 115
Last Year
$82
Results Forecasts(Feb.15)
$77
Sales and profit decreased.Motorcycles and Marine sales was recovered in the U.S.In emerging markets, despite aggressive new product launches, due to retail finance problem, motorcycle demand slow down.
4
(¥ Bil.)
Financial Results for FY 2012 (2Q 6-months)
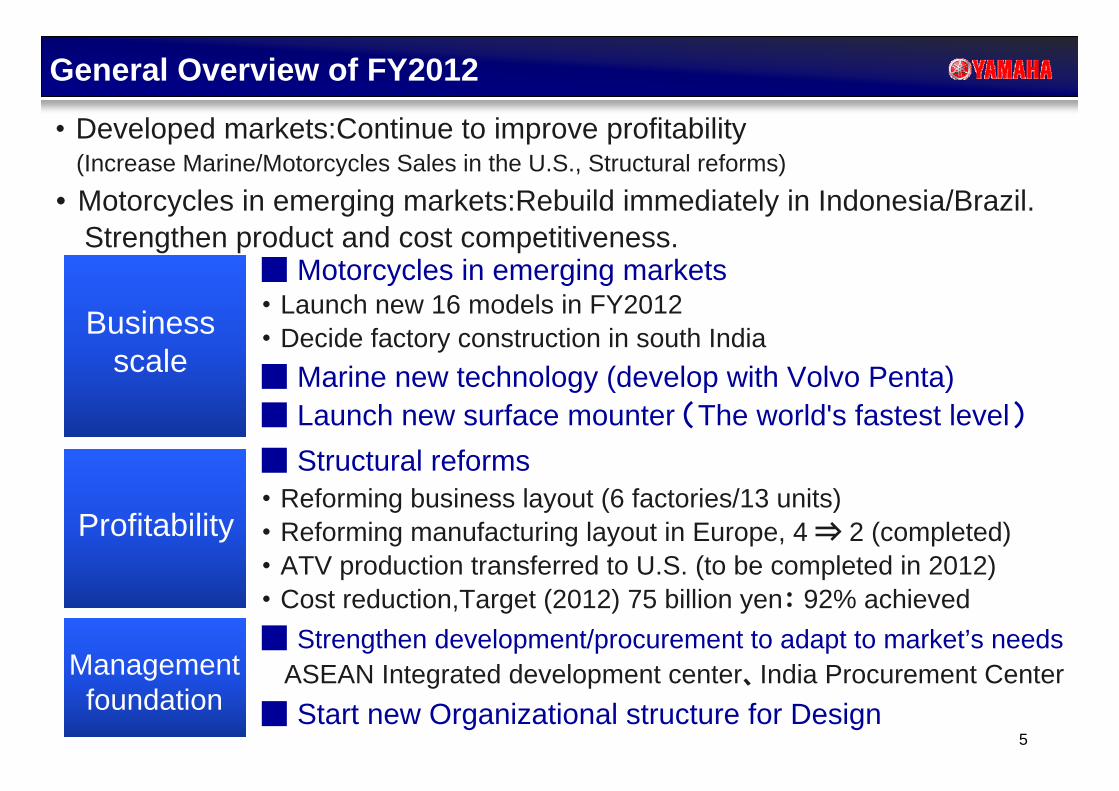
■ Strengthen development/procurement to adapt to market’s needsASEAN Integrated development center、India Procurement Center
Business scale
Profitability
Management foundation
■ Motorcycles in emerging markets・ Launch new 16 models in FY2012・ Decide factory construction in south India
■ Structural reforms・ Reforming business layout (6 factories/13 units)・ Reforming manufacturing layout in Europe, 4 ⇒ 2 (completed)・ ATV production transferred to U.S. (to be completed in 2012)・ Cost reduction,Target (2012) 75 billion yen: 92% achieved
■ Start new Organizational structure for Design
■ Marine new technology (develop with Volvo Penta)■ Launch new surface mounter (The world's fastest level)
5
・ Developed markets:Continue to improve profitability(Increase Marine/Motorcycles Sales in the U.S., Structural reforms)
・ Motorcycles in emerging markets:Rebuild immediately in Indonesia/Brazil. Strengthen product and cost competitiveness.
General Overview of FY2012

27
FY10 FY11
U.S. Europe(Big 5 markets)
U.S. :Demand bottoming out (+2%) , Sales increased (+26%)Europe:Demand continue decreasing (-16%), Sales decrease (-11%)Maintain the proper inventory level in both U.S. and Europe
255
440
FY12
266
62
259
2633
669
440
48
517
62
618
※ Big 5 markets: Italy, France, Spain, Germany, United Kingdom 6
Motorcycle business in U.S. and Europe (2Q 6-months)
Total demand (K units)
Total demand
WholesaleWholesale
FY10 FY11 FY12
105
80 71
(K units)

Outboard motorsIn emerging markets
Outboard motorsIn the U.S.
WV + Sport boatIn the U.S.
U.S. market is in recovery trend, emerging markets continue growth
FY10 FY12
96113
102
FY11
3130 66
71
1114
19
91
38
262628
※2 Outboard motors In emerging markets : Russian, Central and latin America, Asia(excluding Japan), Middle and Near East, Africa
302519Russia, Brazil
211 Sport boat
171310
※1 Total demand : WV only
※1
※2
WV
7
Marine business in U.S. and emerging Markets( 2Q 6-months)
Total demand Total demand
Wholesale
(K units)
Wholesale
Wholesale
FY10 FY12FY11 FY10 FY12FY11
(K units)(K units)
FY11 FY12 FY11 FY12 FY11 FY12Forecast FY11 FY12
Forecast
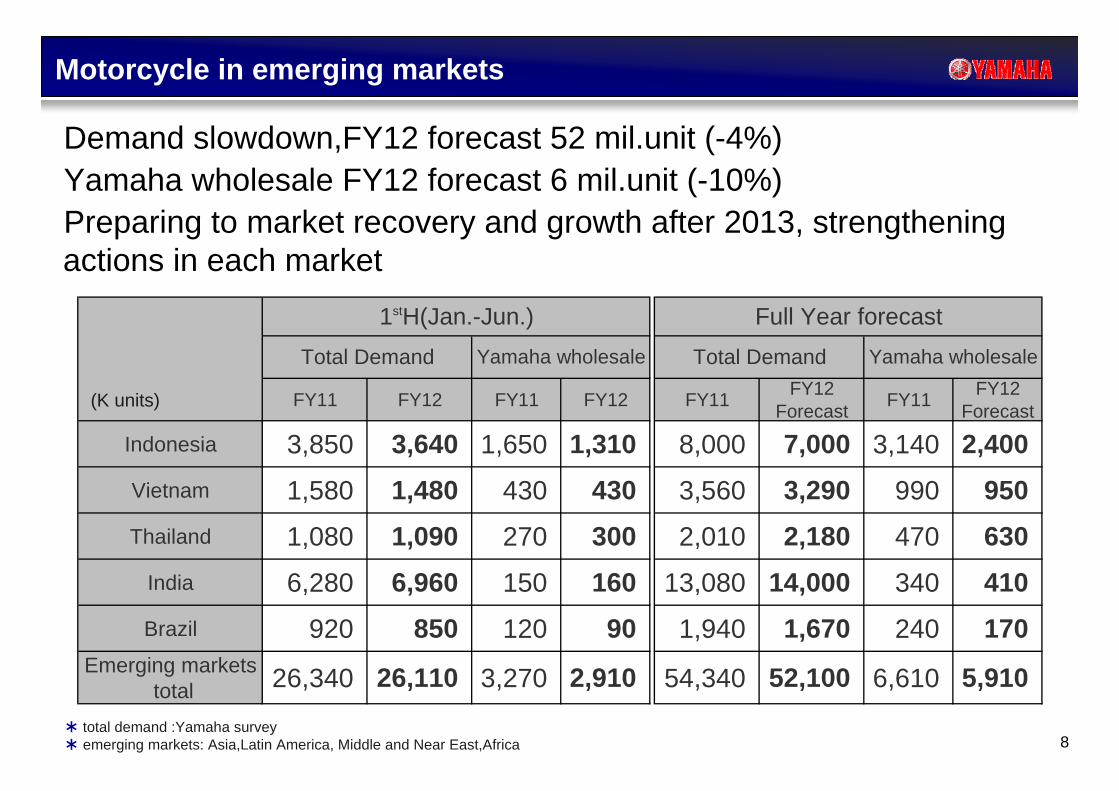
Indonesia 3,850 3,640 1,650 1,310 8,000 7,000 3,140 2,400Vietnam 1,580 1,480 430 430 3,560 3,290 990 950Thailand 1,080 1,090 270 300 2,010 2,180 470 630
India 6,280 6,960 150 160 13,080 14,000 340 410Brazil 920 850 120 90 1,940 1,670 240 170
Emerging markets total 26,340 26,110 3,270 2,910 54,340 52,100 6,610 5,910
Total Demand
Full Year forecastYamaha wholesaleYamaha wholesale
1stH(Jan.-Jun.)Total Demand
Demand slowdown,FY12 forecast 52 mil.unit (-4%)Yamaha wholesale FY12 forecast 6 mil.unit (-10%)Preparing to market recovery and growth after 2013, strengthening actions in each market
* total demand :Yamaha survey* emerging markets: Asia,Latin America, Middle and Near East,Africa 8
Motorcycle in emerging markets
(K units)

Indonesia / Brazil Business conditions
Indonesia
Brazil
Sales Management foundation
1. Promote FI models・Test ride for 3mil.people2. Retail finance・From quality to quantityof A/R・Enhance cooperationwith financial institutions・Islamic finance 3. Strengthen the sales
network
1.Expansion to the countryside・Continue PIT stop activity2. Retail finance・Expanding the company's
finance Volume・Reinforce the ”Consorcios”
(Brazilian Joint purchasing system)・ Enhance cooperation
with financial institutions3.Strengthen the sales
network
Towards the demand recovery after down payment regulation impact
1. Continuous launch ofnew products in themed-term
2. Structural reforms forenvironmental changes
・Lower break-even point・countermeasure for fluctuation of exchange
460
1Q
710
2Q
600
FY12 wholesale
3Q 4Q
Result forecast
630
40
1Q
44
2Q
43
3Q 4Q
42
Inventory reduction
1. strengthening the market adaptation bylocal development(ASEAN Integrateddevelopment center)
2. Continuous launch ofnew products in themed-term
3. Improve profitability by accelerating cost reduction
FY12 2ndH1. AT
・Strengthen sales & marketing for new models2. Moped
・Launch new modelJUPITER Z1 (July)3.Sports
・Launch New modelsFY13・Continuous new modelsLaunch
Products
FY12 2ndH1.Launch new modelcapable of using gasolineand/or ethanol fuel・YS250 Flex (July)
2.Expansion of big models・over 600cc (XJ6 etc.)
3.Strengthen moped modelsFY13
Launch New models
Towards the demand recovery after the normalization of retailfinance
9
(K units)
Inventory reduction
forecastResult

1,276.2 1,200.0 1,400.0
53.4 28.0 45.0 4.2% 2.3% 3.2%
63.5 34.0 47.0
27.0 17.0 17.0
Dividend \ 15.5 \ 10 \ 10
Last Year
$80 /€111
Rev.Forecasts(Aug.7)
Forecasts(Feb.15)
$77/€100(2ndH) $78 /€107
Net Income
FX Rate($/€) (2ndH) $77 /€100
$78/€102(2ndH) $77 /€100
Net Sales
Operating Income%
Ordinary Income
payment 1stH \ 5 1stH \ 5
Sales and Operating income decline,Net income keeps original forecastAnnual dividend payment plan is 10 yen per share,carry out an interim dividend
10
Financial Forecasts for FY 2012
(¥ Bil.)
DetailsDetails
Kozo ShinozakiDirector
Kozo ShinozakiDirector

11年: 欧州減少、タイ洪水により、台数前年並、円高により減収12年: 積極的な新機種投入により、新興国販売伸張狙う
3,008
268
5531
108
3,469
304.1
64.1
18.819.8
55.4
462.3
FY11 FY12 Forecast(Feb.15)
49
114
337
3,964
3722.0
51.0
325.0
75.0
490.0
17.0
3,427
12
3,105
49
99
259
38
2,661
18.624.0
48.4
269.6
54.0
414.7
Net sales decreased.Sales in Asia, Latin America, Europe decreased, U.S. increased.
Motorcycle Sales (2Q 6-months)
Unit Sales Sales Amount
Asia(Excluding Japan)
EuropeNorth America
Japan
Others
FY11 FY12 Forecast(Feb.15)
(K units) (¥ Bil.)

FY11 FY1211.1
25.54.9
15.117.6
45.4
113.6102.0
5.6
21.9
55.1
13.3Forecast
(Feb.15)
5.4
8.03.15.7 5.3
22.6
45.744.83.56.5
22.8
7.6
34.4
1.99.47.4
7.7
0.9
58.154.1
8.71.6 0.6
39.4
110.0
45.055.0
13
Marine products :Sales for outboard motor and personal water craft increased from LY due to North American market recovery
Power products :Generator sales increased in JapanOther products :Automobile engine sales recovered
Marine/ Power/ Other Products Sales (2Q 6-months)
Otherproducts
Marineproducts Power
products
* Other products : includes industrial machinery and robots
Asia(Excluding Japan)
Europe
North America
Japan
Others
(¥ Bil.)FY11 FY12 Forecast
(Feb.15)FY11 FY12 Forecast
(Feb.15)
54.1
663.1
44.8
102.0
462.3 490.0
110.0
45.0
55.0
700.0
5.7
41.56.5
5.9
23.6
6.0
25.05.0
19.0
-5.0
133
632.2
45.7
58.1
414.7
113.620.8
5.4
4.5
10.60.3
(82/115) (77/100)(80/103)($/€) 14
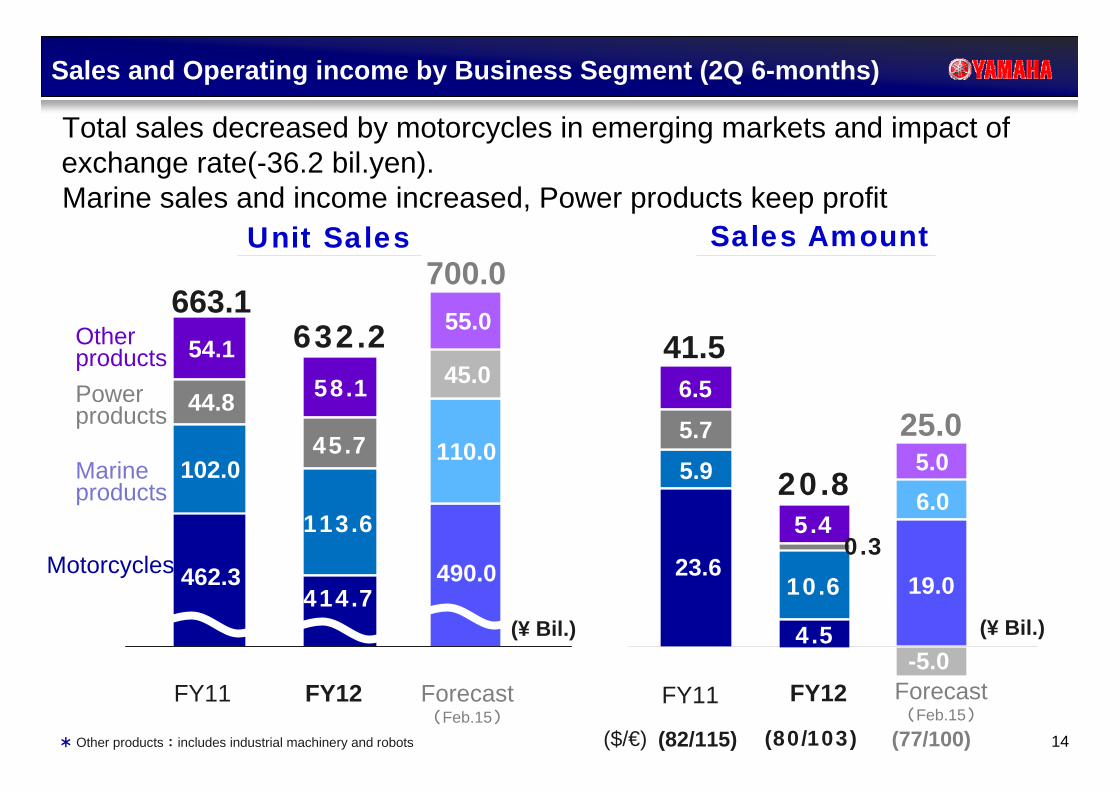
Total sales decreased by motorcycles in emerging markets and impact of exchange rate(-36.2 bil.yen).Marine sales and income increased, Power products keep profit
Sales and Operating income by Business Segment (2Q 6-months)
Motorcycles
Marineproducts
Powerproducts
Otherproducts
(¥ Bil.)(¥ Bil.)
FY11 FY12 Forecast(Feb.15)
FY11 FY12 Forecast(Feb.15)
* Other products : includes industrial machinery and robots
Unit Sales Sales Amount

Developed markets:Profit Improvement absorb appreciation of the yen and the impact reversal PL provisionMotorcycle in emerging markets:Income decreased by Motorcycles sales in Indonesia/Brazil
0億円、新興国二輪車 +39億円
FY11($/€:82/115)
FY12(80/103)
41.5
20.8
+16.5-17.0
-7.8
-8.9
-3.7
+0.2
15
Changes in Operating Income vs. FY11 (2Q 6-months)
(¥ Bil.)(Impact of exchange rate
-0.9)
Impact of exchange rate
($/€)
Impact of exchange rate(in emerging
markets)
reversal PL provision
Developedmarkets
Motorcycle inemerging markets
Others

先進国 +40億円、新興国二輪車 +39億円
16
FY11($/€:80/111)
FY12(78/102)
53.4
28.0
Impact of exchange rate
($/€)
+25.9-23.0
-10.8
-12.4
Impact of exchange rate(in emerging
markets)
-5.5
+0.4
Changes in Operating Income vs. FY11 (2012 Forecast)
(¥ Bil.)
(Impact of exchange rate
-1.3)
reversal PL provision
Developedmarkets
Motorcycle inemerging markets
Others
Developed markets:Profit Improvement absorb appreciation of the yen and the impact reversal PL provision in full yearMotorcycle in emerging markets:Income decrease despite early inventory adjustment and marketing enhancement

58.5
-27.2
22.1
59.0
-35.0
21.0
-24.5
30.0
22.5
($/€) (78/102)(80/111)
1,276.2
53.4242.8
723.8
309.6
Rev.ForecastsFY11
Net Sales
Operating income
17
6,322
-19
50
6301,650
94
(77/100)
1,400.0
45.0
250.0
838.0
312.0
Forecasts(Feb.15)
1,200.0
28.0650.0
305.0
245.0
Sales and Operating income (2012 Forecast)
Others
Motorcycles in emerging markets(Asia, LatinAmerica)
Developed markets(Europe, U.S.)
Others
Developed markets
Motorcycles in emerging markets
(¥ Bil.)
* Developed markets : Motorcycles in Japan, U.S. and Europe; and All-Terrain Vehicles, Outboard Motors, Personal Watercrafts and Snowmobiles** Others : Except Developed markets and Motorcycles in Emerging markets
Operating income vs LY : Developed markets +2.7 bil.(Absorbing impact of strong yen and reversal of PL provision -23.2 bil.yen)Motorcycles in emerging markets -28.5 bil.yen
109.41,276.2
100.3
178.9
887.6995.0
195.0
100.0
110.0
1,400.0
7.5
53.411.3
7.1
27.6
5.0
45.010.0
40.0
-10.0
2,197
133
18
3,159
221
293
2,099
546 12429
54
42
-1
(80/111) (77/100)(78/102)($/€)
1,200.0
28.0
800.0
195.0
100.0
105.0
9.5
-2.512.0
9.0
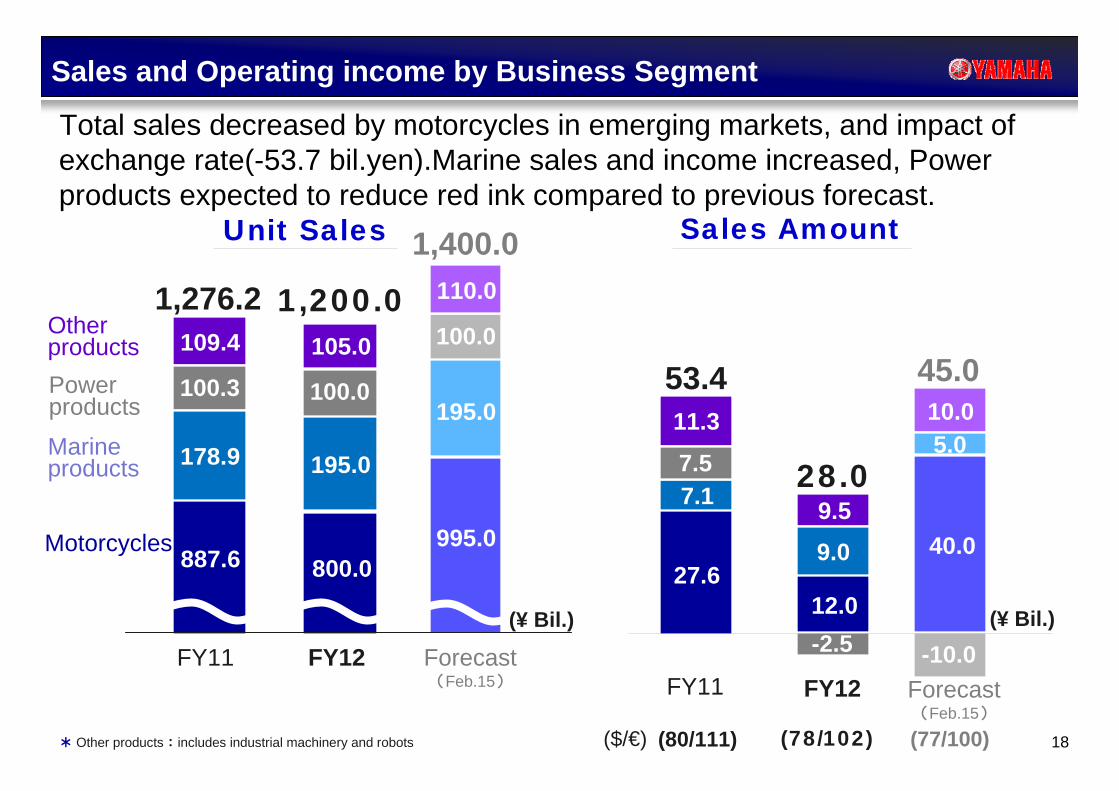
Sales and Operating income by Business Segment
Unit Sales Sales Amount
Motorcycles
Marineproducts
Powerproducts
Otherproducts
(¥ Bil.)(¥ Bil.)
Total sales decreased by motorcycles in emerging markets, and impact of exchange rate(-53.7 bil.yen).Marine sales and income increased, Power products expected to reduce red ink compared to previous forecast.
FY11 FY12 Forecast(Feb.15) FY11 FY12 Forecast
(Feb.15)
* Other products : includes industrial machinery and robots
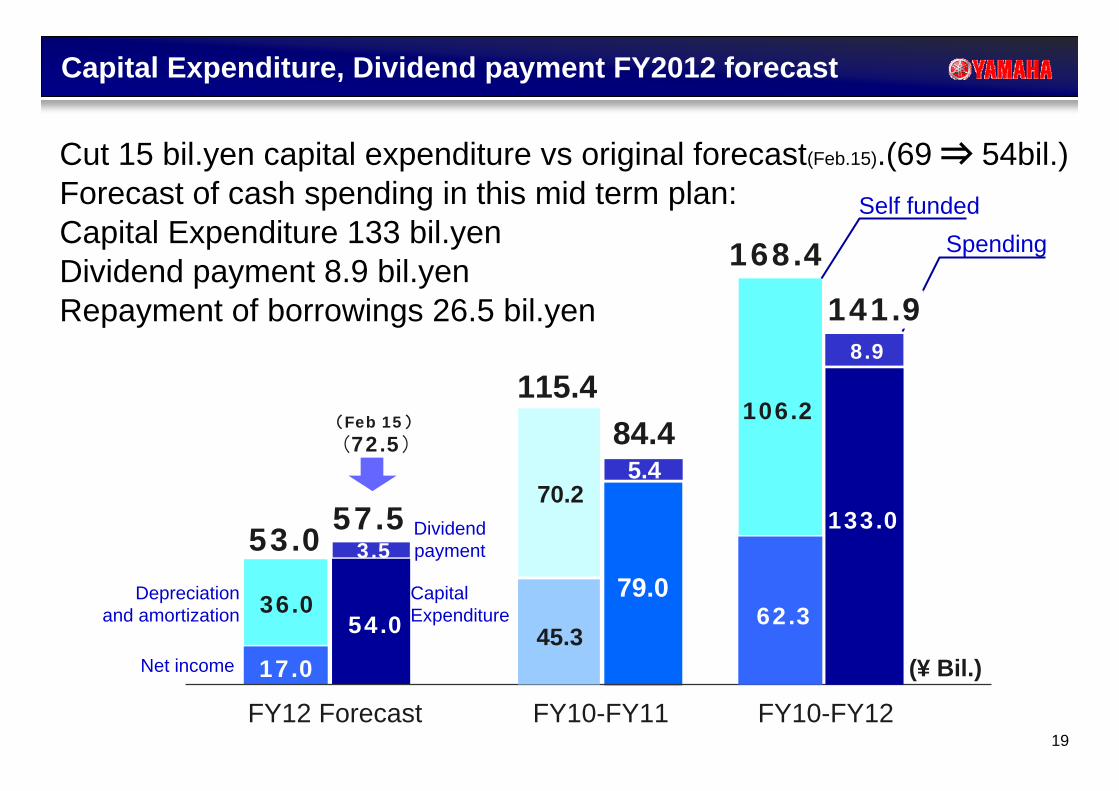
Cut 15 bil.yen capital expenditure vs original forecast(Feb.15).(69 ⇒ 54bil.)Forecast of cash spending in this mid term plan:Capital Expenditure 133 bil.yenDividend payment 8.9 bil.yenRepayment of borrowings 26.5 bil.yen
Capital Expenditure, Dividend payment FY2012 forecast
79.0
115.4
Self fundedSpending
53.0
2,000
45.3
70.2
36.0
17.0
54.0
3.5
5.484.4
57.5
168.4
106.2
62.3
133.0
8.9
19
(72.5)(Feb 15)
141.9
Net income
Depreciationand amortization
Capital Expenditure
Dividend payment
FY10-FY11FY12 Forecast FY10-FY12
(¥ Bil.)

20
21
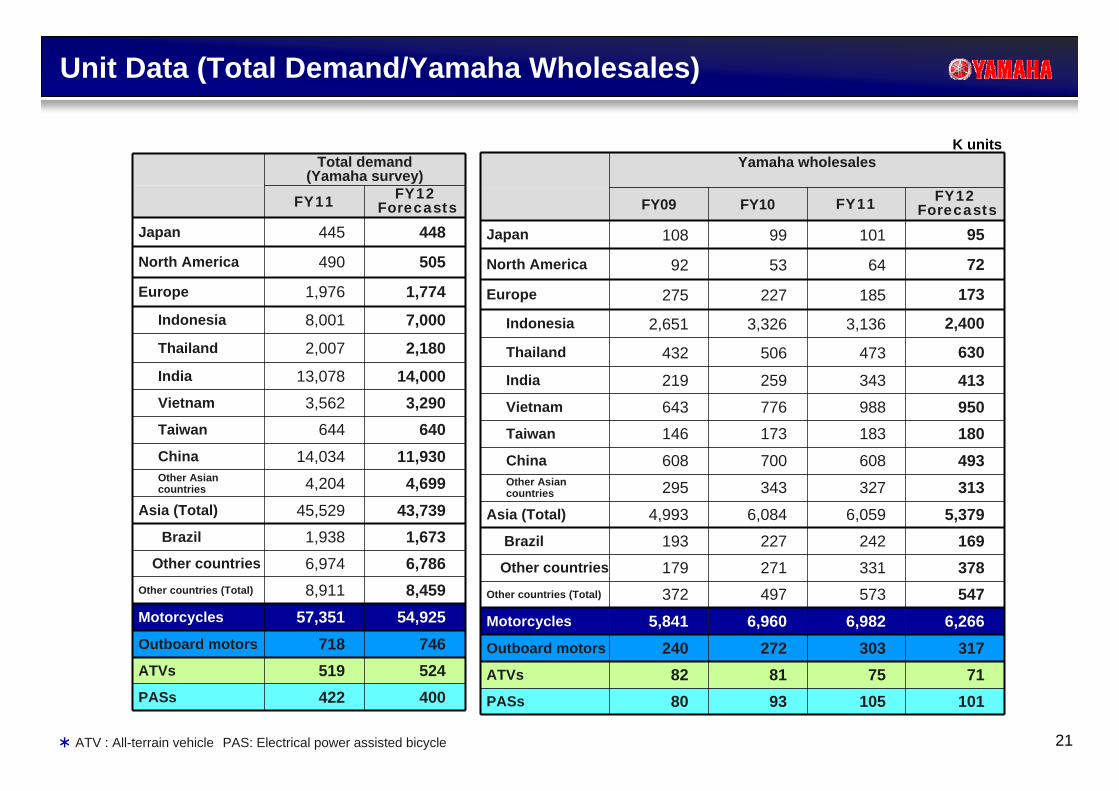
400524746
54,9258,4596,7861,673
43,7394,699
11,930640
3,29014,000
2,180
7,000
1,774
505
448
FY12Forecasts
422519718
57,3518,911
6,974
1,938
45,529
4,204
14,034
644
3,562
13,078
2,007
8,001
1,976
490
445
FY11
Total demand(Yamaha survey)
PASs
China
Brazil
Other countries
ATVs
Outboard motors
Japan
North America
Europe
Indonesia
Thailand
India
Vietnam
Taiwan
Asia (Total)
Other countries (Total)
Motorcycles
Other Asian countries
10171
3176,266
547378169
5,379313493180950413
630
2,400
173
72
95
FY12Forecasts
10575
3036,982
573
331
242
6,059
327
608
183
988
343
473
3,136
185
64
101
FY11
9381
2726,960
497
271
227
6,084
343
700
173
776
259
506
3,326
227
53
99
FY10
8082
2405,841
372
179
193
4,993
295
608
146
643
219
432
2,651
275
92
108
FY09
Yamaha wholesales
PASs
China
Brazil
Other countries
ATVs
Outboard motors
Japan
North America
Europe
Indonesia
Thailand
India
Vietnam
Taiwan
Asia (Total)
Other countries (Total)
Motorcycles
Other Asian countries
Unit Data (Total Demand/Yamaha Wholesales)
* ATV : All-terrain vehicle PAS: Electrical power assisted bicycle
K units

Sales(Billion yen)
FY11Results
FY12Forecasts
FY12Results vs FY11 vs
ForecastsFY11
ResultsFY12
ResultsMotorcycles 462.3 490.0 414.7 -10.3% -15.4% 242.5 204.8
Marine Products 102.0 110.0 113.6 11.3% 3.3% 51.4 59.0Power Products 44.8 45.0 45.7 2.1% 1.6% 23.0 23.6
Industrial Machinery & Robots 17.9 19.0 17.5 -2.4% -8.1% 9.5 9.8Other Products 36.2 36.0 40.7 12.5% 13.0% 18.0 19.0
Total 663.1 700.0 632.2 -4.7% -9.7% 344.5 316.3
Operating Income ( Billion yen)Motorcycles 23.6 19.0 4.5 -80.8% -76.2% 10.3 -0.9
Marine Products 5.9 6.0 10.6 80.2% 76.3% 1.7 6.4Power Products 5.7 -5.0 0.3 -95.4% - 5.1 0.4
Industrial Machinery & Robots 3.7 2.8 3.1 -17.2% 10.9% 2.1 2.3Other Products 2.7 2.2 2.3 -13.4% 6.3% 1.8 0.2
Total 41.5 25.0 20.8 -49.9% -16.8% 20.9 8.4
Operating Income Margin (%)Motorcycles 5.1% 3.9% 1.1% -4.0% -2.8% 4.2% -0.5%
Marine Products 5.8% 5.5% 9.3% 3.6% 3.9% 3.2% 10.8%Power Products 12.6% -11.1% 0.6% -12.1% 11.7% 22.0% 1.6%
Industrial Machinery & Robots 21.0% 14.7% 17.8% -3.2% 3.1% 21.8% 23.8%Other Products 7.5% 6.1% 5.7% -1.7% -0.4% 10.1% 1.2%
Total 6.3% 3.6% 3.3% -3.0% -0.3% 6.1% 2.6%
(Reference) Motorcycles+ATVsSales 483.8 509.0 434.2 -10.3% -14.7% 253.7 215.0
Operating Income 27.8 13.5 2.6 -90.5% -80.5% 14.0 -2.1Operating Income Margin 5.7% 2.7% 0.6% -5.1% -2.0% 5.5% -1.0%
2Q (6-months) 2Q (3-months)
22
Sales and Operating income by Business Segment (2Q: 3-months/ 6-months)
* ATV : All-terrain vehicle

Sales(Billion yen)
FY11 Forecasts(Feb.15)
Rev.forecasts(Aug.7)
vs LYvs
Forecasts(Feb.15)
Motorcycles 887.6 995.0 800.0 -9.9% -19.6%Marine Products 178.9 195.0 195.0 9.0% 0.0%Power Products 100.3 100.0 100.0 -0.3% 0.0%
Industrial Machinery & Robots 34.3 39.0 35.0 2.0% -10.3%Other Products 75.1 71.0 70.0 -6.8% -1.4%
Total 1,276.2 1,400.0 1,200.0 -6.0% -14.3%
Operating Income ( Billion yen)Motorcycles 27.6 40.0 12.0 -56.5% -70.0%
Marine Products 7.1 5.0 9.0 27.2% 80.0%Power Products 7.5 -10.0 -2.5 - -
Industrial Machinery & Robots 6.3 6.5 5.3 -15.4% -18.5%Other Products 5.0 3.5 4.2 -16.3% 20.0%
Total 53.4 45.0 28.0 -47.6% -37.8%
Operating Income Margin (%)Motorcycles 3.1% 4.0% 1.5% -1.6% -2.5%
Marine Products 4.0% 2.6% 4.6% 0.7% 2.1%Power Products 7.5% -10.0% -2.5% -10.0% 7.5%
Industrial Machinery & Robots 18.2% 16.7% 15.1% -3.1% -1.5%Other Products 6.7% 4.9% 6.0% -0.7% 1.1%
Total 4.2% 3.2% 2.3% -1.9% -0.9%
(Reference) Motorcycles+ATVsSales 929.5 1,035.0 839.0 -9.7% -18.9%
Operating Income 32.7 29.0 7.0 -78.6% -75.9%Operating Income Margin 3.5% 2.8% 0.8% -2.7% -2.0%
Full Year
23
Sales and Operating Income by Business Segment
* ATV : All-terrain vehicle

+2%
+6%
+10%
41 4232
4230
40(-6%)
(-4%)(+2%)
+6%
1720
2420
1518
(-16%)(-9%)
(-16%)
+5%
+11%
5 86 9
(+16%)(+11%)
25 27(+10%)
23 2026
2327
20
(+3%)(-2%)(-0%)
21 20
29
18
(-1%)(-7%)(-15%)
162017 22
(+10%)(+11%) 28
+0%
+6%
+10%
29
18
24
17 171618
(+7%)(-2%)
11 10(-6%)
11 107 6(-33%)(-38%)
9
(+4%)
9
1114
23 25
1114
(+6%)
(+4%)(+3%)20 18 1820
(+1%)(+11%)(+6%)
1822
16
26
60
20
61
29
(+1%)
(+10%)
(+20%)
52 54 5152 5055 (-3%)
(+2%)(+1%)
1 2 3 4 5 67 8 9 10 11 12
FY12
31(+9%)
* ATV : All-terrain vehicle
Monthly Total Demand for Major U.S. Products
Motorcycles
ATV*s
Outboard motors
Data) Motorcycle and ATV: MIC, Outboard motor: NMMA
Jan.-Mar.:
Jan.-Mar.:
Jan.-Mar.:
Apr.-Jun.:
Apr.-Jun.:
Apr.-Jun.:
Jan.-Jun.:
Jan.-Jun.:
Jan.-Jun.:
(K Units)
FY10FY11

25
36
14
36
FY12Forecast
34
18
37
FY11
19
8
23
FY12Forecast
17
10
24
FY11
40
18
37
FY12Results
23
10
23
FY12Results
+24%
+25%
-3%
vs Forecast
+33%
-2%
-5%
vs LY
2Q(3-months)
2Q(6-months)
+13%+19%Outboard motors
+24%0%ATVs
+3%0%Motorcycle
vs Forecastvs LY
37
14
31
FY12Forecast
31
17
26
FY11
17
8
13
FY12Forecast
14
9
13
FY11
38
14
33
FY12Results
17
6
16
FY12Results
-2%
-16%
+23%
vs Forecast
+19%
-29%
+20%
vs LY
2Q(3-months)
2Q(6-months)
+2%+23%Outboard motors
+3%-16%ATVs
+8%+26%Motorcycle
vs Forecastvs LY
* ATV : All-terrain vehicle
U.S. Business Condition
Retail
Wholesale
(K units)
(K units)

4QFY09
1Q 2Q 3Q 4QFY10
5969
8890
40333636
89912
49
35
13
676944
62 6677
59
34
12
1Q 3Q 4Q
47
29
10
51
29
16
57
FY11
53
2Q
45
28
11
60
25
14
62
1Q
65
26
23
15
53
2Q
54
26
15
55
4QForecast
50
FY12
Market Stocks in the U.S. and Europe
Major Products in the U.S.
Motorcycles in Europe
* ATV : All-terrain vehicle
U.S. Motorcycles
ATVs
Outboard motors(wholesale stocks)
Europe Motorcycles(wholesale stocks)
(K Units)

66.488.0 98.3
8091,023
602
20.9 21.721.1
156166
140
19.818.325.9
221282
201
8.612.2
10.0
78107
81
Ray
Mio 115i(Launched in
Jan. 2012)
Filano(Launched in
Jan. 2012)
27
Soul GT(Launched in
Apl. 2012)
TTX(Launched in
Mar. 2012)
Fino(Launched in
Feb. 2012)
Nouvo SX(Launched in Mar. 2012)
Nouvo SX(Launched in
Mar. 2012)
-4%-9%
+11%-26%
Mio J(Launched in Feb. 2012)
Sales in main countries in Asia (2Q-3months)
Unit sales(K Units)
Salesamount(¥ Bil.)
Unit sales(K Units)
Salesamount(¥ Bil.)
FY11 FY12Forecasts
FY12 FY11 FY12 FY12Forecasts
FY11 FY12Forecasts
FY12 FY11 FY12 FY12Forecasts
India (IYM)Vietnam (YMVN)
Indonesia (YIMM) Thailand (TYM)
* Unit sales consist only of sales in each nation, while sales amount includes exports from each nation.
(Delhi Expo Exhibition Model)(will be launched in this autumn)

141.9175.6 178.0
1,6461,846
1,311
40.0 38.540.1
297288265
40.635.8
46.5
431
521434
18.9 23.419.0
161196
152
28
+6%+1%
+12%-20%
Ray
Sales in main countries in Asia (2Q-6months)
India (IYM)Vietnam (YMVN)
Indonesia (YIMM) Thailand (TYM)
* Unit sales consist only of sales in each nation, while sales amount includes exports from each nation.
Unit sales(K Units)
Salesamount(¥ Bil.)
Unit sales(K Units)
Salesamount(¥ Bil.)
FY11 FY12Forecasts
FY12 FY11 FY12 FY12Forecasts
FY11 FY12Forecasts
FY12 FY11 FY12 FY12Forecasts
Mio 115i(Launched in
Jan. 2012)
Filano(Launched in
Jan. 2012)
Soul GT(Launched in
Apl. 2012)
TTX(Launched in
Mar. 2012)
Fino(Launched in
Feb. 2012)
Nouvo SX(Launched in Mar. 2012)
Nouvo SX(Launched in
Mar. 2012)
Mio J(Launched in Feb. 2012)
(Delhi Expo Exhibition Model)(will be launched in this autumn)

35.0
1Q 2Q 3Q 4Q 2Q 2QForecast(Feb.15)
4.0
4.8
1.1
10.5
13.8
15.8
4.7
34.3
2011 2012
4.73.2 3.2 2.7
3.5
3.9 4.43.9
1.2
1.31.0
1.2
9.58.4 8.7
7.8
29
1Q
3.4
3.3
0.97.6
9.8
Asia
Japan
Other
* Sales includes surface mounters, Robot and wheelchair.
2012Forecasts
(Aug.7)
2011
(¥ Bil.)
Sales in Industrial Machinery and Robots Business
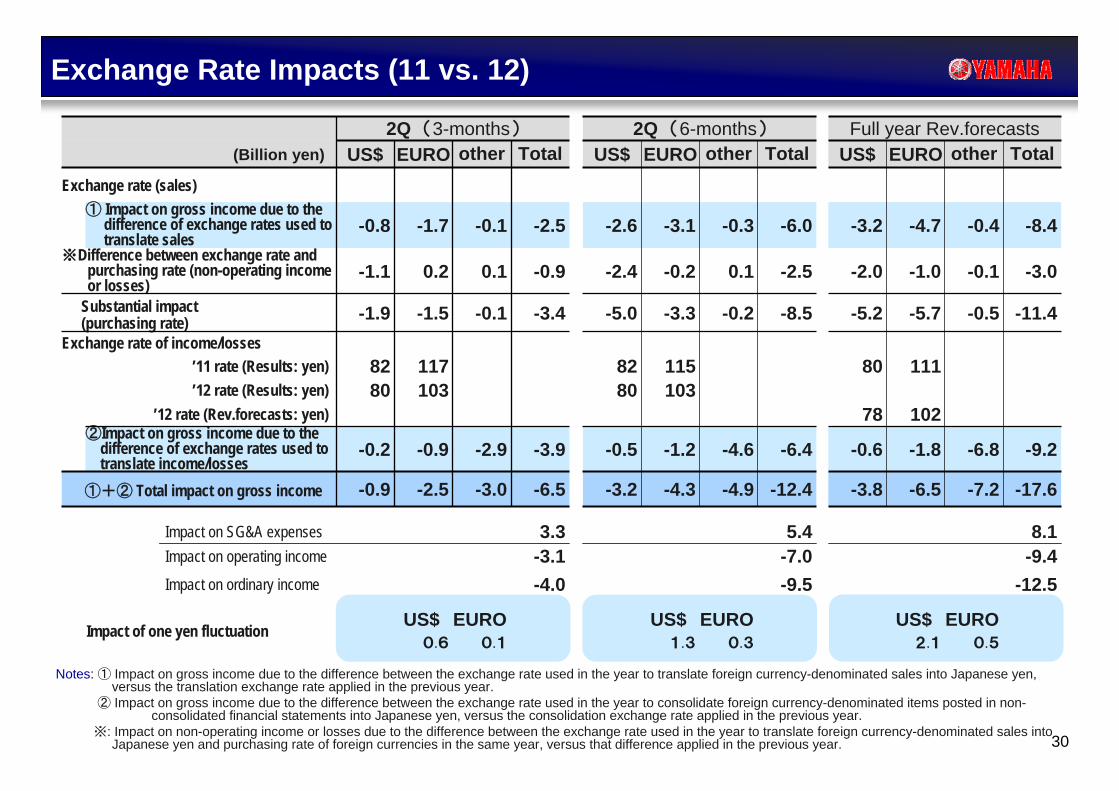
8.15.43.3Impact on SG&A expenses-9.4-7.0-3.1Impact on operating income
-12.5-9.5-4.0Impact on ordinary income
-17.6-7.2-6.5-3.8-12.4-4.9-4.3-3.2-6.5-3.0-2.5-0.9①+② Total impact on gross income
1038010380’12 rate (Results: yen)
EURO0.5
-6.8
-0.5
-0.1
-0.4
other
-9.2
-11.4
-3.0
-8.4
Total
US$2.1
-1.8
102
111
-5.7
-1.0
-4.7
EURO
-0.6
78
80
-5.2
-2.0
-3.2
US$Full year Rev.forecasts
-6.4
-8.5
-2.5
-6.0
Total
EURO0.3
-4.6
-0.2
0.1
-0.3
other
US$1.3
-1.2
115
-3.3
-0.2
-3.1
EURO
-0.5
82
-5.0
-2.4
-2.6
US$2Q (6-months)2Q (3-months)
②Impact on gross income due to the difference of exchange rates used to translate income/losses
① Impact on gross income due to the difference of exchange rates used to translate sales
Exchange rate of income/losses
EURO0.1
US$0.6
Impact of one yen fluctuation
-3.9-2.9-0.9-0.2
’12 rate (Rev.forecasts: yen)
11782’11 rate (Results: yen)
-3.4-0.1-1.5-1.9Substantial impact(purchasing rate)
-0.90.10.2-1.1※Difference between exchange rate and
purchasing rate (non-operating income or losses)
-2.5-0.1-1.7-0.8
Exchange rate (sales)
TotalotherEUROUS$(Billion yen)
30
Notes: ① Impact on gross income due to the difference between the exchange rate used in the year to translate foreign currency-denominated sales into Japanese yen, versus the translation exchange rate applied in the previous year.
② Impact on gross income due to the difference between the exchange rate used in the year to consolidate foreign currency-denominated items posted in non-consolidated financial statements into Japanese yen, versus the consolidation exchange rate applied in the previous year.
※: Impact on non-operating income or losses due to the difference between the exchange rate used in the year to translate foreign currency-denominated sales into Japanese yen and purchasing rate of foreign currencies in the same year, versus that difference applied in the previous year.
Exchange Rate Impacts (11 vs. 12)

先進国利益改善で、新興国二輪車減益を吸収米国マリン・二輪車販売底打ち、国内生産回復、販管費削減新興国二輪車、アセアンFIスクーター新商品を積極投入
31
41.5
+3.9+5.5 -2.5
-12.4
20.8
FY11($/€:82/115)
FY12($/€:80/103)
-0.2
-15.8 (-20.7)
+0.9 -0.1
Impact of exchange rate
Increase in gross income due to sales expansion
Cost reductionin procurement
Impact of decreased raw material prices
Increase in depreciation expenses
Increase in R&D expenses
Increase in SG&A expenses Others
(¥ Bil.)
(11 vs. 12 )
Changes in Operating Income vs. FY11 (2Q 6-months)
(incl.price increase)

32
53.4
28.0
FY11($/€:80/111)
FY12Rev.forecast($/€:78/102)
(-25.4)+11.0 -6.0
-17.6+8.5
-18.8+2.0 -2.4
-2.1
(¥ Bil.)
Impact of exchange rate
Decrease in gross income due to sales decline
Cost reductionin procurement
Impact of decreased raw material prices
Increase in depreciation expenses
Increase in R&D expenses
Decrease in SG&A expenses Others
Changes in Operating Income vs. FY11 (2012 Forecast)
(11 vs. 12 )
33
http://www.yamaha-motor.co.jp/global/Yamaha Motor website(Global site: English)
You are also welcome to review the IR information on Yamaha Motor’s website.
http://www.yamaha-motor.co.jp/global/ir/For investorsInvestor meeting presentationIR materials
http://www.yamaha-motor.co.jp/global/ir/explanation/http://www.yamaha-motor.co.jp/global/ir/material/
Information


![Lecture – 3 Dr. Zahoor Ali Shaikh 1. What is Anemia? Anemia means - Decreased hemoglobin - Decreased RBC count - Decreased Hematocrit [PCV] Therefore,](https://static.fdocuments.us/doc/165x107/56649c9e5503460f9495e870/lecture-3-dr-zahoor-ali-shaikh-1-what-is-anemia-anemia-means-decreased.jpg)