FY16 results presentation v4 - Abacus Property Group | Property Group – FY16 Results Presentation...
51
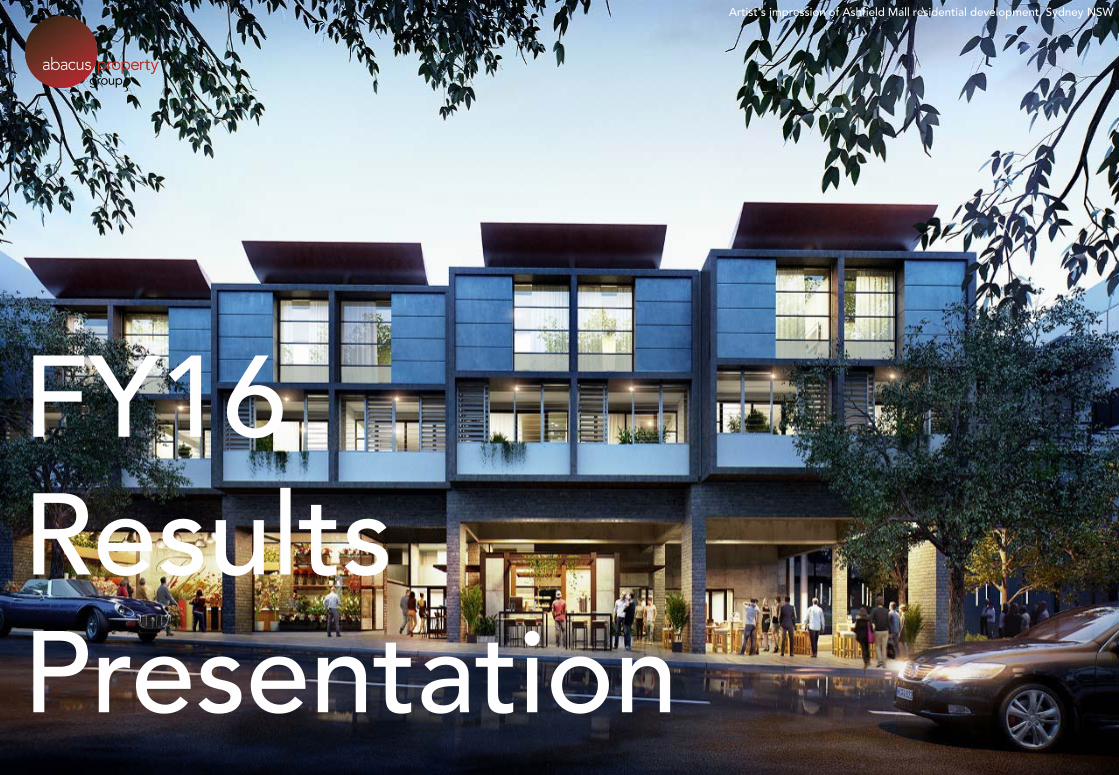
Abacus Property Group – FY16 Results Presentation 19 August 2016 FY16 Results Presentation Artist’s impression of Ashfield Mall residential development, Sydney NSW
Transcript of FY16 results presentation v4 - Abacus Property Group | Property Group – FY16 Results Presentation...
Abacus Property Group – FY16 Results Presentation 19 August 2016
FY16ResultsPresentation
Artist’s impression of Ashfield Mall residential development, Sydney NSW

Abacus Property Group – FY16 Results Presentation 19 August 2016
Agenda
- FY16 highlights Frank Wolf
- Financial results and capital management Rob Baulderstone
- Office and Industrial Peter Strain
- Retail Cameron Laird
- Storage Phil Peterson
- Property Ventures Frank Wolf
Cameron Laird
John L’Estrange
- Funds Management Frank Wolf
- Summary Frank Wolf
Westpac House, Adelaide SA
Abacus Property Group – FY16 Results Presentation 19 August 2016
FY16 highlights
3
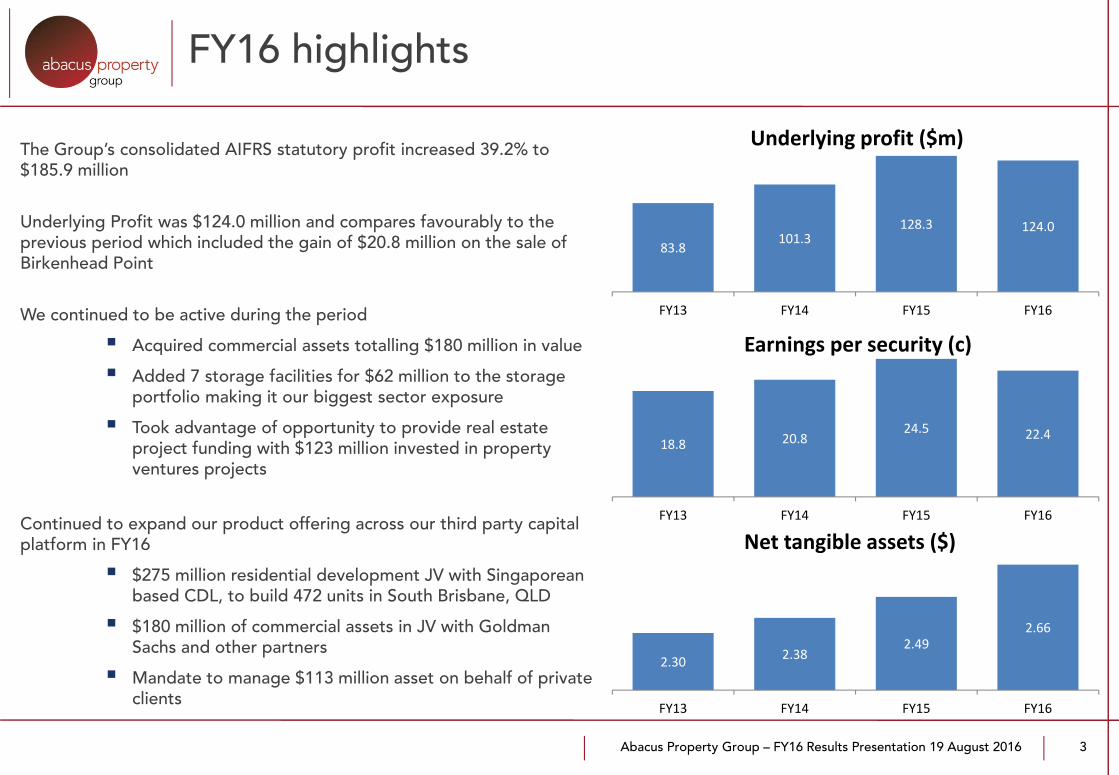
The Group’s consolidated AIFRS statutory profit increased 39.2% to $185.9 million
Underlying Profit was $124.0 million and compares favourably to the previous period which included the gain of $20.8 million on the sale of Birkenhead Point
We continued to be active during the period
Acquired commercial assets totalling $180 million in value
Added 7 storage facilities for $62 million to the storage portfolio making it our biggest sector exposure
Took advantage of opportunity to provide real estate project funding with $123 million invested in property ventures projects
Continued to expand our product offering across our third party capital platform in FY16
$275 million residential development JV with Singaporean based CDL, to build 472 units in South Brisbane, QLD
$180 million of commercial assets in JV with Goldman Sachs and other partners
Mandate to manage $113 million asset on behalf of private clients
83.8101.3
128.3 124.0
FY13 FY14 FY15 FY16
Underlying profit ($m)
18.8 20.824.5 22.4
FY13 FY14 FY15 FY16
Earnings per security (c)
2.30 2.382.49
2.66
FY13 FY14 FY15 FY16
Net tangible assets ($)
Abacus Property Group – FY16 Results Presentation 19 August 2016
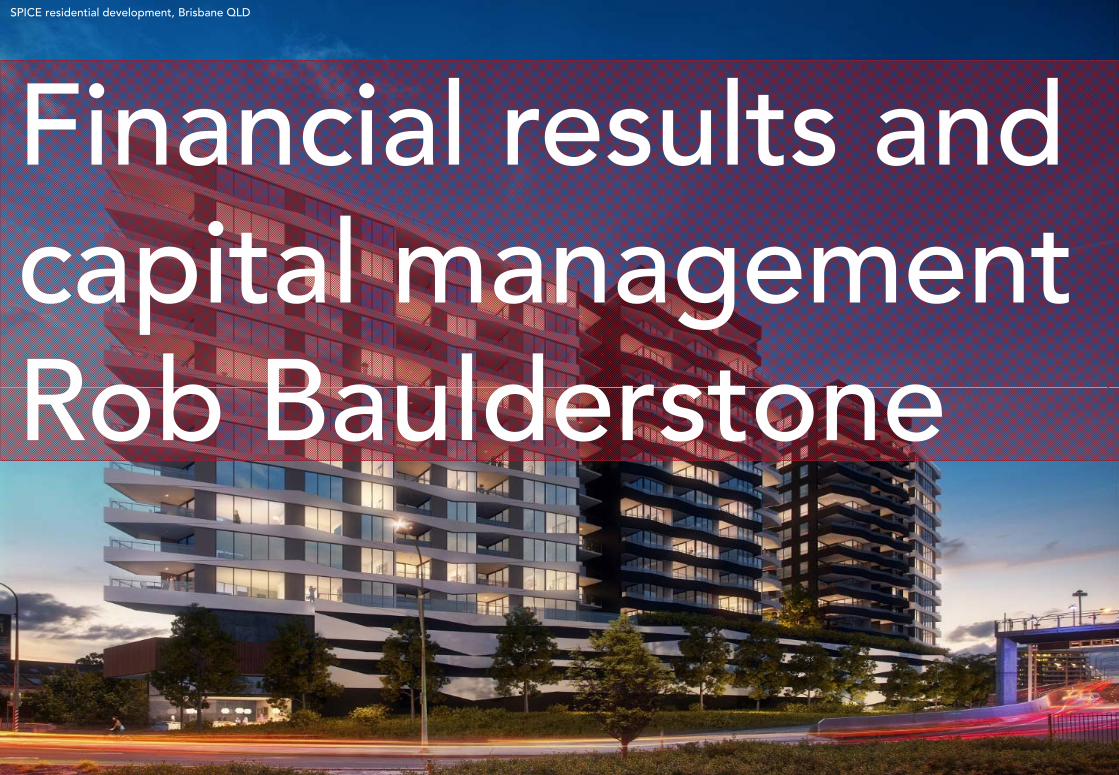
Financial results and capital managementRob Baulderstone
SPICE residential development, Brisbane QLD
Abacus Property Group – FY16 Results Presentation 19 August 2016
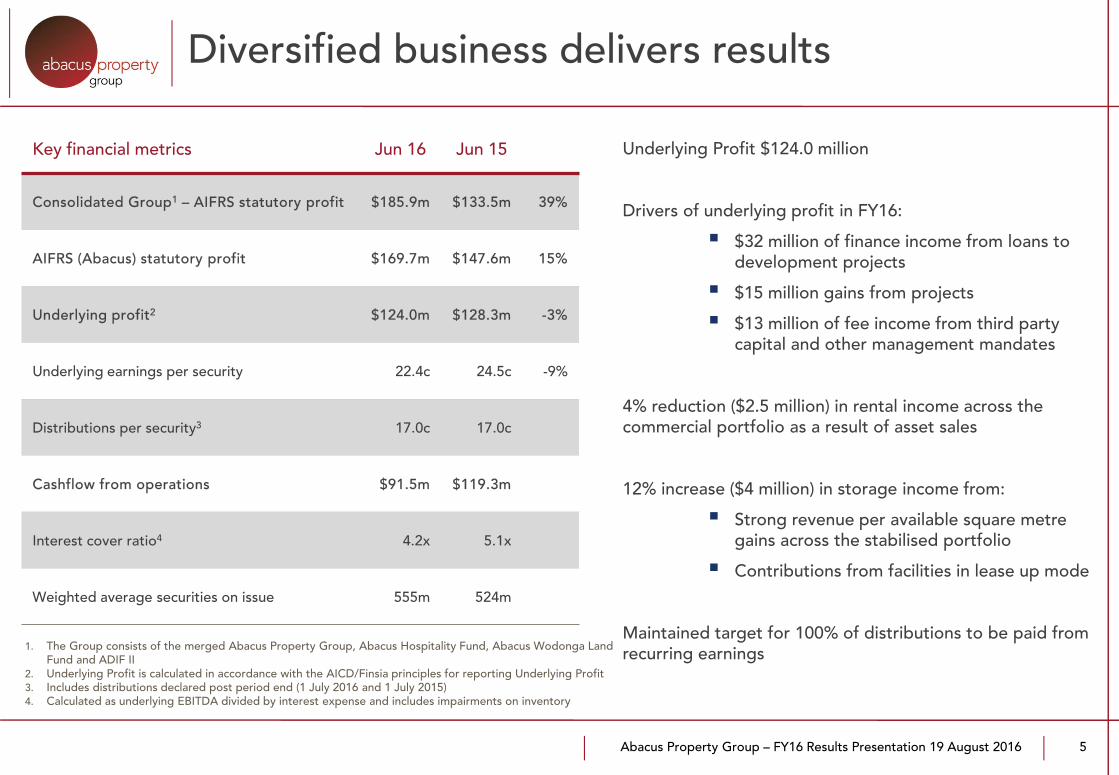
Diversified business delivers results
5
Key financial metrics Jun 16 Jun 15
Consolidated Group1 – AIFRS statutory profit $185.9m $133.5m 39%
AIFRS (Abacus) statutory profit $169.7m $147.6m 15%
Underlying profit2 $124.0m $128.3m -3%
Underlying earnings per security 22.4c 24.5c -9%
Distributions per security3 17.0c 17.0c
Cashflow from operations $91.5m $119.3m
Interest cover ratio4 4.2x 5.1x
Weighted average securities on issue 555m 524m
1. The Group consists of the merged Abacus Property Group, Abacus Hospitality Fund, Abacus Wodonga Land Fund and ADIF II
2. Underlying Profit is calculated in accordance with the AICD/Finsia principles for reporting Underlying Profit3. Includes distributions declared post period end (1 July 2016 and 1 July 2015)4. Calculated as underlying EBITDA divided by interest expense and includes impairments on inventory
Underlying Profit $124.0 million
Drivers of underlying profit in FY16:
$32 million of finance income from loans to development projects
$15 million gains from projects
$13 million of fee income from third party capital and other management mandates
4% reduction ($2.5 million) in rental income across the commercial portfolio as a result of asset sales
12% increase ($4 million) in storage income from:
Strong revenue per available square metre gains across the stabilised portfolio
Contributions from facilities in lease up mode
Maintained target for 100% of distributions to be paid from recurring earnings

Abacus Property Group – FY16 Results Presentation 19 August 2016 6
Balance sheet metrics Jun 16 Jun 15
NTA per security $2.66 $2.49
NTA per security less August distribution1 $2.59 $2.41
Abacus total assets $2,302m $1,957m
Net tangible assets2 $1,480m $1,378m
Total debt facilities $873m $770m
Total debt drawn $629m $388m
Average cost of drawn debt 5.4% 6.1%
Abacus gearing ratio3 25.8% 18.2%
Covenant gearing ratio4 29.5% 22.8%
Debt term to maturity 3.5 yrs 4.3 yrs
% hedged of drawn debt 53% 88%
% hedged of total debt facilities 38% 44%
Weighted average hedge maturity 2.6 yrs 2.9 yrs1. 8.5c distribution in August 2015 and August 2016 respectively2. Excludes external non–controlling interests of $43.3 million (FY15: $31.0 million)3. Bank debt minus cash divided by total assets minus cash. If joint venture and fund assets and debt are
consolidated proportionately based on Abacus’ equity interest, look through gearing is 30.3%4. Covenant gearing calculated as Total Liabilities (net of cash) divided by Total Tangible Assets (net of cash)
Balance sheet remains conservative and gearing remains below targeted level despite increased drawn debt
NTA per security grew by 6.8% to $2.66 driven by cap rate compression and stronger earnings performances from a number of investment properties
During the year the Group continued its capital allocation to higher returning investments in storage and development opportunities
August DRP and placement of shortfall securities provided $47 million of additional liquidity
Conservative balance sheet

Abacus Property Group – FY16 Results Presentation 19 August 2016
Investment portfolio –Office and Industrial Peter Strain
World Trade Centre, Melbourne VIC
Abacus Property Group – FY16 Results Presentation 19 August 2016
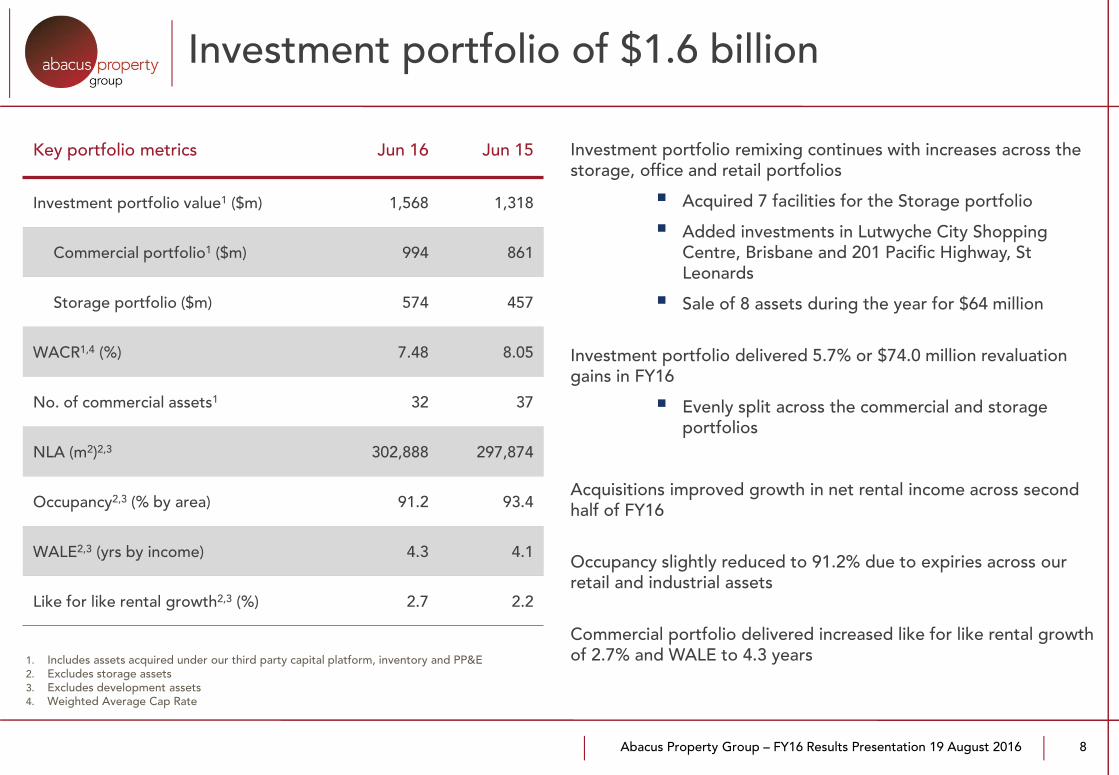
Investment portfolio of $1.6 billion
8
Investment portfolio remixing continues with increases across the storage, office and retail portfolios
Acquired 7 facilities for the Storage portfolio
Added investments in Lutwyche City Shopping Centre, Brisbane and 201 Pacific Highway, St Leonards
Sale of 8 assets during the year for $64 million
Investment portfolio delivered 5.7% or $74.0 million revaluation gains in FY16
Evenly split across the commercial and storage portfolios
Acquisitions improved growth in net rental income across second half of FY16
Occupancy slightly reduced to 91.2% due to expiries across our retail and industrial assets
Commercial portfolio delivered increased like for like rental growth of 2.7% and WALE to 4.3 years
Key portfolio metrics Jun 16 Jun 15
Investment portfolio value1 ($m) 1,568 1,318
Commercial portfolio1 ($m) 994 861
Storage portfolio ($m) 574 457
WACR1,4 (%) 7.48 8.05
No. of commercial assets1 32 37
NLA (m2)2,3 302,888 297,874
Occupancy2,3 (% by area) 91.2 93.4
WALE2,3 (yrs by income) 4.3 4.1
Like for like rental growth2,3 (%) 2.7 2.2
1. Includes assets acquired under our third party capital platform, inventory and PP&E 2. Excludes storage assets3. Excludes development assets4. Weighted Average Cap Rate
Abacus Property Group – FY16 Results Presentation 19 August 2016
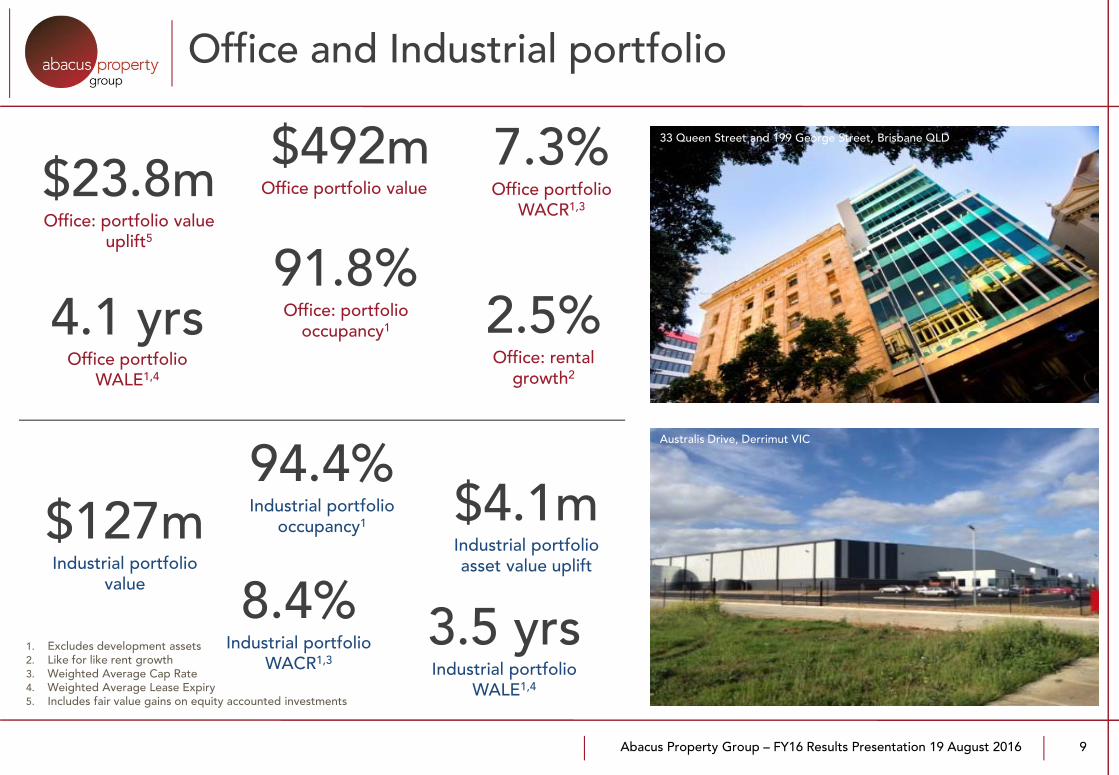
Office and Industrial portfolio
9
$23.8mOffice: portfolio value
uplift5
2.5%Office: rental
growth2
$4.1mIndustrial portfolio asset value uplift
91.8%Office: portfolio
occupancy1
94.4%Industrial portfolio
occupancy1
8.4%Industrial portfolio
WACR1,3
7.3%Office portfolio
WACR1,3
4.1 yrsOffice portfolio
WALE1,4
3.5 yrsIndustrial portfolio
WALE1,4
$127mIndustrial portfolio
value
$492mOffice portfolio value
1. Excludes development assets2. Like for like rent growth3. Weighted Average Cap Rate4. Weighted Average Lease Expiry5. Includes fair value gains on equity accounted investments
Australis Drive, Derrimut VIC
33 Queen Street and 199 George Street, Brisbane QLD
Abacus Property Group – FY16 Results Presentation 19 August 2016
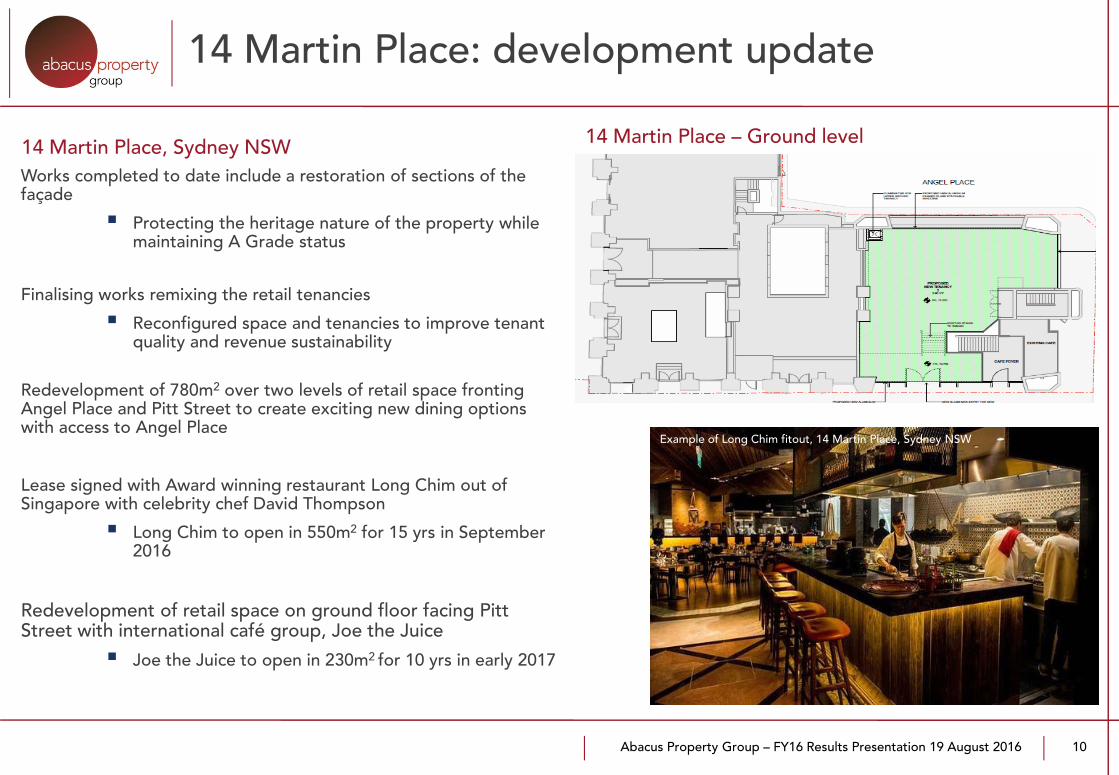
14 Martin Place: development update
10
Works completed to date include a restoration of sections of the façade
Protecting the heritage nature of the property while maintaining A Grade status
Finalising works remixing the retail tenancies
Reconfigured space and tenancies to improve tenant quality and revenue sustainability
Redevelopment of 780m2 over two levels of retail space fronting Angel Place and Pitt Street to create exciting new dining options with access to Angel Place
Lease signed with Award winning restaurant Long Chim out of Singapore with celebrity chef David Thompson
Long Chim to open in 550m2 for 15 yrs in September 2016
Redevelopment of retail space on ground floor facing Pitt Street with international café group, Joe the Juice
Joe the Juice to open in 230m2 for 10 yrs in early 2017
33 Queen Street, Brisbane QLD
14 Martin Place, Sydney NSW 14 Martin Place – Ground level
Example of Long Chim fitout, 14 Martin Place, Sydney NSW
Abacus Property Group – FY16 Results Presentation 19 August 2016
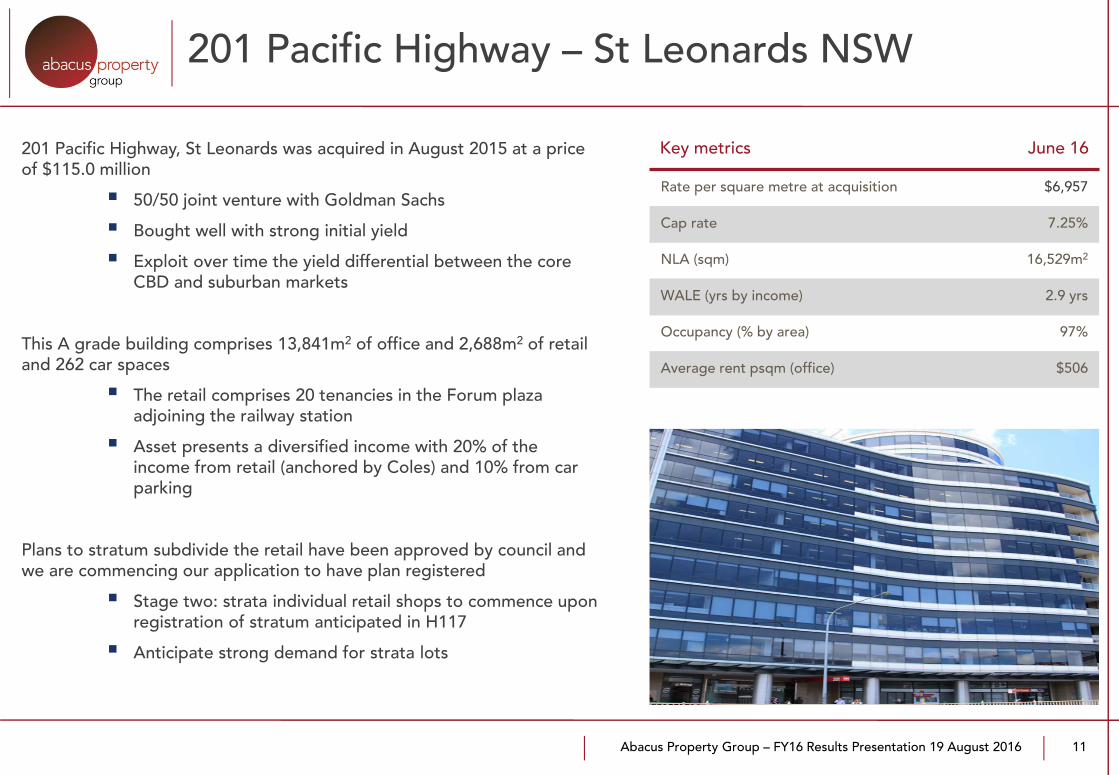
201 Pacific Highway, St Leonards was acquired in August 2015 at a price of $115.0 million
50/50 joint venture with Goldman Sachs
Bought well with strong initial yield
Exploit over time the yield differential between the core CBD and suburban markets
This A grade building comprises 13,841m2 of office and 2,688m2 of retail and 262 car spaces
The retail comprises 20 tenancies in the Forum plaza adjoining the railway station
Asset presents a diversified income with 20% of the income from retail (anchored by Coles) and 10% from car parking
Plans to stratum subdivide the retail have been approved by council and we are commencing our application to have plan registered
Stage two: strata individual retail shops to commence upon registration of stratum anticipated in H117
Anticipate strong demand for strata lots
201 Pacific Highway – St Leonards NSW
11
Key metrics June 16
Rate per square metre at acquisition $6,957
Cap rate 7.25%
NLA (sqm) 16,529m2
WALE (yrs by income) 2.9 yrs
Occupancy (% by area) 97%
Average rent psqm (office) $506

Abacus Property Group – FY16 Results Presentation 19 August 2016Liverpool Plaza, Liverpool, Sydney NSW
Investment portfolio –RetailCameron Laird
Abacus Property Group – FY16 Results Presentation 19 August 2016
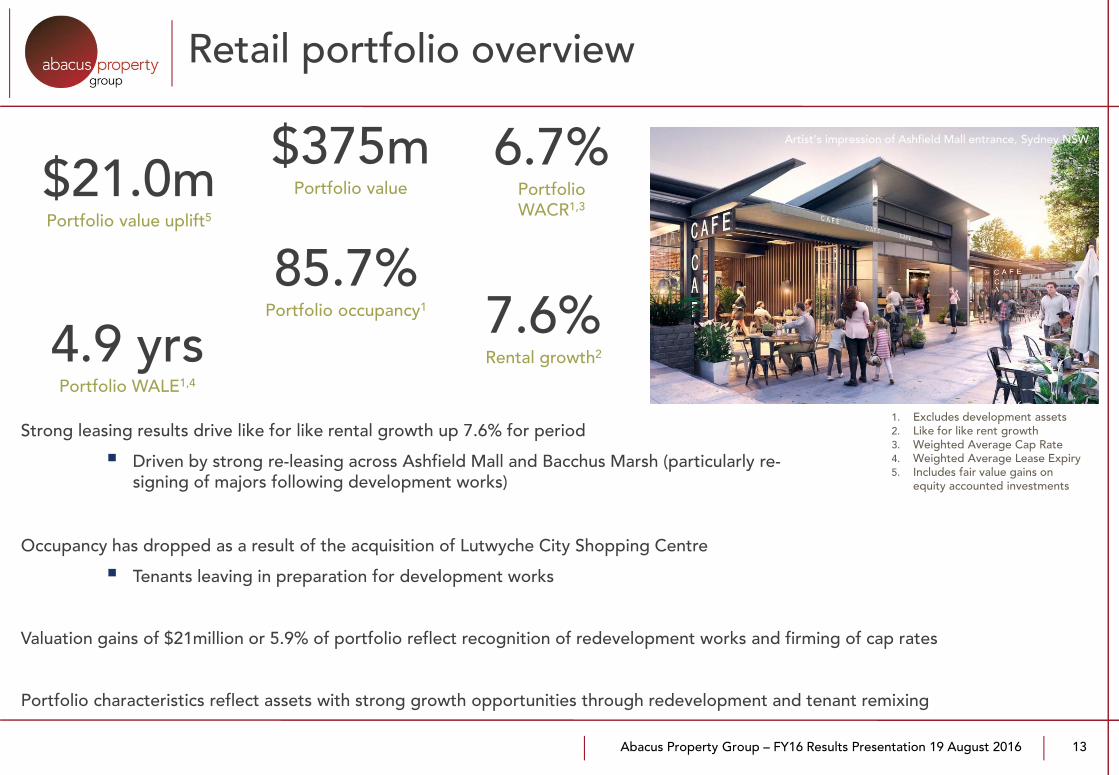
Retail portfolio overview
13
Artist’s impression of Ashfield Mall entrance, Sydney NSW
$21.0mPortfolio value uplift5
7.6%Rental growth2
85.7%Portfolio occupancy1
6.7%Portfolio WACR1,3
4.9 yrsPortfolio WALE1,4
$375mPortfolio value
Strong leasing results drive like for like rental growth up 7.6% for period
Driven by strong re-leasing across Ashfield Mall and Bacchus Marsh (particularly re-signing of majors following development works)
1. Excludes development assets2. Like for like rent growth3. Weighted Average Cap Rate4. Weighted Average Lease Expiry5. Includes fair value gains on
equity accounted investments
Occupancy has dropped as a result of the acquisition of Lutwyche City Shopping Centre
Tenants leaving in preparation for development works
Valuation gains of $21million or 5.9% of portfolio reflect recognition of redevelopment works and firming of cap rates
Portfolio characteristics reflect assets with strong growth opportunities through redevelopment and tenant remixing

Abacus Property Group – FY16 Results Presentation 19 August 2016
Retail portfolio updates
14
Retail Portfolio development pipeline robust with multiple projects
Bacchus Marsh Coles Express service station is due for completion in August 2016
12 year lease @ $240,000pa
Likely to attract strong interest from retail investors at tight yields
Oasis Shopping Centre completed its first two developments during the year
Allianz tenancy for 2,100m2 of NLA added 400m2 of new NLA
New restaurants and CBA tenancies of 650m2 of NLA added 300m2 of new NLA
Town planning approval for alteration and expansion of existing restaurant precinct received for 5 new restaurants. Currently pre-leasing with construction to commence in August 2016
Artist’s impression of restaurant precinct, Oasis Shopping Centre, Broadbeach QLD
Bacchus Marsh Village Shopping Centre, Bacchus VIC
Anytime Fitness
Additional car parking
Coles Express
Bacchus Marsh Village Shopping Centre, Bacchus Marsh VIC

Abacus Property Group – FY16 Results Presentation 19 August 2016
Lutwyche City Shopping Centre – Brisbane QLD
15
Lutwyche City was acquired in August 2015 for $65 million in a joint venture that grew our third party capital platform
Abacus ownership 75%
We have plans to reposition the centre to dominate its Primary Trade Area for the convenience shop
Development planning to identify and maximise all value-add opportunities:
Potential for additional supermarket and improved food / convenience offer
Expanded commercial space
Centre ambience upgrade to positively reposition customer perception
Improve the café and restaurant offer to align with the expanded office space
Introduce paid parking to improve available parking and remove commuters
Centre occupancy will be managed in line with development plans
33 Queen Street, Brisbane QLD
Key metrics June 16
Rate per square metre at acquisition $3,450
Cap rate 7.25%
NLA (sqm) 18,929m2
WALE (yrs by income) 4.8 yrs
Occupancy (% by area) 81%
Average rent psqm $390
Abacus Property Group – FY16 Results Presentation 19 August 2016 16
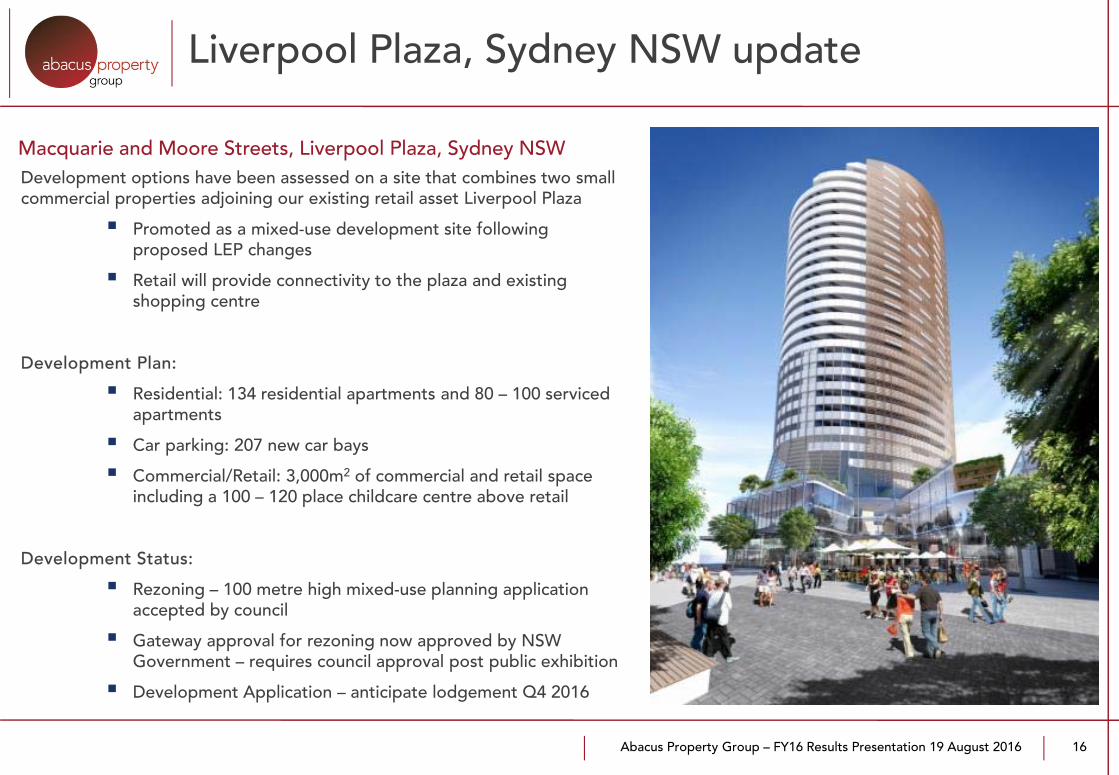
Development options have been assessed on a site that combines two small commercial properties adjoining our existing retail asset Liverpool Plaza
Promoted as a mixed-use development site following proposed LEP changes
Retail will provide connectivity to the plaza and existing shopping centre
Development Plan:
Residential: 134 residential apartments and 80 – 100 serviced apartments
Car parking: 207 new car bays
Commercial/Retail: 3,000m2 of commercial and retail space including a 100 – 120 place childcare centre above retail
Development Status:
Rezoning – 100 metre high mixed-use planning application accepted by council
Gateway approval for rezoning now approved by NSW Government – requires council approval post public exhibition
Development Application – anticipate lodgement Q4 2016
33 Queen Street, Brisbane QLD
Macquarie and Moore Streets, Liverpool Plaza, Sydney NSW
Liverpool Plaza, Sydney NSW update
Abacus Property Group – FY16 Results Presentation 19 August 2016710 Collins Street, Melbourne VIC
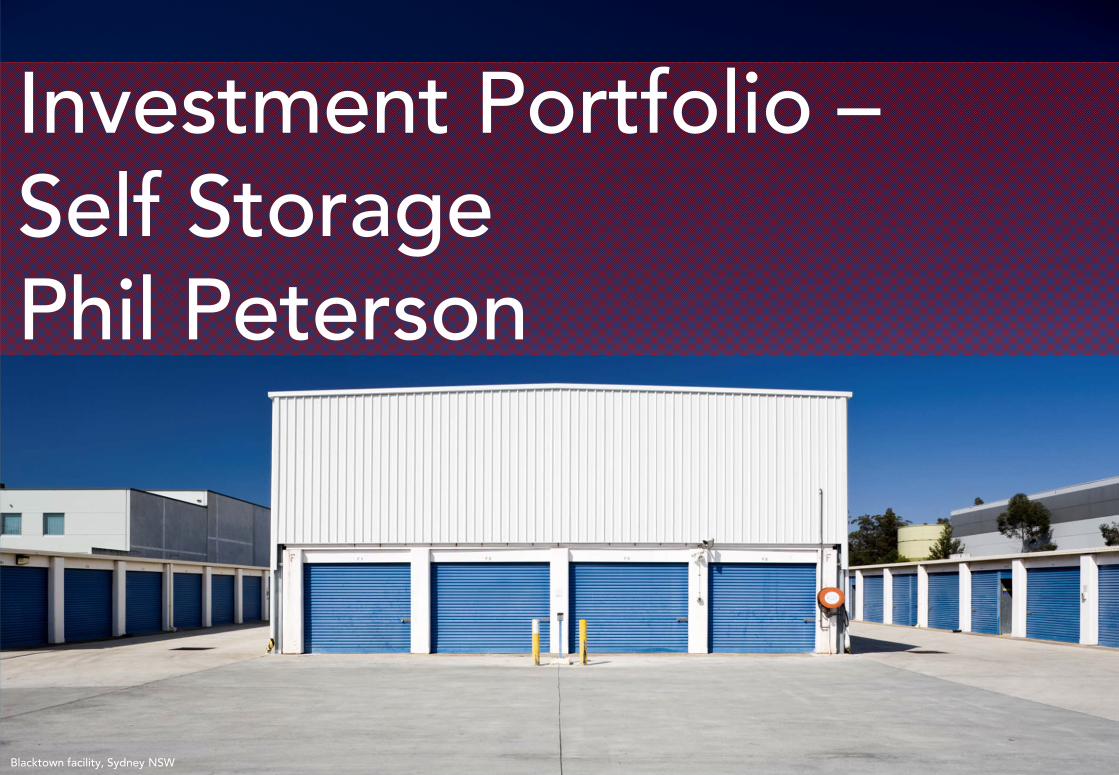
Investment Portfolio –Self StoragePhil Peterson
Blacktown facility, Sydney NSW

Abacus Property Group – FY16 Results Presentation 19 August 2016
Storage: 14.2% growth in portfolio NLA
15.5% increase in underlying EBITDA to $32.7 million in FY16 driven by strong trading and recent acquisitions
12.4% increase in storage rental income
Strong transactional period with 7 assets added to the portfolio
$44.7 million on 4 established facilities
$17.5 million on 3 new conversion opportunities
Established portfolio’s metrics increased further to:
87.4% occupancy up 1.4%
$259m2 rental rate up 1.2%
$227m2 RevPAM up 3.2%
14.2% increase in portfolio NLA during FY16
Optimised RevPAM through balance between occupancy and rental yield levers
1. Includes commercial and industrial properties held for redevelopment2. Average over last 12 months (by area) of established assets3. Adjusted to FY16 FX rate of $1.0489 for comparison purposes4. RevPAM: Revenue per available square metre
Key metrics AUS NZ Jun 16 Jun 15
Portfolio value ($m) 455.7 118.7 574.4 457.2
No. of storage assets 501 12 62 54
WACR 7.9% 8.2% 8.0% 8.6%
NLA1 (m2) 230,000 60,000 290,000 254,000
Land (m2) 375,000 105,000 480,000 434,000
Occupancy2 86.7% 89.6% 87.4% 86.0%
Average rental rate2, $psm $259 NZ$272 $259 $2563
RevPAM4 (per available m2)2 $225 NZ$244 $227 $2203
18
Storage portfolio: $574 million
Stage 1 completed, Stage 2 being prepared for conversion Wodonga facility, VIC
Abacus Property Group – FY16 Results Presentation 19 August 2016 19
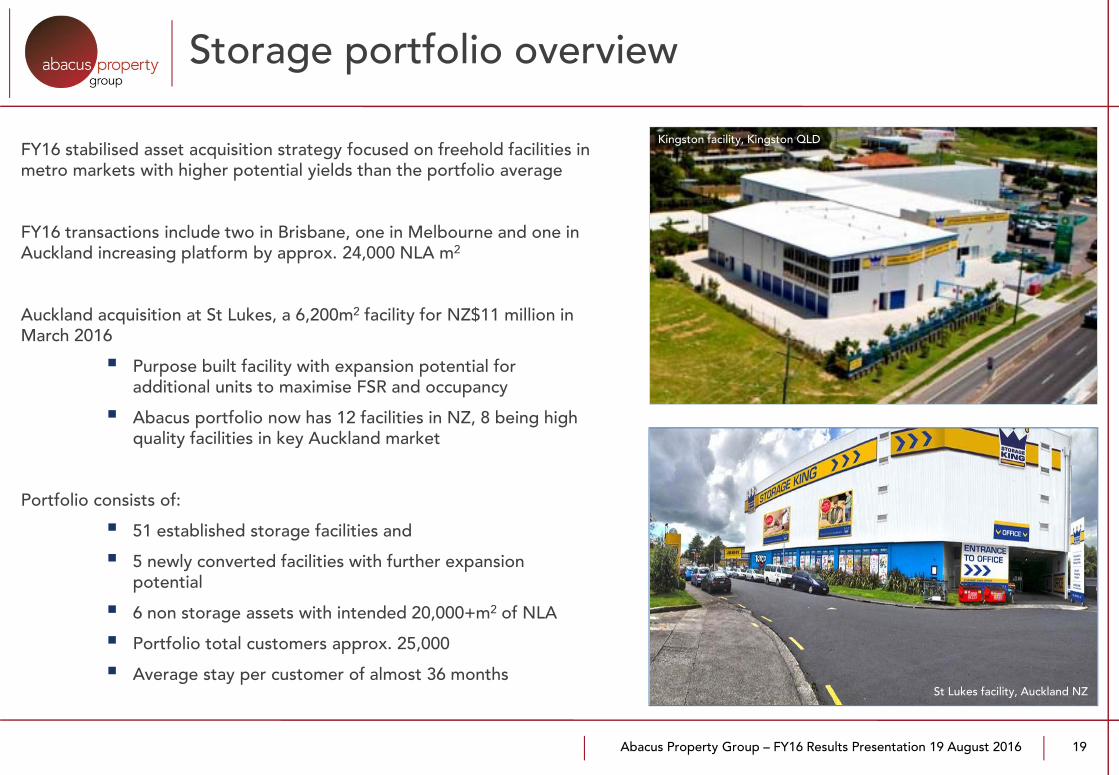
Storage portfolio overview
FY16 stabilised asset acquisition strategy focused on freehold facilities in metro markets with higher potential yields than the portfolio average
FY16 transactions include two in Brisbane, one in Melbourne and one in Auckland increasing platform by approx. 24,000 NLA m2
Auckland acquisition at St Lukes, a 6,200m2 facility for NZ$11 million in March 2016
Purpose built facility with expansion potential for additional units to maximise FSR and occupancy
Abacus portfolio now has 12 facilities in NZ, 8 being high quality facilities in key Auckland market
Portfolio consists of:
51 established storage facilities and
5 newly converted facilities with further expansion potential
6 non storage assets with intended 20,000+m2 of NLA
Portfolio total customers approx. 25,000
Average stay per customer of almost 36 monthsSt Lukes facility, Auckland NZ
Kingston facility, Kingston QLD
Abacus Property Group – FY16 Results Presentation 19 August 2016
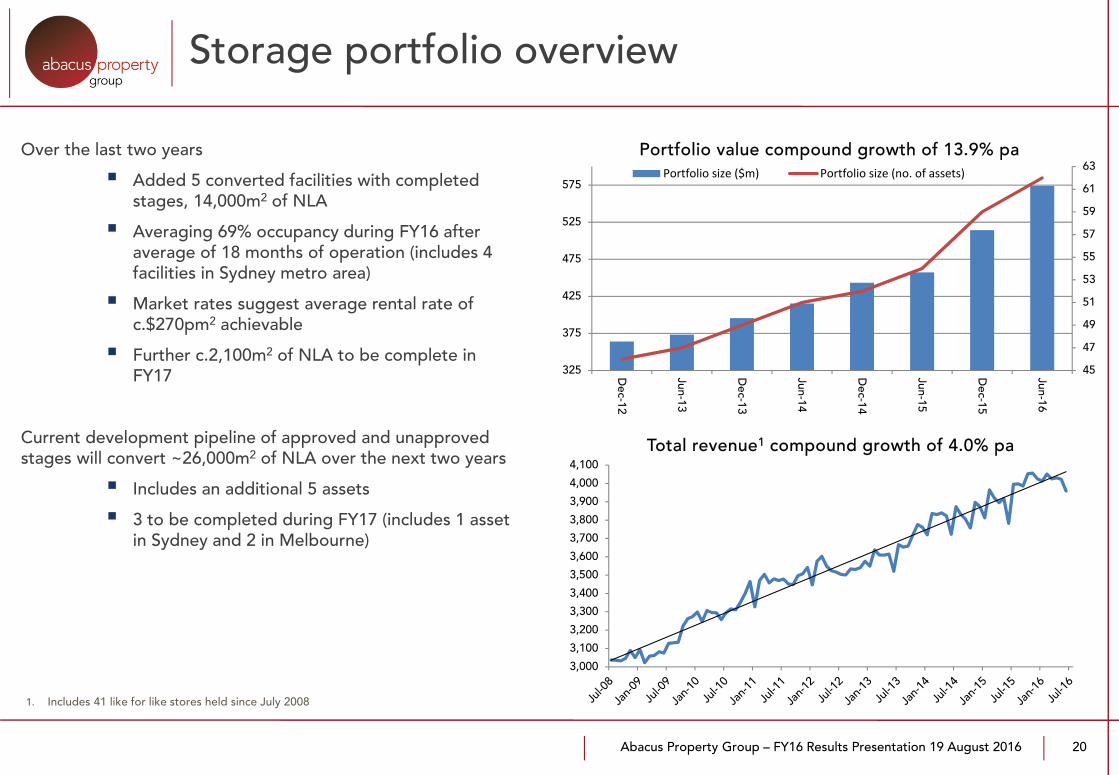
Over the last two years
Added 5 converted facilities with completed stages, 14,000m2 of NLA
Averaging 69% occupancy during FY16 after average of 18 months of operation (includes 4 facilities in Sydney metro area)
Market rates suggest average rental rate of c.$270pm2 achievable
Further c.2,100m2 of NLA to be complete in FY17
Current development pipeline of approved and unapproved stages will convert ~26,000m2 of NLA over the next two years
Includes an additional 5 assets
3 to be completed during FY17 (includes 1 asset in Sydney and 2 in Melbourne)
Storage portfolio overview
3,000
3,100
3,200
3,300
3,400
3,500
3,600
3,700
3,800
3,900
4,000
4,100Total revenue1 compound growth of 4.0% pa
45
47
49
51
53
55
57
59
61
63
325
375
425
475
525
575
Dec-12
Jun-13
Dec-13
Jun-14
Dec-14
Jun-15
Dec-15
Jun-16
Portfolio value compound growth of 13.9% pa Portfolio size ($m) Portfolio size (no. of assets)
1. Includes 41 like for like stores held since July 2008
20
Abacus Property Group – FY16 Results Presentation 19 August 2016
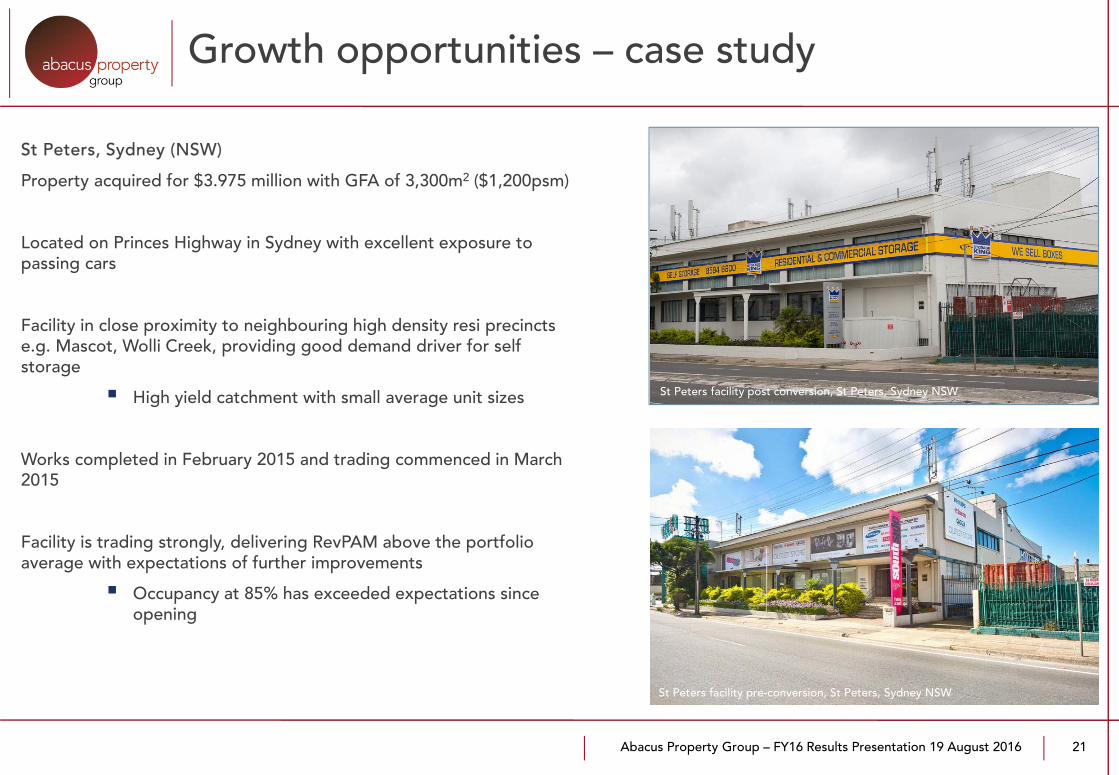
St Peters, Sydney (NSW)
Property acquired for $3.975 million with GFA of 3,300m2 ($1,200psm)
Located on Princes Highway in Sydney with excellent exposure to passing cars
Facility in close proximity to neighbouring high density resi precincts e.g. Mascot, Wolli Creek, providing good demand driver for self storage
High yield catchment with small average unit sizes
Works completed in February 2015 and trading commenced in March 2015
Facility is trading strongly, delivering RevPAM above the portfolio average with expectations of further improvements
Occupancy at 85% has exceeded expectations since opening
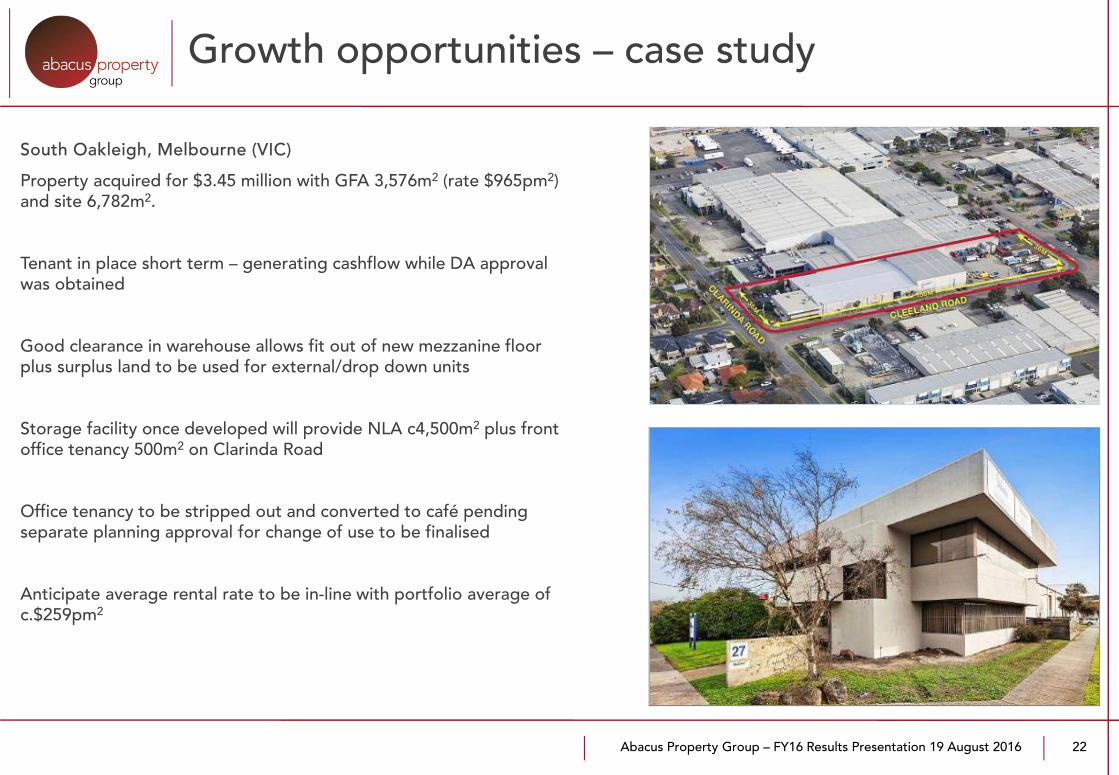
Growth opportunities – case study
21
St Peters facility post conversion, St Peters, Sydney NSW
St Peters facility pre-conversion, St Peters, Sydney NSW
Abacus Property Group – FY16 Results Presentation 19 August 2016
South Oakleigh, Melbourne (VIC)
Property acquired for $3.45 million with GFA 3,576m2 (rate $965pm2) and site 6,782m2.
Tenant in place short term – generating cashflow while DA approval was obtained
Good clearance in warehouse allows fit out of new mezzanine floor plus surplus land to be used for external/drop down units
Storage facility once developed will provide NLA c4,500m2 plus front office tenancy 500m2 on Clarinda Road
Office tenancy to be stripped out and converted to café pending separate planning approval for change of use to be finalised
Anticipate average rental rate to be in-line with portfolio average of c.$259pm2
Growth opportunities – case study
22
Abacus Property Group – FY16 Results Presentation 19 August 2016
Property ventures overviewCameron Laird &John L’Estrange
Artist’s impression of One A residential development, Erskineville, Sydney NSW
Abacus Property Group – FY16 Results Presentation 19 August 2016
Property ventures
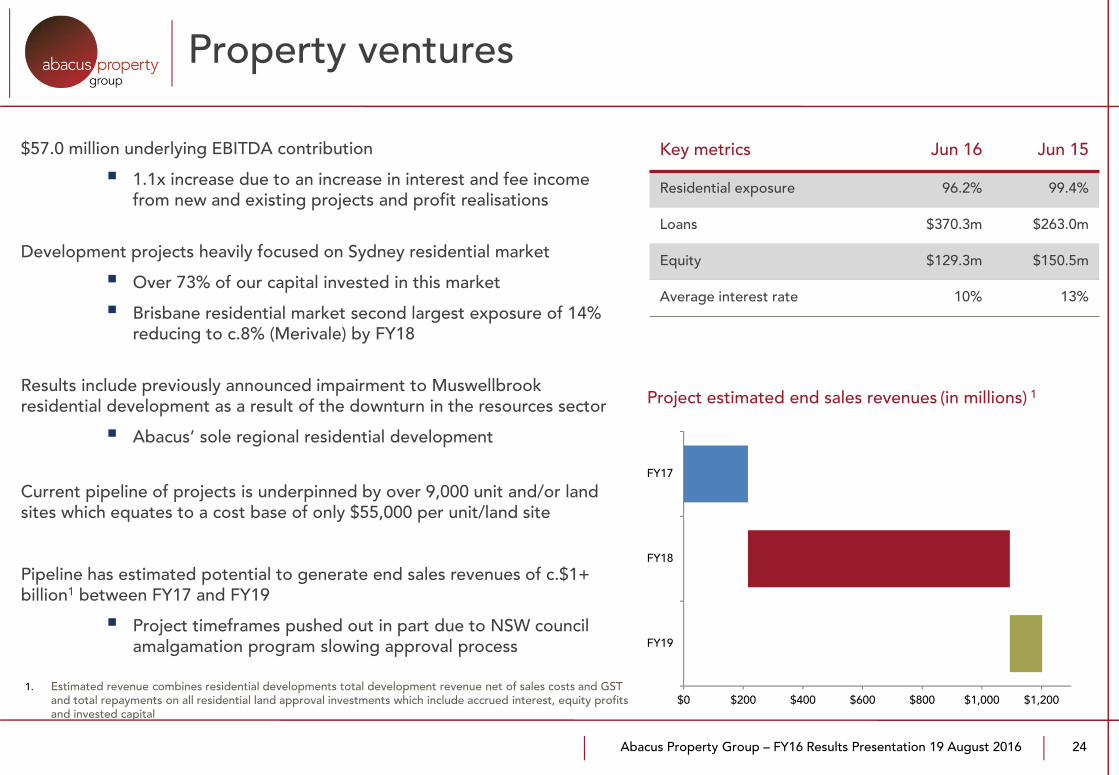
$57.0 million underlying EBITDA contribution
1.1x increase due to an increase in interest and fee income from new and existing projects and profit realisations
Development projects heavily focused on Sydney residential market
Over 73% of our capital invested in this market
Brisbane residential market second largest exposure of 14% reducing to c.8% (Merivale) by FY18
Results include previously announced impairment to Muswellbrook residential development as a result of the downturn in the resources sector
Abacus’ sole regional residential development
Current pipeline of projects is underpinned by over 9,000 unit and/or land sites which equates to a cost base of only $55,000 per unit/land site
Pipeline has estimated potential to generate end sales revenues of c.$1+ billion1 between FY17 and FY19
Project timeframes pushed out in part due to NSW council amalgamation program slowing approval process
Key metrics Jun 16 Jun 15
Residential exposure 96.2% 99.4%
Loans $370.3m $263.0m
Equity $129.3m $150.5m
Average interest rate 10% 13%
24
Project estimated end sales revenues (in millions) 1
$0 $200 $400 $600 $800 $1,000 $1,200
FY19
FY18
FY17
1. Estimated revenue combines residential developments total development revenue net of sales costs and GST and total repayments on all residential land approval investments which include accrued interest, equity profits and invested capital
Abacus Property Group – FY16 Results Presentation 19 August 2016 25
Residential pipeline – developments
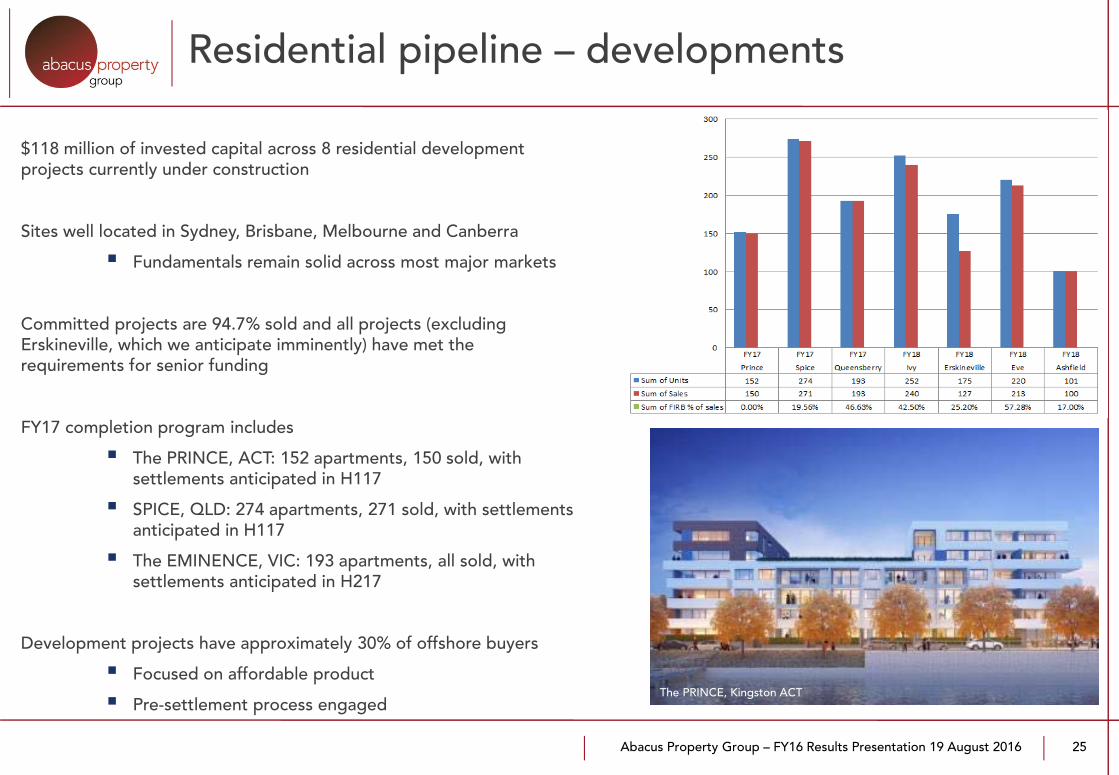
$118 million of invested capital across 8 residential development projects currently under construction
Sites well located in Sydney, Brisbane, Melbourne and Canberra
Fundamentals remain solid across most major markets
Committed projects are 94.7% sold and all projects (excluding Erskineville, which we anticipate imminently) have met the requirements for senior funding
FY17 completion program includes
The PRINCE, ACT: 152 apartments, 150 sold, with settlements anticipated in H117
SPICE, QLD: 274 apartments, 271 sold, with settlements anticipated in H117
The EMINENCE, VIC: 193 apartments, all sold, with settlements anticipated in H217
Development projects have approximately 30% of offshore buyers
Focused on affordable product
Pre-settlement process engaged
Doncaster, Melbourne VIC
The PRINCE, Kingston ACT
Abacus Property Group – FY16 Results Presentation 19 August 2016 26
Residential pipeline – land approvals
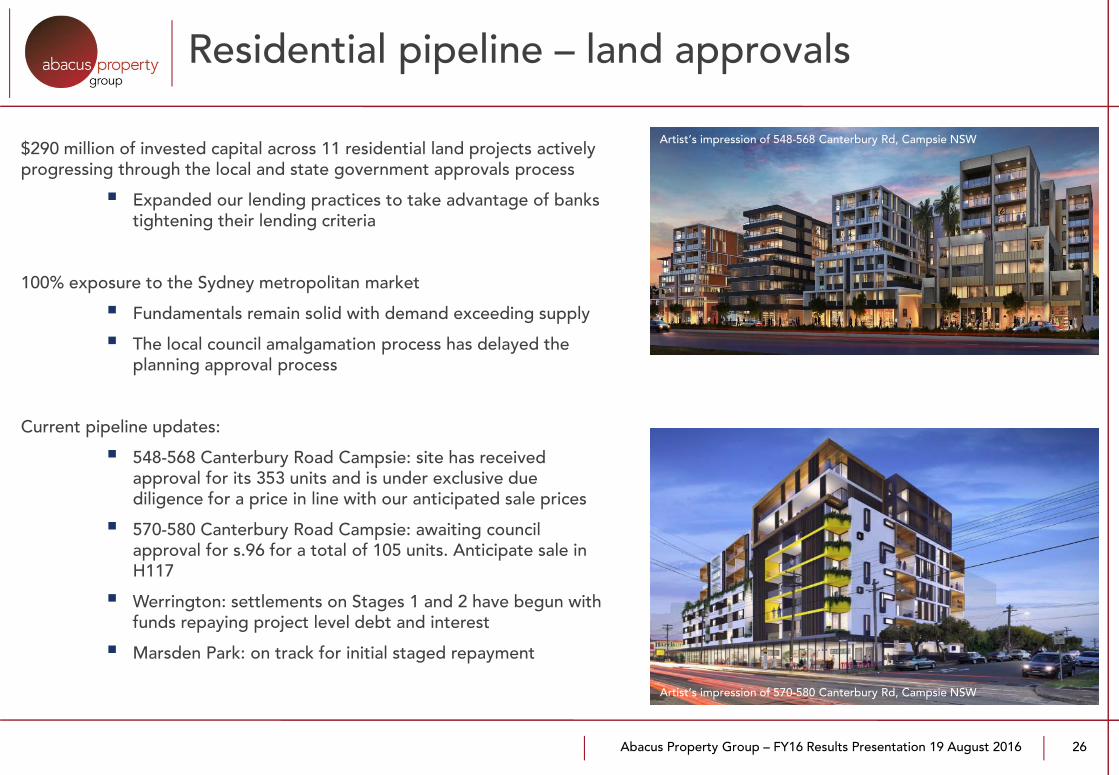
$290 million of invested capital across 11 residential land projects actively progressing through the local and state government approvals process
Expanded our lending practices to take advantage of banks tightening their lending criteria
100% exposure to the Sydney metropolitan market
Fundamentals remain solid with demand exceeding supply
The local council amalgamation process has delayed the planning approval process
Current pipeline updates:
548-568 Canterbury Road Campsie: site has received approval for its 353 units and is under exclusive due diligence for a price in line with our anticipated sale prices
570-580 Canterbury Road Campsie: awaiting council approval for s.96 for a total of 105 units. Anticipate sale in H117
Werrington: settlements on Stages 1 and 2 have begun with funds repaying project level debt and interest
Marsden Park: on track for initial staged repayment
Artist’s impression of 548-568 Canterbury Rd, Campsie NSW
Artist’s impression of 570-580 Canterbury Rd, Campsie NSW
Abacus Property Group – FY16 Results Presentation 19 August 2016 27
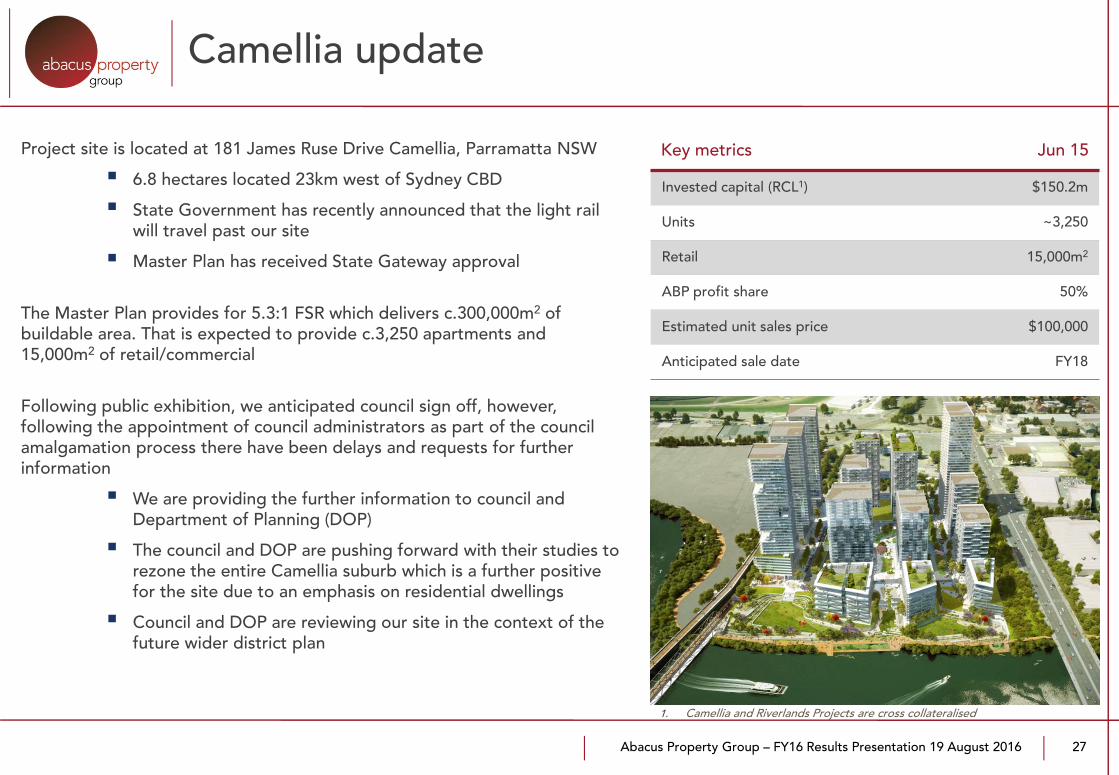
Camellia update
Key metrics Jun 15
Invested capital (RCL1) $150.2m
Units ~3,250
Retail 15,000m2
ABP profit share 50%
Estimated unit sales price $100,000
Anticipated sale date FY18
Project site is located at 181 James Ruse Drive Camellia, Parramatta NSW
6.8 hectares located 23km west of Sydney CBD
State Government has recently announced that the light rail will travel past our site
Master Plan has received State Gateway approval
The Master Plan provides for 5.3:1 FSR which delivers c.300,000m2 of buildable area. That is expected to provide c.3,250 apartments and 15,000m2 of retail/commercial
Following public exhibition, we anticipated council sign off, however, following the appointment of council administrators as part of the council amalgamation process there have been delays and requests for further information
We are providing the further information to council and Department of Planning (DOP)
The council and DOP are pushing forward with their studies to rezone the entire Camellia suburb which is a further positive for the site due to an emphasis on residential dwellings
Council and DOP are reviewing our site in the context of the future wider district plan
1. Camellia and Riverlands Projects are cross collateralised
Abacus Property Group – FY16 Results Presentation 19 August 2016
Funds management overview
Westpac House, Adelaide SA 50% owned by ADIF II

Abacus Property Group – FY16 Results Presentation 19 August 2016
Funds management
29
$10.7 million underlying EBITDA contribution for the twelve month period
$146 million of fund investments
Each fund independent despite accounting consolidation
ADIF II continues to realise assets. During the year seven assets were sold for $39.1 million. Proceeds were used to repay debt. The Fund has 6 properties remaining and these are expected to be sold in the current financial year
AHF: In March 2016, AHF sold the Rydges Tradewinds for $34 million and this settled in July 2016. The remaining two hotels are expected to be sold in the current financial year
Wodonga Fund: Residential land lots continue to sell well with 107 lots sold over the year at an average price of $123,000, a 6% price increase on the prior corresponding period. At the current time there are 154 lots available for sale of which 97 have been pre sold. The site has capacity for a further 202 residential lots as at 30 June 2016

Abacus Property Group – FY16 Results Presentation 19 August 2016
Capital partnering since 2010 Sector Price1, A$ Asset Level IRR
Birkenhead Point, Drummoyne VIC Retail 174,000,000 24%
350 George Street, Sydney NSW Office/Retail 27,000,000
4 & 14 Martin Place, Sydney NSW Office/Retail 153,500,000
32 Walker Street, North Sydney NSW Office 35,600,000
484 St Kilda Road, St Kilda VIC Office 68,000,000 25%
309 George Street, Sydney NSW Office/Retail 68,750,000 17%
180 Queen Street, Brisbane QLD Office/Retail 29,500,000
35 Boundary Street, Brisbane QLD Office 40,250,000
Wharf 10, Sydney NSW Office 31,800,000 27%
World Trade Centre, Melbourne VIC Office/Retail 120,400,000
Oasis Shopping Centre, Gold Coast QLD Retail 103,500,000
201 Pacific Highway, St Leonards NSW Office/Retail 115,000,000
Lutwyche City Shopping Centre, Brisbane QLD Retail 65,000,000
Merivale development, South Brisbane QLD Residential development 275,000,000
Red Cross Building, Sydney NSW Office 112,900,000
Total 1,420,200,000
Third party capital partnering program
Business has evolved across changing market cycles with over $1.4 billion invested with our investment partners
We have expanded our product offering to meet the requirements of our partners
Expanding our revenue sources with fee based, capital light mandates and funds
30
1. Represents the acquisition price for commercial properties or the total estimated sales revenue from residential developments
Abacus Property Group – FY16 Results Presentation 19 August 2016710 Collins Street, Melbourne VIC
Summary and outlook
Abacus Property Group – FY16 Results Presentation 19 August 2016
Summary and outlook
32
We are pleased to deliver another strong underlying profit result
Securityholder distributions are secure and predictable
100% of distributions covered by recurring earnings
Payout ratio of 76% of underlying profit
The business outlook remains positive with a strong balance sheet of opportunities
The diversified nature of our multi-business model means we are well positioned at this stage in the cycle
We aim to continue to grow our positions in the storage sector and our third party capital platform
Expanding our investment relations and product offering
Despite the disappointing delays to the residential development approval process in Sydney as a result of the council amalgamation program, we are confident these timing delays will not ultimately impact our anticipated returns
Our exposure to residential development will reduce over the next 12-18 months as projects are completed and realised
73% exposure to the Sydney residential market
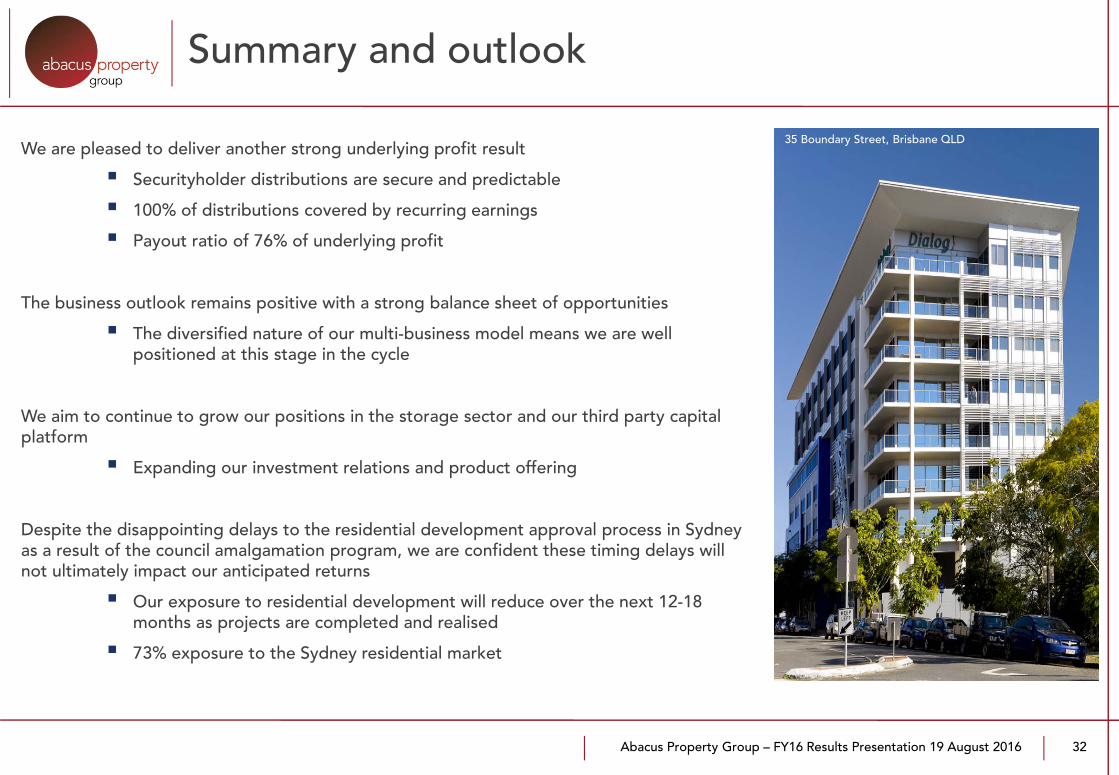
35 Boundary Street, Brisbane QLD
Abacus Property Group – FY16 Results Presentation 19 August 2016
Disclaimer
33
The information provided in this document is general, and may not be suitable for the specific purposes of any user of this document. It is not financial advice or a recommendation to acquire Abacus Property Group securities (ASX: ABP). Abacus Property Group believes that the information in this document is correct (although not complete or comprehensive) and does not make any specific representations regarding its suitability for any purpose. Users of this document should obtain independent professional advice before relying on this document as the basis for making any investment decision and should also refer to Abacus Property Group’s financial statements lodged with the ASX for the period to which this document relates. This document contains non-AIFRS financial information that Abacus Property Group uses to assess performance and distribution levels. That information is calculated in accordance with the AICD/Finsia principles and is not audited.
Any forecasts or other forward looking statements contained in this presentation are based on assumptions concerning future events and market conditions. Actual results may vary from forecasts and any variations may be materially positive or negative.
The information in this document is current only as at the date of this document, and that information may not be updated to reflect subsequent changes.
To the extent permitted by law, the members of Abacus Property Group and those officers responsible for the preparation of this document disclaim all responsibility for damages and loss incurred by users of this document as a result of the content of,or any errors or omissions in, this document.
Abacus Property Group:
Abacus Group Holdings Limited ACN: 080 604 619
Abacus Group Projects Limited ACN: 104 066 104
Abacus Funds Management Limited ACN: 007 415 590 AFSL No. 227819
Abacus Storage Funds Management Limited ACN: 109 324 834 AFSL No. 277357
Abacus Storage Operations Limited ACN: 112 457 075
Abacus Property Group – FY16 Results Presentation 19 August 2016
FY16Annual ResultsAppendices
Ashfield Mall residential development, Sydney NSW
Abacus Property Group – FY16 Results Presentation 19 August 2016
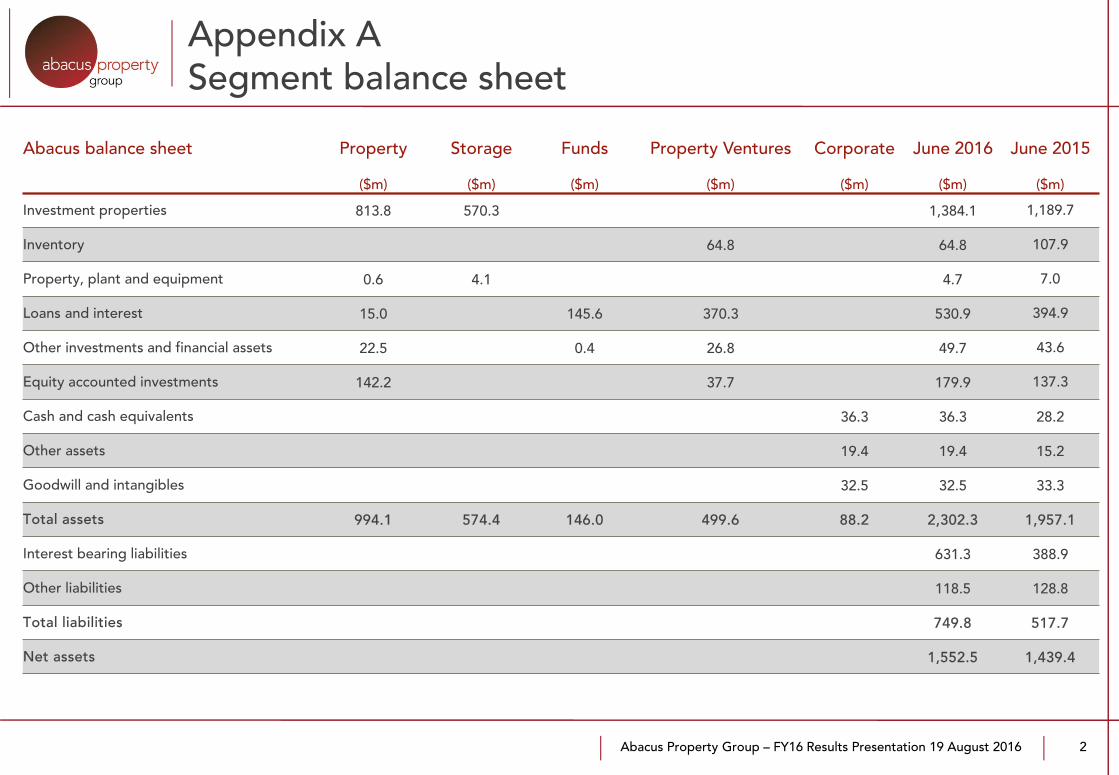
Appendix ASegment balance sheet
2
Abacus balance sheet Property Storage Funds Property Ventures Corporate June 2016 June 2015
($m) ($m) ($m) ($m) ($m) ($m) ($m)
Investment properties 813.8 570.3 1,384.1 1,189.7
Inventory 64.8 64.8 107.9
Property, plant and equipment 0.6 4.1 4.7 7.0
Loans and interest 15.0 145.6 370.3 530.9 394.9
Other investments and financial assets 22.5 0.4 26.8 49.7 43.6
Equity accounted investments 142.2 37.7 179.9 137.3
Cash and cash equivalents 36.3 36.3 28.2
Other assets 19.4 19.4 15.2
Goodwill and intangibles 32.5 32.5 33.3
Total assets 994.1 574.4 146.0 499.6 88.2 2,302.3 1,957.1
Interest bearing liabilities 631.3 388.9
Other liabilities 118.5 128.8
Total liabilities 749.8 517.7
Net assets 1,552.5 1,439.4
Abacus Property Group – FY16 Results Presentation 19 August 2016
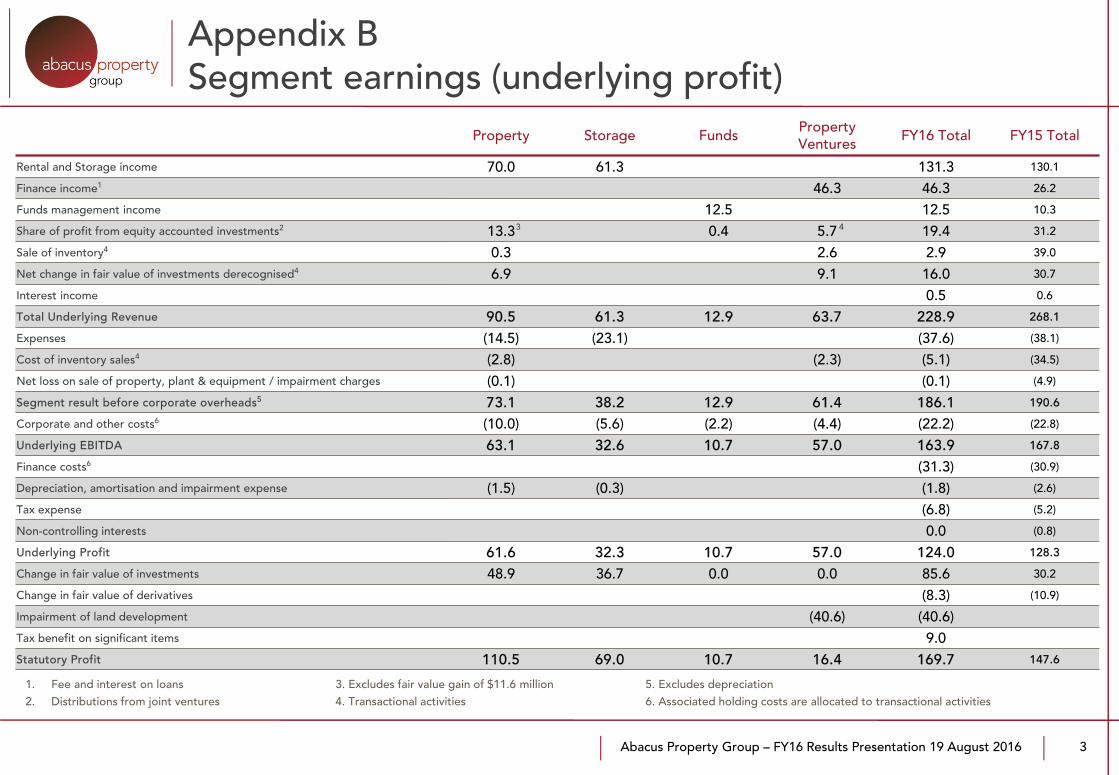
Property Storage Funds Property Ventures FY16 Total FY15 Total
Rental and Storage income 70.0 61.3 131.3 130.1
Finance income1 46.3 46.3 26.2
Funds management income 12.5 12.5 10.3
Share of profit from equity accounted investments2 13.3 0.4 5.7 19.4 31.2
Sale of inventory4 0.3 2.6 2.9 39.0
Net change in fair value of investments derecognised4 6.9 9.1 16.0 30.7
Interest income 0.5 0.6
Total Underlying Revenue 90.5 61.3 12.9 63.7 228.9 268.1
Expenses (14.5) (23.1) (37.6) (38.1)
Cost of inventory sales4 (2.8) (2.3) (5.1) (34.5)
Net loss on sale of property, plant & equipment / impairment charges (0.1) (0.1) (4.9)
Segment result before corporate overheads5 73.1 38.2 12.9 61.4 186.1 190.6
Corporate and other costs6 (10.0) (5.6) (2.2) (4.4) (22.2) (22.8)
Underlying EBITDA 63.1 32.6 10.7 57.0 163.9 167.8
Finance costs6 (31.3) (30.9)
Depreciation, amortisation and impairment expense (1.5) (0.3) (1.8) (2.6)
Tax expense (6.8) (5.2)
Non-controlling interests 0.0 (0.8)
Underlying Profit 61.6 32.3 10.7 57.0 124.0 128.3
Change in fair value of investments 48.9 36.7 0.0 0.0 85.6 30.2
Change in fair value of derivatives (8.3) (10.9)
Impairment of land development (40.6) (40.6)Tax benefit on significant items 9.0Statutory Profit 110.5 69.0 10.7 16.4 169.7 147.6
Appendix BSegment earnings (underlying profit)
3
1. Fee and interest on loans 3. Excludes fair value gain of $11.6 million 5. Excludes depreciation2. Distributions from joint ventures 4. Transactional activities 6. Associated holding costs are allocated to transactional activities
3 4

Abacus Property Group – FY16 Results Presentation 19 August 2016
Appendix CNet tangible asset reconciliation
4
30 June 2016 30 June 2015
Consolidated Group net assets 1,559.3 1,438.1
Less
Total external non–controlling interest (43.3) (31.0)
Total stapled security holders’ interest in equity 1,516.0 1,407.1
Less
Intangible assets and goodwill (32.5) (33.3)
Deferred tax assets/liabilities (net) (3.5) 3.9
Total net tangible assets 1,480.0 1,377.7
Securities on issue 556.6 553.2
Net tangible assets per security 2.66 2.49
Abacus Property Group – FY16 Results Presentation 19 August 2016
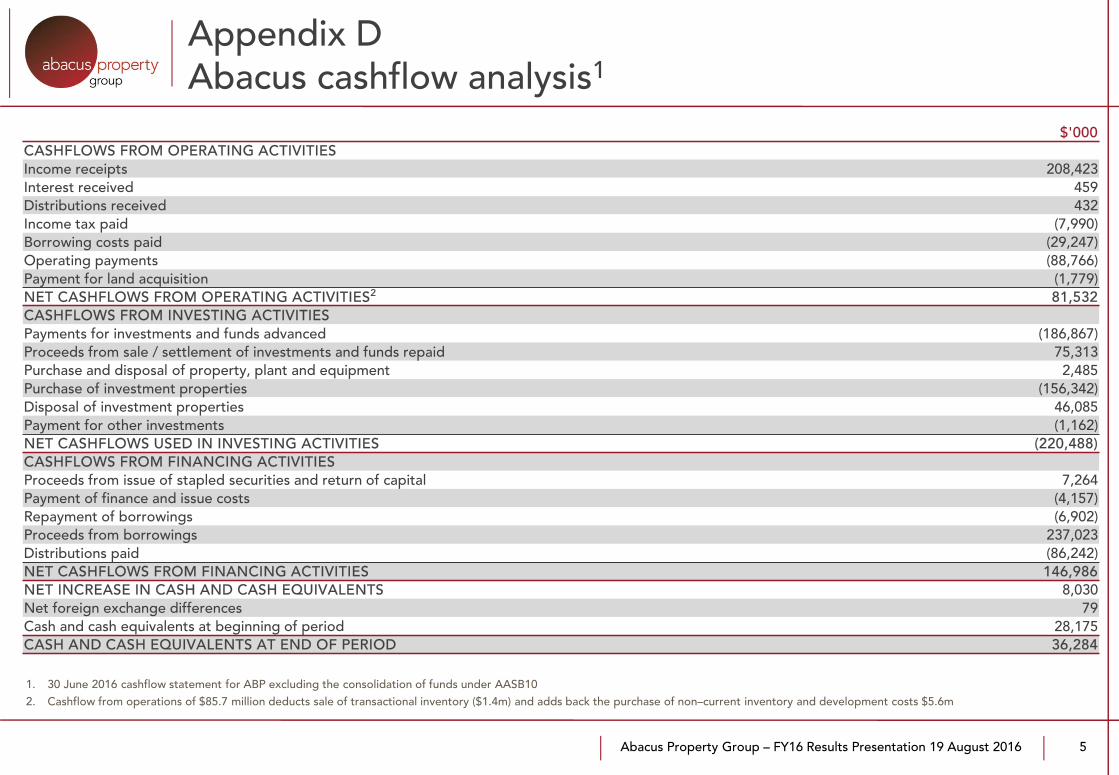
Appendix DAbacus cashflow analysis1
5
1. 30 June 2016 cashflow statement for ABP excluding the consolidation of funds under AASB102. Cashflow from operations of $85.7 million deducts sale of transactional inventory ($1.4m) and adds back the purchase of non–current inventory and development costs $5.6m
$'000 CASHFLOWS FROM OPERATING ACTIVITIESIncome receipts 208,423Interest received 459 Distributions received 432 Income tax paid (7,990)Borrowing costs paid (29,247)Operating payments (88,766)Payment for land acquisition (1,779)NET CASHFLOWS FROM OPERATING ACTIVITIES2 81,532CASHFLOWS FROM INVESTING ACTIVITIESPayments for investments and funds advanced (186,867) Proceeds from sale / settlement of investments and funds repaid 75,313 Purchase and disposal of property, plant and equipment 2,485Purchase of investment properties (156,342)Disposal of investment properties 46,085Payment for other investments (1,162)NET CASHFLOWS USED IN INVESTING ACTIVITIES (220,488)CASHFLOWS FROM FINANCING ACTIVITIESProceeds from issue of stapled securities and return of capital 7,264Payment of finance and issue costs (4,157)Repayment of borrowings (6,902)Proceeds from borrowings 237,023Distributions paid (86,242)NET CASHFLOWS FROM FINANCING ACTIVITIES 146,986NET INCREASE IN CASH AND CASH EQUIVALENTS 8,030Net foreign exchange differences 79Cash and cash equivalents at beginning of period 28,175CASH AND CASH EQUIVALENTS AT END OF PERIOD 36,284
Abacus Property Group – FY16 Results Presentation 19 August 2016
Appendix EDebt facilities
6
1. Abacus max target group gearing of up to 35%2. Includes joint venture and fund assets and debt consolidated proportionately with Abacus’ equity interest
Capital management metrics June 2016 June 2015
Total debt facilities $873m $770m
Total debt drawn $629m $388m
Term to maturity 3.5 yrs 4.3 yrs
% hedged 53% 88%
Weighted average hedge maturity 2.7 yrs 2.9 yrs
Average cost of debt – drawn 5.4% 6.1%
Group gearing1 25.8% 18.2%
Look through gearing2 30.3% 22.6%
Covenant gearing 29.5% 22.8%
Covenant gearing limit 50.0% 50.0%
Interest Coverage Ratio 4.2x 5.1x
Interest Coverage Ratio covenant 2.0x 2.0x
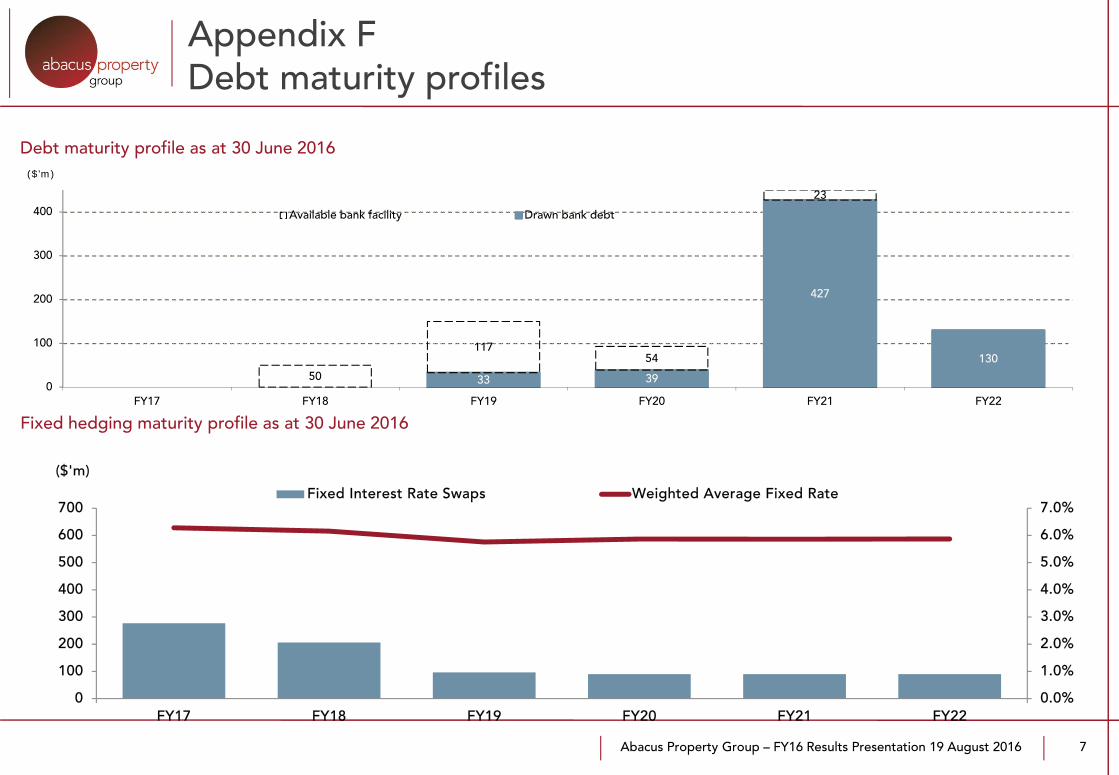
Abacus Property Group – FY16 Results Presentation 19 August 2016 7
Fixed hedging maturity profile as at 30 June 2016
33 39
427
130
50
11754
23
0
100
200
300
400
FY17 FY18 FY19 FY20 FY21 FY22
($’m)
Available bank facility Drawn bank debt
Debt maturity profile as at 30 June 2016
Appendix FDebt maturity profiles
0.0%
1.0%
2.0%
3.0%
4.0%
5.0%
6.0%
7.0%
0
100
200
300
400
500
600
700
FY17 FY18 FY19 FY20 FY21 FY22
($'m)
Fixed Interest Rate Swaps Weighted Average Fixed Rate
Abacus Property Group – FY16 Results Presentation 19 August 2016
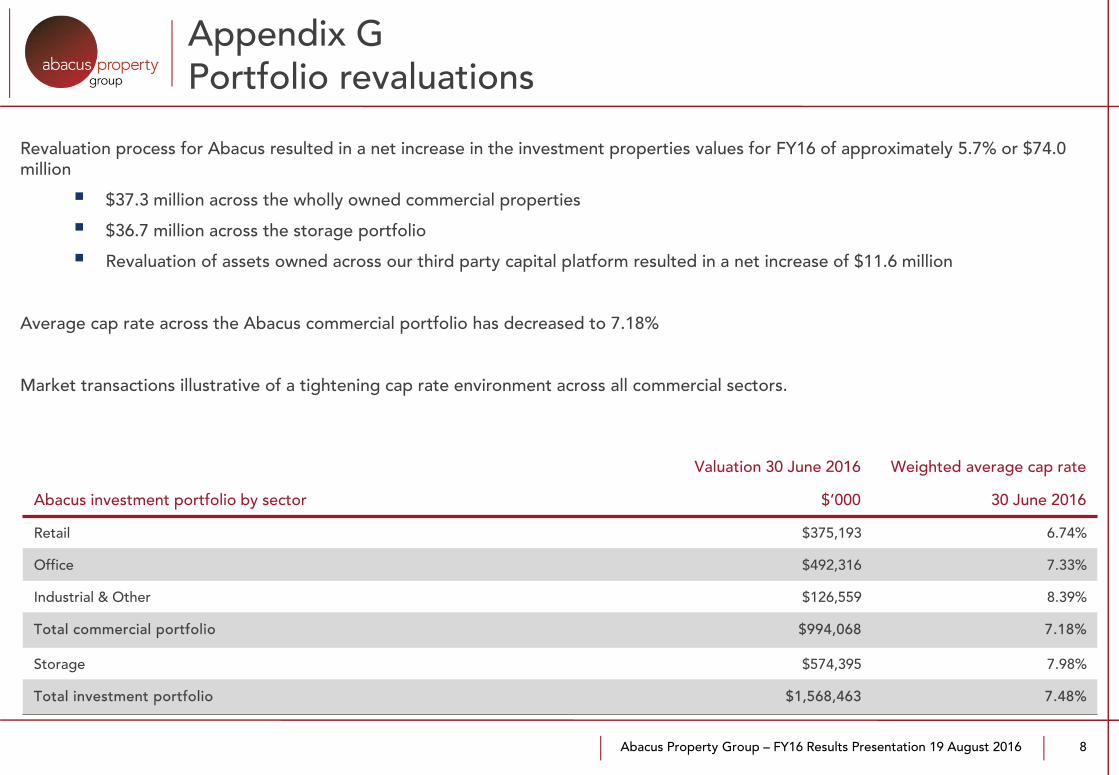
Appendix GPortfolio revaluations
8
Abacus investment portfolio by sector
Valuation 30 June 2016
$’000
Weighted average cap rate
30 June 2016
Retail $375,193 6.74%
Office $492,316 7.33%
Industrial & Other $126,559 8.39%
Total commercial portfolio $994,068 7.18%
Storage $574,395 7.98%
Total investment portfolio $1,568,463 7.48%
Revaluation process for Abacus resulted in a net increase in the investment properties values for FY16 of approximately 5.7% or $74.0 million
$37.3 million across the wholly owned commercial properties
$36.7 million across the storage portfolio
Revaluation of assets owned across our third party capital platform resulted in a net increase of $11.6 million
Average cap rate across the Abacus commercial portfolio has decreased to 7.18%
Market transactions illustrative of a tightening cap rate environment across all commercial sectors.

Abacus Property Group – FY16 Results Presentation 19 August 2016 9
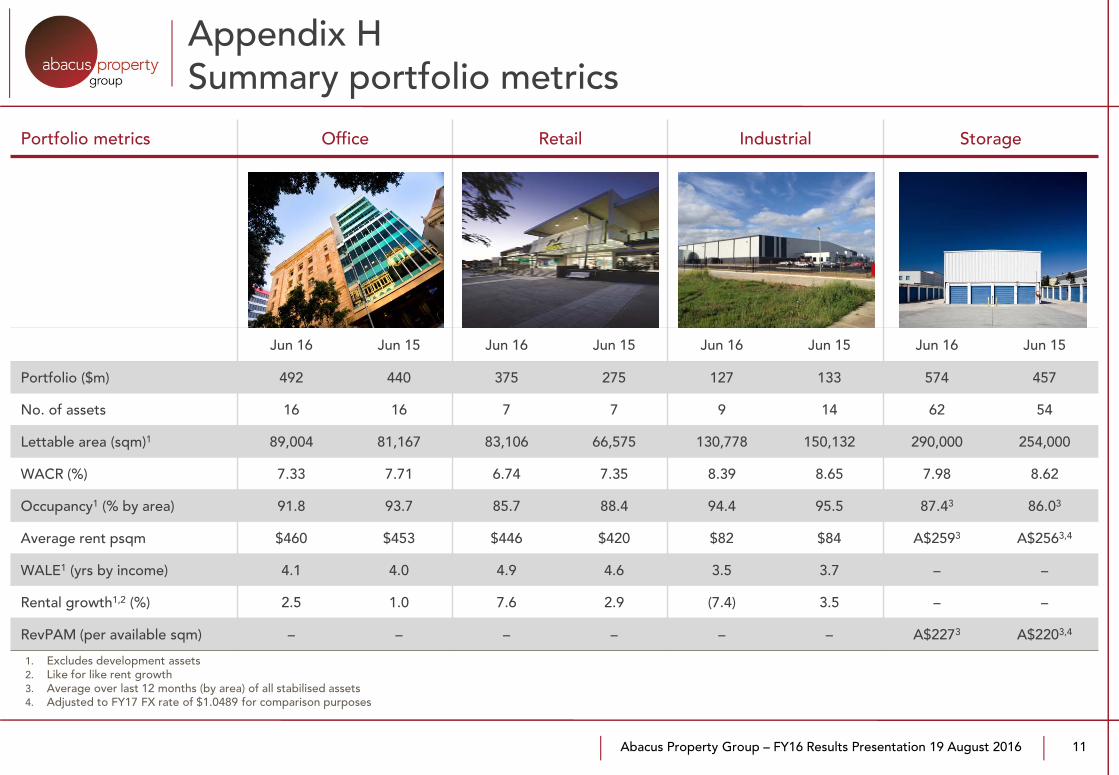
Appendix HSummary portfolio metrics
Office31%
Storage37%
Retail24%
Industrial and Other
8%
NSW29%
VIC29%
QLD19%
ACT10%
NZ8%
SA5%
Key portfolio metrics Jun 16 Jun 15
Investment portfolio value1 ($m) 1,568 1,318
Commercial portfolio1 ($m) 994 861
Storage portfolio ($m) 574 457
WACR1,4 (%) 7.48 8.05
No. of commercial assets1 32 37
NLA (sqm)2,3 302,888 297,874
Occupancy2,3 (% by area) 91.2 93.4
WALE2,3 (yrs by income) 4.3 4.1
Like for like rental growth2,3 (%) 2.7 2.2
1. Includes assets acquired under our third party capital platform, inventory and PP&E 2. Excludes storage assets3. Excludes development assets4. Weighted Average Cap Rate

Abacus Property Group – FY16 Results Presentation 19 August 2016
Canberra10%
Sydney21%
Melbourne25%Brisbane
13%
Regional VIC4%
Regional QLD7%
Auckland14%
Regional NZ6%
Regional geographic diversity by NLA
48%
40%
7%
5%
0-4000
4001-7000
7001-10000
10000+
Asset net lettable area (m2) split by number of assets
VIC28%
NSW21%
QLD20%
NZ21%
ACT10%
State geographic diversity by NLA
31%
45%
13%
11%
0-4000
4001-7000
7001-10000
10000+
Asset net lettable area (m2) split by value
Appendix HSummary storage portfolio metrics
10
Abacus Property Group – FY16 Results Presentation 19 August 2016
Portfolio metrics Office Retail Industrial Storage
Jun 16 Jun 15 Jun 16 Jun 15 Jun 16 Jun 15 Jun 16 Jun 15
Portfolio ($m) 492 440 375 275 127 133 574 457
No. of assets 16 16 7 7 9 14 62 54
Lettable area (sqm)1 89,004 81,167 83,106 66,575 130,778 150,132 290,000 254,000
WACR (%) 7.33 7.71 6.74 7.35 8.39 8.65 7.98 8.62
Occupancy1 (% by area) 91.8 93.7 85.7 88.4 94.4 95.5 87.43 86.03
Average rent psqm $460 $453 $446 $420 $82 $84 A$2593 A$2563,4
WALE1 (yrs by income) 4.1 4.0 4.9 4.6 3.5 3.7 – –
Rental growth1,2 (%) 2.5 1.0 7.6 2.9 (7.4) 3.5 – –
RevPAM (per available sqm) – – – – – – A$2273 A$2203,4
1. Excludes development assets2. Like for like rent growth3. Average over last 12 months (by area) of all stabilised assets4. Adjusted to FY17 FX rate of $1.0489 for comparison purposes
11
Appendix HSummary portfolio metrics

Abacus Property Group – FY16 Results Presentation 19 August 2016 12
6.2%
15.3%
9.5%10.4%
13.3%
45.3%
Month to month FY17 FY18 FY19 FY20 FY21+
Appendix HSummary portfolio metrics – lease expiry profile

Abacus Property Group – FY16 Results Presentation 19 August 2016
Appendix IProperty ventures
Projects Type Equity Loans Total Interest rate Security Returns
RCL Portfolio, NSW JV/Loan $59.9m $90.3m $150.2m 1st Mortgagee 50% profit share
Campsie, NSW Loan - $42.1m $42.1m 1st Mortgagee 50% profit share
SPICE Apartments, QLD Loan - $37.1m $37.1m 2nd Mortgagee 41% profit share
Merivale St, QLD JV $26.5m - $26.5m Equity 49% profit share
Marsden Park, NSW Loan - $25.6m $25.6m 1st Mortgagee Exit fee upon repayment
Erskineville, NSW JV $4.0m $20.0m $24.0m Unsecured 50% profit share
French Street, Werrington, NSW Loan - $17.2m $17.2m 2nd Mortgagee 25% profit share
Grand Ave, Camellia, NSW Loan - $16.2m $16.2m 1st Mortgagee 50% profit share
Belmore, NSW Loan - $14.5m $14.5m 1st Mortgagee 50% profit share
The EMINENCE, VIC JV - $13.1m $13.1m Unsecured 50% profit share
Tuggeranong, ACT JV $0.2m $12.7m $12.9m 1st Mortgagee 50% profit share
Rance Road (Settler’s Estate), NSW Loan - $14.0m $14.0m 1st Mortgagee 50% profit share
Bosch, Bentleigh East, VIC Inventory $11.4m - $11.4m Equity 100% ownership
107 George St, NSW Loan - $8.4m $8.4m 1st Mortgagee 50% profit share
Lane Cove, NSW Loan - $7.8m $7.8m 1st Mortgagee 50% profit share
Ashfield Central, NSW Inventory $7.7m - $7.7m Equity 100% ownership
23 George St, NSW Loan - $7.2m $7.2m 1st Mortgagee 50% profit share
55 Aird St, NSW Loan - $7.0m $7.0m 1st Mortgagee 50% profit share
Doonside, NSW Loan - $6.1m $6.1m 1st Mortgagee 50% profit share
16 small projects and investments - $19.6m $17.3m $36.9m
Total $129.3m $370.3m $499.6m 10%
13
Abacus Property Group – FY16 Results Presentation 19 August 2016
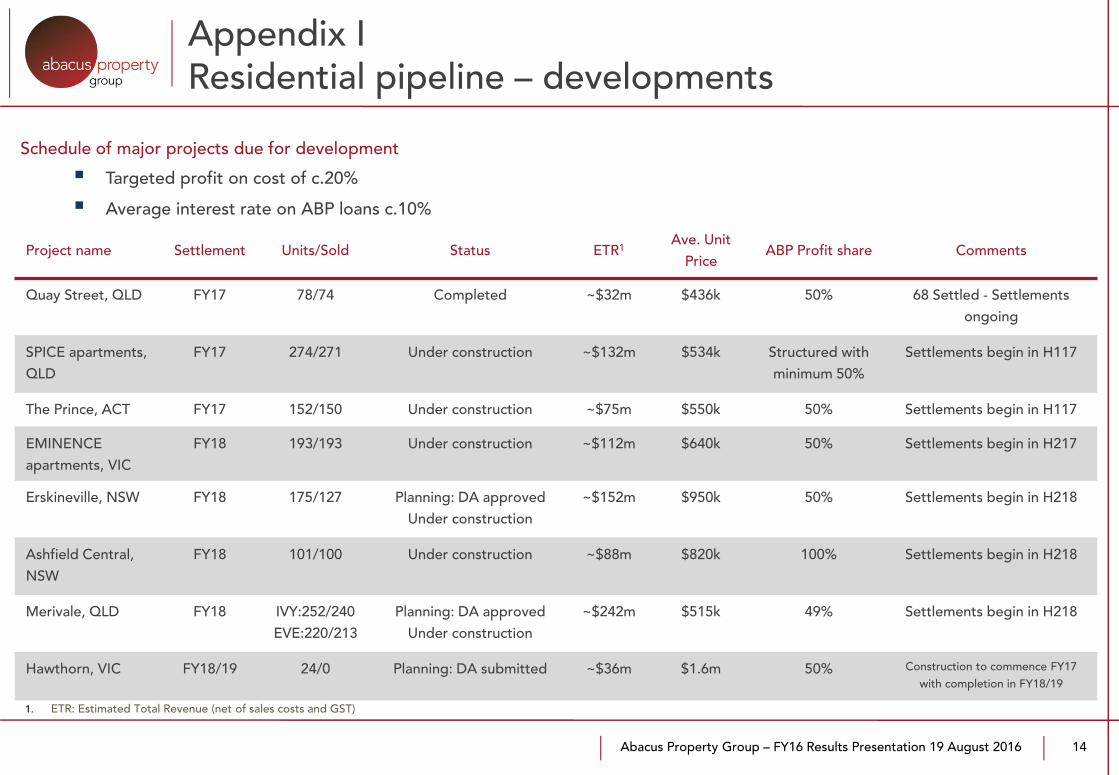
Appendix IResidential pipeline – developments
14
Project name Settlement Units/Sold Status ETR1Ave. Unit
PriceABP Profit share Comments
Quay Street, QLD FY17 78/74 Completed ~$32m $436k 50% 68 Settled - Settlements ongoing
SPICE apartments, QLD
FY17 274/271 Under construction ~$132m $534k Structured with minimum 50%
Settlements begin in H117
The Prince, ACT FY17 152/150 Under construction ~$75m $550k 50% Settlements begin in H117
EMINENCE apartments, VIC
FY18 193/193 Under construction ~$112m $640k 50% Settlements begin in H217
Erskineville, NSW FY18 175/127 Planning: DA approved Under construction
~$152m $950k 50% Settlements begin in H218
Ashfield Central, NSW
FY18 101/100 Under construction ~$88m $820k 100% Settlements begin in H218
Merivale, QLD FY18 IVY:252/240 EVE:220/213
Planning: DA approved Under construction
~$242m $515k 49% Settlements begin in H218
Hawthorn, VIC FY18/19 24/0 Planning: DA submitted ~$36m $1.6m 50% Construction to commence FY17 with completion in FY18/19
Schedule of major projects due for development
1. ETR: Estimated Total Revenue (net of sales costs and GST)
Targeted profit on cost of c.20%
Average interest rate on ABP loans c.10%
Abacus Property Group – FY16 Results Presentation 19 August 2016
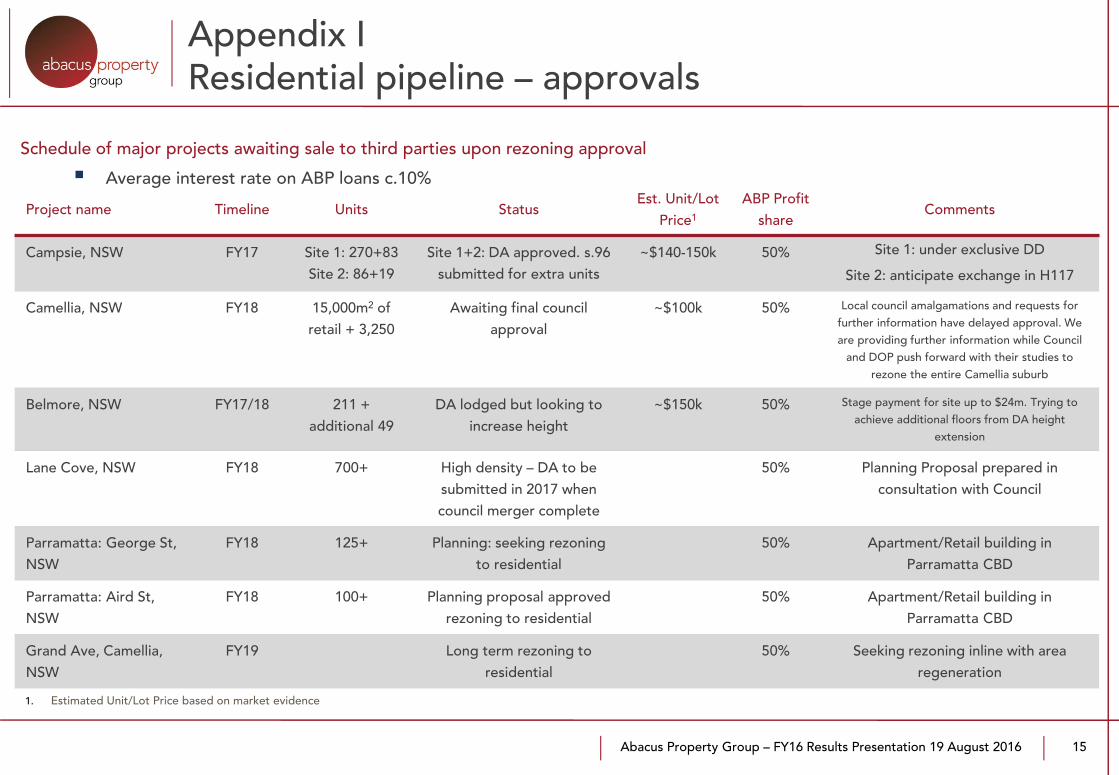
Appendix IResidential pipeline – approvals
15
Project name Timeline Units StatusEst. Unit/Lot
Price1
ABP Profit share
Comments
Campsie, NSW FY17 Site 1: 270+83 Site 2: 86+19
Site 1+2: DA approved. s.96 submitted for extra units
~$140-150k 50% Site 1: under exclusive DD
Site 2: anticipate exchange in H117
Camellia, NSW FY18 15,000m2 of retail + 3,250
Awaiting final council approval
~$100k 50% Local council amalgamations and requests for further information have delayed approval. We are providing further information while Council
and DOP push forward with their studies to rezone the entire Camellia suburb
Belmore, NSW FY17/18 211 + additional 49
DA lodged but looking to increase height
~$150k 50% Stage payment for site up to $24m. Trying to achieve additional floors from DA height
extension
Lane Cove, NSW FY18 700+ High density – DA to be submitted in 2017 when council merger complete
50% Planning Proposal prepared in consultation with Council
Parramatta: George St, NSW
FY18 125+ Planning: seeking rezoning to residential
50% Apartment/Retail building in Parramatta CBD
Parramatta: Aird St, NSW
FY18 100+ Planning proposal approved rezoning to residential
50% Apartment/Retail building in Parramatta CBD
Grand Ave, Camellia, NSW
FY19 Long term rezoning to residential
50% Seeking rezoning inline with area regeneration
Schedule of major projects awaiting sale to third parties upon rezoning approval
1. Estimated Unit/Lot Price based on market evidence
Average interest rate on ABP loans c.10%

Abacus Property Group – FY16 Results Presentation 19 August 2016
Appendix IResidential pipeline – land sub-divisions
16
Project name TimelineLand
lots/SoldStatus
Price per lot
Cost to prepare lot
ABP share Comments
French Road Werrington (Stage 1), NSW
FY17 108/108 Sold Out $270k $100k 25% Settlements currently happening. Funds will repay senior debt, accrued interest and capital
French Road Werrington (Stage 2), NSW
FY17 30/30 Sold Out $280k $100k 25% Settlements currently happening. Funds will repay senior debt, accrued interest and capital
French Road Werrington (Stage 3), NSW
FY18 111/0 Awaiting revised DA approval
$270k $100k 25% DA submitted: rezoning of 111 small lots has been revised and approval anticipated within next 3 months
French Road Werrington (Stage 4), NSW
FY18/19 121/0 Awaiting gazettal
$270k $100k 25% DA to be submitted upon gazettal approval
Riverlands, NSW FY18 450/0 Progressing rezoning
~$450k+ $120k 50% Council have adopted the planning proposal (PP) for a residential sub-division. Rezoning has been approved by council. NSW gazettal is imminent. Development application is being worked on.
Rance Road Werrington, NSW
FY18/19 152/0 Seeking rezoning
~$330k $100k 50% Development application anticipated soon for 152 blocks averaging 220m2.
Schedule of land sub-divisions due for development

Abacus Property Group – FY16 Results Presentation 19 August 2016 17
Appendix JConsolidated funds under management
1. Secured loans as a percentage of bank approved security2. Assumes that the Abacus Working Capital Facilities are treated as equity on a fund wind up
Funds ADIF II AHF AWLF
Assets 6 3 1
Assets Under Management $139.4m $140.8m $20.1m
WAV cap rate 7.90% 7.83% N/A
Occupancy 84% 77% N/A
Bank debt $50m $50m N/A
WAV bank debt maturity 1.0 yr. 0.8 yrs N/A
Covenant gearing1 40% 41% N/A
NAV per unit2 74c 55c Nil

Abacus Property Group – FY16 Results Presentation 19 August 2016
Disclaimer
18
The information provided in this document is general, and may not be suitable for the specific purposes of any user of this document. It is not financial advice or a recommendation to acquire Abacus Property Group securities (ASX: ABP). Abacus Property Group believes that the information in this document is correct (although not complete or comprehensive) and does not make any specific representations regarding its suitability for any purpose. Users of this document should obtain independent professional advice before relying on this document as the basis for making any investment decision and should also refer to Abacus Property Group’s financial statements lodged with the ASX for the period to which this document relates. This document contains non-AIFRS financial information that Abacus Property Group uses to assess performance and distribution levels. That information is calculated in accordance with the AICD/Finsia principles and is not audited.
Any forecasts or other forward looking statements contained in this presentation are based on assumptions concerning future events and market conditions. Actual results may vary from forecasts and any variations may be materially positive or negative.
The information in this document is current only as at the date of this document, and that information may not be updated to reflect subsequent changes.
To the extent permitted by law, the members of Abacus Property Group and those officers responsible for the preparation of this document disclaim all responsibility for damages and loss incurred by users of this document as a result of the content of,or any errors or omissions in, this document.
Abacus Property Group:
Abacus Group Holdings Limited ACN: 080 604 619
Abacus Group Projects Limited ACN: 104 066 104
Abacus Funds Management Limited ACN: 007 415 590 AFSL No. 227819
Abacus Storage Funds Management Limited ACN: 109 324 834 AFSL No. 277357
Abacus Storage Operations Limited ACN: 112 457 075