
FY15 Aspirational Budget Presentation to the Fiscal Committee November 8, 2013.
47
FY15 Aspirational Budget Presentation to the Fiscal Committee November 8, 2013
-
Upload
della-fletcher -
Category
Documents
-
view
215 -
download
2
Transcript of FY15 Aspirational Budget Presentation to the Fiscal Committee November 8, 2013.
FY15 Aspirational Budget
Presentation to the Fiscal CommitteeNovember 8, 2013

2
EEC State Budget History
(Am
ount
in M
illio
ns)
FY2006 FY2007 FY2008 FY2009 FY2010 FY2011 FY2012 FY2013 FY2014 $440
$460
$480
$500
$520
$540
$560
$462.16
$495.97
$537.23
$553.43
$505.35
$508.59
$495.18
$479.22
$509.28
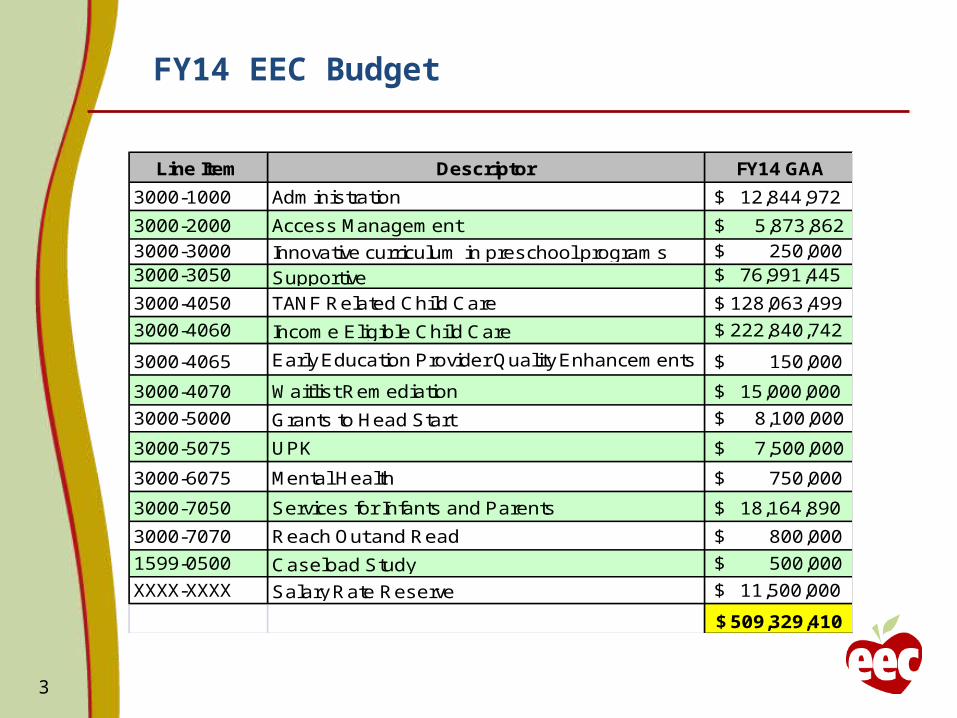
FY14 EEC Budget
3
Line Item Descriptor FY14 GAA
3000-1000 Administration $ 12,844,972
3000-2000 Access Management $ 5,873,862
3000-3000 Innovative curriculum in preschool programs $ 250,000 3000-3050 Supportive $ 76,991,445
3000-4050 TANF Related Child Care $ 128,063,499
3000-4060 Income Eligible Child Care $ 222,840,742
3000-4065 Early Education Provider Quality Enhancements $ 150,000
3000-4070 Waitlist Remediation $ 15,000,000
3000-5000 Grants to Head Start $ 8,100,000
3000-5075 UPK $ 7,500,000
3000-6075 Mental Health $ 750,000
3000-7050 Services for Infants and Parents $ 18,164,890
3000-7070 Reach Out and Read $ 800,000
1599-0500 Caseload Study $ 500,000
XXXX-XXXX Salary Rate Reserve $ 11,500,000
509,329,410$

4
Strategic Plan Context
The presentation of the FY14 budget request is in the context of the EEC Strategic Plan.
QUALITY: Create and implement a system to improve and support quality statewide.
WORKFORCE: Create a workforce system that maintains worker diversity and provides resources, supports, expectations, and core competencies that lead to the outcomes we want for children.
ACCESS: Increase and promote family support, access, and affordability. All preschool children have access to high quality pre-kindergarten programs that meet family needs.
ACCESS / TRANSPORTATION: All preschool children have access to high quality pre-kindergarten programs that meet family needs.
INFRASTRUCTURE: Build the internal infrastructure to support achieving the vision.

Ongoing Needs
5
We have many ongoing needs to consider, as follows:
1. Investment in Field Quality: Prior to the Consolidated Net Surplus (CNS) rate increase proposed for FY14, there had not been a rate increase since March 2009, which was less than 1%. The increase will add about $.78 to each of the rates, but this is still low and inadequate.
2. Access for Children: Voucher access opened in October 2013; it had been closed since February 2011. While we are placing approximately 3,300 children in new vouchers, the waitlist remains around 40,000.
3. Quality Programs: Investments in quality initiatives and programs must be sustained.
4. Transportation: Funding is needed to support the cost of transportation in the field. The last transportation rate increase was May 2006.
5. Staffing to Support Historical Deficit in Licensing, Monitoring, and Program Management.

Rate Increase
6
Key findings of the recently completed Market Rate Survey are:
Prices for center-based care and family child care are highest in the Metro, Boston and Northeastern regions.
Reimbursement rates are significantly below the 75th price percentiles for all age groups in all regions of the state.
Consistent with 2010 results, prices decreased significantly in center-based settings as the age of the child increases, while prices in family child care settings decrease less as the age of child increases.
The price changes for family child care since 2010 were less significant than those from 2008-2010 reported in the last market price survey.
A comparison of EEC after-school rates and market prices finds that reimbursement rates are below the 75th price percentiles in all regions and are below the 50th percentiles in all regions, except for the Western Region.
EEC rates are above the 25th percentile for after-school care in only three regions.
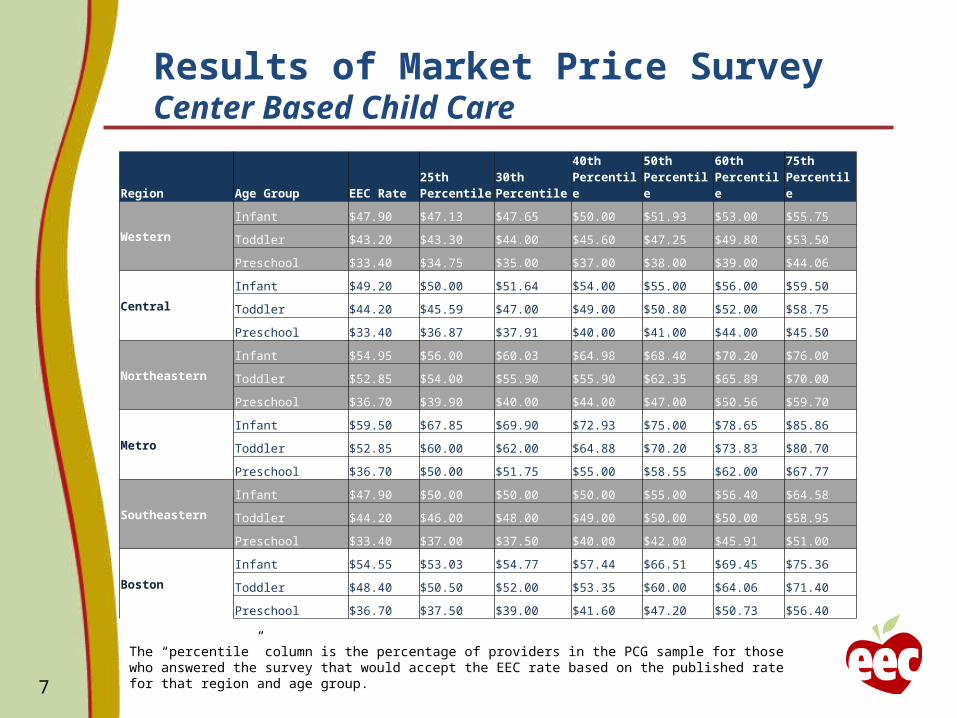
Results of Market Price Survey Center Based Child Care
7
Region Age Group EEC Rate25th Percentile
30th Percentile
40th Percentile
50th Percentile
60th Percentile
75th Percentile
Western
Infant $47.90 $47.13 $47.65 $50.00 $51.93 $53.00 $55.75
Toddler $43.20 $43.30 $44.00 $45.60 $47.25 $49.80 $53.50
Preschool $33.40 $34.75 $35.00 $37.00 $38.00 $39.00 $44.06
Central
Infant $49.20 $50.00 $51.64 $54.00 $55.00 $56.00 $59.50
Toddler $44.20 $45.59 $47.00 $49.00 $50.80 $52.00 $58.75
Preschool $33.40 $36.87 $37.91 $40.00 $41.00 $44.00 $45.50
Northeastern
Infant $54.95 $56.00 $60.03 $64.98 $68.40 $70.20 $76.00
Toddler $52.85 $54.00 $55.90 $55.90 $62.35 $65.89 $70.00
Preschool $36.70 $39.90 $40.00 $44.00 $47.00 $50.56 $59.70
Metro
Infant $59.50 $67.85 $69.90 $72.93 $75.00 $78.65 $85.86
Toddler $52.85 $60.00 $62.00 $64.88 $70.20 $73.83 $80.70
Preschool $36.70 $50.00 $51.75 $55.00 $58.55 $62.00 $67.77
Southeastern
Infant $47.90 $50.00 $50.00 $50.00 $55.00 $56.40 $64.58
Toddler $44.20 $46.00 $48.00 $49.00 $50.00 $50.00 $58.95
Preschool $33.40 $37.00 $37.50 $40.00 $42.00 $45.91 $51.00
Boston
Infant $54.55 $53.03 $54.77 $57.44 $66.51 $69.45 $75.36
Toddler $48.40 $50.50 $52.00 $53.35 $60.00 $64.06 $71.40
Preschool $36.70 $37.50 $39.00 $41.60 $47.20 $50.73 $56.40
The “percentile” column is the percentage of providers in the PCG sample for those who answered the survey that would accept the EEC rate based on the published rate for that region and age group.

Results of Market Price Survey Family Child Care
8
Region Age Group EEC Rate25th Percentile
50th Percentile
75th Percentile
EEC Market Access Rate
Western
Infant $30.10 $32.00 $35.00 $40.00 22.1%
Toddler $30.10 $30.00 $35.00 $40.00 33.3%
Preschool $26.40 $30.00 $35.00 $40.00 9.5%
Central
Infant $31.80 $33.00 $40.00 $45.00 17.1%
Toddler $31.80 $32.00 $40.00 $45.00 24.5%
Preschool $26.40 $30.00 $40.00 $45.00 9.3%
Northeastern
Infant $31.50 $34.25 $45.00 $50.05 18.5%
Toddler $31.50 $32.50 $44.00 $54.37 22.8%
Preschool $27.85 $30.00 $40.00 $50.00 15.4%
Metro
Infant $34.35 $45.00 $56.50 $65.00 3.8%
Toddler $34.35 $41.50 $55.00 $65.00 8.5%
Preschool $27.85 $41.50 $55.00 $65.25 8.1%
Southeastern
Infant $31.80 $35.00 $40.00 $45.00 8.1%
Toddler $31.80 $35.00 $40.00 $45.00 17.6%
Preschool $26.40 $30.00 $38.00 $54.75 3.7%
Boston
Infant $31.50 $32.00 $40.00 $54.50 17.4%
Toddler $31.50 $30.00 $40.00 $51.50 31.1%
Preschool $27.85 $30.00 $38.00 $53.88 11.5%
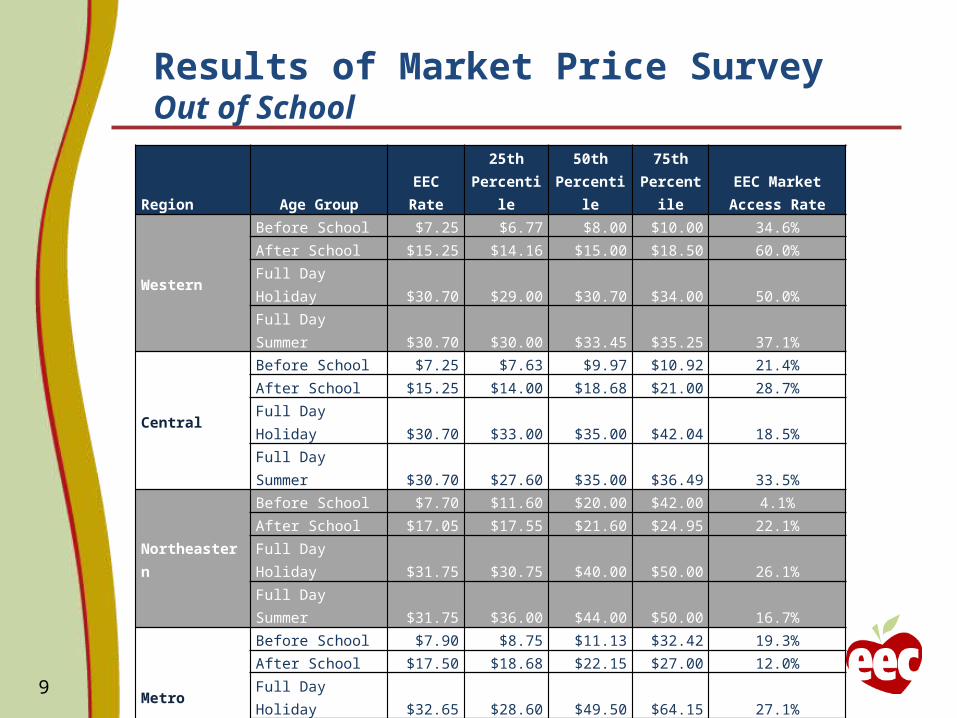
Results of Market Price Survey Out of School
9
Region Age Group EEC Rate25th
Percentile50th
Percentile75th
PercentileEEC Market Access
Rate
Western
Before School $7.25 $6.77 $8.00 $10.00 34.6%After School $15.25 $14.16 $15.00 $18.50 60.0%Full Day Holiday $30.70 $29.00 $30.70 $34.00 50.0%Full Day Summer $30.70 $30.00 $33.45 $35.25 37.1%
Central
Before School $7.25 $7.63 $9.97 $10.92 21.4%After School $15.25 $14.00 $18.68 $21.00 28.7%Full Day Holiday $30.70 $33.00 $35.00 $42.04 18.5%Full Day Summer $30.70 $27.60 $35.00 $36.49 33.5%
Northeastern
Before School $7.70 $11.60 $20.00 $42.00 4.1%After School $17.05 $17.55 $21.60 $24.95 22.1%Full Day Holiday $31.75 $30.75 $40.00 $50.00 26.1%Full Day Summer $31.75 $36.00 $44.00 $50.00 16.7%
Metro
Before School $7.90 $8.75 $11.13 $32.42 19.3%After School $17.50 $18.68 $22.15 $27.00 12.0%Full Day Holiday $32.65 $28.60 $49.50 $64.15 27.1%Full Day Summer $32.65 $31.80 $41.00 $52.50 26.2%
Southeastern
Before School $7.25 $9.75 $16.75 $19.06 4.7%After School $15.25 $17.00 $19.00 $25.00 13.5%Full Day Holiday $30.70 $30.00 $38.00 $40.00 27.0%Full Day Summer $30.70 $30.00 $35.00 $38.00 29.3%
Boston
Before School $7.90 $7.95 $8.80 $9.50 16.6%After School $17.50 $15.70 $19.00 $22.00 30.7%Full Day Holiday $32.65 $22.08 $30.00 $37.50 68.2%Full Day Summer $32.65 $28.75 $31.77 $40.75 51.3%

RATE INCREASE
10
FY14 Consolidated Net Increase
EEC has received $11.5M as part of the Consolidated Net Surplus (CNS) to dedicate to an across the board rate increase for all center based, family child care providers, and family child care systems.
This is roughly a raise of $.78 on the daily rate. The rate increase will be retroactive to July 1, 2013.

RATE INCREASE
11
Rate Increase: $13,657,652
The cost of a 3% rate increase as a separate cost for each of the caseload accounts is as follows:
IE: $7,274,381 DTA: $4,031,960 DCF: $2,351,311
This is the equivalent of an $.82 addition to the daily rate.
Prior to the rate increase to be implemented this year, the last rate increase was March 2009 when we gave .45%.
We will implement the same policy for the rate increase as used in FY09: “This increase shall be directed to expenditures for salaries, benefits, and stipends for professional development of early education and care workers or other programmatic quality improvements.”

12
ACCESS: DCF
3000-3050
For supportive early education and care services; provided, that funds from this item shall only be expended for early education and care costs of children with active cases at the department of children and families; provided further, that the department of early education and care, in collaboration with the department of children and families, shall maintain a centralized list detailing the number of children eligible for services in this item, the number of supportive slots filled and the number of supportive slots available; provided further, that funds may be used to provide services during a transition period of 6 months for families upon the closure of their case; and provided further, that all children eligible for services under this item shall receive those services ............$76,991,445

ACCESS: DCF
13
DCF Supportive Child Care:
Provides child care for children with active protective cases with DCF – predominantly for “intact” families; limited access for foster families.
FY2013: $78M, serving approximately 5,000 to 5,500 children.
DCF determines family’s child care needs and manages authorizations, referrals and waiting lists through area offices.
EEC manages procurement of services, administration, payment, and contract oversight from their central office.
Supportive Providers manage enrollment, process authorizations and reauthorizations, and terminations
Current access is through a network of Supportive Child Care contracts awarded in 2010.
Standard provider rate includes $17.22/day add-on, per child, to support transportation and case management services.

14
ACCESS: DCF
EEC currently manages DCF child care through contracted and expansion slots.
EEC Contracted & Expansion Slots
Current Status (as of 11/5/13)
EEC awarded 4,753 DCF slots to Contracted Providers
4,407 (93% filled)
801 expansion units available for use
787 (98% filled)
5,554 slots available in total 5,194 (93.52% filled)
The DCF waitlist is maintained by 29 Area Offices which periodically report the waitlist number via Survey Monkey.
Most recent report shows approximately 625 children on the “placement waitlist”.
DCF has 22,000 open cases and believes that a large percentage of these open cases would receive child care if it were available.
Questions for consideration are: How can we determine true need? How can access be improved?
15
ACCESS: DCF
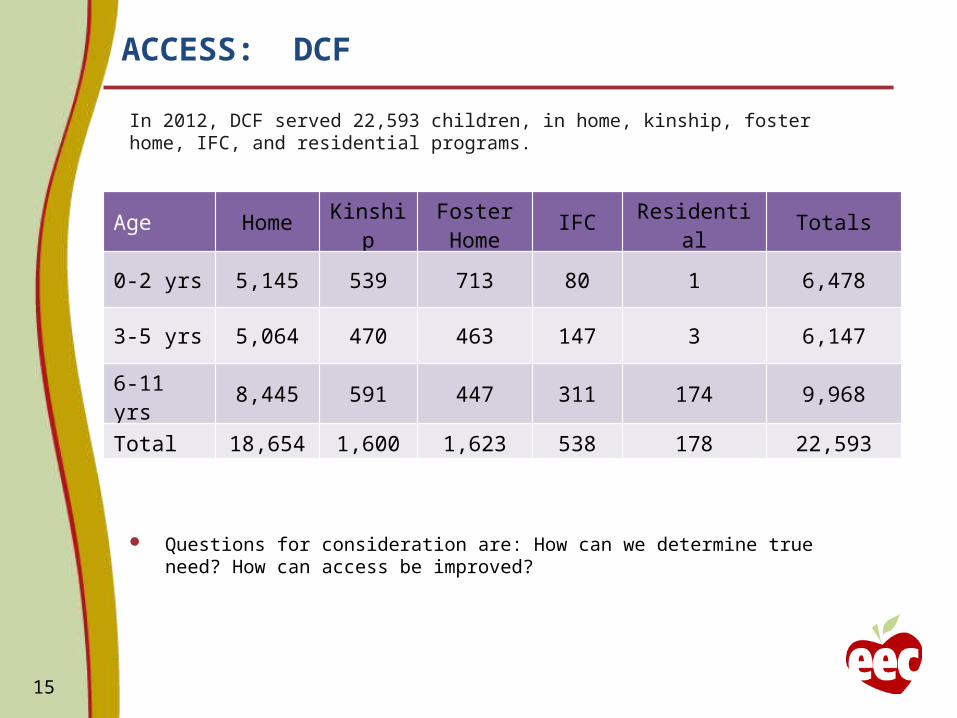
In 2012, DCF served 22,593 children, in home, kinship, foster home, IFC, and residential programs.
Questions for consideration are: How can we determine true need? How can access be improved?
Age Home Kinship Foster Home IFC Residential Totals
0-2 yrs 5,145 539 713 80 1 6,478
3-5 yrs 5,064 470 463 147 3 6,147
6-11 yrs 8,445 591 447 311 174 9,968
Total 18,654 1,600 1,623 538 178 22,593

16
ACCESS: DCF
Number of Children Supportive
5,000 66,188,112$
10,000 132,376,223$
15,000 198,564,335$
20,000 264,752,447$
Cost of Waitlist Reduction by Average Cost Per Child
How can we determine true need? How can access be improved?
EEC supports the construction of a credible DCF waitlist to build a long term financing model to support the need represented by the waitlist.
We further support financing that supports DCF’s best estimate that satisfies their near term need.

17
ACCESS: DCF
Number of Children Supportive
500 6,618,810$
1,000 13,237,620$
1,500 19,856,430$
2,000 26,475,240$
Cost of Waitlist Reduction by Average Cost Per Child
How can we determine true need? How can access be improved?
EEC supports the construction of a credible DCF waitlist to build a long term financing model to support the need represented by the waitlist.
We further support financing that supports DCF’s best estimate that satisfies their near term need.
In the absence of a credible waitlist number, but aware of the need, EEC proposes a pilot program which makes vouchers available to all contract providers.
The vouchers will be managed by EEC and will be given to providers who can prove the need to provide service to a DCF child above their contract allocation.
A particular emphasis will be on the delivery of these vouchers to children in Western Massachusetts.
We propose serving 500 children at a cost of $6,618,810.

18
ACCESS: DTA
EEC recommends that we fund this account in FY15 at the proposed maintenance level of $ 134,398,656.

19
ACCESS: Income Eligible (IE)
Number of Children Income Eligible
5,000 43,223,885$
10,000 86,447,769$
20,000 172,895,539$
40,000 345,791,077$
FY2013 Average Cost Income Eligible
Infant 11,312.31$
Toddler 10,432.41$
Pre-School 7,618.61$
School Age 5,215.78$
FY2013 Average Cost 8,644.78$
Income Eligible 1000 2000 3000 4000 5000
Infant 11,312,309$ 22,624,618$ 33,936,926$ 45,249,235$ 56,561,544$
Toddler 10,432,410$ 20,864,820$ 31,297,230$ 41,729,639$ 52,162,049$
Pre-School 7,618,606$ 15,237,213$ 22,855,819$ 30,474,425$ 38,093,032$
School Age 5,215,783$ 10,431,565$ 15,647,348$ 20,863,131$ 26,078,914$
Cost of Waitlist Reduction by Average Cost
Cost of Waitlist Reduction by Age Group
We offer choosing a number of children to serve or serving a particular age group. EEC proposes serving 5,000 children at a cost of $43,223,885.

Caseload Waitlist 11/2012 - 10/2013
20.
Data Report created on October 30, 2013** Excludes Unborn children, Children 13 or older, “0” zip codes and towns out of state
Priority11/30/12
Total12/31/12
Total01/31/13
Total02/28/13
Total3/28/13
Total4/30/13
Total5/28/13
Total6/30/13
Total7/31/2013
Total8/30/13
Total9/26/13
Total10/30/13
Total Chi ld of Foster Care 276 282 288 290 285 289 299 305 169 180 194 196 Chi ld of Homeless fami ly 520 536 558 566 576 591 609 641 454 458 487 479 Chi ld of Mi l i tary Personnel 101 105 116 116 123 117 90 91 68 44 43 49 Chi ld of Teen Parent 477 481 489 513 507 523 525 556 365 389 423 414 Chi ld with Specia l Needs 2,117 2,198 2,234 2,291 2,355 2,442 2,524 2,615 1,776 1,893 1,922 1,816 Continuity of Care: Prior Year Summer Only 120 135 149 161 164 167 173 177 139 151 163 157 Continuity of Care: Aging Out 409 411 402 398 399 404 414 416 205 248 274 253 Continuity of Care: Approved Break in Service 442 451 470 473 482 490 523 585 484 493 530 502 Continuity of Care: ARRA 146 149 148 146 141 142 143 141 51 54 60 52 Continuity of Care: Geographic Relocation 182 186 198 201 207 221 222 224 145 154 161 159 Continuity of Care: Homeless Contract 25 27 29 32 31 30 37 35 29 30 29 29 Continuity of Care: Supportive Referra l 269 279 288 296 308 324 352 371 256 265 284 280 Continuity of Care: Teen Parent Contract 32 32 28 27 28 28 29 30 16 18 22 24 Genera l Priori ty 39,470 40,431 41,722 42,588 43,315 44,861 45,970 47,737 32,881 34,266 35,725 34,708 Grandparent/Guardian Fami l ies 541 547 565 566 576 584 609 632 349 344 350 345 No Priori ty - Other Fami ly Member 282 295 314 327 338 363 393 422 357 381 411 401 Parent with Specia l Needs 805 806 805 807 807 823 840 837 436 424 426 381 Sibl ing: Contract 654 672 714 729 771 788 804 850 737 753 792 775 Sibl ing: Voucher 788 804 833 845 870 815 792 797 544 566 542 435 Summer only care 899 893 919 923 958 1,024 1,074 1,233 853 856 863 879 N/A 556 541 523 518 509 501 500 495 4 6 16 14
Grand Total 48,555 49,720 51,269 52,295 53,241 55,026 56,422 58,695 40,318 41,973 43,717 42,348

21
ACCESSEEC Waitlist vs. IE Children Served
Spike in July 09 is due to 3A to 3D transitional children from DTA to IE.
Jul-
11
Oct
-11
Jan-1
2
Apr-
12
Jul-
12
Oct
-12
Jan-1
3
Apr-
13
Jul-
13
20,000
25,000
30,000
35,000
40,000
45,000
50,000
55,000
60,000
65,000
WaitlistIE Children Served
Reason for sharp de-cline: Waitlist ad-justed to exclude archived children

Caseload Waitlist 11/2012 - 10/2013
22
Data Report created on October 30, 2013** Excludes Unborn children, Children 13 or older, “0” zip codes and towns out of state
Priority Infant Toddler PreSchool School AgeTotal
October 30, 2013
Child of Foster Care 15 32 63 86 196 Child of Homeless family 49 106 169 155 479 Child of Military Personnel 5 10 18 16 49 Child of Teen Parent 173 149 73 19 414 Child with Special Needs 47 253 572 944 1,816 Continuity of Care: Prior Year Summer Only 1 1 5 150 157 Continuity of Care: Aging Out 2 2 29 220 253 Continuity of Care: Approved Break in Service 4 52 128 318 502 Continuity of Care: ARRA 3 5 9 35 52 Continuity of Care: Geographic Relocation 6 20 40 93 159 Continuity of Care: Homeless Contract 2 11 14 2 29 Continuity of Care: Supportive Referral 20 45 111 104 280 Continuity of Care: Teen Parent Contract 2 7 10 5 24 General Priority 4,568 7,291 10,222 12,627 34,708 Grandparent/Guardian Families 20 58 101 166 345 No Priority - Other Family Member 23 27 44 307 401 Parent with Special Needs 14 57 134 176 381 Sibling: Contract 195 146 100 334 775 Sibling: Voucher 144 84 49 158 435 Summer only care 5 4 35 835 879 N/A - - 2 12 14 Grand Total 5,298 8,360 11,926 16,750 42,348

23
ACCESS: IE
ACCESS: $43,223,885
EEC proposes that we should open up access for the waitlist on a first come first serve basis.
There are presently 42,000 children on the waitlist. We are presently serving just over 29,000 children in the IE caseload
account as of September’s reports.

24
Program Quality and Improvement
QUALITY PROGRAMS: $5,000,000
Massachusetts’ Quality Rating and Improvement System (QRIS) has been developed, funded, and implemented with full involvement of EEC’s community partners and EEC staff.
MA has standards for quality in early education and care programs that are research-based, broadly understood, successfully implemented, culturally appropriate, and aligned with a quality-building support system.
Approximately 5,200 programs/providers are participating in QRIS, representing half of our licensed programs. Additionally, we have 325 public school programs (license-exempt) also participating in QRIS.
1,361 of these programs have been granted a Level 2 status, and 5 of these programs are rated a Level 3 pending the successful completion of their Environment Rating Scales (ERS) classroom observations.
QRIS Program Type
Western Central Northeast South East/ Metro
ASOST 127 117 219 215 155Center 326 309 350 475 356FCC 691 851 1497 522 907Grand Total 1144 1277 2066 1212 1418

25
139, 090 children (full and part time) are enrolled in a QRIS rated program (self-reported by program/provider):
Infants: 7,480 Toddlers: 19,082 Preschoolers: 67,414 Kindergarteners: 5,430 School Aged Children: 39,684
44,037 of these children are on EEC Subsidies (contracted or voucher slots)
Licensed capacity of program participating in QRIS is 138,133 (enrollment exceeds capacity because a full time slot may be utilized by more than one child on a part time basis.)
FCC: 26,564 Small Group: 135 Infant: 4,781 Toddler: 7,960 Preschool: 44,737 Kindergarten: 610 School Age: 32,708 Infant Toddler Mixed: 5,561 Toddler/Preschool Mixed: 2,853 Preschool Mixed: 8,235 Kindergarten/School Aged Mixed: 3,989
Program Quality and Improvement
26
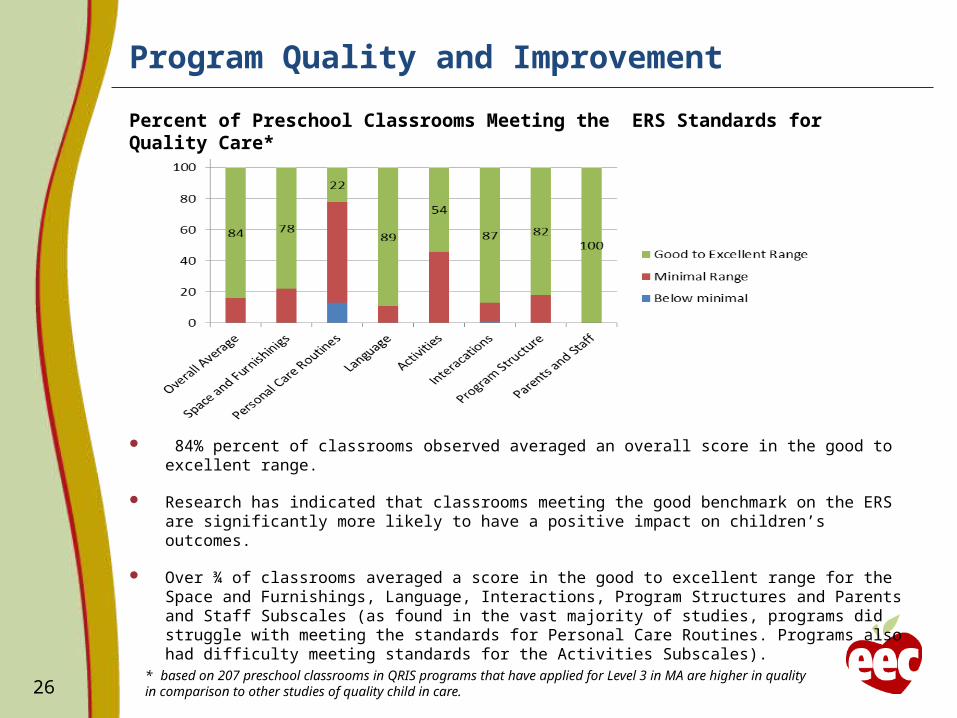
84% percent of classrooms observed averaged an overall score in the good to excellent range.
Research has indicated that classrooms meeting the good benchmark on the ERS are significantly more likely to have a positive impact on children’s outcomes.
Over ¾ of classrooms averaged a score in the good to excellent range for the Space and Furnishings, Language, Interactions, Program Structures and Parents and Staff Subscales (as found in the vast majority of studies, programs did struggle with meeting the standards for Personal Care Routines. Programs also had difficulty meeting standards for the Activities Subscales).
* based on 207 preschool classrooms in QRIS programs that have applied for Level 3 in MA are higher in quality in comparison to other studies of quality child in care.
Percent of Preschool Classrooms Meeting the ERS Standards for Quality Care*
Program Quality and Improvement

27
SUCCESS
Results from the first ERS classroom observations indicate that programs that have applied for a Level 3 status are of higher quality than the standard quality found in the general population of child care programs. This includes findings from MA specific studies, including the Boston Quality Inventory and the MA School Readiness Study. It is important to note that programs still need support in the areas of personal care routines and in providing children with a variety of play activities for a meaningful quantity of classroom time.
Program Quality and Improvement
Maintaining a Strong Quality Rating and Improvement System (QRIS) requires on-going support for:
• Planning and Design• Standards• Approaches to Implementation• Accountability and Monitoring• Provider Support and Sustainability• Data Collection and Evaluation• Public Awareness
28
Program Quality and Improvement
Accountability and Monitoring
Development of Inter-Rater Reliability Protocols - $500,000Standards and accountability are necessary, but not sufficient to generate quality improvement. An essential element of a QRIS is the support offered to QRIS support staff (Program Quality Specialists, EPS Grantees, CCR&R Grantees, coaches and mentors, etc.) to ensure consistent quality of the QRIS standards as well as the reporting of program QRIS levels to the consumer. Development of inter-rater reliability protocols will allow EEC to contract with an experienced vendor to:
Create consistent delivery of QRIS technical assistance. Build a uniform practice for program/provider site visits and monitoring. Create a system for standardized application verification. Maintain on-going monitoring, guidance and quality checks.
29
Program Quality and Improvement
Environment Rating Scale (ERS) Classroom Observations - $500,000The Environment Rating Scales is a research backed instrument that has been used to measure program quality for over two decades. Classroom observation facilitated by an ERS Reliable Rater is a vital component of the MA QRIS, accounting for measurement of 8 CBSB standards, 9 FCC standards, and 13 ASOST standards. Programs that self-assess in the upper tiers of the system are held accountable for quality through successful completion of a classroom/program observation by a certified ERS Reliable Rater.
Family Child Care QRIS Validation Study - $1,000,000EEC has initiated a QRIS Validation Study with CBSB programs; however, we delayed inclusion of FCC providers in order to allow them adequate time to move into the upper tiers of QRIS. Validation of the MA QRIS for our FCC providers will determine:
• Whether the system’s tiers (levels) accurately reflect different levels of quality.• Whether the levels of quality are aligned with Center Based/School Based
program quality.• To what extent those levels of quality are associated with children’s learning
and developmental growth trajectories.

30
Provider Support and Sustainability
QRIS Professional Development - $2,500,000
Professional Development requirements are a key component to MA QRIS, accounting for the measurement method of 21 CBSB standards, 12 FCC standards and 15 ASOST standards. Despite the strong link between early childhood educator qualifications and improved child outcomes, the capacity to educate all MA early childhood educators and providers remains one of the largest challenges for program movement toward the upper tiers of QRIS.
QRIS exemptions for Professional Development and Workforce Requirements have been, and continue to remain, a consistent request from programsand providers.
Ongoing training and support are essential to the knowledge, acquisition, and continued growth of early childhood educators and providers. Increased support for QRIS professional development will allow EEC to:
• Develop standardized QRIS orientations for each of the QRIS levels (1-4).• Offer regional trainings that are essential in understanding QRIS measurement methods.• Offer content specific trainings that support the five QRIS categories. • Adapt professional development opportunities to an on-line format, thereby supporting
a greater number of educators and providers for a lower cost. • Develop an on-line platform to host QRIS professional development resources
and trainings.
Highest Level of EducationNovember 4, 2013Some High
SchoolHigh School CDA
Some College Associate's Degree
Bachelor's Degree
Graduate Degree
Blanks
Program Quality and Improvement

31
Data Collection and Evaluation
QRIS Data System - $500,000
Data collection plays a fundamental role in informing policy development. Accurate data collection is imperative to the creation of strong policy that supports children and families. The rapid roll-out and growth of the MA QRIS, along with impending revisions to the system, has resulted in an antiquated data collection system.
Enhancement of the data collection system will allow:• A more efficient user-friendly experience for programs and providers
participating in QRIS.• Better tracking of program/provider application status• Quicker follow through from QRIS support staff. • Better reporting to local, state and federal partners on QRIS participation levels,
progress toward the upper tiers of QRIS, teacher/provider education levels, attendance at professional development opportunities, the number of high risk children served in high quality programs.
• A clearer understanding of the successes and challenges of QRIS participants.• A simple platform for parents and families to understand and find quality child
care.
Program Quality and Improvement

32
TRANSPORTATION COST
In June 2012 the Board voted as follows:
Subject to a supplemental budget appropriation the Board approves an increased transportation provider reimbursement rate of $16.51 for round trip transportation and $11.11 for one-way transportation for all infants, toddlers, and preschool age children with the requirement that, if the recommended reimbursement rate increase is funded, entities that receive transportation payment from EEC for infants, toddlers, and preschool age children must dedicate one adult monitor on all vehicles. The transportation rate of $9.00 per day round trip and $6.00 per day for one way transportation will remain in effect for all transportation providers that transport school age children.
TRANSPORTATION
TRANSPORTATION: $17,586,713 The last transportation rate increase was in May 2006 when the
one way rate increased from $5 to $6 and the round trip rate increased from $7.50 to $9.00.
The rate of $16.51 per round trip makes providers whole for the staff time already directed to satisfying the following recommendations: Management Responsibility Parent Notification Passenger Logs Secondary Vehicle Inspection
AND places an adult monitor on vehicles based on the number of children, ages, and length of routes.
Vehicle monitoring devices will not be required.
33
TRANSPORTATION COST
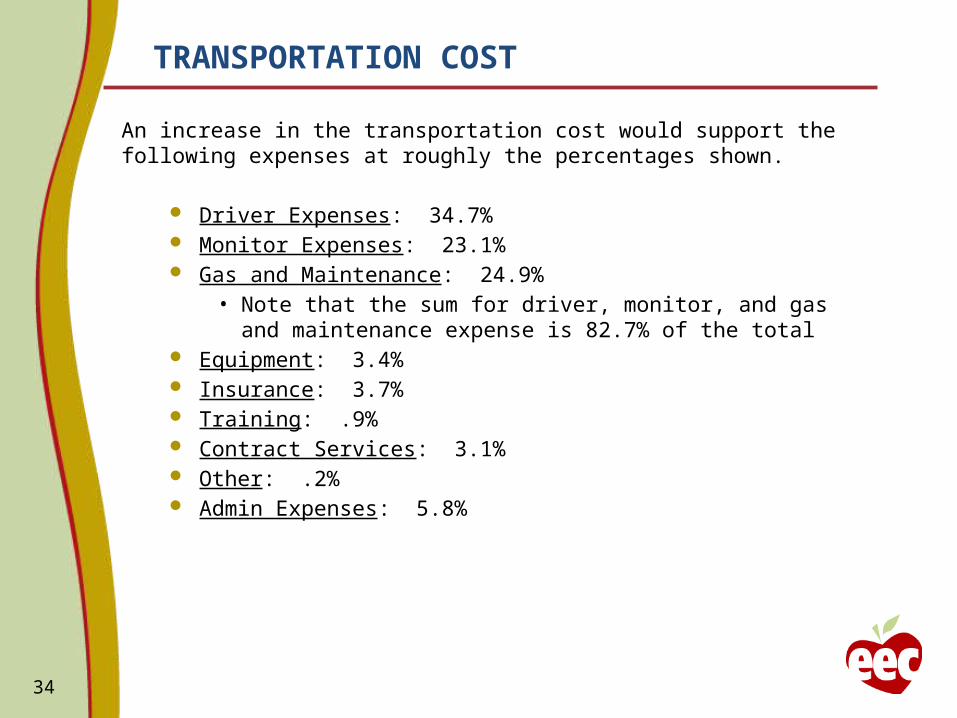
An increase in the transportation cost would support the following expenses at roughly the percentages shown.
Driver Expenses: 34.7% Monitor Expenses: 23.1% Gas and Maintenance: 24.9%
• Note that the sum for driver, monitor, and gas and maintenance expense is 82.7% of the total
Equipment: 3.4% Insurance: 3.7% Training: .9% Contract Services: 3.1% Other: .2% Admin Expenses: 5.8%
34

INFRASTRUCTURE COST
35
In November, 2010, the Board recommended the staffing pattern presented below.
SalaryBoard
Rec'd FTE
Child Care Licensing Specialist * $50,265 16
Director of Operations $85,276 1
Director of Community Partnership and Outreach $75,000 1
Director of Policy, Evaluation & Research $75,000 1Deputy General Counsel $76,000 1Policy Analyst - QRIS ** $61,303 1Policy Analyst - Generalist $61,303 1Family/Community Quality Specialist $61,303 2Educator Provider Support Specialist $61,303 2Audit Resolution: Fiscal Monitor *** $59,292 3
Total FY15 29
** Position funded in RTTT; will end 12/2015.* Licensing Specialists; priority to fill positions
*** One postion funded by Federal Grant RTTT

INFRASTRUCTURE: How Have We Done?
Child Care Licensing Specialist (16): We are in the process of hiring 5 licensing specialists, but this does not bring us to 16.
Chief of Staff (1): Just hired this position in October 2013.
Direct of Community Partnership and Outreach (1): Position not filled; need currently being assessed.
Director of Policy, Evaluation, and Research (1): Hired Carol Nolan as Director of Policy in February 2013.
Deputy General Counsel (1): Hired Felicia Sullivan in September 2013.
Policy Analyst – QRIS (1): Presently funded through RTTT. The position ends 12/31/15.
Policy Analyst – Generalist (1): This position is filled.
Family / Community Quality Specialist (2): One filled, the other is still needed.
Educator Provider Support Specialist (2): Not clear that we still need these positions.
Audit Resolution - Fiscal Monitor (3): One position funded through RTTT which ends 12/2015.
36

37
INFRASTRUCTURE: FTE Update 2014
At the beginning of FY14 we had 153.45 approved FTEs. (We have a discrepancy of .20 with ANF.)
Administration and Finance has approved eight (8) additional positions as part of EEC’s FY14 budget:
• Chief of Staff: Hired• Deputy General Counsel: Hired with early permission• Licensors (5): Positions posted• Caseload Budget Manager: Interviews in process
Our revised current FTE total is 161.65 (prior to hiring fingerprinting staff).

38
INFRASTRUCTURE: Fingerprinting Update
Chapter 459 of the Acts of 2012 (as amended by Chapter 77 of the Acts of 2013):
Requires and authorizes EEC to conduct fingerprint-based checks of the state and national criminal history databases.
Requires EEC to conduct Sex Offender Registry Information (SORI) checks.
Effective September 1, 2013.
In this new process EEC will review:
SORI data (for all types of care).
FBI (fingerprint) data (for all types of care including employees/volunteers/interns of EEC licensed and/or funded programs and transportation providers but excludes informal relative caregivers).
CORI and DCF data (for family child care-related individuals, all Licensees and Reviewers, and in home, non-relative care providers).

39
INFRASTRUCTURE: Fingerprinting Update
Because of the new responsibilities placed on EEC, Administration and Finance has approved eleven (11) additional positions to fulfill EEC’s responsibilities relative to fingerprinting as follows:
• Program Coordinators (5): These positions will handle the administrative aspect of the BRC process: tracking, updating, mailing, and filing results. They will provide TA to programs and applicants.
• Reviewers (5): These positions will review discretionary applications and review rationales for decisions.
• Application Developer: This position will build an enhanced database and maintain the CORI / BRC databases.
40
INFRASTRUCTURE FY15 Request for New Positions
FIELD STAFF
Assistant Deputy Commissioner for Field Operations (1): $80,000• The Deputy Director of Field Operations for EEC is responsible for the
management of the day to day operations of the licensing, policy implementation, and regional office functions for a geographical area of the Commonwealth. This management responsibility requires setting priorities, deploying resources, directing and guiding agency direct service staff, and assuring consistency in operations amongst regional offices and licensing units. This management responsibility also includes maintaining the integrity of the policy, licensing, investigations, and regulatory compliance functions through monitoring and maintaining effective internal controls and quality assurance processes.
Licensors (5): $57,000• The licensing specialists will provide support to the programs the agency
licenses in order to provide quality early learning environments for the 250,000 Massachusetts children the agency is responsible for. The current caseload ratio for family child care licensors is 280 licenses to 1 licensor. In group child care the ratio is 104 licenses to 1 licensor. The addition of 5 licensing staff will reduce the caseload ratios to approximately 250 to 1 for family child care and 85 to 1 for group child care. This would bring Massachusetts closer to the recommended national standards of 75 to 1 for family child care and 50 to 1 for group child care.

41
INFRASTRUCTURE FY15 Request for New Positions
FINANCE UNIT
Fiscal and Grant Monitors / Auditors (2): $66,000
• Ensure that funding awarded by EEC through grants is spent according to the requirements of the grant, the terms and conditions of the contract, and according to the applicable regulations of the state oversight agency (Office of the State Comptroller, OSC) as well as federal regulations.
• Review grantee budgets and expenditures to ensure that the requirements of the grants are met.
• Conduct site visits to Contracted Providers and Child Care Resource and Referral agencies to determine compliance with the Commonwealth’s budgeting and pricing regulations and terms of the provider’s/CCRR contract.
• Conduct reviews of all contract provider and CCRR attendance and billing policies and providers oversight to any potential double billing occurrences.

42
INFRASTRUCTURE FY15 Request for New Positions
Transportation Monitor (1): $54,000
• Ensure that funding awarded by EEC for transportation services is spent according to the requirements of the grant, the terms and conditions of the contract, according to the applicable regulations of the state oversight agency (Office of the State Comptroller, OSC), Registry of Motor Vehicles and other federal regulations.
• Monitor transportation subcontract agreement between EEC Contract Providers, Child Care Resource and Referral agencies, and transportation companies to ensure that the requirements of the funding are met.
• Conduct site visits and desk review with contracted providers and Child Care Resource and Referral agencies to determine compliance with Transportation polices and oversight plans, passenger logs, billing, and attendance.
• Oversight of training requirements, monitoring of drivers in the PQR, and revision of policies as necessary.

43
INFRASTRUCTURE FY15 Request for New Positions
POLICY UNIT
Director of Workforce and Special Projects (1): $73,000• Oversee the Educator and Provider Regional Partnerships, which
includes 5 Educator Provider Support (EPS) Regional grantees.• Plan monthly EPS grantee meetings and EPS Liaison meetings.• Supervise 3 EPS liaisons at Central Office and the Professional
Qualifications Unit which includes 3 Teacher Qualifications Specialists.• Coordinate and oversee all Professional Development opportunities
including the PD Calendar and PQ Registry.
44
INFRASTRUCTURE FY15 Request for New Positions
Director of QRIS (1): $68,000• Support the MA QRIS through analysis, project development,
implementation, fiscal oversight, coordination and communication. • Ensure that the five key elements of the MA QRIS are embedded in
standards, plans, and policies that guide QRIS development across the mixed delivery system.
• Facilitate monthly program Quality Specialist Unit meetings, including development of agendas and assignments of QRIS related projects and tasks.
• Coordinate activities to produce RFP and other competitive bidding processes required for the implementation of the MA QRIS. Design public awareness and consumer education program to ensure families are knowledgeable about QRIS.
Program Quality Specialists (2): $65,000• Provide technical assistance to educators and providers in an
assigned region. Develop an understanding of unique community needs and act as a liaison for programs, providers, schools, EPS grantees, and Readiness Centers.
• Review QRIS applications by programs and verify self-assessed level of standards and documentation. In coordination with EEC regional Licensors, conducts site visits to programs to provide technical assistance for efforts to improve quality. Plan, prepare, and conduct QRIS training sessions.
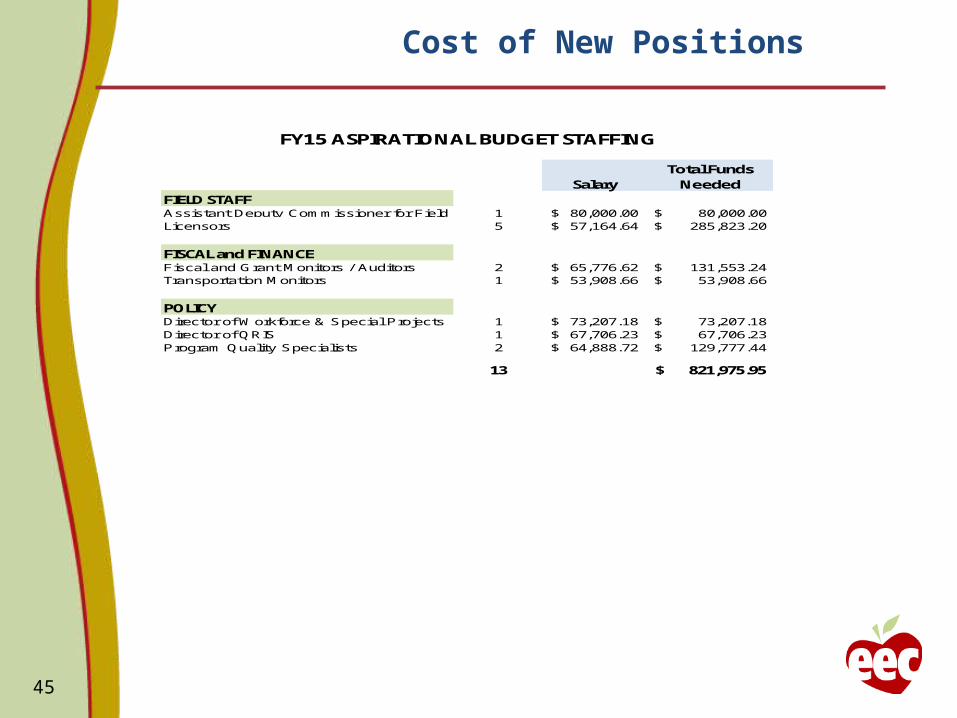
Cost of New Positions
45
SalaryTotal Funds
NeededFIELD STAFFAssistant Deputy Commissioner for Field Operations1 80,000.00$ 80,000.00$ Licensors 5 57,164.64$ 285,823.20$
FISCAL and FINANCEFiscal and Grant Monitors / Auditors 2 65,776.62$ 131,553.24$ Transportation Monitors 1 53,908.66$ 53,908.66$
POLICYDirector of Workforce & Special Projects 1 73,207.18$ 73,207.18$ Director of QRIS 1 67,706.23$ 67,706.23$ Program Quality Specialists 2 64,888.72$ 129,777.44$
13 821,975.95$
FY15 ASPIRATIONAL BUDGET STAFFING

Recommendations
46
This presentation presents the following recommendations made by the Fiscal Committee:
An Investment in Quality: $19,479,628Aligned with our mission and our Strategic Plan, we will invest in quality through and by the following:• Investment in Workforce Quality: A rate increase of 3% or $13,657,652
supports an increase in salaries, benefits, and stipends for child care workers.
• Investment in Quality Program Sustainability / Quality Rating Improvement System (QRIS): A set-aside of $5M supports our investment in QRIS and helps sustain program improvements supporting children in care.
• Quality Infrastructure: $821,976 to support staffing which holds child care providers accountable for health and safety, quality care, and quality programs.
An Investment in our Children and Families: $49,842,695• Access will be opened for preschool age children.
An Investment in Transportation: $17,586,713• This request for funds affirms the Board’s vote in June 2012 to increase the
rate paid for transportation to support improvements in the system and the addition of one adult monitor on all vehicles carrying infants, toddlers, and preschool children.
Total Funding Request: $86,909,036

Proposed FY15 EEC Budget
47
Line Item DescriptorProposed FY15
Budget
3000-1000 Administration $ 13,094,875.00 New Staff $ 821,976.00
3000-2000 Access Management $ 6,573,862.00
3000-3000Innovative Curriculum in Preschool $ 250,000.00
3000-3050 Supportive $ 78,977,039.00 Additional Supportive $ 6,618,810.00
3000-4050 TANF Related Child Care $ 134,398,656.00
3000-4060 Income Eligible Child Care $ 237,198,643.00
Additional Income Eligible $ 43,223,885.00
Rate Increase $ 13,657,652.00
Transportation $ 17,586,713.00
3000-4070 Waitlist Remediation $ 14,300,000.00
3000-5000 Grants to Head Start $ 8,100,000.00
3000-5075 UPK $ 7,500,000.00
3000-6075 Mental Health $ 750,000.00
3000-7050 Services for Infants and Parents $ 18,164,890.00
Quality $ 5,000,000.00
3000-7070 Reach Out and Read $ 750,000.00
606,967,001.00$