
FY 2020 Earnings Presentation
17
1 March 22, 2021 FY 2020 Earnings Presentation
Transcript of FY 2020 Earnings Presentation
1
March 22, 2021
FY 2020 Earnings Presentation
2
This confidential document is provided for informational purposes only. THE INFORMATION SET OUT IN THIS PRESENTATION AND PROVIDED IN THE DISCUSSION SUBSEQUENT THERETO DOES NOT CONSTITUTE AN OFFER OR SOLICITATION OF AN OFFER TO BUY OR SELL SECURITIES IN ANY JURISDICTION. IT IS SOLELY FOR USE AT AN INVESTOR PRESENTATION AND IS PROVIDED AS INFORMATION ONLY. THIS PRESENTATION DOES NOT CONTAIN ALL THE INFORMATION THAT IS MATERIAL TO AN INVESTOR. THIS PRESENTATION HAS BEEN PREPARED BY AND IS THE SOLE RESPONSIBILITY OF MEZZAN HOLDING COMPANY (“MEZZAN” OR THE “COMPANY”). You must not place any reliance for any purpose whatsoever on the information contained in this document. No representation or warranty, express or implied, is given by or on behalf of Mezzan or any other person as to the accuracy or completeness of the information or opinions contained in this document and no liability whatsoever is accepted by Mezzan or any other person for any loss howsoever arising, directly or indirectly, from any use of such information or opinions or otherwise arising in connection therewith. The information contained in this document has been obtained from sources prepared by other parties and it may not have been independently verified. The supply of this document does not imply that the information within is correct at any time subsequent to the date of this document. The information herein may be amended and supplemented and may not as such be relied upon for the purpose of entering into any transaction. This presentation may not be reproduced in whole or in part, distributed or transmitted to any other person without the Company's prior written consent. The information in this presentation and the views reflected there in are those of the Company and are subject to change without notice. All projections, valuations and statistical analyses are provided to assess the recipient in the evaluation of matters described herein. They maybe based on subjective assessments and assumption and may use one among alternative Methodologies that produce different results and to the extent that they are based on historical information, they should not be relied upon as an accurate prediction of future Performance. These Materials are not intended to provide the basis for any recommendation that any investor should subscribe for or purchase any securities. This presentation does not disclose all the risks and other significant issues related to an investment in any securities / transaction. Past performance is not indicative of future results. The Company is under no obligation to update or keep current the information contained herein. No person shall have any right of action against the Company or any other person in relation to the accuracy or completeness of the information contained in this presentation. No person is authorized to give any information or to make any representation not contained in and not consistent with this presentation and if given or made such information or representation must not be relied upon as having been authorized by or on behalf of the Company. This presentation does not constitute an offer or an agreement, or a solicitation of an offer or an agreement, to enter into any transaction (including the provision of any services). No assurance is given that any such transaction can or will be arranged or agreed. Certain statements in this presentation may constitute forward-looking statements. These statements reflect the company's expectation and are subject to risk and uncertainties that may cause actual result to differ materially and may adversely affect the outcome and financial effects of the plan described herein. You are cautioned not to rely on such forward-looking statements. The Company does not assume any obligation to update its view of such risk and uncertainties or to publicly announce the result of any revision to the forward-looking statements made herein. This document may contain forward-looking statements which, by their nature, involve a number of risks, uncertainties and assumptions that could cause actual results or events to differ materially from those expressed or implied by these statements. These risks, uncertainties and assumptions could adversely affect the outcome and financial effects of the plans and events described within this document. In particular, actual results may be adversely affected by future developments affecting inflation, interest rates, taxation, social instability or other economic, political or diplomatic or other matters. Forward-looking statements contained in this document that reference past trends or activities should not be taken as a representation that such trends or activities will continue.
Disclaimer
Tailwinds & Headwinds FY 2020 Highlights Historical Performance Financial Review Q&A
3
Agenda
➜➜➜➜
➜➜➜➜
➜
➜
➜
4
Mezzan Today: Tailwinds
Strong top line performance in Food M&D, FMCG and Healthcare
Enhanced operating margins
Enhanced profitability
➜➜➜➜
➜➜➜➜
➜
➜
➜
5
Mezzan Today: Headwinds
Supply chain disruptions for some portfolio items
Select market segments impacted by ongoing school closures in some countries
Interruptions of business in select areas due to lockdowns and curfews
One-off Covid-related costs, including staff relocation costs
Reduction of US troops in Afghanistan
Decline in Qatar catering segment
6
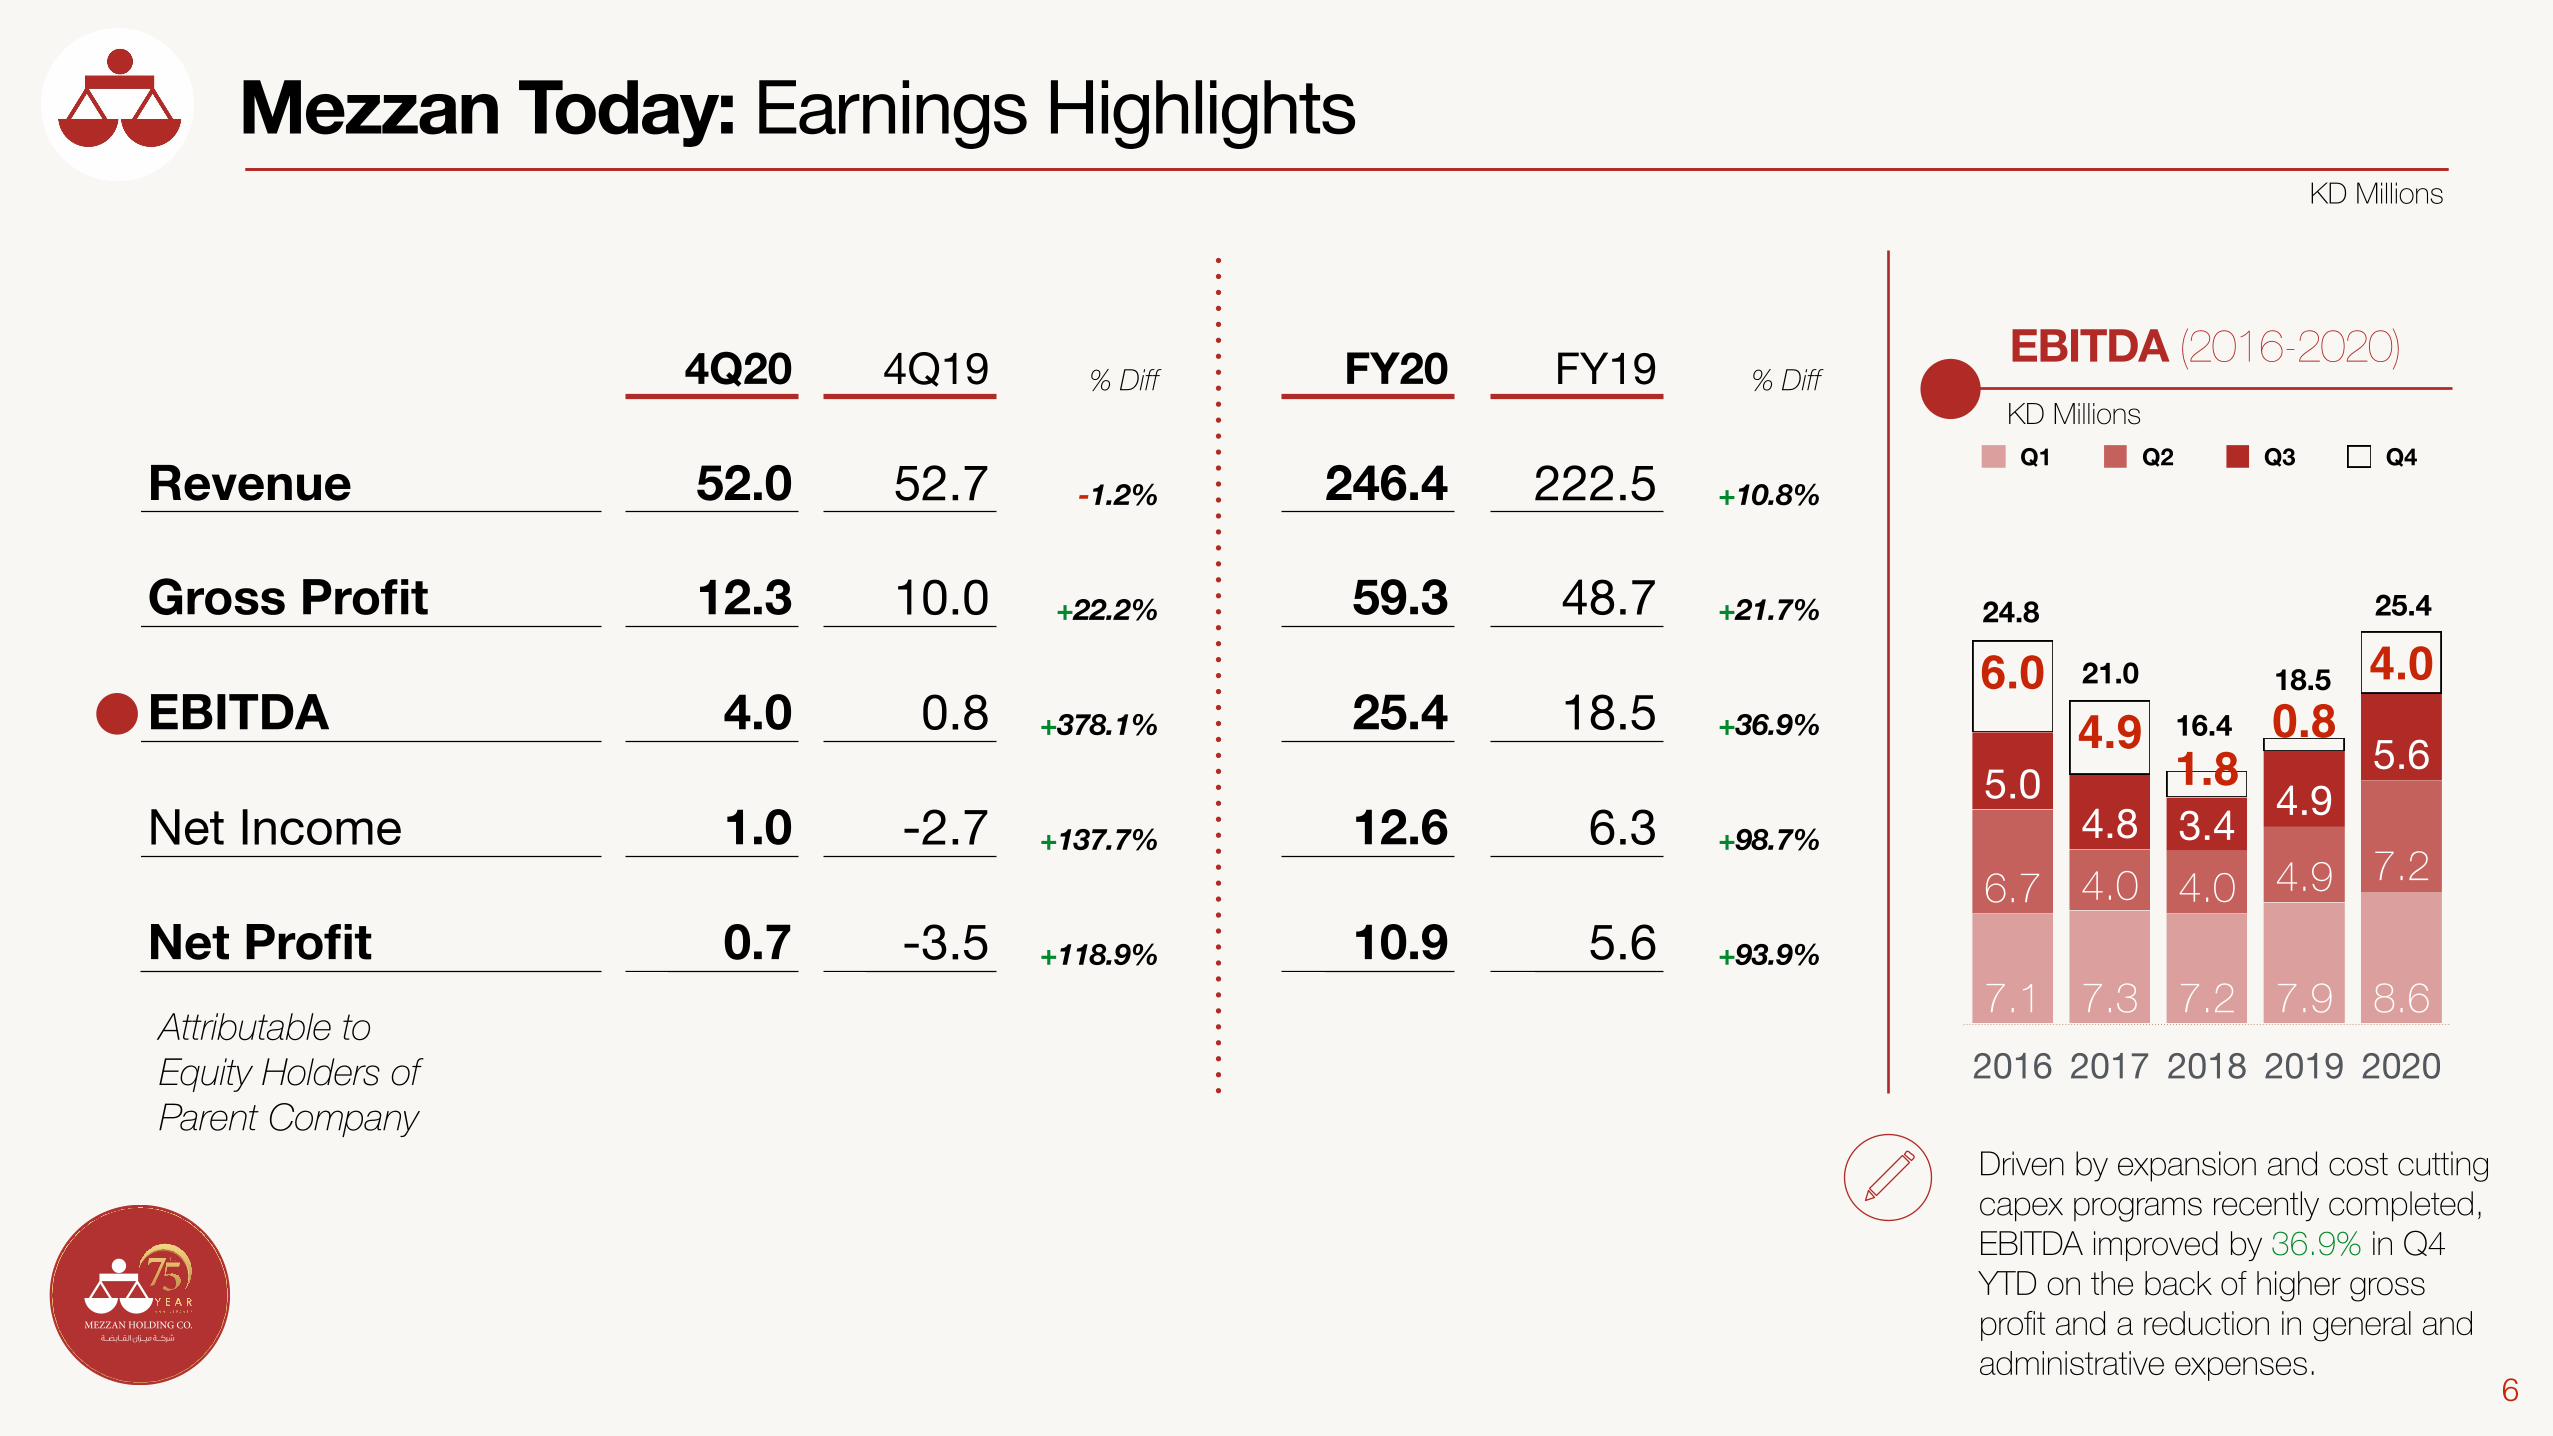
Mezzan Today: Earnings HighlightsKD Millions
KD Millions
EBITDA (2016-2020)
2016 2017 2018 2019 2020
4.00.8
1.84.9
6.05.6
4.93.44.85.0
7.24.94.04.06.7
8.67.97.27.37.1
Q1 Q2 Q3 Q4
Driven by expansion and cost cutting capex programs recently completed, EBITDA improved by 36.9% in Q4 YTD on the back of higher gross profit and a reduction in general and administrative expenses.
4Q20 4Q19 % Diff FY20 FY19 % Diff
Revenue 52.0 52.7 -1.2% 246.4 222.5 +10.8%
Gross Profit 12.3 10.0 +22.2% 59.3 48.7 +21.7%
EBITDA 4.0 0.8 +378.1% 25.4 18.5 +36.9%
Net Income 1.0 -2.7 +137.7% 12.6 6.3 +98.7%
Net Profit 0.7 -3.5 +118.9% 10.9 5.6 +93.9%
Attributable to Equity Holders of Parent Company
24.8
21.0
16.418.5
25.4
2016 2017 2018 2019 2020
246.4222.5
207.5204.5207.4 52.052.746.046.951.2
60.154.852.049.847.7
59.952.450.650.352.8
74.462.658.857.555.7
Q1 Q2 Q3 Q4
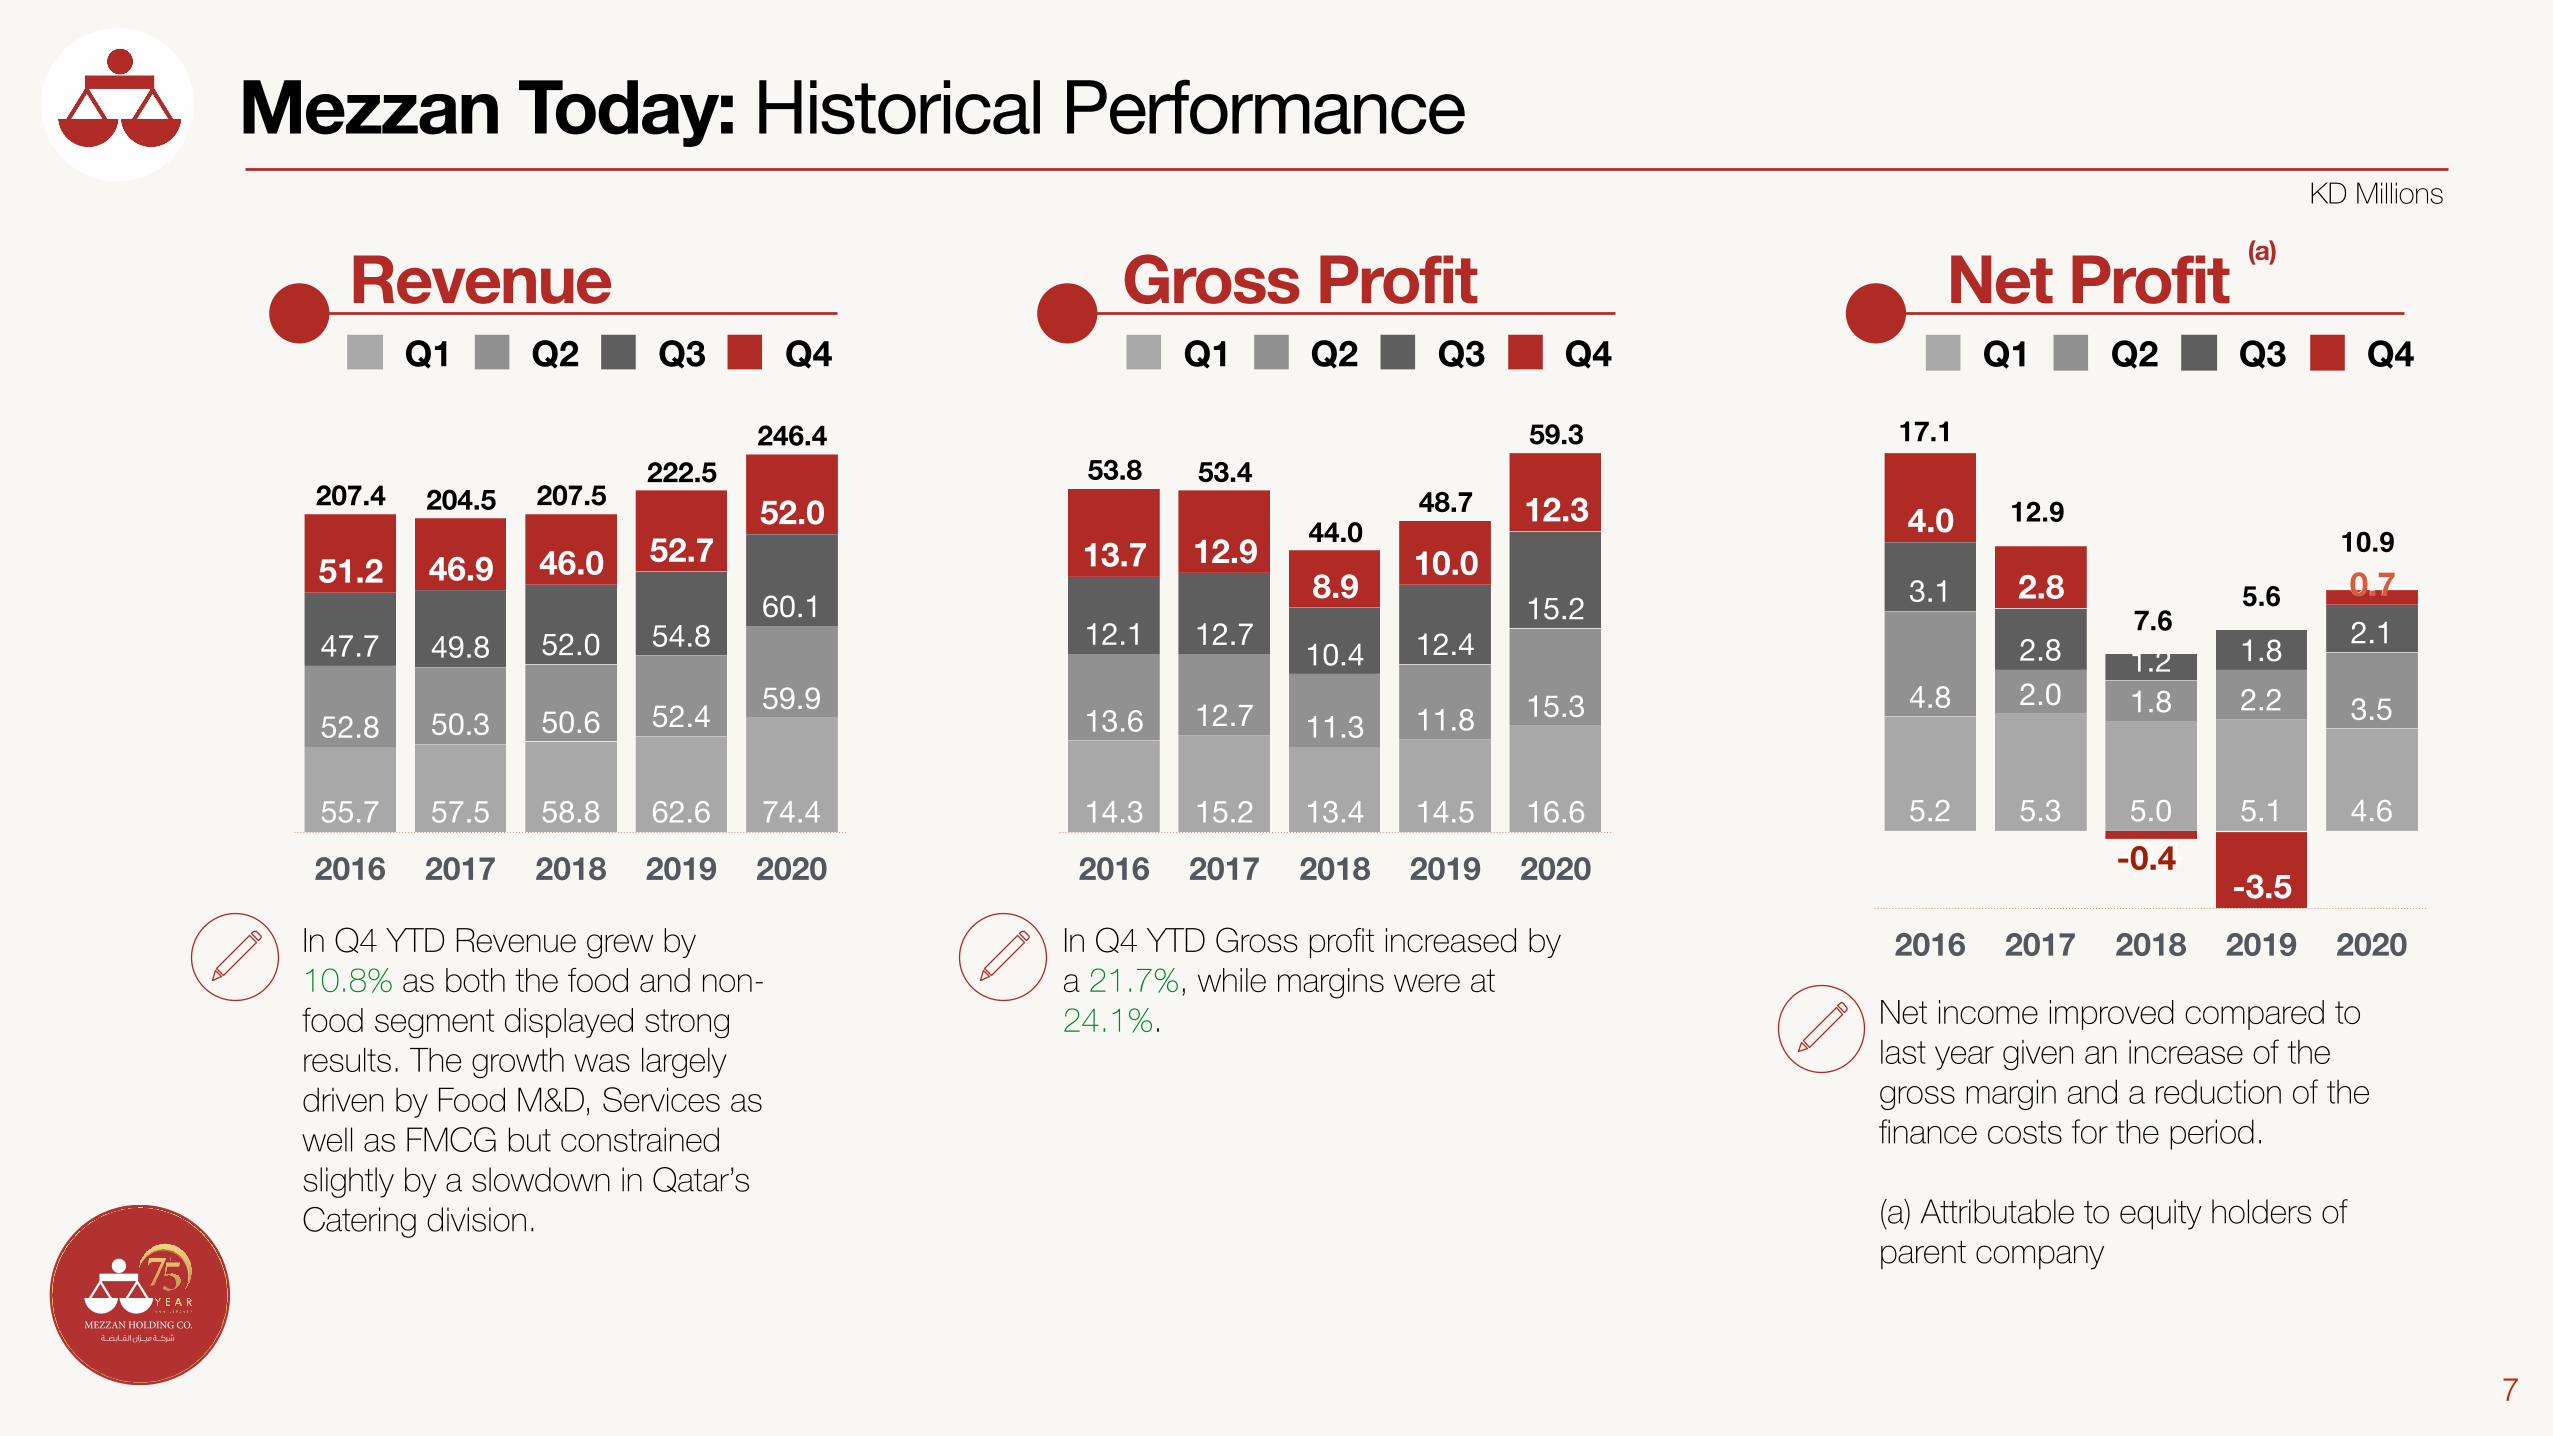
Net income improved compared to last year given an increase of the gross margin and a reduction of the finance costs for the period.
(a) Attributable to equity holders of parent company
Revenue Gross Profit Net Profit
7
Mezzan Today: Historical Performance
2016 2017 2018 2019 2020
59.3
48.744.0
53.453.812.3
10.08.912.913.7
15.212.410.412.712.1
15.311.811.312.713.6
16.614.513.415.214.3
Q1 Q2 Q3 Q4
2016 2017 2018 2019 2020
0.7
-3.5-0.4
2.8
4.0
2.11.81.22.8
3.1
3.52.21.82.04.8
4.65.15.05.35.2
Q1 Q2 Q3 Q4
KD Millions
In Q4 YTD Revenue grew by 10.8% as both the food and non-food segment displayed strong results. The growth was largely driven by Food M&D, Services as well as FMCG but constrained slightly by a slowdown in Qatar’s Catering division.
In Q4 YTD Gross profit increased by a 21.7%, while margins were at 24.1%.
(a)
-0.4
17.1
12.9
7.65.6
10.90.7

8
Financial Review
9
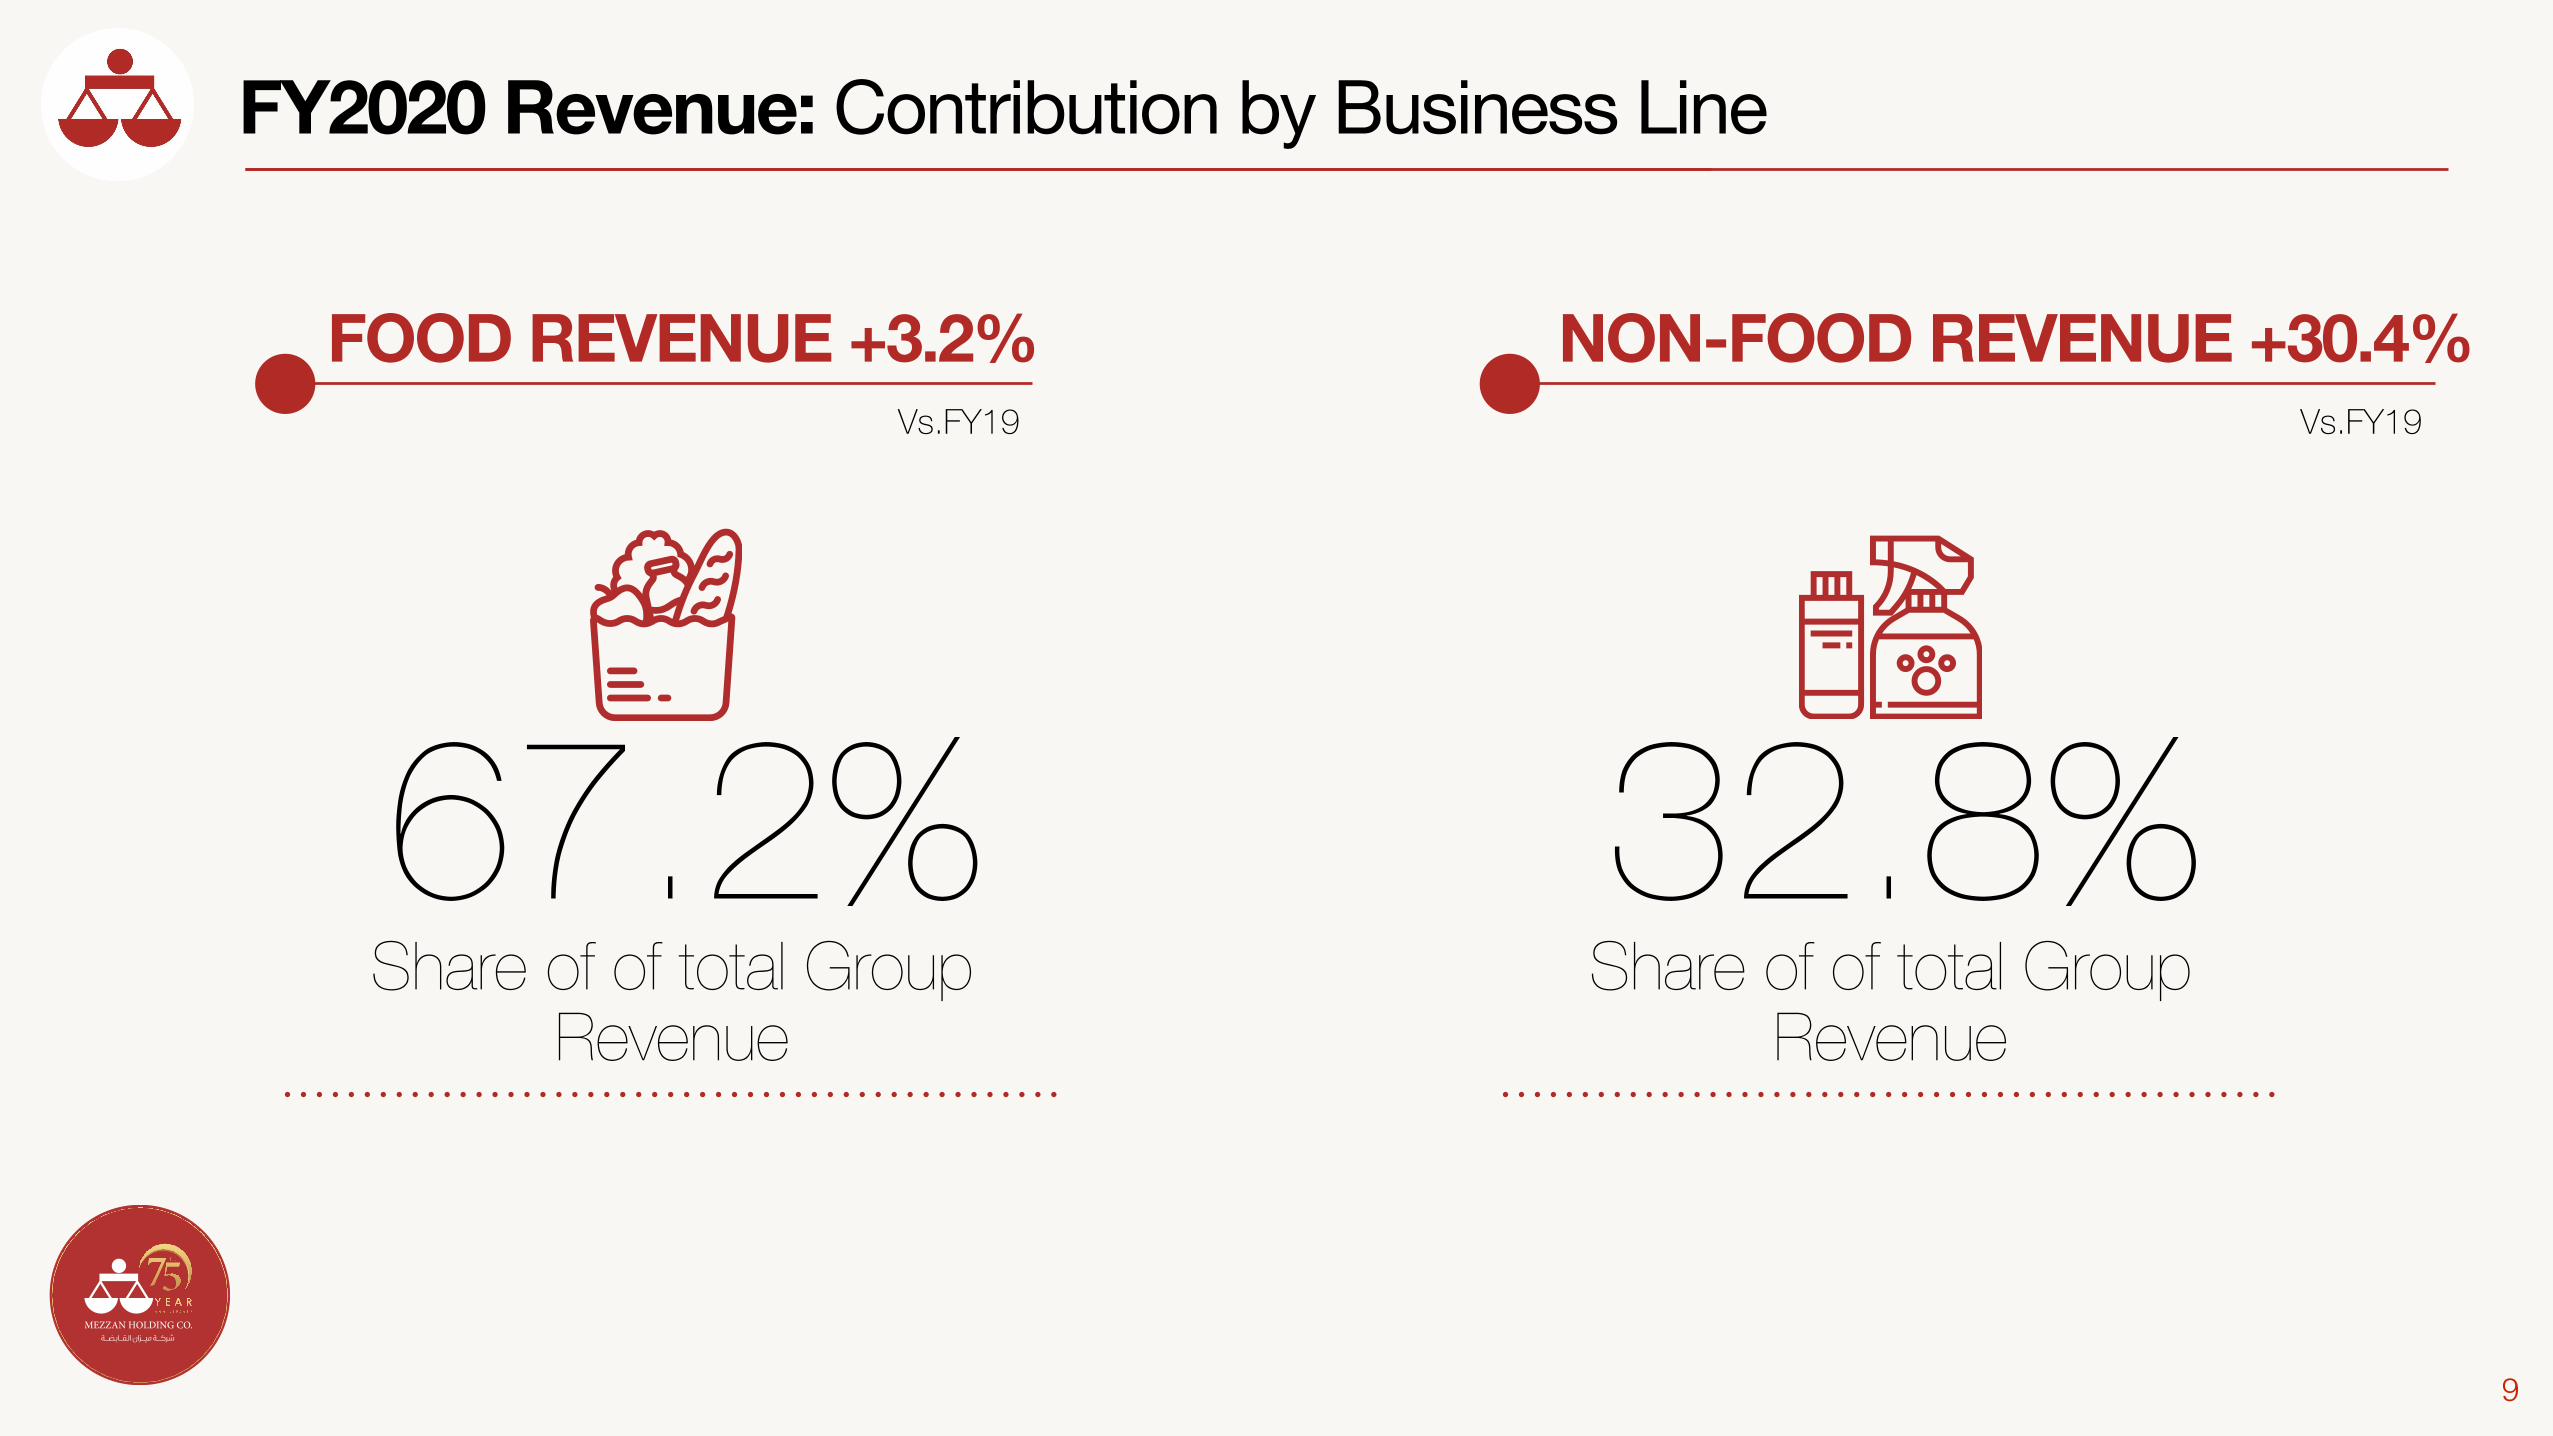
FY2020 Revenue: Contribution by Business Line
FOOD REVENUE +3.2% NON-FOOD REVENUE +30.4%
32.8% Share of of total Group
Revenue
67.2% Share of of total Group
Revenue
Vs.FY19 Vs.FY19
10
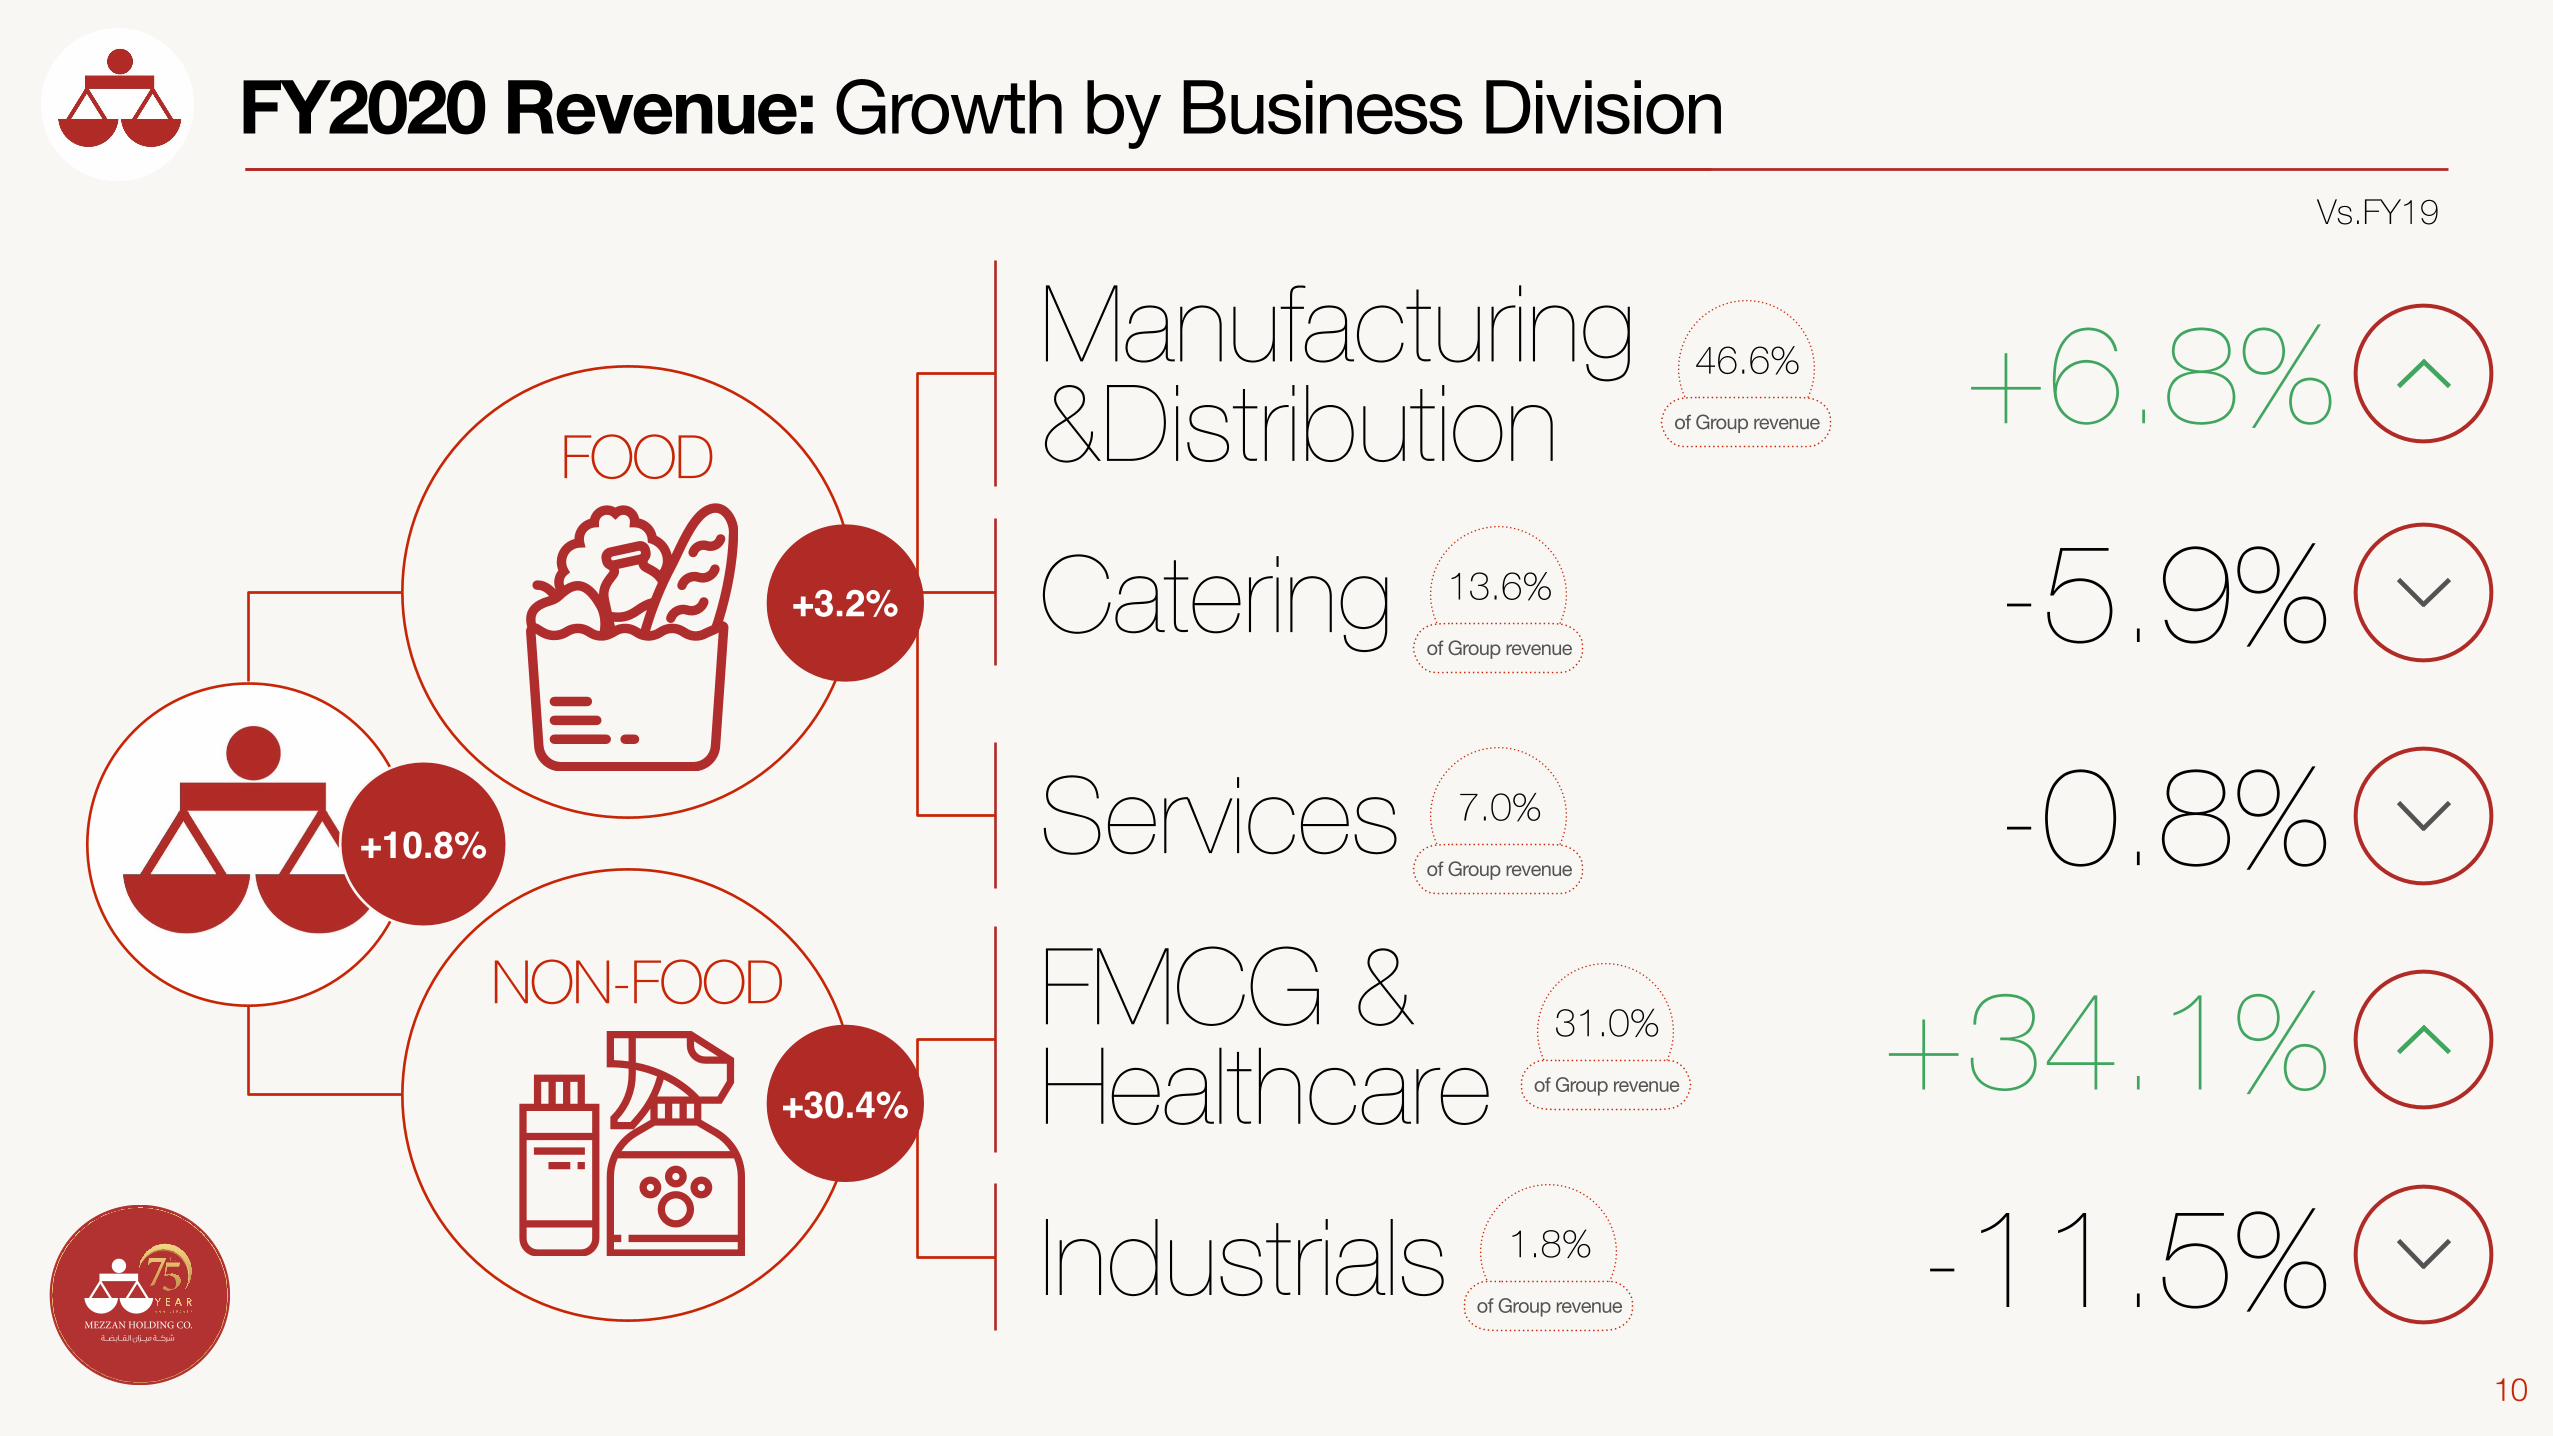
FY2020 Revenue: Growth by Business Division
+6.8% Manufacturing &Distribution
Services
Catering -5.9% -0.8%
FMCG & Healthcare +34.1% Industrials -11.5%
13.6%of Group revenue
7.0%of Group revenue
46.6%of Group revenue
31.0%of Group revenue
1.8%of Group revenue
+3.2%
+30.4%
FOOD
NON-FOOD
Vs.FY19
+10.8%
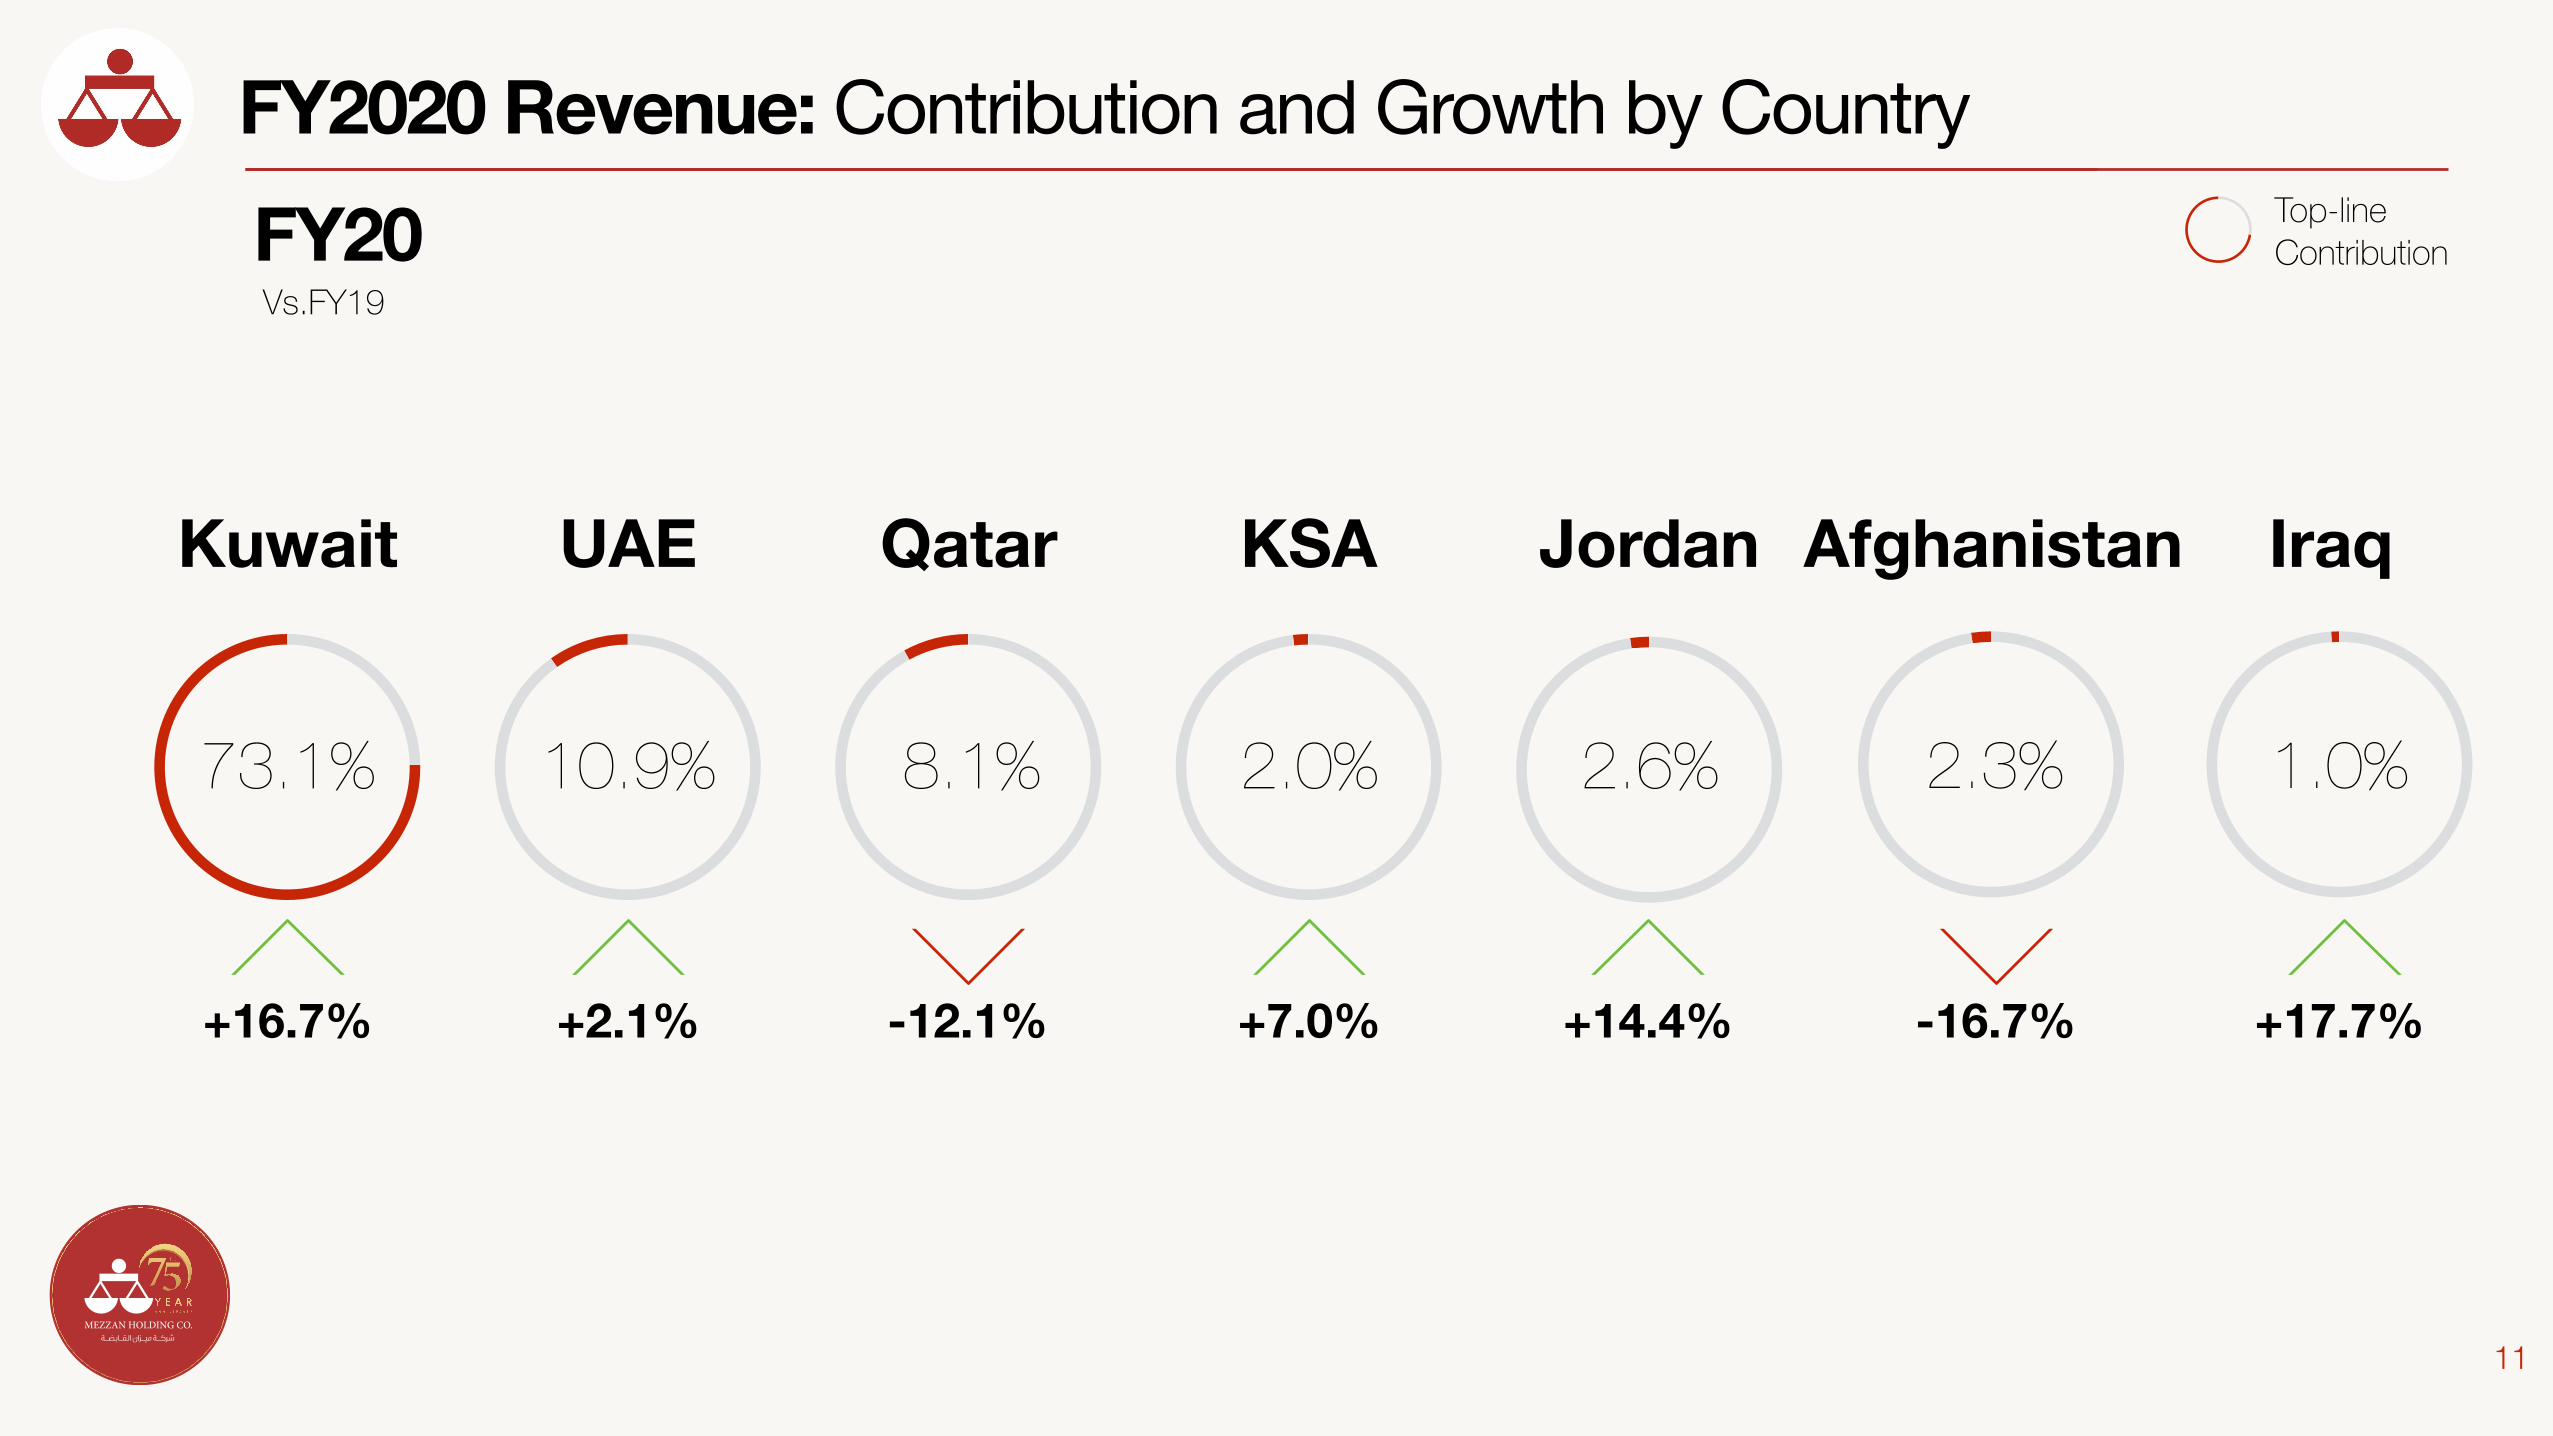
-12.1%
FY2020 Revenue: Contribution and Growth by Country
11
UAEKuwait Qatar KSA Jordan IraqAfghanistan
73.1% 10.9% 8.1% 2.0% 2.6% 1.0%
+16.7% +7.0% +17.7%
Vs.FY19FY20
+14.4% -16.7%
2.3%
Top-line Contribution
+2.1%
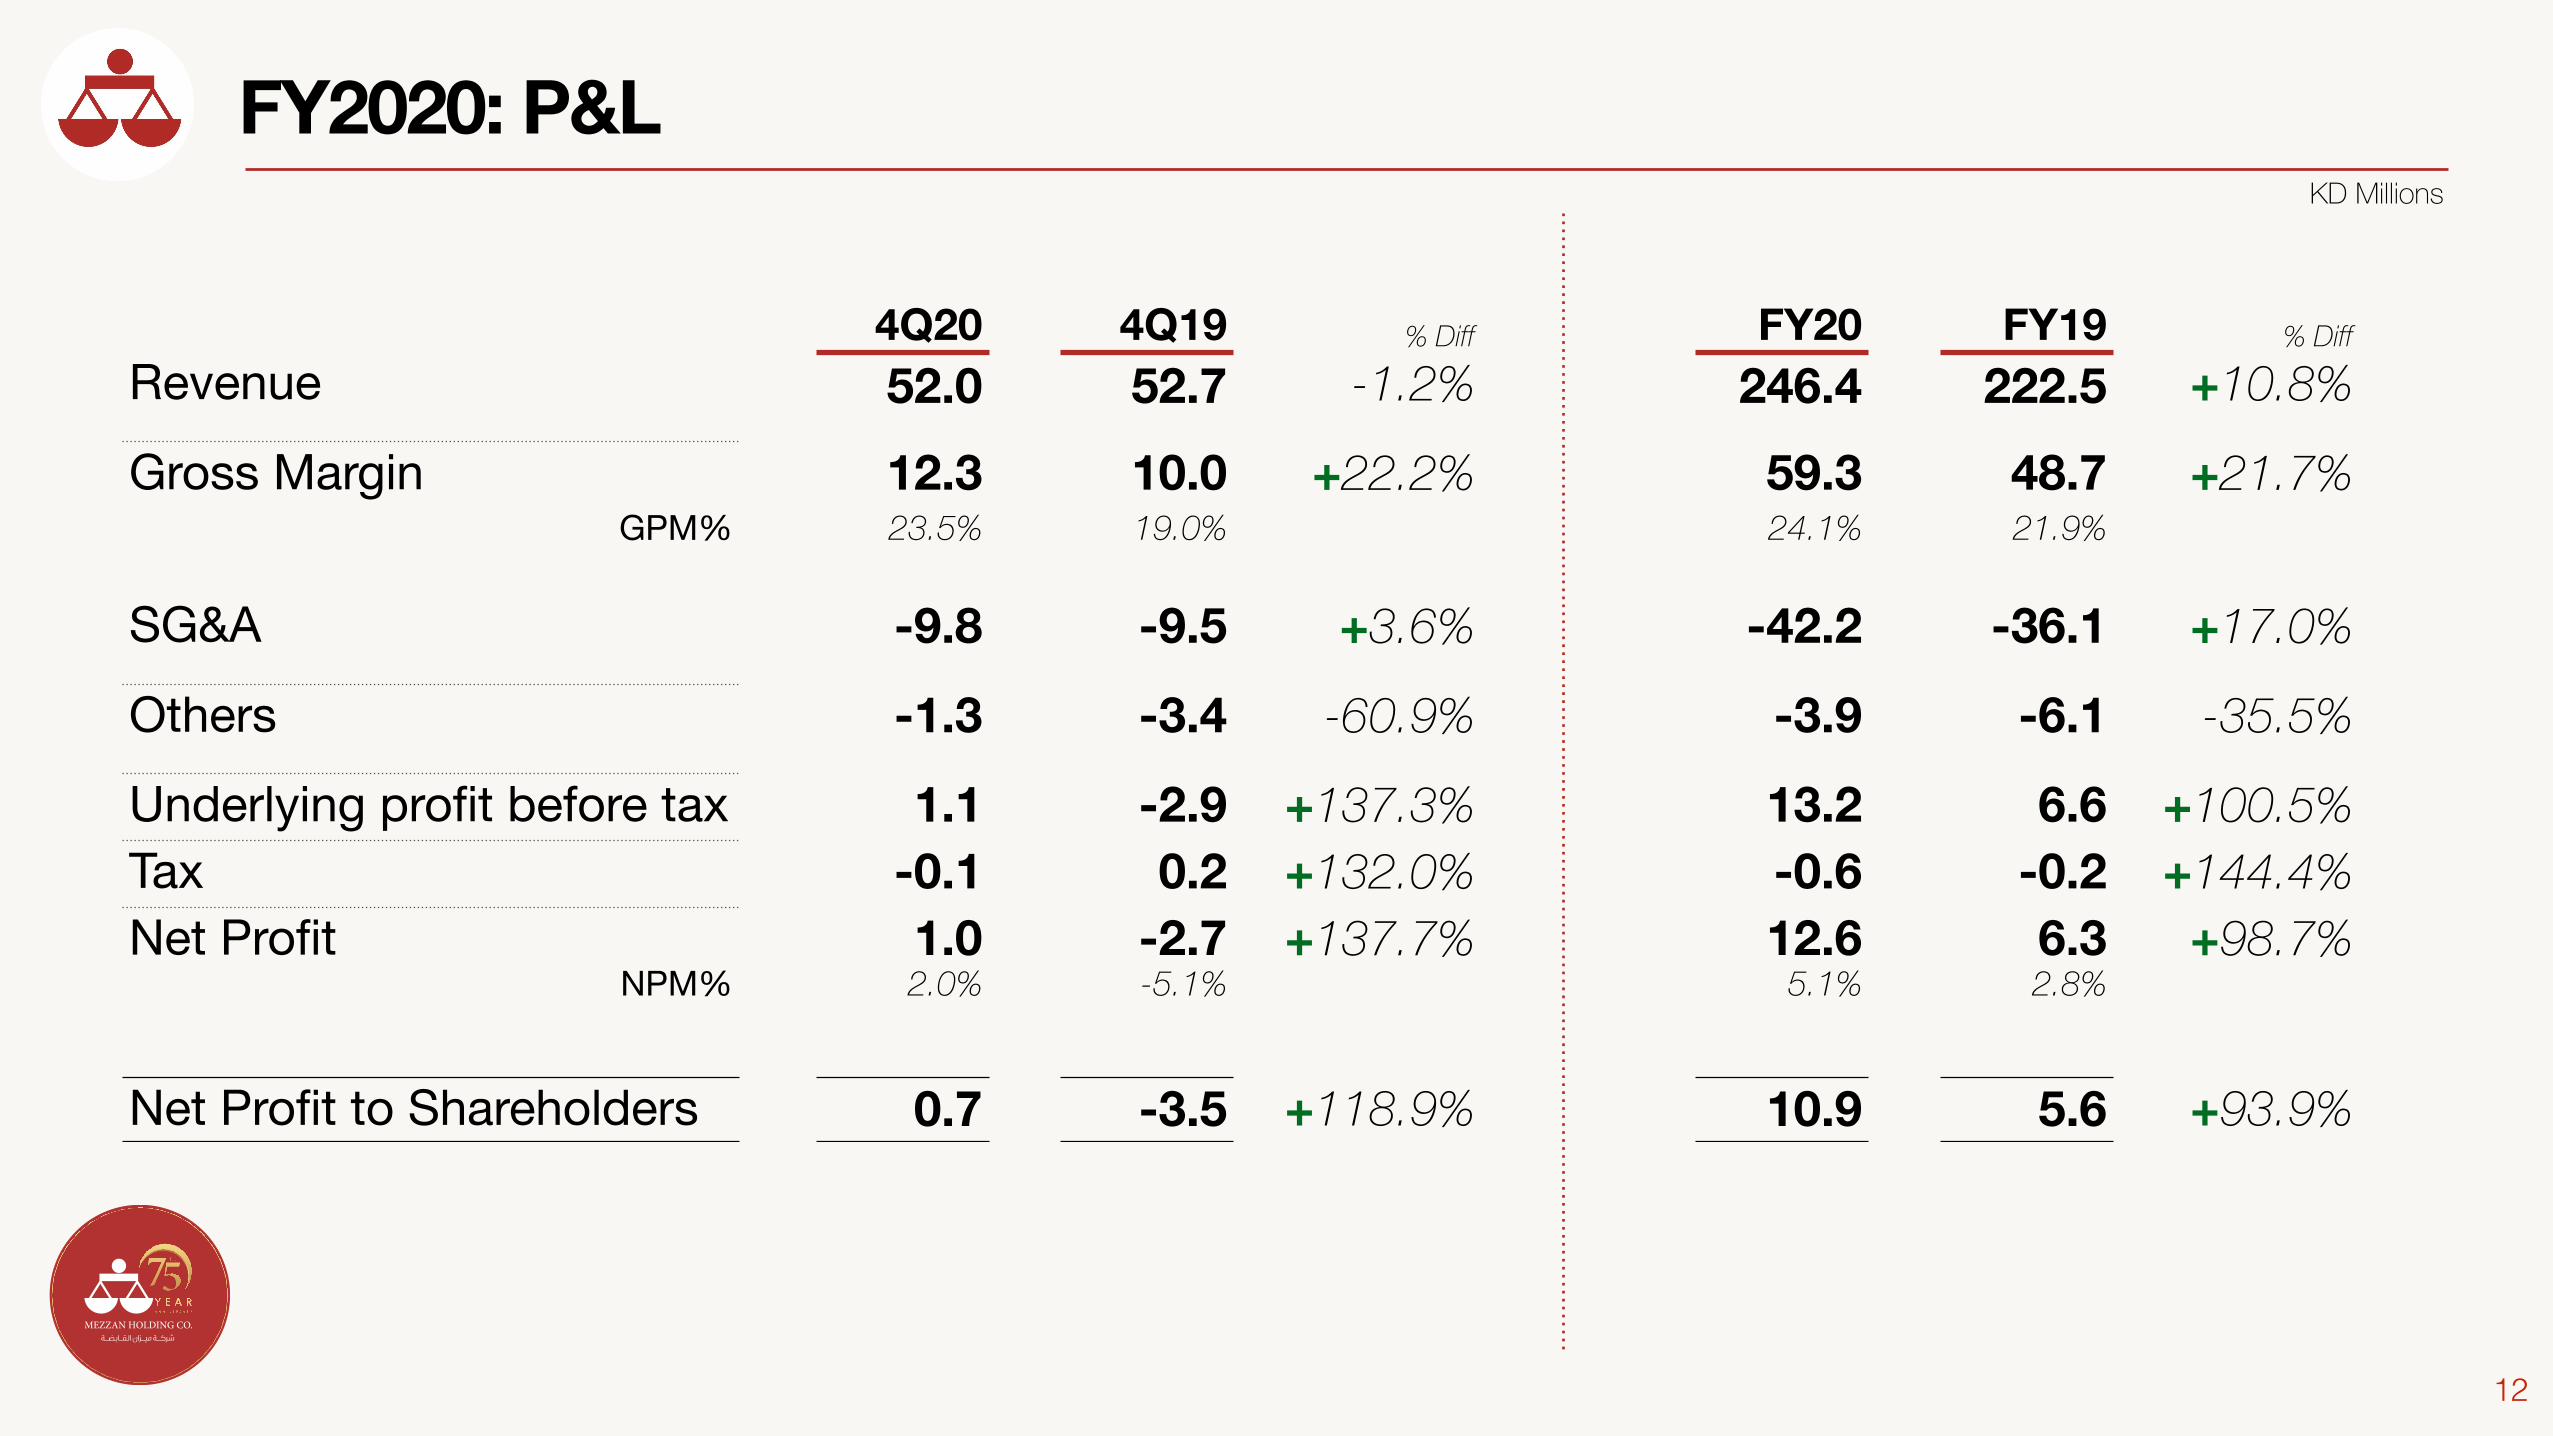
FY2020: P&LKD Millions
12
4Q20 4Q19 % Diff FY20 FY19 % Diff
Revenue 52.0 52.7 -1.2% 246.4 222.5 +10.8%
Gross Margin 12.3 10.0 +22.2% 59.3 48.7 +21.7%GPM% 23.5% 19.0% 24.1% 21.9%
SG&A -9.8 -9.5 +3.6% -42.2 -36.1 +17.0%
Others -1.3 -3.4 -60.9% -3.9 -6.1 -35.5%
Underlying profit before tax 1.1 -2.9 +137.3% 13.2 6.6 +100.5%Tax -0.1 0.2 +132.0% -0.6 -0.2 +144.4%Net Profit 1.0 -2.7 +137.7% 12.6 6.3 +98.7%
NPM% 2.0% -5.1% 5.1% 2.8%
Net Profit to Shareholders 0.7 -3.5 +118.9% 10.9 5.6 +93.9%
KD Millions
13
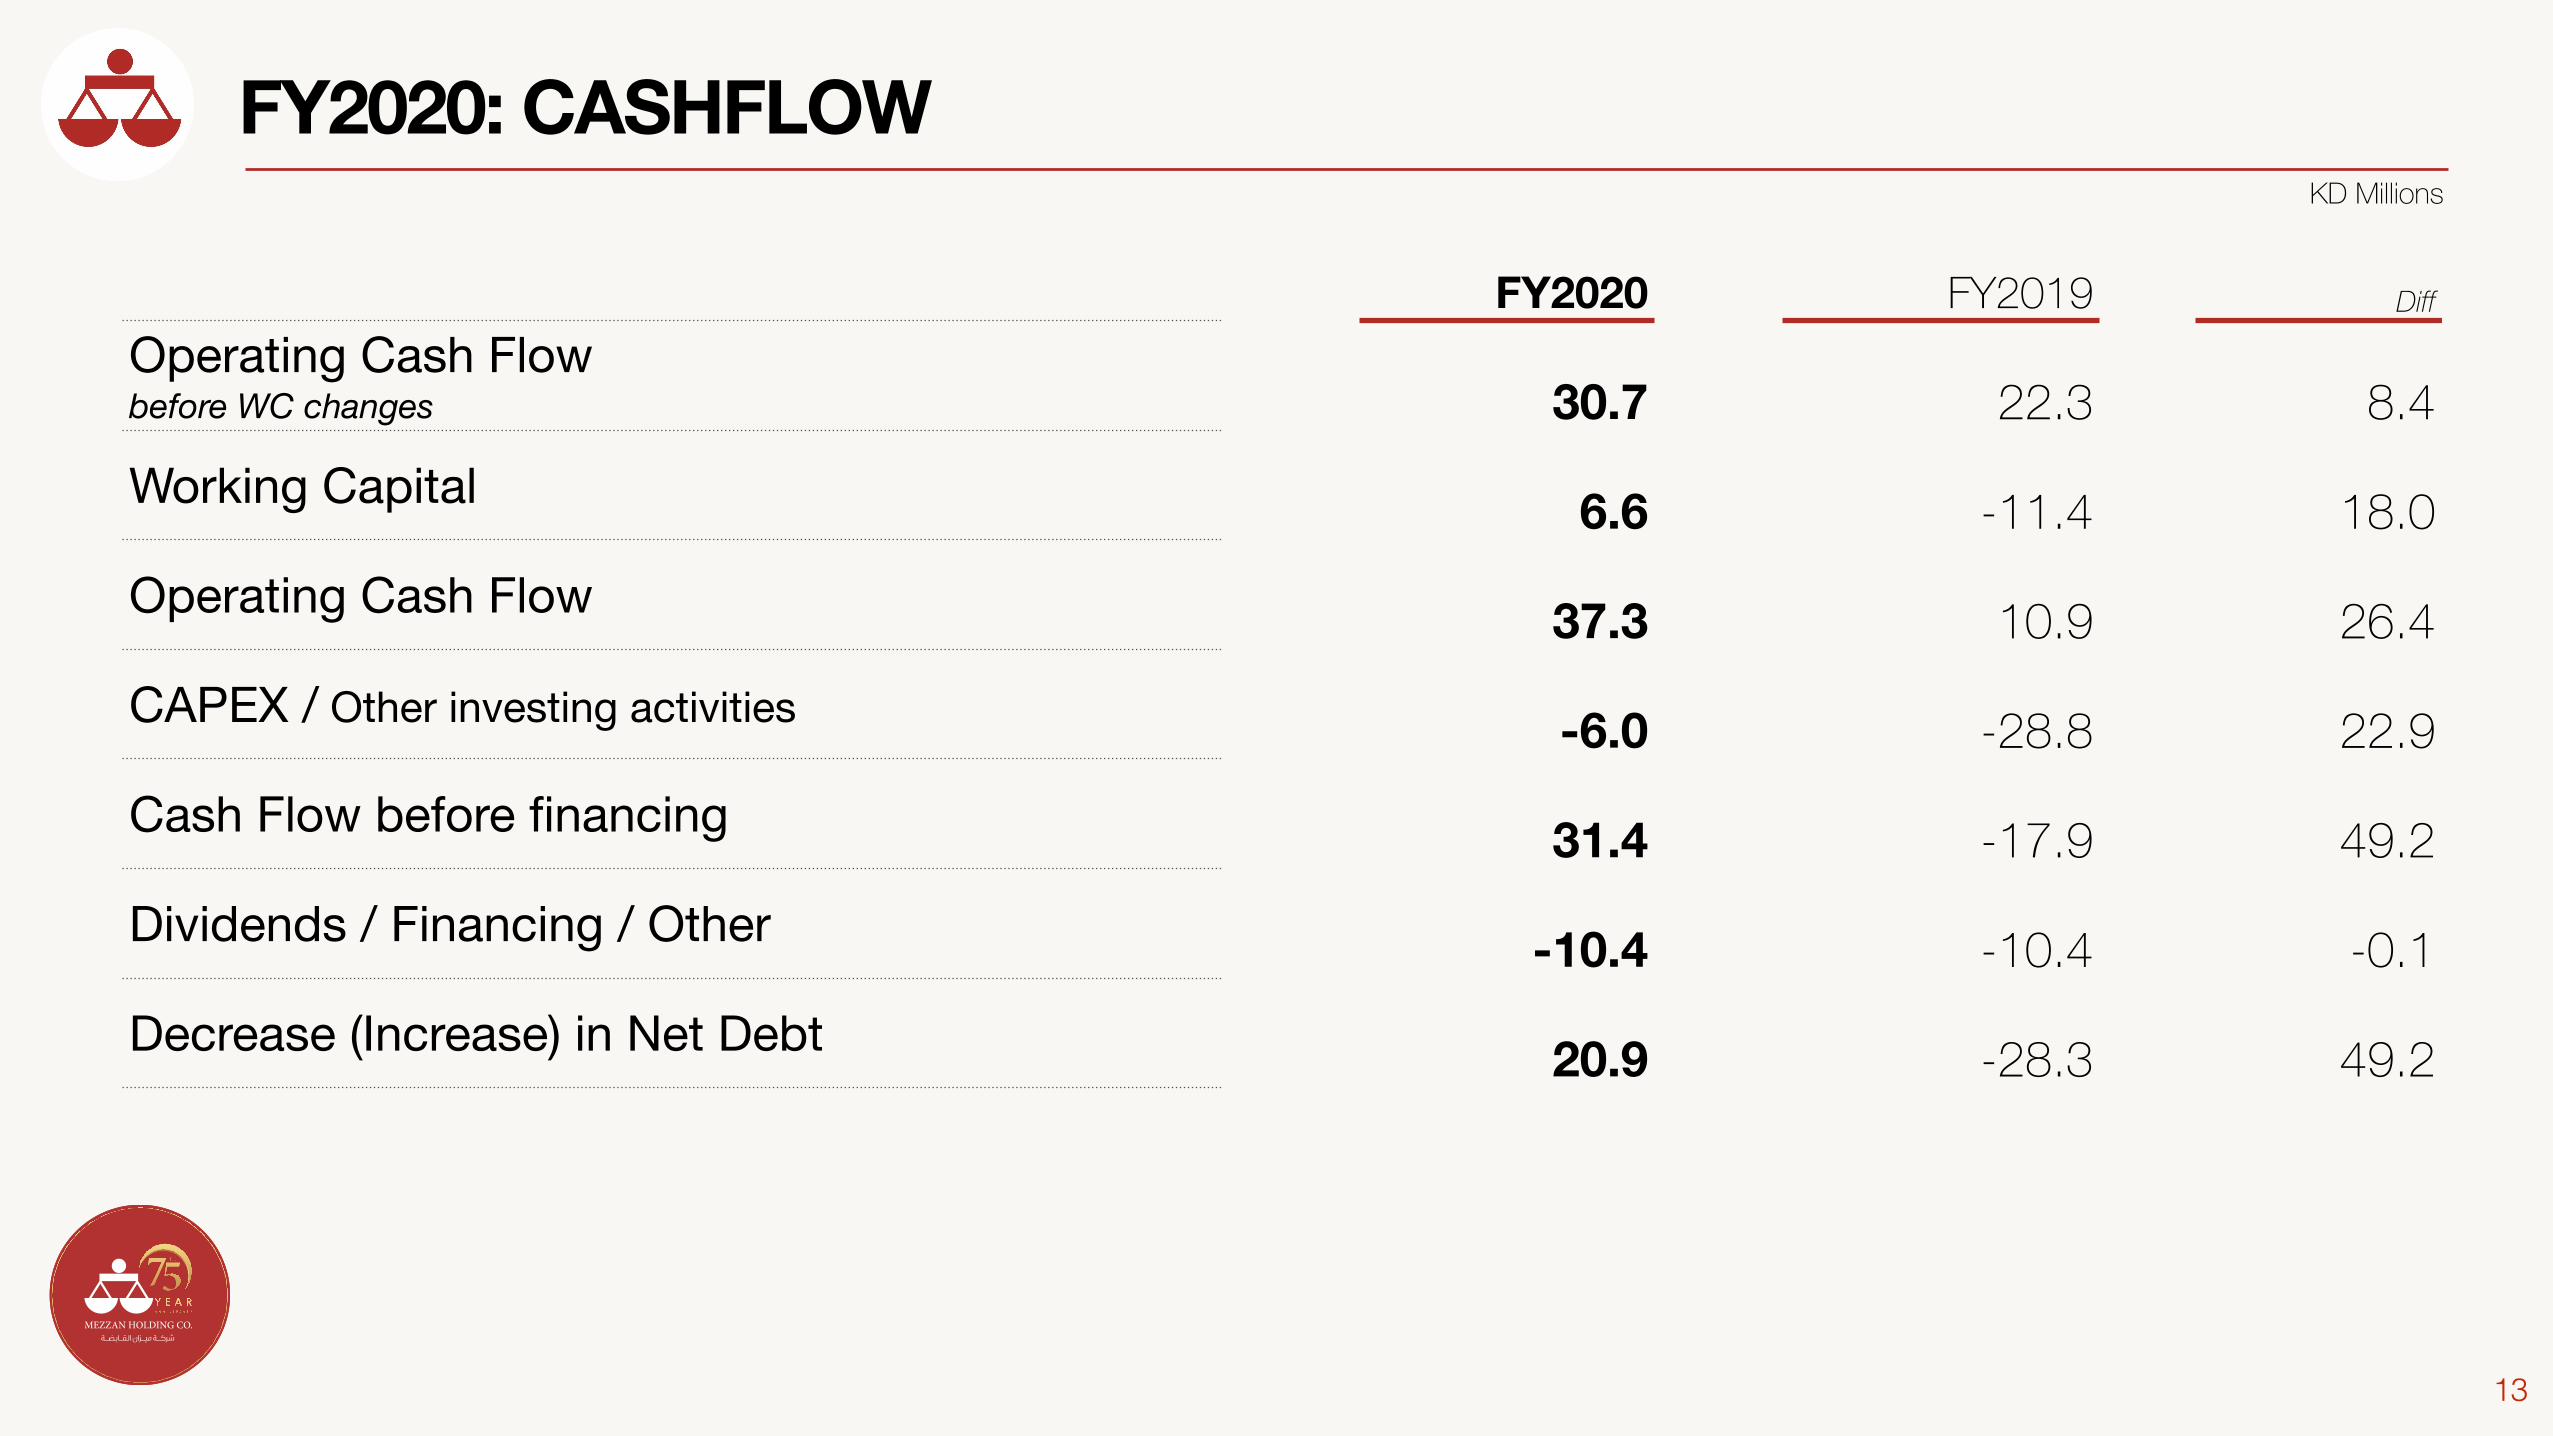
FY2020 FY2019 Diff
Operating Cash Flow before WC changes 30.7 22.3 8.4Working Capital 6.6 -11.4 18.0Operating Cash Flow 37.3 10.9 26.4CAPEX / Other investing activities -6.0 -28.8 22.9Cash Flow before financing 31.4 -17.9 49.2Dividends / Financing / Other -10.4 -10.4 -0.1Decrease (Increase) in Net Debt 20.9 -28.3 49.2
FY2020: CASHFLOW
14
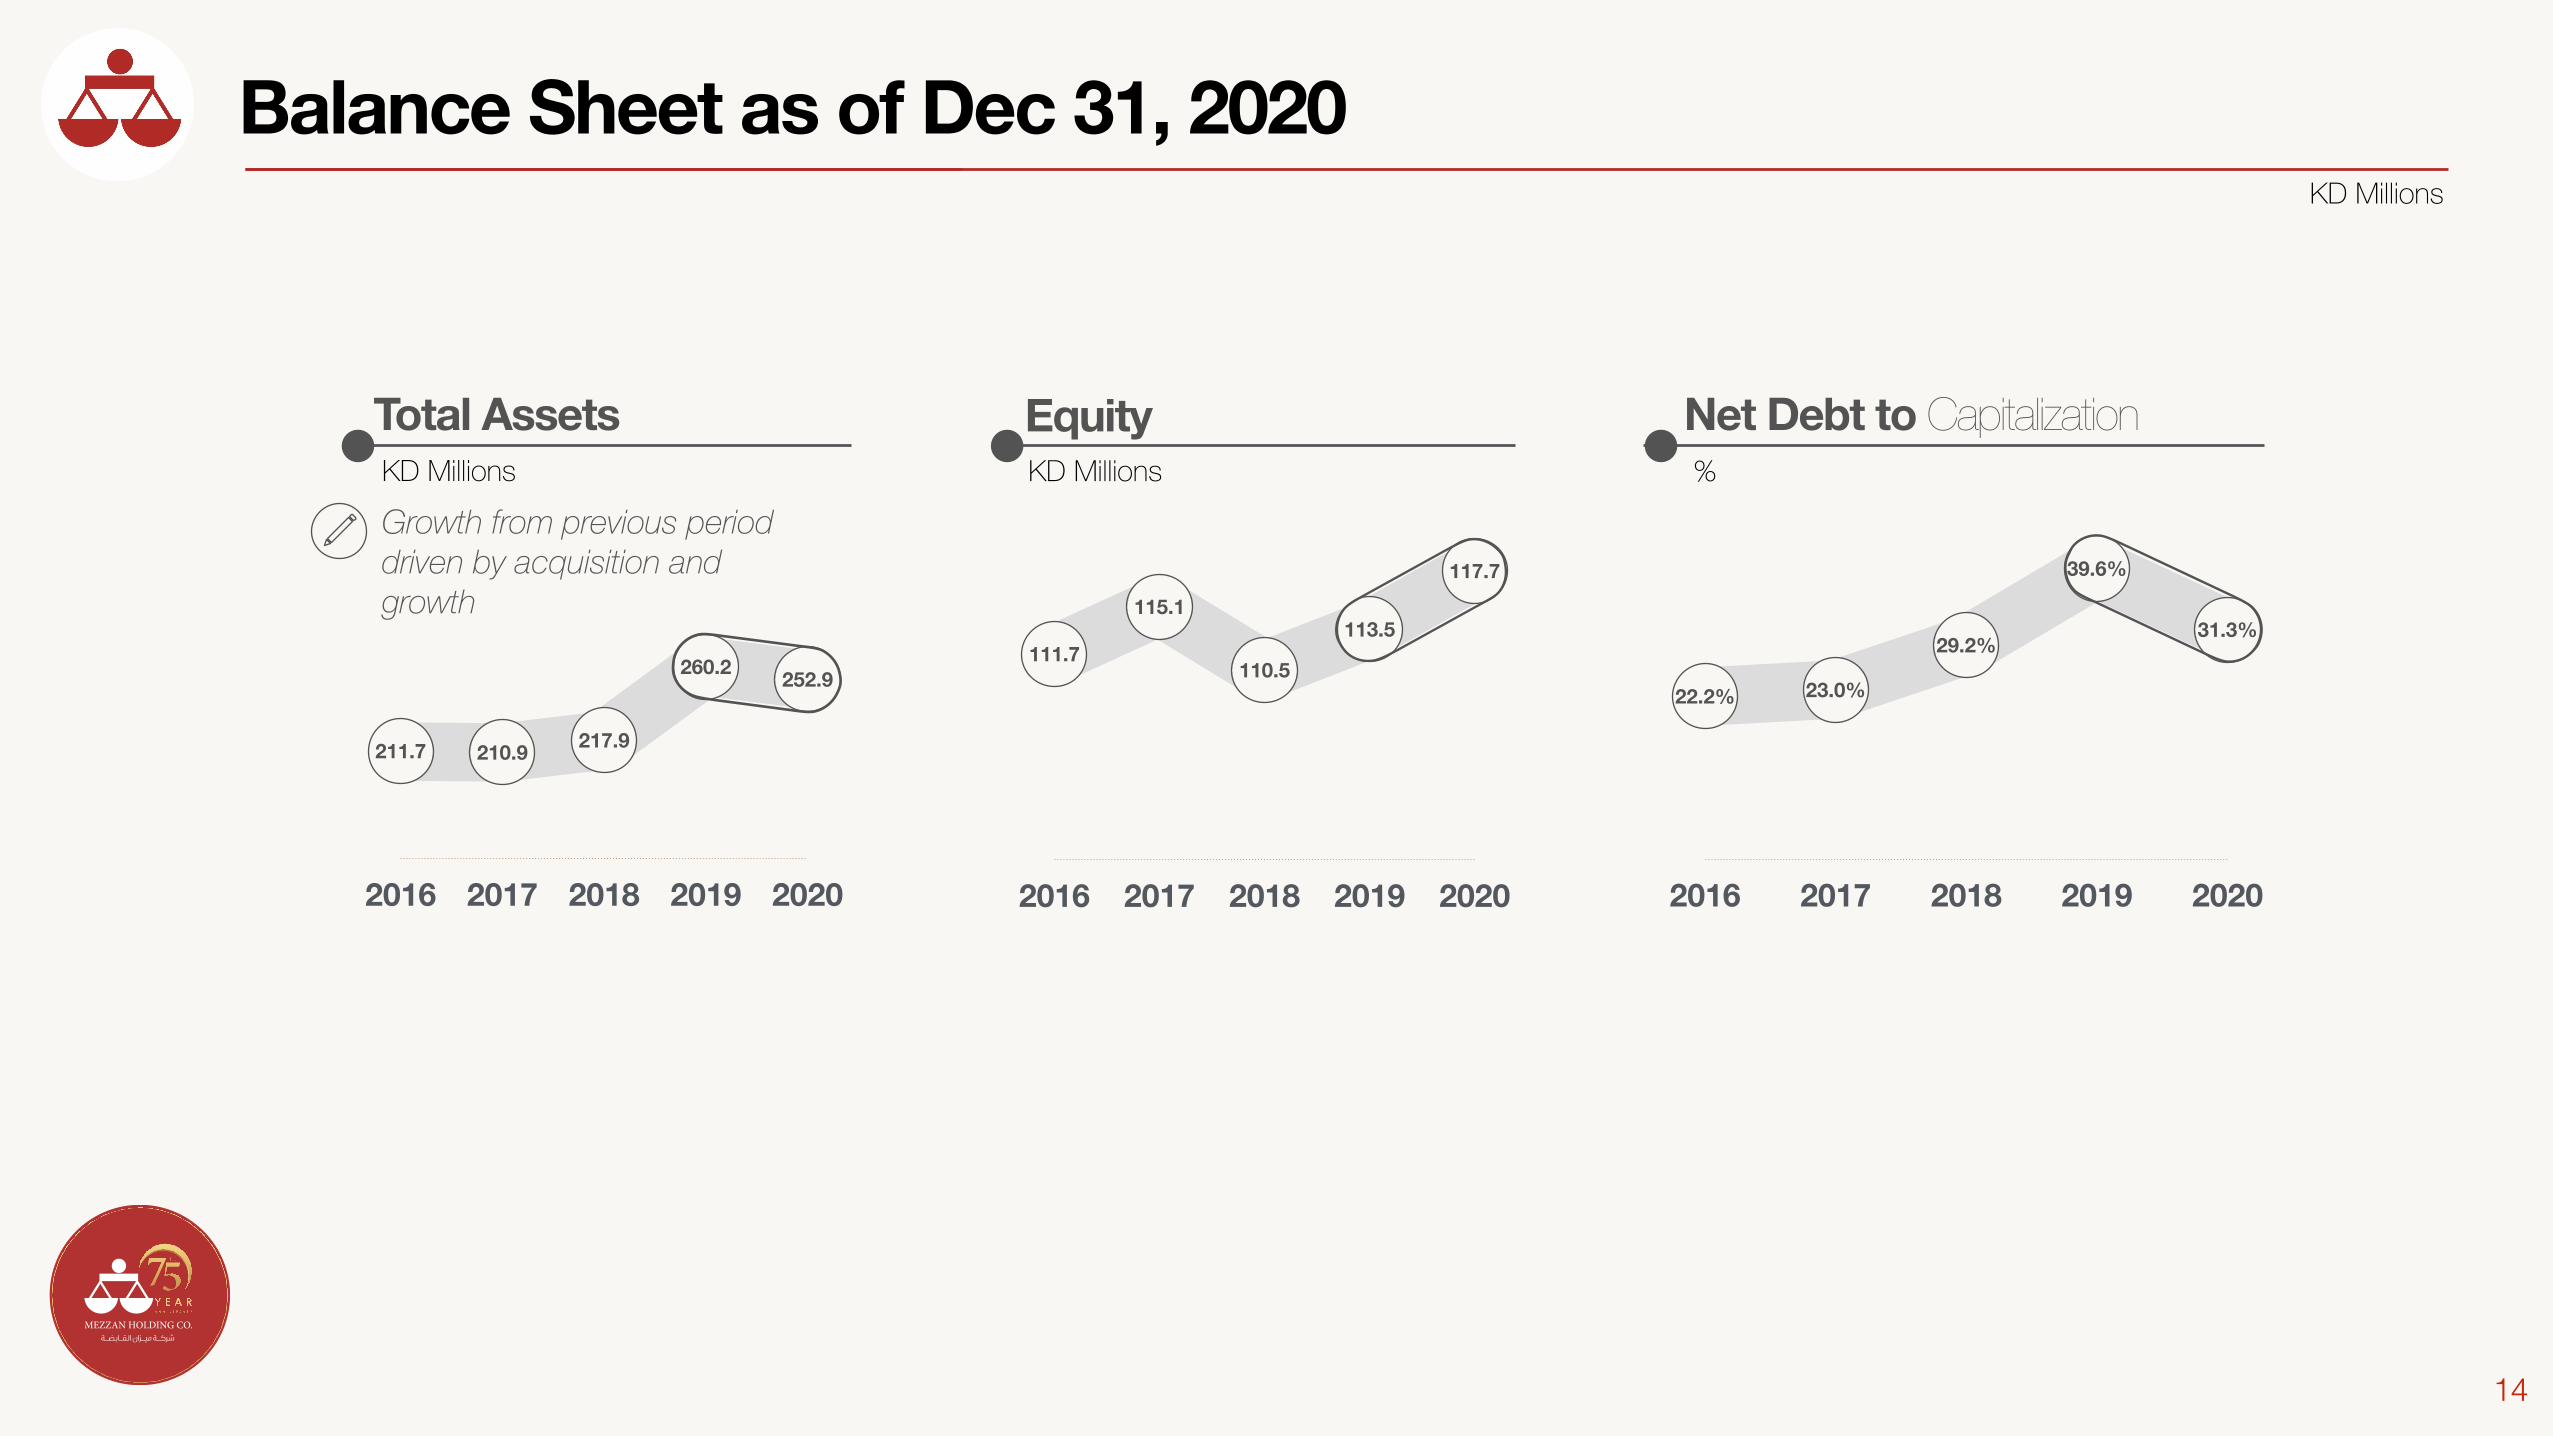
Balance Sheet as of Dec 31, 2020KD Millions
Growth from previous period driven by acquisition and growth
Net Debt to Capitalization%
2016 2017 2018 2019 2020
31.3%
39.6%
29.2%
23.0%22.2%
KD MillionsTotal Assets
2016 2017 2018 2019 2020
252.9260.2
217.9210.9211.7
EquityKD Millions
2016 2017 2018 2019 2020
117.7
113.5
110.5
115.1
111.7
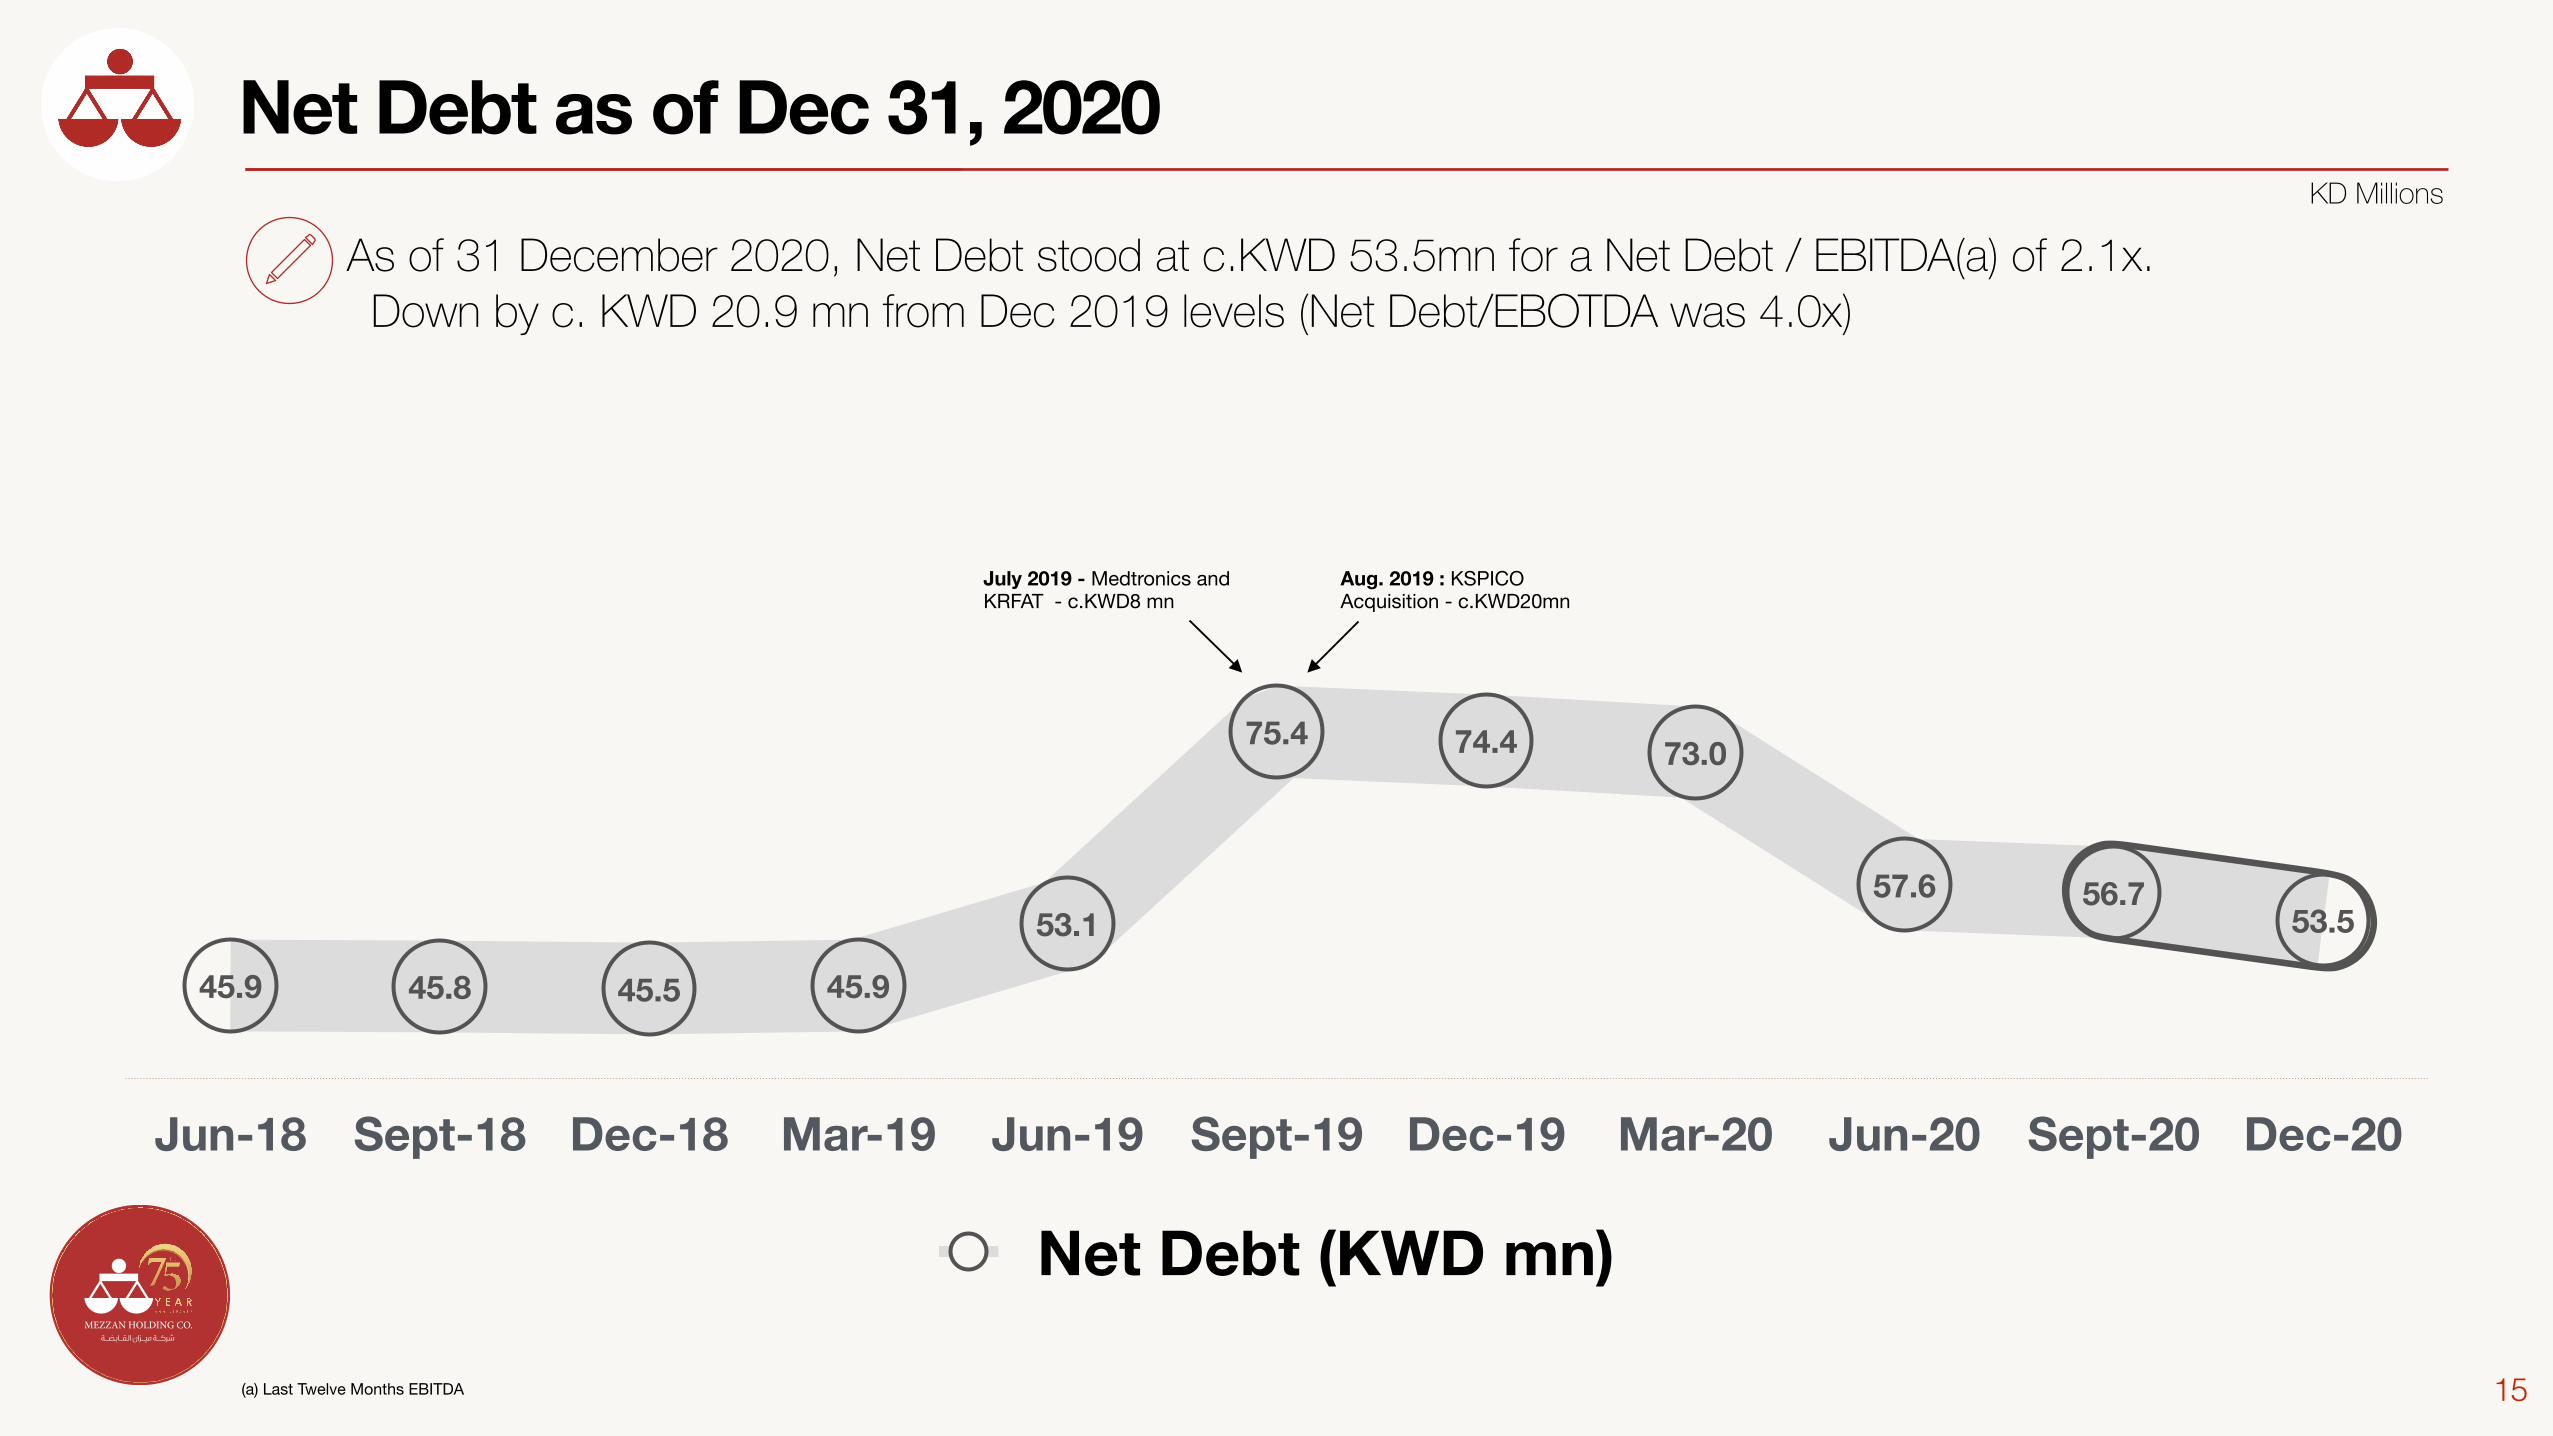
Jun-18 Sept-18 Dec-18 Mar-19 Jun-19 Sept-19 Dec-19 Mar-20 Jun-20 Sept-20 Dec-20
53.556.757.6
73.074.475.4
53.1
45.945.545.845.9
Net Debt (KWD mn)
15
Net Debt as of Dec 31, 2020KD Millions
As of 31 December 2020, Net Debt stood at c.KWD 53.5mn for a Net Debt / EBITDA(a) of 2.1x. Down by c. KWD 20.9 mn from Dec 2019 levels (Net Debt/EBOTDA was 4.0x)
(a) Last Twelve Months EBITDA
Aug. 2019 : KSPICO Acquisition - c.KWD20mn
July 2019 - Medtronics and KRFAT - c.KWD8 mn

16
Q&A