CANOPY GROWTH FY 2020 Q4 and Full Year Earnings Presentation · 2020-06-04 · May 29th, 2020...
31
May 29th, 2020 CANOPY GROWTH FY 2020 Q4 and Full Year Earnings Presentation
Transcript of CANOPY GROWTH FY 2020 Q4 and Full Year Earnings Presentation · 2020-06-04 · May 29th, 2020...

May 29th, 2020
CANOPY GROWTH
FY 2020 Q4 and Full Year Earnings Presentation

2
FORWARD LOOKING STATEMENTThis press release contains “forward-looking statements” within the meaning of applicable securities laws, which involve certain known and unknown risks and uncertainties. Forward-looking statements predict or describe our future operations, business plans, business and investment strategies and the performance of our investments. These forward-looking statements are generally identified by their use of such terms and phrases as “intend,” “goal,” “strategy,” “estimate,” “expect,” “project,” “projections,” “forecasts,” “plans,” “seeks,” “anticipates,” “potential,” “proposed,” “will,” “should,” “could,” “would,” “may,” “likely,” “designed to,” “foreseeable future,” “believe,” “scheduled” and other similar expressions. Our actual results or outcomes may differ materially from those anticipated. You are cautioned not to place undue reliance on these forward-looking statements, which speak only as of the date the statement was made. Forward-looking statements include, but are not limited to, statements with respect to: • the uncertainties associated with the COVID-19 pandemic, including our ability to continue operations, the ability of our suppliers and distribution channels to continue to operate, and the use of our products by consumers, and disruptions to the global and local economies due to related stay-at-home orders, quarantine
policies and restrictions on travel, trade and business operations and a reduction in discretionary consumer spending;• laws and regulations and any amendments thereto applicable to our business and the impact thereof, including uncertainty regarding the application of U.S. state and federal law to U.S. hemp (including CBD) products and the scope of any regulations by the U.S. Federal Drug Administration, the U.S. Federal Trade Commission,
the U.S. Patent and Trademark Office, the U.S. Department of Agriculture (the “USDA”) and any state equivalent regulatory agencies over U.S. hemp (including CBD) products; • expectations regarding the regulation of the U.S. hemp industry in the U.S., including the promulgation of regulations for the U.S. hemp industry by the USDA;• expectations regarding the potential success of, and the costs and benefits associated with, our acquisitions, joint ventures, strategic alliances and equity investments;• the plan of arrangement with Acreage Holdings, Inc., including the consummation of such acquisition upon the occurrence or waiver of changes in U.S. federal law to permit the general cultivation, distribution and possession of marijuana or to remove the regulation of such activities from the federal laws of the United States
and our intention to waive such condition as soon as the policies of the New York Stock Exchange and/or the Toronto Stock Exchange permit completion of the acquisition, provided that completion of the acquisition would not violate any third-party agreements, including those entered into by us with Constellation Brands, Inc. and its affiliates (together, the “CBI Group”);
• the grant, renewal and impact of any license or supplemental license to conduct activities with cannabis or any amendments thereof;• our international activities and joint venture interests, including required regulatory approvals and licensing, anticipated costs and timing, and expected impact;• the ability to successfully create and launch brands and further create, launch and scale cannabis-based products and U.S. hemp-derived consumer products in jurisdictions where such products are legal and that we currently operate in;• the benefits, viability, safety, efficacy, dosing and social acceptance of cannabis, including CBD and other cannabinoids;• the anticipated benefits and impact of the CBI Group investments in us (the “CBI Group Investments”); • the potential exercise of the warrants held by the CBI Group, pre-emptive rights and/or top-up rights in connection with the CBI Group Investments, including proceeds to us that may result therefrom or the potential conversion of notes held by the CBI Group in connection with the CBI Group Investments;• expectations regarding the use of proceeds of equity financings, including the proceeds from the CBI Group Investments;• the legalization of the use of cannabis for medical or recreational in jurisdictions outside of Canada, the related timing and impact thereof and our intentions to participate in such markets, if and when such use is legalized;• our ability to execute on our strategy and the anticipated benefits of such strategy;• the ongoing impact of the legalization of additional cannabis product types and forms for recreational use in Canada, including federal, provincial, territorial and municipal regulations pertaining thereto, the related timing and impact thereof and our intentions to participate in such markets;• the ongoing impact of developing provincial, territorial and municipal regulations pertaining to the sale and distribution of cannabis, the related timing and impact thereof, as well as the restrictions on federally regulated cannabis producers participating in certain retail markets and our intentions to participate in such
markets to the extent permissible;• the future performance of our business and operations;• our competitive advantages and business strategies;• the competitive conditions of the industry;• the expected growth in the number of customers using our products;• our ability or plans to identify, develop, commercialize or expand our technology and research and development initiatives in cannabinoids, or the success thereof;• expectations regarding revenues, expenses and anticipated cash needs;• expectations regarding cash flow, liquidity and sources of funding;• expectations regarding capital expenditures;• the expansion of our production and manufacturing, the costs and timing associated therewith and the receipt of applicable production and sale licenses;• the expected growth in our growing, production and supply chain capacities;• expectations regarding the resolution of litigation and other legal proceedings;• expectations with respect to future production costs;• expectations with respect to future sales and distribution channels;• the expected methods to be used to distribute and sell our products; • our future product offerings;• the anticipated future gross margins of our operations;• accounting standards and estimates;• expectations regarding our distribution network; and• expectations regarding the costs and benefits associated with our contracts and agreements with third parties, including under our third-party supply and manufacturing agreements.
3
FORWARD LOOKING STATEMENTCertain of the forward-looking statements contained herein concerning the industries in which we conduct our business are based on estimates prepared by us using data from publicly available governmental sources, market research, industry analysis and on assumptions based on data and knowledge of these industries, which we believe to be reasonable. However, although generally indicative of relative market positions, market shares and performance characteristics, such data is inherently imprecise. The industries in which we conduct our business involve risks and uncertainties that are subject to change based on various factors, which are described further below.
The forward-looking statements contained herein are based upon certain material assumptions that were applied in drawing a conclusion or making a forecast or projection, including: (i) management’s perceptions of historical trends, current conditions and expected future developments; (ii) our ability to generate cash flow from operations; (iii) general economic, financial market, regulatory and political conditions in which we operate; (iv) the production and manufacturing capabilities and output from our facilities and our joint ventures, strategic alliances and equity investments; (v) consumer interest in our products; (vi) competition; (vii) anticipated and unanticipated costs; (viii) government regulation of our activities and products including but not limited to the areas of taxation and environmental protection; (ix) the timely receipt of any required regulatory authorizations, approvals, consents, permits and/or licenses; (x) our ability to obtain qualified staff, equipment and services in a timely and cost-efficient manner; (xi) our ability to conduct operations in a safe, efficient and effective manner; (xii) our ability to realize anticipated benefits, synergies or generate revenue, profits or value from our recent acquisitions into our existing operations; (xiii) our ability to continue to operate in light of the COVID-19 pandemic and the impact of the pandemic on demand for, and sales of, our products and our distribution channels; and (xiv) other considerations that management believes to be appropriate in the circumstances. While our management considers these assumptions to be reasonable based on information currently available to management, there is no assurance that such expectations will prove to be correct.
By their nature, forward-looking statements are subject to inherent risks and uncertainties that may be general or specific and which give rise to the possibility that expectations, forecasts, predictions, projections or conclusions will not prove to be accurate, that assumptions may not be correct and that objectives, strategic goals and priorities will not be achieved. A variety of factors, including known and unknown risks, many of which are beyond our control, could cause actual results to differ materially from the forward-looking statements in this press release and other reports we file with, or furnish to, the Securities and Exchange Commission (the “SEC”) and other regulatory agencies and made by our directors, officers, other employees and other persons authorized to speak on our behalf. Such factors include, without limitation, the risk that the COVID-19 pandemic may disrupt our operations and those of our suppliers and distribution channels and negatively impact the use of our products; consumer demand for cannabis and U.S. hemp products; that cost savings and any other synergies from the CBI Group Investments may not be fully realized or may take longer to realize than expected; future levels of revenues; our ability to manage disruptions in credit markets or changes to our credit rating; future levels of capital, environmental or maintenance expenditures, general and administrative and other expenses; the success or timing of completion of ongoing or anticipated capital or maintenance projects; business strategies, growth opportunities and expected investment; the adequacy of our capital resources and liquidity, including but not limited to, availability of sufficient cash flow to execute our business plan (either within the expected timeframe or at all); the potential effects of judicial or other proceedings on our business, financial condition, results of operations and cash flows; volatility in and/or degradation of general economic, market, industry or business conditions; compliance with applicable environmental, economic, health and safety, energy and other policies and regulations and in particular health concerns with respect to vaping and the use of cannabis and U.S. hemp products in vaping devices; the anticipated effects of actions of third parties such as competitors, activist investors or federal, state, provincial, territorial or local regulatory authorities, self-regulatory organizations, plaintiffs in litigation or persons threatening litigation; changes in regulatory requirements in relation to our business and products; and the factors discussed under the heading “Risk Factors” in the Company’s Annual Report on Form 10-K for the year ended March 31, 2020 to be filed with the SEC. Readers are cautioned to consider these and other factors, uncertainties and potential events carefully and not to put undue reliance on forward-looking statements.
Forward-looking statements are provided for the purposes of assisting the reader in understanding our financial performance, financial position and cash flows as of and for periods ended on certain dates and to present information about management’s current expectations and plans relating to the future, and the reader is cautioned that the forward-looking statements may not be appropriate for any other purpose. While we believe that the assumptions and expectations reflected in the forward-looking statements are reasonable based on information currently available to management, there is no assurance that such assumptions and expectations will prove to have been correct. Forward-looking statements are made as of the date they are made and are based on the beliefs, estimates, expectations and opinions of management on that date. We undertake no obligation to update or revise any forward-looking statements, whether as a result of new information, estimates or opinions, future events or results or otherwise or to explain any material difference between subsequent actual events and such forward-looking statements, except as required by law. The forward-looking statements contained in this press release and other reports we file with, or furnish to, the SEC and other regulatory agencies and made by our directors, officers, other employees and other persons authorized to speak on our behalf are expressly qualified in their entirety by these cautionary statements.

4
NON-GAAP MEASURES Adjusted EBITDA is a non-GAAP measure used by management that is not defined by U.S. GAAP and may not be comparable to similar measures presented by other companies. Adjusted EBITDA is calculated as the reported net loss, adjusted to exclude income tax recovery (expense), other income (expense), net, and loss on equity method investments, share-based compensation expense, depreciation and amortization expense, asset impairment and restructuring costs, restructuring and other charges recorded in cost of goods sold, and charges related to the flow-through of inventory step-up on business combinations, and further adjusted to remove acquisition-related costs. The Adjusted EBITDA reconciliation is presented within this news release and explained in the Company's Annual Report on Form 10-K to be filed with the Securities and Exchange Commission.
Adjusted Gross Margin is a non-GAAP measure used by management that is not defined by U.S. GAAP and may not be comparable to similar measures presented by other companies. Adjusted Gross Margin is calculated as gross margin excluding restructuring and other charges recorded in cost of goods sold and charges related to the flow-through of inventory step-up associated with business combinations. The Adjusted Gross Margin reconciliation is presented within this news release.
Free Cash Flow is a non- GAAP measure used by management that is not defined by U.S. GAAP and may not be comparable to similar measures presented by other companies. This measure is calculated as net cash provided by (used in) operating activities less purchases and deposits of property, plant and equipment. The Free Cash Flow reconciliation is presented within this news release and explained in the Company's Annual Report on Form 10-K to be filed with the Securities and Exchange Commission.
U.S. GAAP Financial Reporting
Effective April 1, 2020, Canopy Growth is considered a U.S. domestic issuer and is required to prepare financial statements in compliance with U.S. GAAP. Accordingly, our consolidated audited financial statements for the year ended March 31, 2020, including all comparative figures, have been restated in accordance with these standards.
As part of this transition, Canopy Growth will also be required to provide an auditor attestation report under Section 404(b) of the Sarbanes-Oxley Act in connection with its Annual Report on Form 10-K to be filed with the Securities and Exchange Commission.

5
TODAY’S PRESENTERS
Mike LeeEVP & CFO
David KleinCEO

v COVID-19: Priorities and Responses
v Building Positive Momentum
v Q4 FY20 and Full Year FY20 Financial Results
v Strategic Update: Our Path Forward
6
AGENDA

7
COVID-19 PRIORITIES AND RESPONSES
Our Employees
• Over 60% of global employees are currently working remotely
• COVID Response Team continues to handle the day-to-day issues, closely coordinating with the CEO and senior management team
• CEO has issued several company-wide messages (+ video) informing staff of what we know and outlining our support, including a global webcast
• COVID-19 Response Team currently developing a company-wide Return to Workplace Plan
Our Operations Retail• 90% of corporate-owned retail stores now
reopened. Operating at reduced hours and accepting online and phone orders.
• In Ontario, retail cannabis stores are now allowed to be re-opened (as of May 19). Curbside pick up and delivery are still permitted.
Production• CGC manufacturing operations in Canada
and the EU have been deemed essential• Since March, we have been conducting daily
screening at all Canadian facilities with infrared temperature readings. We have also implemented additional distancing measures
Our Communities
• Donated over 75,000 pieces of Personal Protective Equipment for front-line workers across various provinces and local communities
• BioSteel has pledged to donate up to $2 million worth of its Hydration Mix product to frontline workers, hospitals and patients
• This Works has provided its hand sanitizers to homeless shelters and front-line workers
• Donated First & Free CBD products to support ICU and ER nurses in hospitals throughout the US
Focus on the health and safety of our employees, business continuity, and supporting our communities through this crisis
8
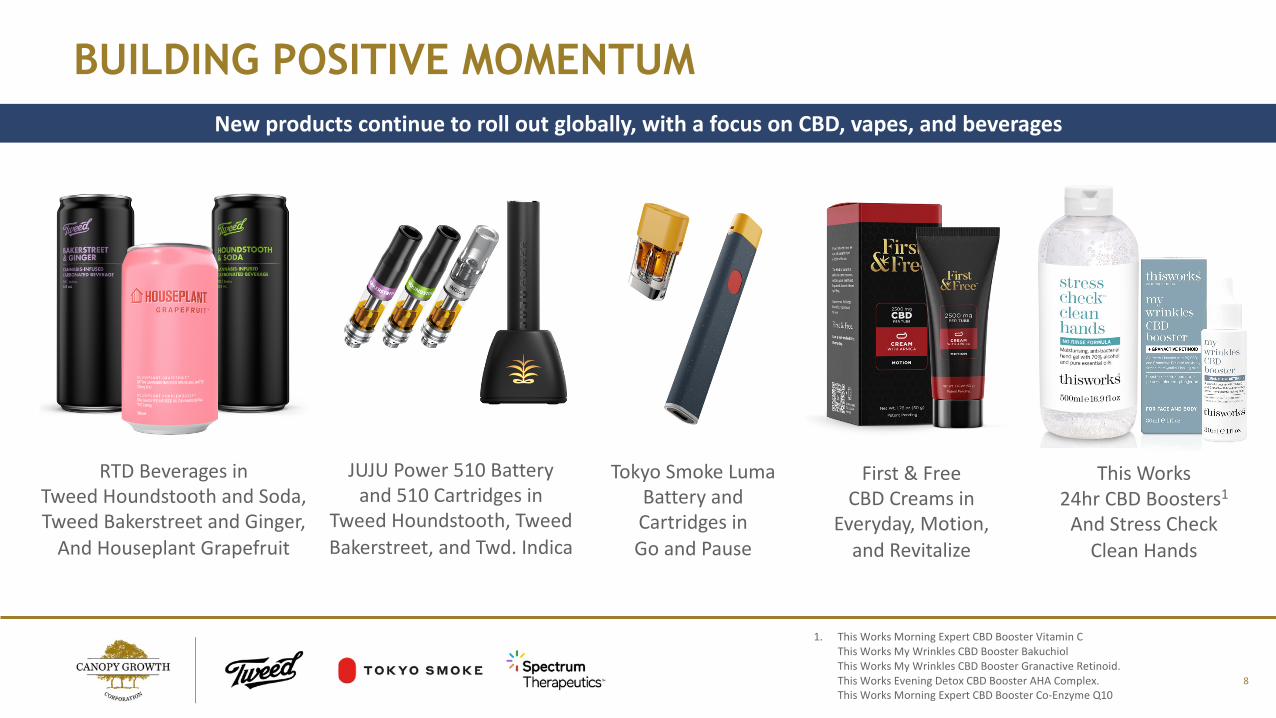
BUILDING POSITIVE MOMENTUMNew products continue to roll out globally, with a focus on CBD, vapes, and beverages
This Works 24hr CBD Boosters1
And Stress Check Clean Hands
1. This Works Morning Expert CBD Booster Vitamin C This Works My Wrinkles CBD Booster Bakuchiol This Works My Wrinkles CBD Booster Granactive Retinoid. This Works Evening Detox CBD Booster AHA Complex. This Works Morning Expert CBD Booster Co-Enzyme Q10
First & Free CBD Creams in
Everyday, Motion, and Revitalize
JUJU Power 510 Battery and 510 Cartridges in
Tweed Houndstooth, Tweed Bakerstreet, and Twd. Indica
RTD Beverages in Tweed Houndstooth and Soda,Tweed Bakerstreet and Ginger,
And Houseplant Grapefruit
Tokyo Smoke Luma Battery and Cartridges in Go and Pause

9
SIGNIFICANT PROGRESS IN RIGHT-SIZING OUR BUSINESSPRODUCTION
OPTIMIZATION
• Reduced Canadian production capacity by over 40%
• Shuttered two greenhouses facilities in British Columbia, and an indoor facility in Saskatchewan
• No longer bringing the third greenhouse in Niagara-on-the-Lake online
• Ceased US hemp farming operations in New York
ASSET-LIGHT APPROACH IN SELECT INT’L MARKETS
CANADIANRESTRUCTURING
• Transferred ownership of all African operations to a local business
• Moved to an asset-light model in LatAm, and ceased our cultivation operations in Colombia
• Significant reductions to the Canadian headcount
• Permanent termination of approximately 200 employees in Canada, US, and UK
• Impacted functions included Sales & Marketing, Human Resources, and Research & Development among others

Q4 FY20 AND FULL YEAR FY20 RESULTS
10

11
Q4 FY20 & FY 20 KEY FINANCIAL HIGHLIGHTS Key Takeaways
v FY 2020 Net revenue grew 76% versus FY 2019
v Net Revenue down 13% QoQ due to soft Canada Rec revenue
v Adjusted (Non-GAAP) Gross margin achieved 42%
v Adjusted EBITDA negatively impacted by lower net revenue and higher operating expenses
v Free Cash Flow improved by $56mm versus Q3 20
v Cash position remained strong at nearly C$2 billion at the end of Q4
(CDN in millions) Q4 20 vs. Q3 20 vs. Q4 19 FY 20 vs. FY 19
Gross Revenue 115 -15% 8% 440 73%
Net Revenue 108 -13% 15% 399 76%
Adjusted Gross Margins 42% 11pp 20pp 26% 14pp
Adjusted EBITDA -102 -5% -8% -443 -53%
Free Cash Flow -305 15% 22% -1,478 -25%
Cash/Marketable Secs. 1,976 -13% -56% 1,976 -56%
• Adjusted Gross margins are Non-GAAP measures and exclude restructuring and other charges recorded in cost of goods sold, and inventory step-up costs
• Adjusted EBITDA and FCF are Non-GAAP measures

12
REVENUE PERFORMANCE BY SEGMENT v Canadian Recreational Revenue declined 28% from the prior quarter with B2B and B2C both down vs. Q3 20v Canadian Medical sales remained consistent in Q4 20 vs Q3 20v International Medical up double digits vs. Q3 20 driven by the strength in both C3 and Germany B2B businessv Other Strategic Businesses declined 11%, mostly driven by S&B, lapping a seasonally strong Q3 20
Canada Recreational
B2B, 32%
Canada Recreational
B2C, 11%Canada Medical,
13%
International Medical, 18%
All Others, 26%
Q4 FY20 GROSS REVENUE MIX
(CDN in millions) Q4 20 vs. Q3 20 vs. Q4 19 FY 20 vs. FY 19Canada Recreational:
B2B 36.7 -31% -36% 157.3 34%B2C 13.1 -14% 12% 52.0 125%
Canada Recreational 49.8 -28% -28% 209.3 49%Canada Medical 14.9 1% 29% 56.8 -17%
International Medical 20.7 11% 1051% 68.0 574%All Others 29.7 -11% 23% 105.5 210%
Excise Taxes -7.2 -39% -42% -40.9 51%Net Revenue 107.9 -13% 15% 398.7 76%

13
REVENUE PERFORMANCE BY FORMAT
v Recreational Dry Bud down 29% in Q4 20 vs. Q3 20v Softgel & Oil grew strongly during Q4 20, while 2.0 products contributed
modestlyv In Global Medical, Softgel & Oil accounted for over 70% of product mix Dry bud
89%
Softgel, Oil & 2,0 Products
11%
Canada Recreational Sales by Format - Q420
Dry bud28%
Softgel, Oil & 2,0 Products
72%
Global Medical Sales by Format - Q420(CDN in millions) Q4 20 vs. Q3 20 vs. Q4 19 FY 20 vs. FY 19Canada Recreational:
Dry bud 48.9 -29% 51% 238.1 188%Softgel, Oil & 2.0 Products 6.3 34% -83% 22.7 -61%
Other Revenue Adjustments -5.4 2% n/a -51.5 n/aGlobal Medical:
Dry bud 9.8 7% 34% 35.9 -30%Softgel, Oil & 2.0 Products 25.7 6% 329% 89.0 224%
All Others 29.7 -11% 23% 105.5 210%Excise Taxes -7.2 -39% -42% -40.9 51%
Net Revenue 107.9 -13% 15% 398.8 76%

Quarterly Gross Margin Trend
(+) Improvement in facility utilization
(+) Positive business mix – stronger contribution from higher margin International Medical business
(+) Continued contribution from All Others (Strategic Businesses)
(-) A slower ramp in 2.0 products
GROSS MARGIN PERFORMANCE
Drivers of Q4 FY20 Gross Margin Performance
20% 5%31%
-85%
20% 5%31%
42%
1Q20 2Q20 3Q20 4Q20
Reported Gross Margins Adjusted Gross Margins
• Q420 Adjusted Gross Margins excludes restructuring and other charges recorded in cost of goods sold and inventory step-up costs
14
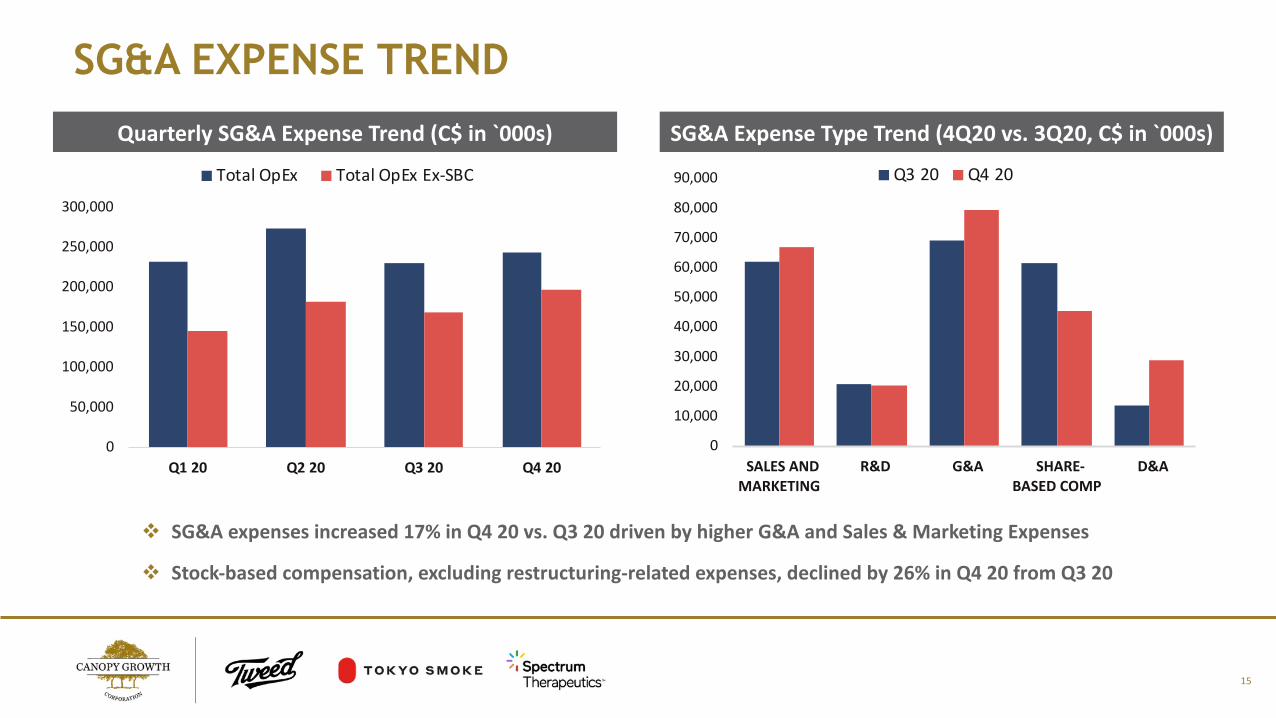
Quarterly SG&A Expense Trend (C$ in `000s) SG&A Expense Type Trend (4Q20 vs. 3Q20, C$ in `000s)
SG&A EXPENSE TREND
15
v SG&A expenses increased 17% in Q4 20 vs. Q3 20 driven by higher G&A and Sales & Marketing Expenses
v Stock-based compensation, excluding restructuring-related expenses, declined by 26% in Q4 20 from Q3 20
0
50,000
100,000
150,000
200,000
250,000
300,000
Q1 20 Q2 20 Q3 20 Q4 20
Total OpEx Total OpEx Ex-SBC
0
10,000
20,000
30,000
40,000
50,000
60,000
70,000
80,000
90,000
SALES AND MARKETING
R&D G&A SHARE-BASED COMP
D&A
Q3 20 Q4 20

16
ADJUSTED EBITDA AND FREE CASH FLOW
-180,000
-160,000
-140,000
-120,000
-100,000
-80,000
-60,000
-40,000
-20,000
0Q1 20 Q2 20 Q3 20 Q4 20
IFRS Adj. EBITDA US GAAP Adj. EBITDA
Adjusted EBITDA Trend (C$ in `000s) Free Cash Flow Trend (C$ in `000s)
-500,000-450,000-400,000-350,000-300,000-250,000-200,000-150,000-100,000
-50,0000
1Q19 2Q19 3Q19 4Q19 1Q20 2Q20 3Q20 4Q20
Cash from Ops Capex
v Adjusted EBITDA of -$102mm for Q4 was $5mm unfavorable versus Q3
v Slight adjustment to Adjusted EBITDA from conversion to US GAAP
v Q420 FCF of -$305mm was a $56mm improvement vs. Q320
v Q420 Capex declined by $77mm to $94mm from Q320

17
COVID-19 CONSIDERATIONS
• Canada Rec B2B impacted by reduced traffic to physical retail stores due to social distancing. Ontario recently re-opened physical retail stores, after a temporary closure from the beginning of April through May 19th; Quarter-to-date, our B2B rolling 13-week average sales are down 15% the average for the trailing six months ended March 2020
• Canopy Rec B2C more heavily impacted as majority of our corporate-owned retail stores are now open but currently operate on a click-and-collect model with reduced hours. Quarter-to-date, B2C weekly sales running ~50% below the average for the trailing six months ended March 2020
• Canada Medical is benefiting from a proven e-commerce channel; Sales have reverted to pre-COVID level and have been stable in recent weeks
v International Medical (C3 and Germany) operates on a pharmacy model; modestimpact so far
v Strategic Businesses (All Others) are collectively seeing a 20-40% reduction versus their average sales during the six months ended March 2020
Expect 1Q FY20 sales and profitability to be negatively
impacted•
Focusing our efforts on flexing staffing models and limiting our
spending•
Financial position remains strong with nearly C$2bn cash balance at the end of Q4 20 plus $245mn of
cash inflow on May 1st from Constellation’s exercise of Nov 2017
warrants

STRATEGY AND ORGANIZATIONAL REVIEW UPDATE
18

Key priorities we laid out last quarter…
• Improve our connection with our consumers
• Bring more focus and discipline to the organization
• Define a visible path to profitability and positive cash flow
• Build credibility with all stakeholders
Today, we lay out our
path forward
STRATEGIC AND ORGANIZATIONAL REVIEW UPDATE
19

v Moving from a “be first” culture to a “be the best” culture, where growth is defined by revenue and market share, not headcount and capacity
v Focused strategy with an operating model that is “fit for purpose”
v A structure where roles are clear and decisions are moved closer to the facts, empowering decision makers and driving accountability
v A consumer-first approach driven by insights resulting in consistent, world-class products that delight consumers and achieve our financial objectives
20
INTRODUCING THE STRATEGY

v Designing a new operating model
v Putting in place a new leadership structure
v Rightsizing our business
v Focus on three core markets – Canada, US, and Germany
v Aligning to a consumer-first approach
21
NEW STRATEGIC FOCUS ALREADY IN MOTION

STRATEGIC FOCUS: HOW WE’LL ACCOMPLISH IT
ADVANCING THE FULL POTENTIAL OF CANNABIS
SIZEABLE SHARE IN FOCUS CATEGORIES AND MARKETS
EXECUTE PATH TO PROFITABILITY
HIGH-LEVEL STRATEGY
HOW WE’LL ACCOMPLISH IT
Consumer Centric
Focused and Accountable
Quality Driven
Industry Leadership
22

23
Consumer Centric
Focused and Accountable Quality Driven Industry
Leadership
STRATEGIC FOCUS: CONSUMER CENTRIC
• World-Class Consumer Insights and Analytics
• Coupled With Focused, Best-In-Industry Science and Product Development, and Innovation Organizations
• Arms Sales Team with a Differentiated Branded Product Portfolio
• Drives Sales Success Through Best-In-Class Execution
• Putting the Product First so Our Brands Become Known for Consistently Excellent Products

24
STRATEGIC FOCUS: FOCUSED AND ACCOUNTABLE
Consumer Centric
Focused and Accountable Quality Driven Industry
Leadership
• Prioritize Activity on Highest-Potential Categories (Flower, Vape, Beverages, Edibles, Topicals, and Skincare) and Core Markets (Canada, US, Germany)
• Resource and Asset-Light Approach on Incubator Markets and Emerging Categories
• Industry Focus on Rec and Medical (CBD fits in both)
• Increased Accountability Among Team Members

25
STRATEGIC FOCUS: QUALITY DRIVEN
Consumer Centric
Focused and Accountable Quality Driven Industry
Leadership
• Approach Design Based on Value
• Standards-Driven, Consistent Production
• Deliver The Right Product, At The Right Time, At The Right Price, From The Right Facility
• Balance of Flexibility and Scale

26
STRATEGIC FOCUS: INDUSTRY LEADERSHIP
Consumer Centric
Focused and Accountable Quality Driven Industry
Leadership
• Spearhead The Next Phase of Industry Evolution
• Proactively Shape How The Industry Evolves In Focus Markets
• Pioneer Growing Good – Advocating for Change and Giving Back To Our Neighbors and Communities
• Deliver On Responsibilities To Our Stakeholders

v Expect FY 2021 to be a transition year v Plan to provide new financial targets during the 2H FY21 v Near-term Revenue opportunity is significant
• Canada Rec market already over C$2.1bn in legal sales• US CBD market expected to be a US$10bn+ industry in the next few years• Germany medical market estimated to grow significantly • Mid- to long-term opportunities from additional regulatory advancements
v Gross margin upside potential • Conducting an end-to-end review of our operations • Significant opportunities to unlock efficiencies across our supply chain
v Remain committed to reducing our cash burn
27
EXECUTE PATH TO PROFITABILITY
1. Annual retail sales run-rate based on March 2020 Retail Sales of $181mm, as reported by Statistics Canada

APPENDIX
28
29
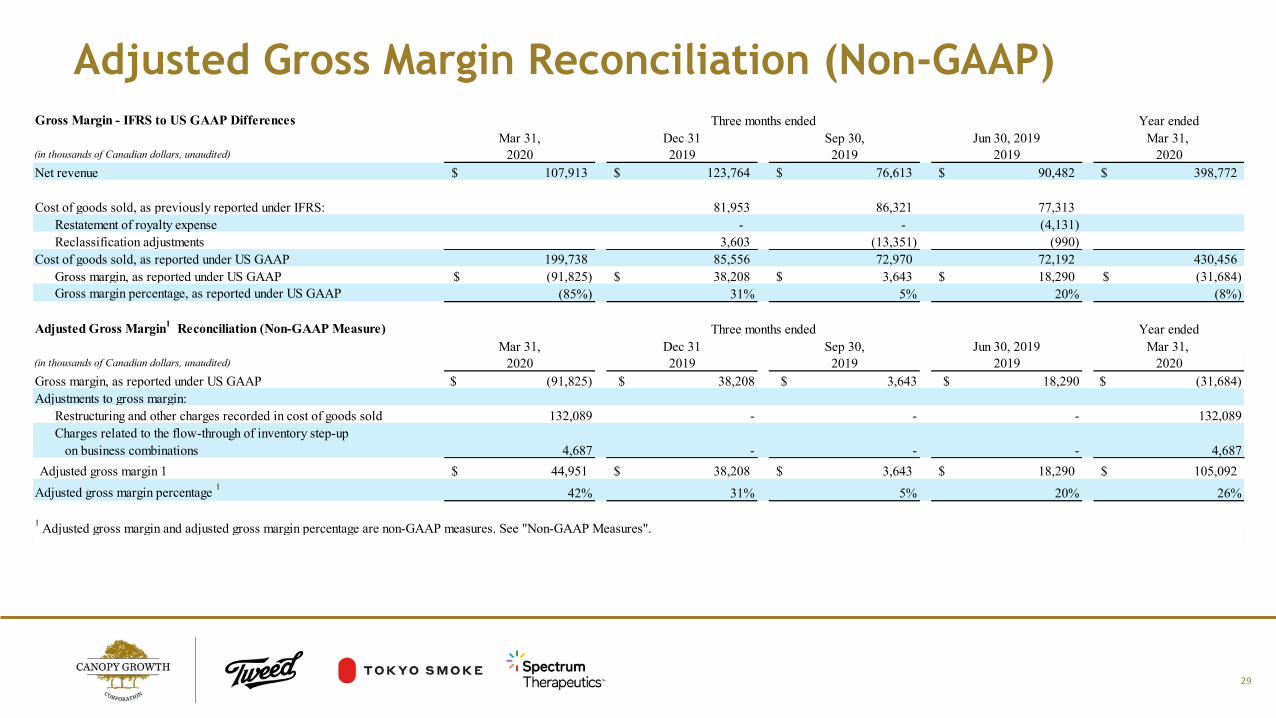
Adjusted Gross Margin Reconciliation (Non-GAAP)Gross Margin - IFRS to US GAAP Differences Year ended
Mar 31, Dec 31 Sep 30, Jun 30, 2019 Mar 31, (in thousands of Canadian dollars, unaudited) 2020 2019 2019 2019 2020Net revenue 107,913$ 123,764$ 76,613$ 90,482$ 398,772$
Cost of goods sold, as previously reported under IFRS: 81,953 86,321 77,313 Restatement of royalty expense - - (4,131) Reclassification adjustments 3,603 (13,351) (990)
Cost of goods sold, as reported under US GAAP 199,738 85,556 72,970 72,192 430,456 Gross margin, as reported under US GAAP (91,825)$ 38,208$ 3,643$ 18,290$ (31,684)$ Gross margin percentage, as reported under US GAAP (85%) 31% 5% 20% (8%)
Adjusted Gross Margin1 Reconciliation (Non-GAAP Measure) Year endedMar 31, Dec 31 Sep 30, Jun 30, 2019 Mar 31,
(in thousands of Canadian dollars, unaudited) 2020 2019 2019 2019 2020Gross margin, as reported under US GAAP $ (91,825) $ 38,208 $ 3,643 $ 18,290 $ (31,684)Adjustments to gross margin:
Restructuring and other charges recorded in cost of goods sold 132,089 - - - 132,089 Charges related to the flow-through of inventory step-up on business combinations 4,687 - - - 4,687
Adjusted gross margin 1 44,951$ 38,208$ 3,643$ 18,290$ 105,092$ Adjusted gross margin percentage 1 42% 31% 5% 20% 26%
Three months ended
Three months ended
1 Adjusted gross margin and adjusted gross margin percentage are non-GAAP measures. See "Non-GAAP Measures".

30
Adjusted EBITDA Reconciliation (Non-GAAP)Adjusted EBITDA1 Reconciliation (Non-GAAP Measure) Year ended
Mar 31, Dec 31 Sep 30, Jun 30, Mar 31, (in thousands of Canadian dollars, unaudited) 2020 2019 2019 2019 2020Net loss (1,326,405)$ (109,634)$ 242,650$ (194,051)$ (1,387,440)$
Income tax (recovery) expense (98,666) (27,448) (5,767) 10,267 (121,614) Other expense (income), net 376,295 (57,963) (509,893) (32,768) (224,329) Loss on equity method investments 57,752 2,664 2,171 1,833 64,420 Share-based compensation 78,354 61,679 92,881 87,362 320,276 Acquisition-related costs 1,840 3,256 2,562 13,182 20,840 Depreciation and amortization 48,781 30,464 25,016 20,752 125,013 Asset impairment and restructuring costs 623,266 - - - 623,266 Restructuring and other charges recorded in cost of goods sold 132,089 - - - 132,089 Charges related to the flow-through of inventory step-up on business combinations 4,687 - - - 4,687
Adjusted EBITDA (102,007)$ (96,982)$ (150,380)$ (93,423)$ (442,792)$
Adjusted EBITDA1 - IFRS to US GAAP DifferencesDec 31 Sep 30, Jun 30,
(in thousands of Canadian dollars, unaudited) 2019 2019 2019Adjusted EBITDA, as previously reported under IFRS (91,661)$ (155,745)$ (92,060)$
Adjustments related to differences in lease accounting on depreciation and amortization expense (2,878) (2,857) (2,639) Adjustments related to other transition differences (2,443) 8,222 1,276
Adjusted EBITDA, as reported under US GAAP (96,982)$ (150,380)$ (93,423)$
Three months ended
1 Adjusted EBITDA is calculated as the reported operating income (loss), which excludes interest and income taxes, adjusted for the removal of share-based compensation expense, depreciation and amortization expense, asset impairment and restructuring costs, restructuring and other charges recorded in cost of goods sold, and charges related to the flow-through of inventory step-up on business combinations, and further adjusted to remove acquisition-related costs. See "Non-GAAP Measures".

31
Free Cash Flow (Non-GAAP) Reconciliation Free Cash Flow Reconciliation1 Three months ended
March 31, March 31,(in thousands of Canadian dollars, unaudited) 2020 2019Net cash provided by (used in) operating activities $ (210,639) $ (240,132)Purchases of and deposits on property, plant and equipment (94,086) (149,220)Free cash flow1 $ (304,725) $ (389,352)
Year endedMarch 31, March 31,
(in thousands of Canadian dollars, unaudited) 2020 2019Net cash used in operating activities $ (772,635) $ (535,031)Purchases of and deposits on property, plant and equipment (704,944) (644,456)Free cash flow1 $ (1,477,579) $ (1,179,487)
1Free cash flow is a non-GAAP measure and is calculated as net cash provided by (used in) operating activities, less purchases of and deposits on property, plant and equipment.