FUZZY LOGIC BASED HUMAN PERCEPTION MODEL...
17
FUZZY LOGIC BASED HUMAN PERCEPTION MODEL FOR PUBLIC TRANSPORT PLANNING: A CASE STUDY OF THIRUVANANTHAPURAM CITY ROHIT RP II YEAR, MASTER OF PLANNING WITH SPECIALIZATION IN TRANSPORTATION PLANNING SCHOOL OF PLANNING AND ARCHITECTURE, NEW DELHI
Transcript of FUZZY LOGIC BASED HUMAN PERCEPTION MODEL...
FUZZY LOGIC BASED HUMAN
PERCEPTION MODEL FOR
PUBLIC TRANSPORT PLANNING:
A CASE STUDY OF
THIRUVANANTHAPURAM CITY
ROHIT RP
II YEAR, MASTER OF PLANNING WITH SPECIALIZATION IN
TRANSPORTATION PLANNING
SCHOOL OF PLANNING AND ARCHITECTURE, NEW DELHI

OUTLINE
• Introduction
• Concept of Fuzzy Logic
• Fuzzy Inference System
• Research Approach
• Data Sample
• Study area and Characteristics
• Modelling
– Membership function
– Rule base
– Scenario building
• Conclusion

INTRODUCTION
• Road-traffic problems such as,
congestion, delays and road
accidents, which becomes a
serious threat to the many cities.
• The total registered vehicles in
the country grew at a Compound
Annual Growth Rate (CAGR) of
10.5% between 2002 and 2012 (Road Transport Year Book 2011-12).
• 2001-2011 data reveals that
growth rate of registered motor
vehicles becomes almost three
times the growth rate of road
network.
Solution to these problem : Use of Public Transport.
Source: Ministry of road transport & highways
transport research wing
In 2014
5 lakh Road accidents
1.46 lakh Death
5 lakh Injured
more than 16 lives every hour on average
Source : Dailymail.co.uk website
Traffic congestion in Delhi
WHY FUZZY LOGIC?
• Selection of mode choice governed by the people’s perception (dependent on certain factors) that are uncertain in nature.
• Decisions are spontaneous – “Decisions are seconds before you decide”
• Difficult to capture the uncertainty and ambiguity.
• Mathematical model fails to capture these uncertainties Psychology of people.
• Fuzzy logic is the primary technique to be used in the study in order to model situations in which people make decisions, which are complex
Source: Chun Siong Soon, Marcel Brass, Hans-Jochen Heinze & John-Dylan Haynes, “Unconscious
Determinants of Free Decisions in the Human Brain.” Nature Neuroscience, April 13th, 2008
HOW THEY MAKE DECISION?
WHICH MODE DO THEY
CHOOSE?
CONCEPT OF FUZZY LOGIC
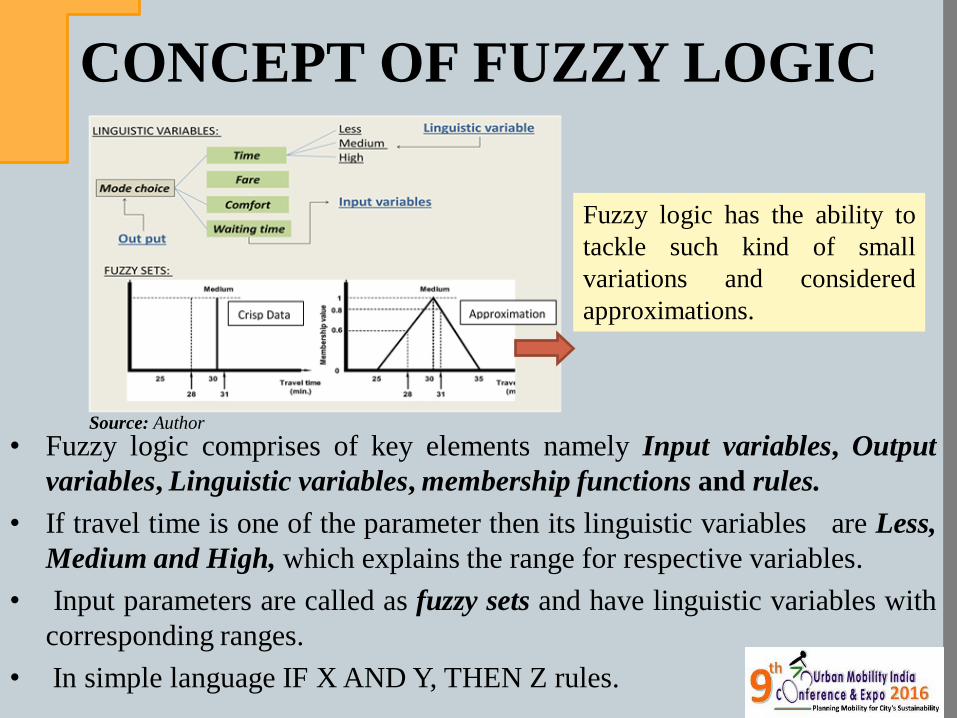
• Fuzzy logic comprises of key elements namely Input variables, Output
variables, Linguistic variables, membership functions and rules.
• If travel time is one of the parameter then its linguistic variables are Less,
Medium and High, which explains the range for respective variables.
• Input parameters are called as fuzzy sets and have linguistic variables with
corresponding ranges.
• In simple language IF X AND Y, THEN Z rules.
Source: Author
Fuzzy logic has the ability to
tackle such kind of small
variations and considered
approximations.

FUZZY INFERENCE SYSTEM
Source: Pradeep Sarkar,2013
Components of fuzzy inference system
• Input variables are given in the form of crisp values which gone
through a process of fuzzufication, where every input variables are
analysed and ranges are made considering appropriate membership
functions.
• Later set of combinations of rules are made and are loaded in the fuzzy
inference engine.
• Fuzzy logic mechanism deals with rules captures the psychology of
travellers on different variables.
• Generating Rules: experts advice (or) ANFIS (Adaptive Neuro Fuzzy
Inference System) method.
CRISP
INPUT FUZZUFICATION
FUZZY INFERENCE
ENGINE DEFUZZIFICATION
CRISP
OUTPUT
RULE
BASES

METHODOLOGY OF STUDY
Collected and analysed
for the identified 14 bus
routes thereby captures
all the five parameters.
Source: Author

DATA SAMPLE
• Total of 14 routes are surveyed in
which 450 samples out of 530 samples
were useful for the model.
• Mode choice is restricted to two modes
namely car and bus.
• The survey data of five attributes on in-
vehicle time, discomfort, journey speed,
Travel cost and waiting time.
• Discomfort level is taken as dummy
variable through stated preference
questionnaire.
NO: Route Name
Max
Passenger
Count
Route 1 Ef-Technopark-Attingal 103.00
Route 2 Ef- Karamana--Thrikannapuram 80.00
Route 3 Ef- Moonamode 104.00
Route 4 Ef-Kazhakuttam 92.00
Route 5 Ef-Kovalam 71.00
Route 6 Ef-Peroorkada 62.00
Route 7 Malayam-Ef 82.00
Route 8 Ef- Bheenapalli 100.00
Route 9 Ef-Papanamcode 81.00
Route 10 Ef- Pothencode 74.00
Route 11 Ef- karumam 54.00
Route 12 Ef- Attukal-Maruthoorkadavu 81.00
Route 13 Ef- Peringamala 51.00
Route 14 Ef-Vizhinjam 110.00
Avg: 83.14
List of routes selected for the study
Source: Primary survey,2015

STUDY AREA CHARACTERISTICS
• Population = 7,43,691 persons
(Census 2011).
• Area: 141.74 sq.km.
• Total road length = 2586 km.
Major Roads length = 390 km
(15.08%)
• Road density = 18 km per sq.km.
• A declining trend in modal split.
• Need for study to capture the behaviour
of different mode users.
Source: Prepared using GIS tool
Source: CTTS,CDP,GOI urban transport,2008
Per
centa
ge
(%)
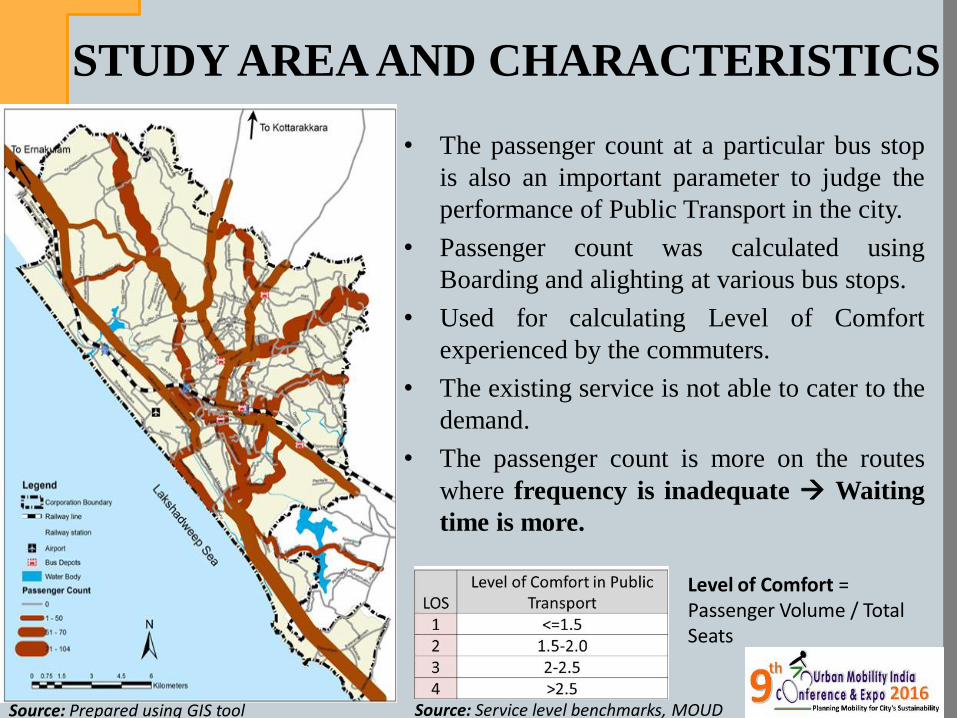
STUDY AREA AND CHARACTERISTICS
• The passenger count at a particular bus stop
is also an important parameter to judge the
performance of Public Transport in the city.
• Passenger count was calculated using
Boarding and alighting at various bus stops.
• Used for calculating Level of Comfort
experienced by the commuters.
• The existing service is not able to cater to the
demand.
• The passenger count is more on the routes
where frequency is inadequate Waiting
time is more.
Source: Prepared using GIS tool
Level of Comfort = Passenger Volume / Total Seats
Source: Service level benchmarks, MOUD

MODELLING
Attributes Fuzzy sets
In-vehicle
travel time
(min per km)
Small,
[2,4]
Medium,
[3,5]
Large,
[4,7]
Discomfort
level
Low,
[1,2]
Average,
[1.5,2.5]
High,
[2,3]
Waiting time
(min)
Less,
[2,8]
Medium
[5,11]
More,
[8,14]
Journey
Speed
(kmph)
Low,
[9,21]
Medium,
[15,27]
High,
[21,33]
Travel cost
(paise per
km)
Cheap,
[7,38.6]
Moderate,
[22.8,54.4]
High,
[38.6,70]
• Fuzzy sets are created for each
membership functions with
appropriate ranges for the respective
linguistic variables
Generate input
output data for
the base year
Set Initial
Membership
function for
Input-output
Layer
Generating rule
base for the
model
1. In-vehicle time
2. Discomfort level
3. Waiting time
4. Journey speed
5. Travel cost
• The rules created are purely based on people’s perception on each attributes,
where perceptions are obtained from bus passenger survey.
IF TRAVEL TIME IS “LOW” and TRAVEL COST is “LOW”
THEN PROBABILITY OF CHOOSING PT is “ ? ”
IF TRAVEL TIME IS “HIGH” and TRAVEL COST is “LOW”
THEN PROBABILITY OF CHOOSING PT is “ ? ”
IF TRAVEL TIME IS “HIGH” and TRAVEL COST is “HIGH”
THEN PROBABILITY OF CHOOSING PT is “ ? ”
Membership function levels of variables
Source: Author

Input Variable
Area of Approximation
Output Variable
output membership function
have range [0,1] which
depicts the probability of
choosing public transport.
Sample rules:
1. If (invehicle_time is small) and (Discomfort is low) then (public_transport_ridership is good)
2. If (invehicle_time is medium) and (Discomfort is low) then (public_transport_ridership is medium)
3. If (invehicle_time is large) and (Discomfort is high) then (public_transport_ridership is poor)

RULE BASE & VALIDATION
• Total 180 rules are generated in the fuzzy inference system.
• Validation of model using base data.
• Iterations are carried out by changing the membership functions and rules
to reduce variations.
• In real world, 3-4 parameters influence the human psychology.
Source: Author
Combination of rules of one linguistic variable
For one variable: 12 x 3 =36
5 variables : 36 x 5 = 180 combinations

RULE BASE & VALIDATION
Fuzzy logic based human perception model generated in MATLAB 2011
Source: Research output generated in MATLAB platform
• Model validation is carried out through iterations.
• Deviation from the base data
• Deviation reduced by changing the membership function and rules accordingly.

SCENARIO BUILDING
• Changing each attribute values, 4 scenario for optimal condition are
obtained using fuzzy logic.
• These scenario are the optimal condition where public transport ridership
will be 50%.
• These scenarios may help the decision makers to increase the ridership of
public transport in respect to people’s perception on mode choice.
Scenario 1 2 3 4
Invehicle time (min per km) 5 3 4 3
Discomfort level 3 2 1 1
Waiting time (min) 4 8 12 16
Journey Speed (kmph) 20 18 25 30
Travel cost (Paise per km) 58 20 100 125 Source: Output from the model
Formulation of scenario using human perception model

CONCLUSION
• With the help of fuzzy logic technique, a model has been developed
to increase the ridership of public transport with specific reference to
generalised cost.
• The usage of public transport increases with the change in the
attributes from 25% to 50% with existing human perception
captured through the primary survey.
• Worth mentioning factor is that the waiting time and the travel time
holds highest priority for the commuters.
• Thus changing values for these attributes is largely reflecting the
increase in ridership.
• Fuzzy logic based human perception model may help the transport
authorities to focus special attention to improve up on the required
area.
• Prioritization of best scenario can be done by applying it on ground.

REFERENCES
1. Amrita Sarkar, G. A. (2012). Application of fuzzy logic in transport planning.
International Journal on Soft Computing (IJSC), Vol.3,No.2.
2. Highways, M. O. (2013). Road Transport Year Book 2011-2012. New Delhi:
Government of India.
3. KSUDP. (2003). City Development Plan. Thiruvananthapuram:
Thiruvananthapuram municipality.
4. O.P, A. ((2006)). India Infrastructure Report,6.Urban Transport,. New Delhi:
Oxford University Press.
5. Pradip sarkar, E. M. (2013). Development of fuzzy logic based mode choice model
considering various public transport policy. IJTTE, 408-425.
6. Tharwat O. S. Hanafy, A. (2014). Identification of Uncertain Nonlinear MIMO
Spacecraft Systems Using Coactive Neuro Fuzzy Inference System (CANFIS) .
INTERNATIONAL JOURNAL OF CONTROL, AUTOMATION AND SYSTEMS ,
VOL.3 NO.2 .
7. Vythoulkas, P. C. (2003). Modeling discrete choice behavior using concepts from
fuzzy set theory, approximate reasoning and neural networks. Transportation
Research Part C: Emerging Technologies, 51-73.