Vasa Retail & Overseas Limited - nseindia.com Retail and Overseas Limited 2
Q2 FY18 Investor Presentation November 2017
FUTURE RETAIL LIMITED
FRL | Q2 FY18 Investor Presentation
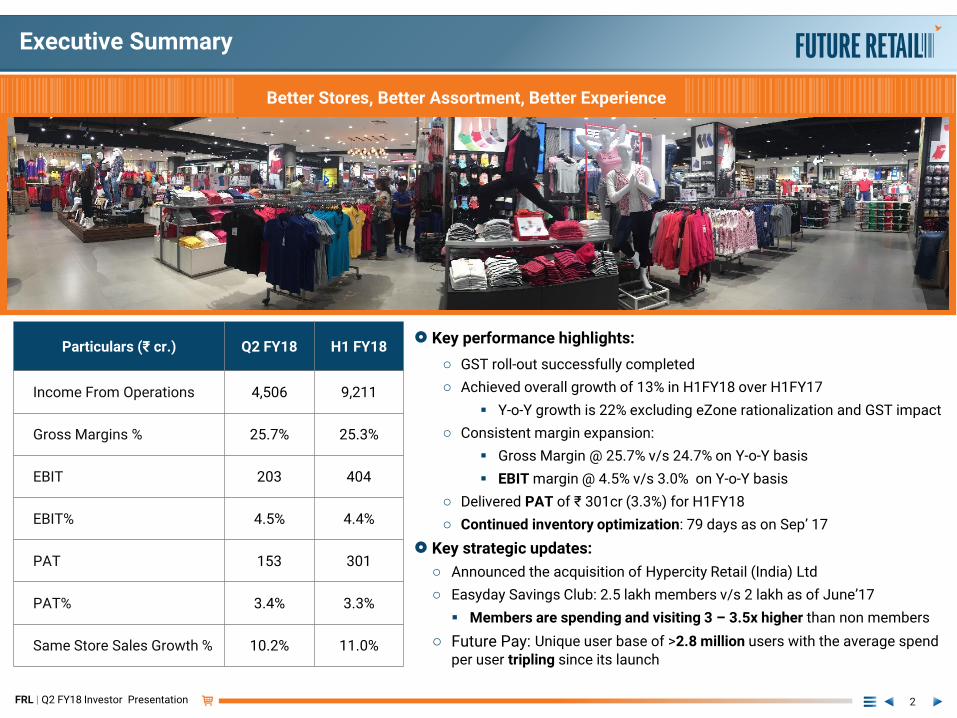
Key performance highlights:
o GST roll-out successfully completed
o Achieved overall growth of 13% in H1FY18 over H1FY17
Y-o-Y growth is 22% excluding eZone rationalization and GST impact
o Consistent margin expansion:
Gross Margin @ 25.7% v/s 24.7% on Y-o-Y basis
EBIT margin @ 4.5% v/s 3.0% on Y-o-Y basis
o Delivered PAT of ₹ 301cr (3.3%) for H1FY18
o Continued inventory optimization: 79 days as on Sep’ 17
Key strategic updates:
o Announced the acquisition of Hypercity Retail (India) Ltd
o Easyday Savings Club: 2.5 lakh members v/s 2 lakh as of June’17
Members are spending and visiting 3 – 3.5x higher than non members
o Future Pay: Unique user base of >2.8 million users with the average spend
per user tripling since its launch
Executive Summary
2
2
Better Stores, Better Assortment, Better Experience
Particulars (₹ cr.) Q2 FY18 H1 FY18
Income From Operations 4,506 9,211
Gross Margins % 25.7% 25.3%
EBIT 203 404
EBIT% 4.5% 4.4%
PAT 153 301
PAT% 3.4% 3.3%
Same Store Sales Growth % 10.2% 11.0%
FRL | Q2 FY18 Investor Presentation
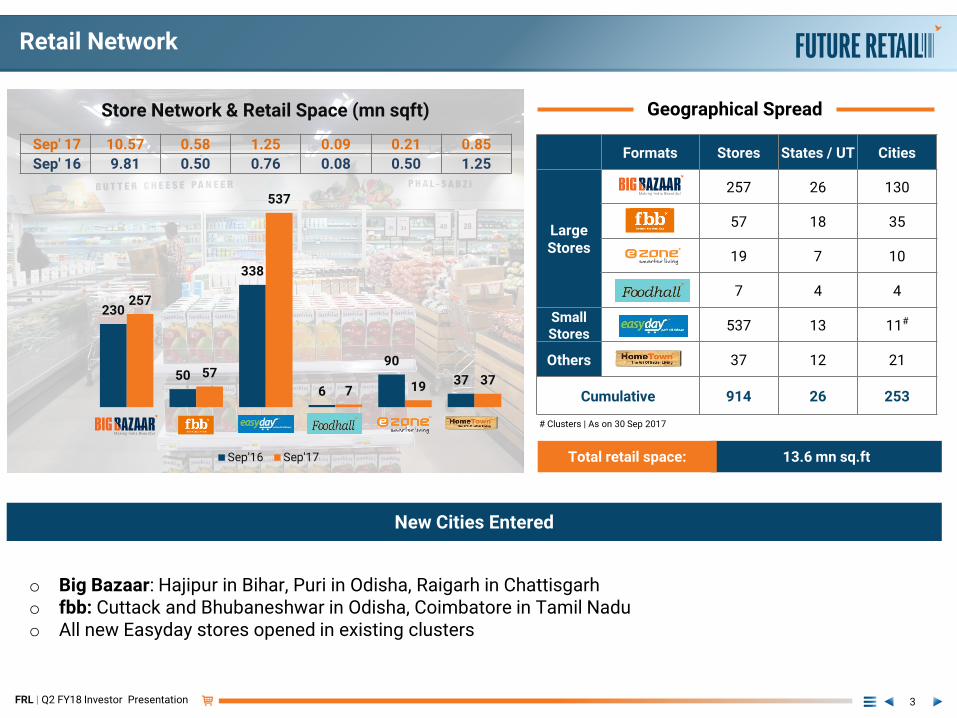
Retail Network
3
230
50
338
6
90
37
257
57
537
7 19 37
Store Network & Retail Space (mn sqft)
Sep'16 Sep'17
Sep' 17 10.57 0.58 1.25 0.09 0.21 0.85
Sep' 16 9.81 0.50 0.76 0.08 0.50 1.25Formats Stores States / UT Cities
Large Stores
257 26 130
fbb 57 18 35
19 7 10
7 4 4
Small Stores
537 13 11#
Others 37 12 21
Cumulative 914 26 253
Geographical Spread
13.6 mn sq.ft
# Clusters | As on 30 Sep 2017
Total retail space:
New Cities Entered
o Big Bazaar: Hajipur in Bihar, Puri in Odisha, Raigarh in Chattisgarho fbb: Cuttack and Bhubaneshwar in Odisha, Coimbatore in Tamil Naduo All new Easyday stores opened in existing clusters
FRL | Q2 FY18 Investor Presentation
Performance Update
4
FRL | Q2 FY18 Investor Presentation
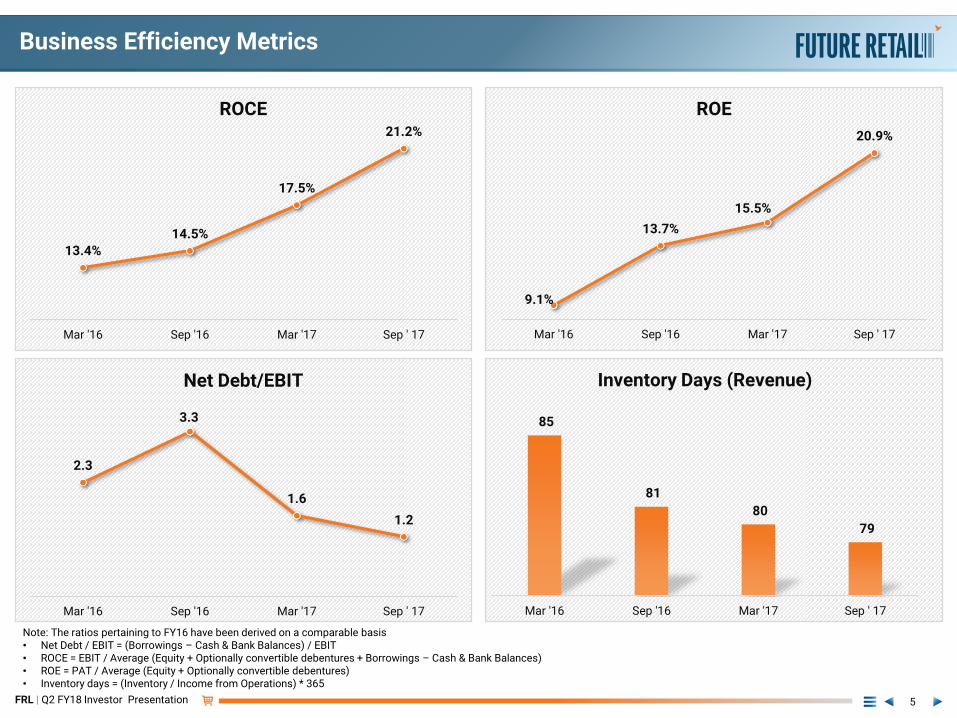
Business Efficiency Metrics
5
85
81
80
79
Mar '16 Sep '16 Mar '17 Sep ' 17
Inventory Days (Revenue)
9.1%
13.7%
15.5%
20.9%
Mar '16 Sep '16 Mar '17 Sep ' 17
ROE
13.4%
14.5%
17.5%
21.2%
Mar '16 Sep '16 Mar '17 Sep ' 17
ROCE
2.3
3.3
1.6
1.2
Mar '16 Sep '16 Mar '17 Sep ' 17
Net Debt/EBIT
Note: The ratios pertaining to FY16 have been derived on a comparable basis• Net Debt / EBIT = (Borrowings – Cash & Bank Balances) / EBIT• ROCE = EBIT / Average (Equity + Optionally convertible debentures + Borrowings – Cash & Bank Balances)• ROE = PAT / Average (Equity + Optionally convertible debentures)• Inventory days = (Inventory / Income from Operations) * 365
FRL | Q2 FY18 Investor Presentation
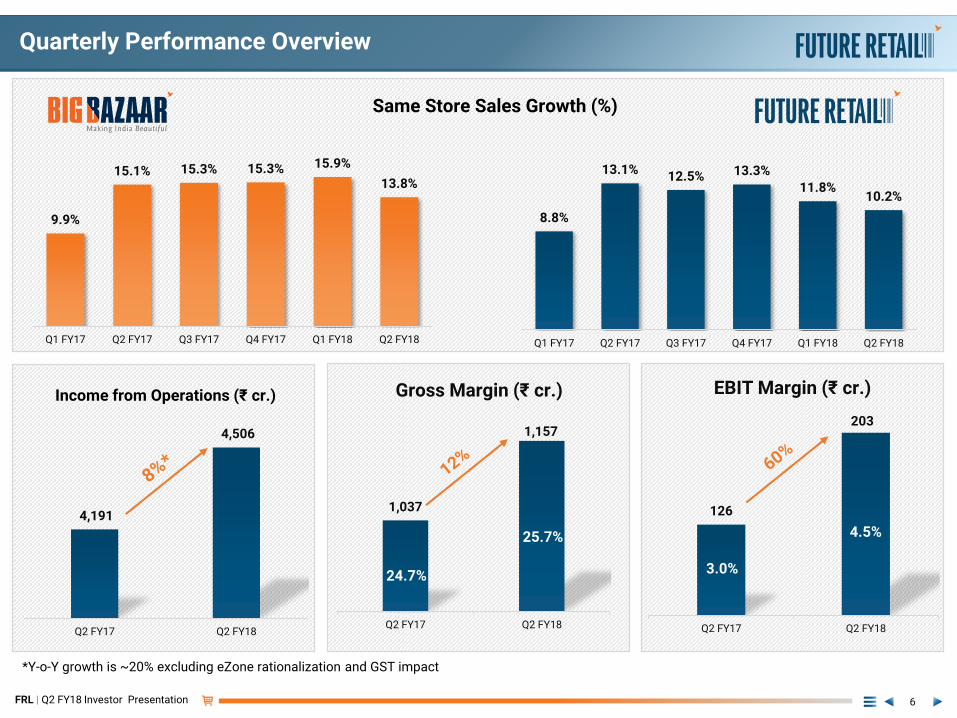
126
203
Q2 FY17 Q2 FY18
EBIT Margin (₹ cr.)
3.0%
4.5%4,191
4,506
Q2 FY17 Q2 FY18
Income from Operations (₹ cr.)
1,037
1,157
Q2 FY17 Q2 FY18
Gross Margin (₹ cr.)
24.7%
25.7%
Quarterly Performance Overview
6
8.8%
13.1%12.5% 13.3%
11.8%10.2%
Q1 FY17 Q2 FY17 Q3 FY17 Q4 FY17 Q1 FY18 Q2 FY18
*Y-o-Y growth is ~20% excluding eZone rationalization and GST impact
9.9%
15.1% 15.3% 15.3% 15.9%
13.8%
Q1 FY17 Q2 FY17 Q3 FY17 Q4 FY17 Q1 FY18 Q2 FY18
Same Store Sales Growth (%)
FRL | Q2 FY18 Investor Presentation
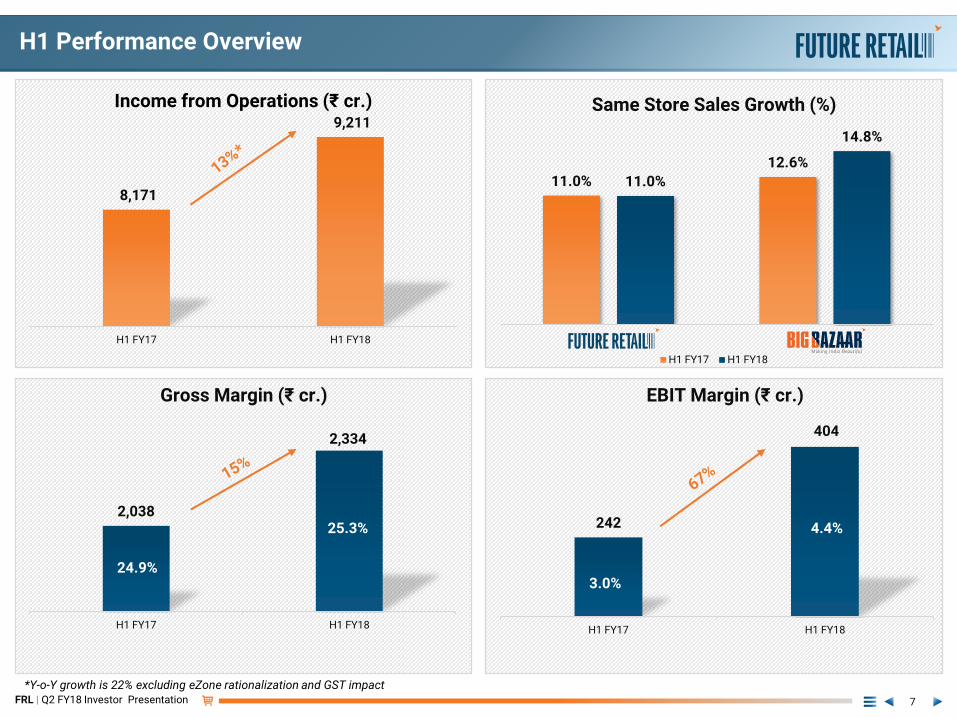
H1 Performance Overview
7
8,171
9,211
H1 FY17 H1 FY18
Income from Operations (₹ cr.)
11.0%
12.6%
11.0%
14.8%
Same Store Sales Growth (%)
H1 FY17 H1 FY18
2,038
2,334
H1 FY17 H1 FY18
Gross Margin (₹ cr.)
24.9%
25.3% 242
404
H1 FY17 H1 FY18
EBIT Margin (₹ cr.)
3.0%
4.4%
*Y-o-Y growth is 22% excluding eZone rationalization and GST impact
FRL | Q2 FY18 Investor Presentation
P&L Statement
8
Quarter ended Growth
Particulars (₹ cr.) 30-Sep-17 30-Jun-17 30-Sep-16 Y-o-Y Q-o-Q
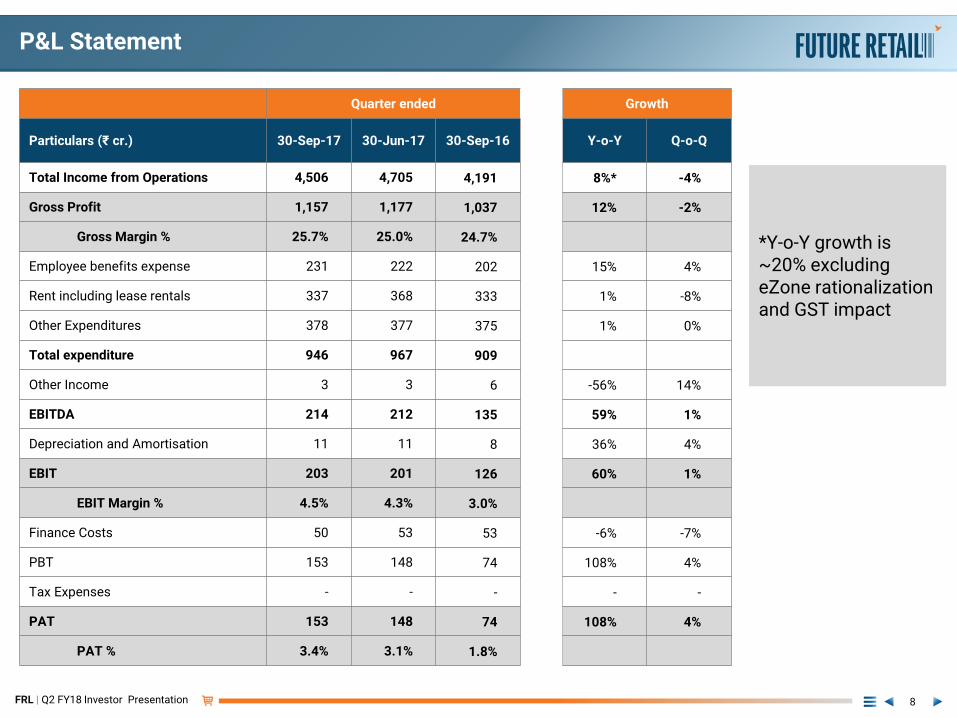
Total Income from Operations 4,506 4,705 4,191 8%* -4%
Gross Profit 1,157 1,177 1,037 12% -2%
Gross Margin % 25.7% 25.0% 24.7%
Employee benefits expense 231 222 202 15% 4%
Rent including lease rentals 337 368 333 1% -8%
Other Expenditures 378 377 375 1% 0%
Total expenditure 946 967 909
Other Income 3 3 6 -56% 14%
EBITDA 214 212 135 59% 1%
Depreciation and Amortisation 11 11 8 36% 4%
EBIT 203 201 126 60% 1%
EBIT Margin % 4.5% 4.3% 3.0%
Finance Costs 50 53 53 -6% -7%
PBT 153 148 74 108% 4%
Tax Expenses - - - - -
PAT 153 148 74 108% 4%
PAT % 3.4% 3.1% 1.8%
*Y-o-Y growth is ~20% excluding eZone rationalization and GST impact
FRL | Q2 FY18 Investor Presentation
Balance Sheet
9
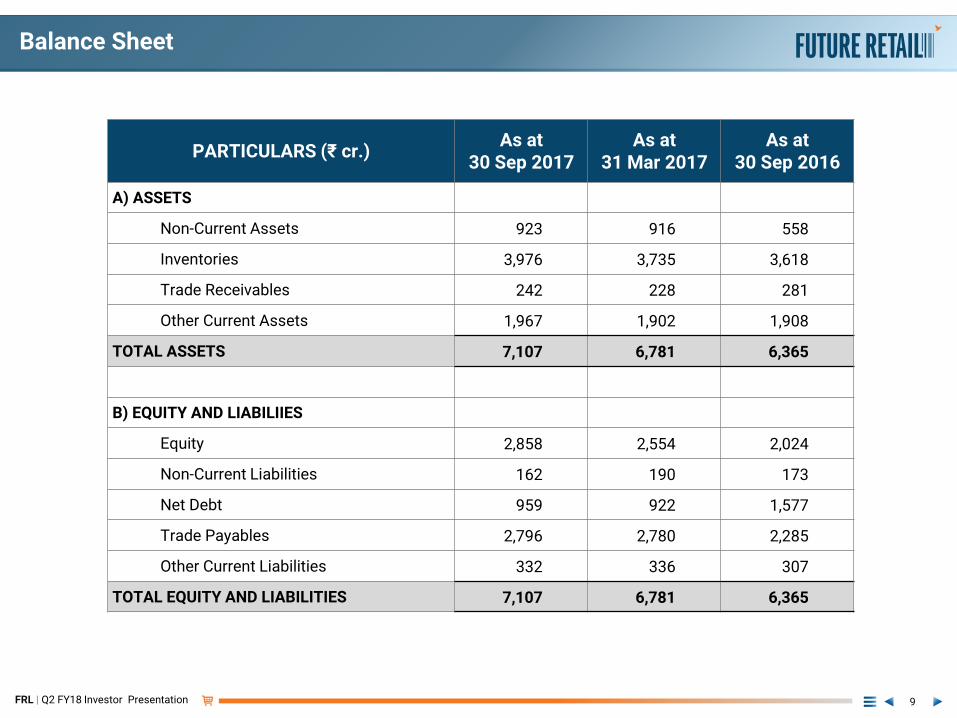
PARTICULARS (₹ cr.)As at
30 Sep 2017As at
31 Mar 2017As at
30 Sep 2016
A) ASSETS
Non-Current Assets 923 916 558
Inventories 3,976 3,735 3,618
Trade Receivables 242 228 281
Other Current Assets 1,967 1,902 1,908
TOTAL ASSETS 7,107 6,781 6,365
B) EQUITY AND LIABILIIES
Equity 2,858 2,554 2,024
Non-Current Liabilities 162 190 173
Net Debt 959 922 1,577
Trade Payables 2,796 2,780 2,285
Other Current Liabilities 332 336 307
TOTAL EQUITY AND LIABILITIES 7,107 6,781 6,365
FRL | Q2 FY18 Investor Presentation
Marketing and Milestones
10
FRL | Q2 FY18 Investor Presentation
Differentiated Marketing Strategy
11
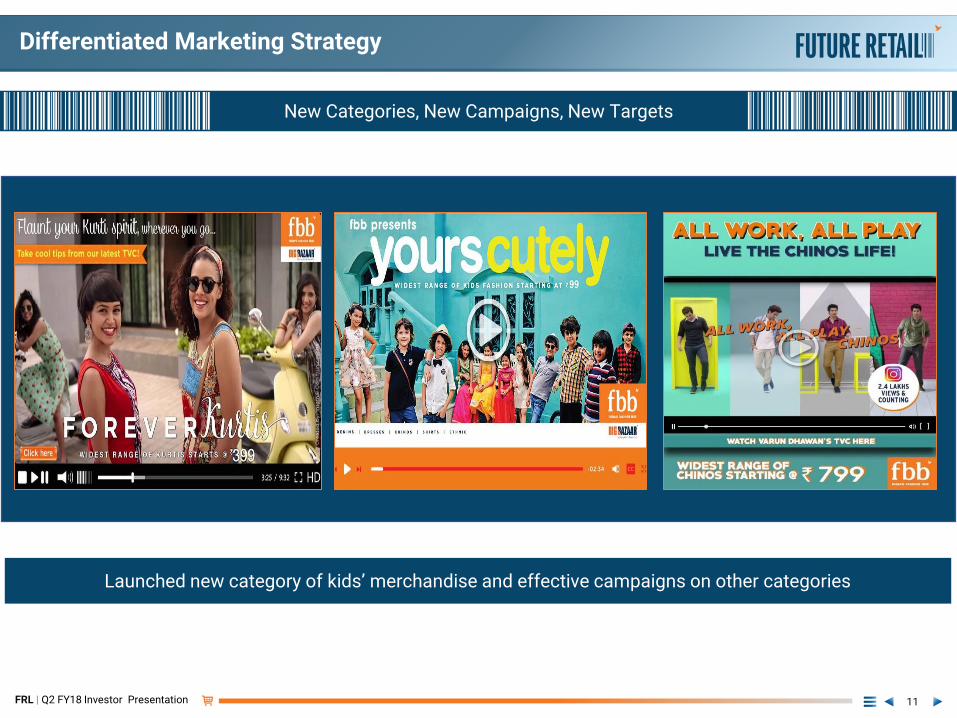
Launched new category of kids’ merchandise and effective campaigns on other categories
New Categories, New Campaigns, New Targets
FRL | Q2 FY18 Investor Presentation
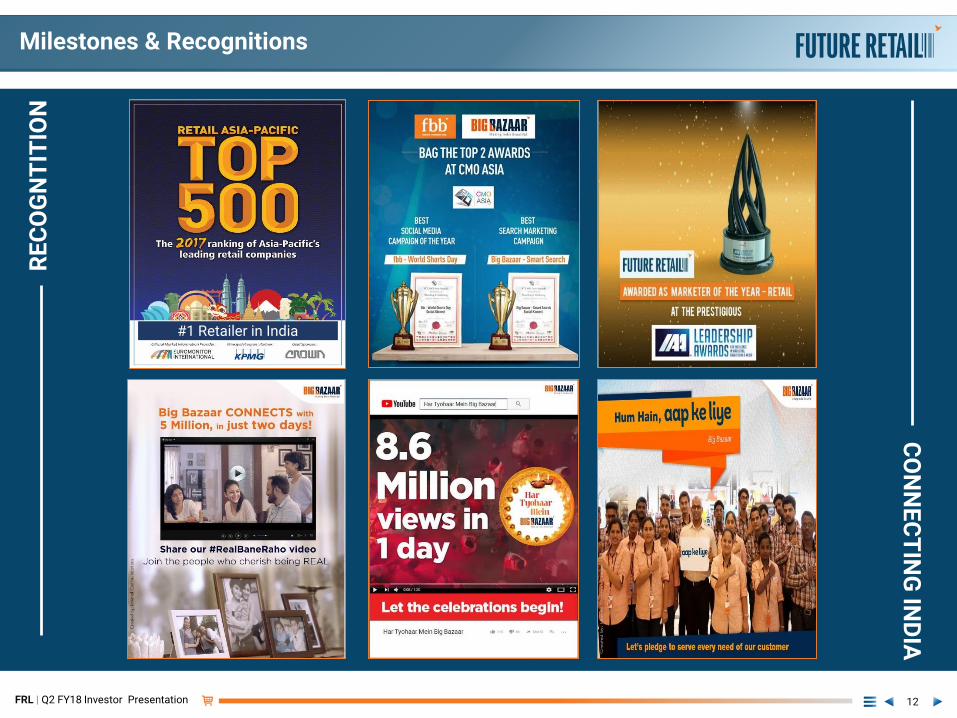
Milestones & Recognitions
12
RE
CO
GN
TIT
ION
CO
NN
EC
TIN
G IN
DIA
#1 Retailer in India
FRL | Q2 FY18 Investor Presentation
Acquisition of Hypercity Retail (India) Limited
13
FRL | Q2 FY18 Investor Presentation
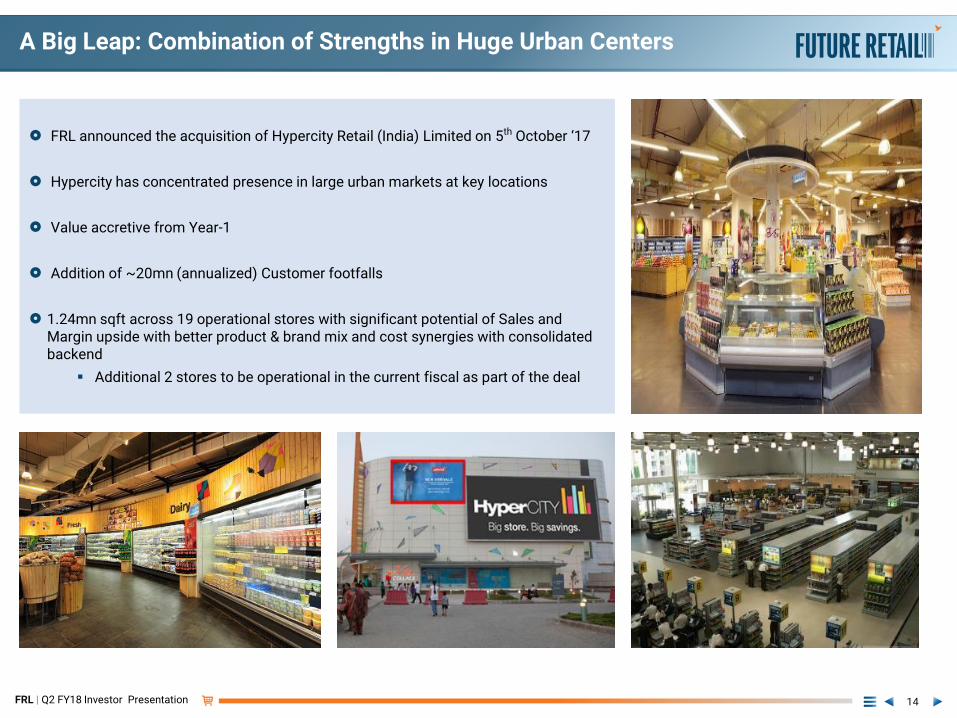
A Big Leap: Combination of Strengths in Huge Urban Centers
14
FRL announced the acquisition of Hypercity Retail (India) Limited on 5th October ‘17
Hypercity has concentrated presence in large urban markets at key locations
Value accretive from Year-1
Addition of ~20mn (annualized) Customer footfalls
1.24mn sqft across 19 operational stores with significant potential of Sales and Margin upside with better product & brand mix and cost synergies with consolidated backend
Additional 2 stores to be operational in the current fiscal as part of the deal
FRL | Q2 FY18 Investor Presentation
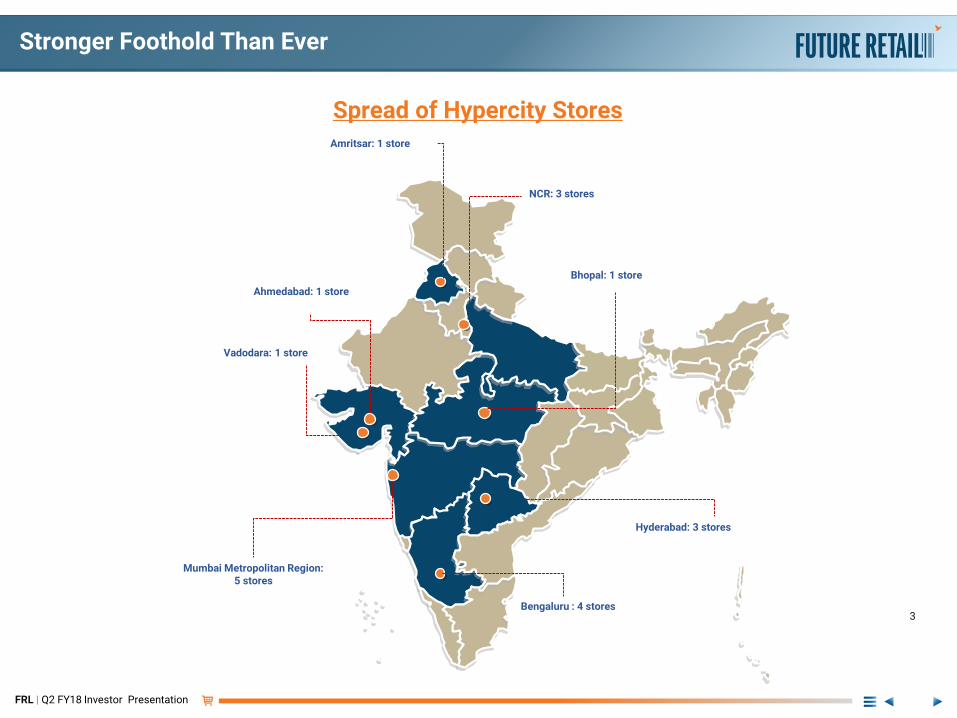
Stronger Foothold Than Ever
NCR: 3 stores
Mumbai Metropolitan Region: 5 stores
Hyderabad: 3 stores
Bengaluru : 4 stores
Amritsar: 1 store
Bhopal: 1 store
Ahmedabad: 1 store
Vadodara: 1 store
3
Spread of Hypercity Stores
FRL | Q2 FY18 Investor Presentation
Rationale & Immediate Potential
16
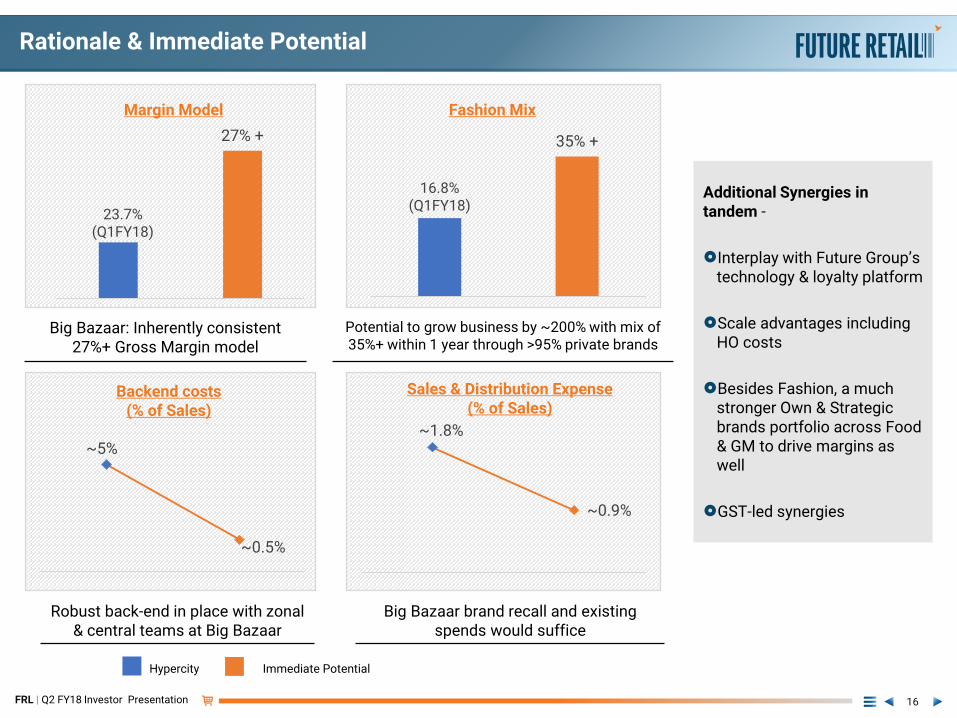
16.8%(Q1FY18)
35% +
Fashion Mix
23.7%(Q1FY18)
27% +
Margin Model
~1.8%
~0.9%
Sales & Distribution Expense(% of Sales)
~5%
~0.5%
Backend costs (% of Sales)
Big Bazaar: Inherently consistent 27%+ Gross Margin model
Big Bazaar brand recall and existing spends would suffice
Potential to grow business by ~200% with mix of 35%+ within 1 year through >95% private brands
Robust back-end in place with zonal & central teams at Big Bazaar
Additional Synergies in tandem -
Interplay with Future Group’s technology & loyalty platform
Scale advantages including HO costs
Besides Fashion, a much stronger Own & Strategic brands portfolio across Food & GM to drive margins as well
GST-led synergies
Hypercity Immediate Potential
FRL | Q2 FY18 Investor Presentation
Transaction Structure
17
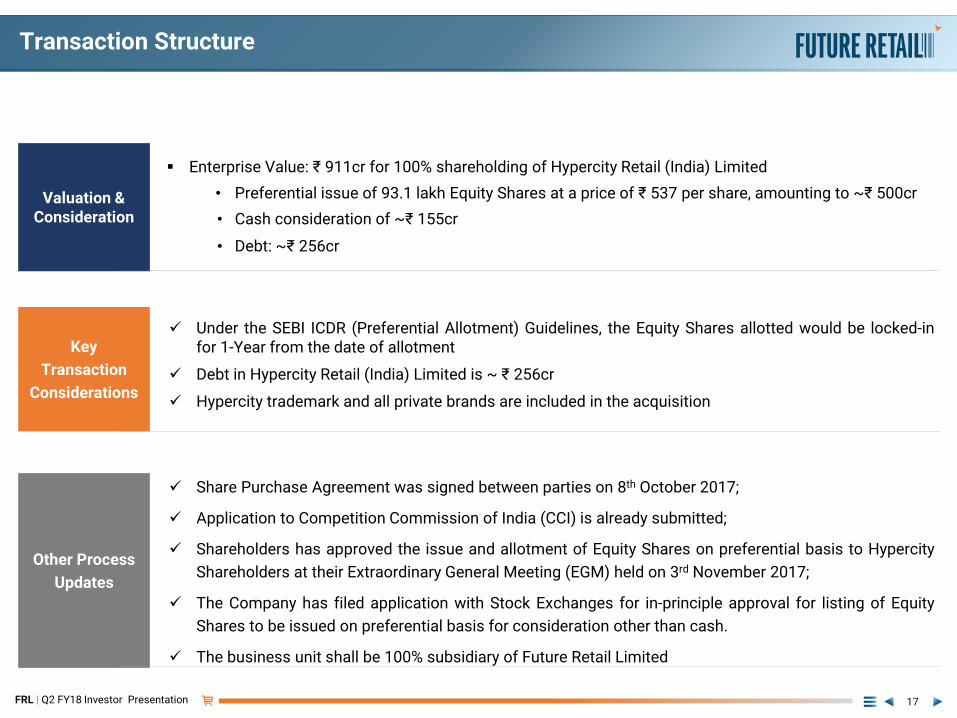
Valuation & Consideration
Enterprise Value: ₹ 911cr for 100% shareholding of Hypercity Retail (India) Limited
• Preferential issue of 93.1 lakh Equity Shares at a price of ₹ 537 per share, amounting to ~₹ 500cr
• Cash consideration of ~₹ 155cr
• Debt: ~₹ 256cr
Key
Transaction
Considerations
Under the SEBI ICDR (Preferential Allotment) Guidelines, the Equity Shares allotted would be locked-infor 1-Year from the date of allotment
Debt in Hypercity Retail (India) Limited is ~ ₹ 256cr
Hypercity trademark and all private brands are included in the acquisition
Other Process
Updates
Share Purchase Agreement was signed between parties on 8th October 2017;
Application to Competition Commission of India (CCI) is already submitted;
Shareholders has approved the issue and allotment of Equity Shares on preferential basis to Hypercity
Shareholders at their Extraordinary General Meeting (EGM) held on 3rd November 2017;
The Company has filed application with Stock Exchanges for in-principle approval for listing of Equity
Shares to be issued on preferential basis for consideration other than cash.
The business unit shall be 100% subsidiary of Future Retail Limited
FRL | Q2 FY18 Investor Presentation
Other Corporate Updates
18
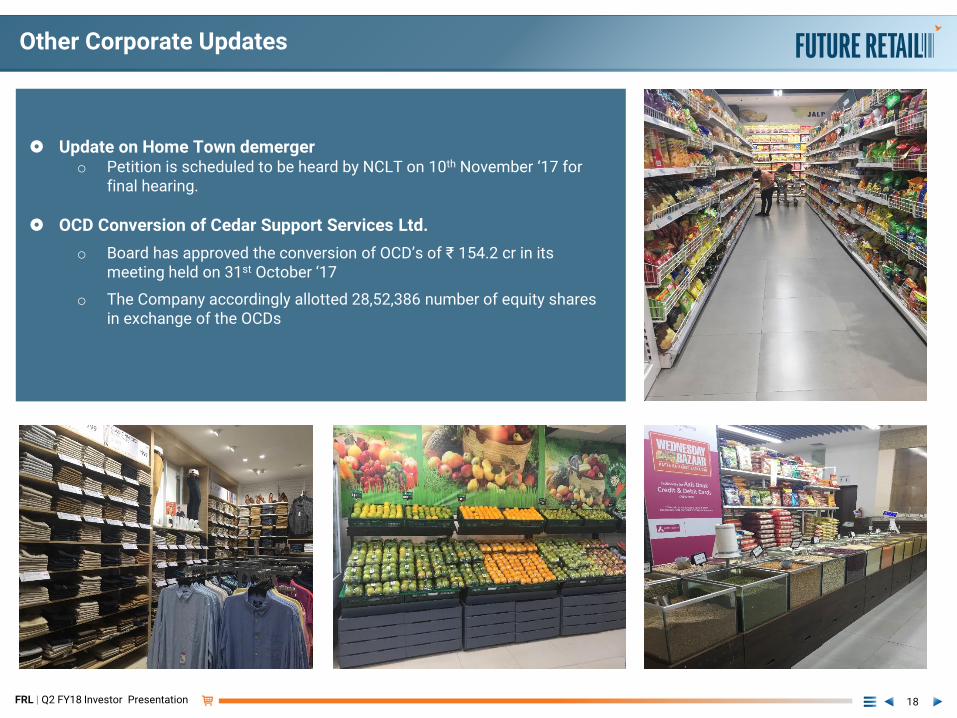
Update on Home Town demerger o Petition is scheduled to be heard by NCLT on 10th November ‘17 for
final hearing.
OCD Conversion of Cedar Support Services Ltd.
o Board has approved the conversion of OCD’s of ₹ 154.2 cr in its meeting held on 31st October ‘17
o The Company accordingly allotted 28,52,386 number of equity shares in exchange of the OCDs
NAMASTE
This report contains forward-looking statements, which may be identified by their use of words like ‘plans’, ‘expects’, ‘will’, ‘anticipates’, ‘believes’, ‘intends’, ‘projects’, ‘estimates’, or other words of similar meaning. All statements that address expectations or projections about the future, including but not limited to statements about the Company’s strategy for growth, product development, market position, expenditures, and financial results are forward-looking statements. Forward-looking statements arebased on certain assumptions and expectations of future events. The Company cannot guarantee that these assumptions and expectations are accurate or will be realized. The Company’s actual results, performance or achievements could thus differ materially from those projected in any such forward looking statements. The Company assumes no responsibility to publicly amend,modify or revise any forward looking statements, on the basis of any subsequent developments, information or events.


![Scanned by CamScannercentralexciseahmedabad3.nic.in/rti/34.pdf · LIMITED [DMART], B. HYPERCITY RETAIL LIMITED and C. SPENCERS RETAIL LIMITED under the Jurisdiction of Central GST,](https://static.fdocuments.us/doc/165x107/5f414ebd4791fa28024576ed/scanned-by-camscannercen-limited-dmart-b-hypercity-retail-limited-and-c-spencers.jpg)