Future People - Il Sole 24 Ore People Workplace Evolution in the ... 3. The adoption of...
68
Sponsored by: Future People Workplace Evolution in the Age of Digital Transformation
Transcript of Future People - Il Sole 24 Ore People Workplace Evolution in the ... 3. The adoption of...
1
Sponsored by:
Future PeopleWorkplace Evolution in the Age of Digital Transformation
2
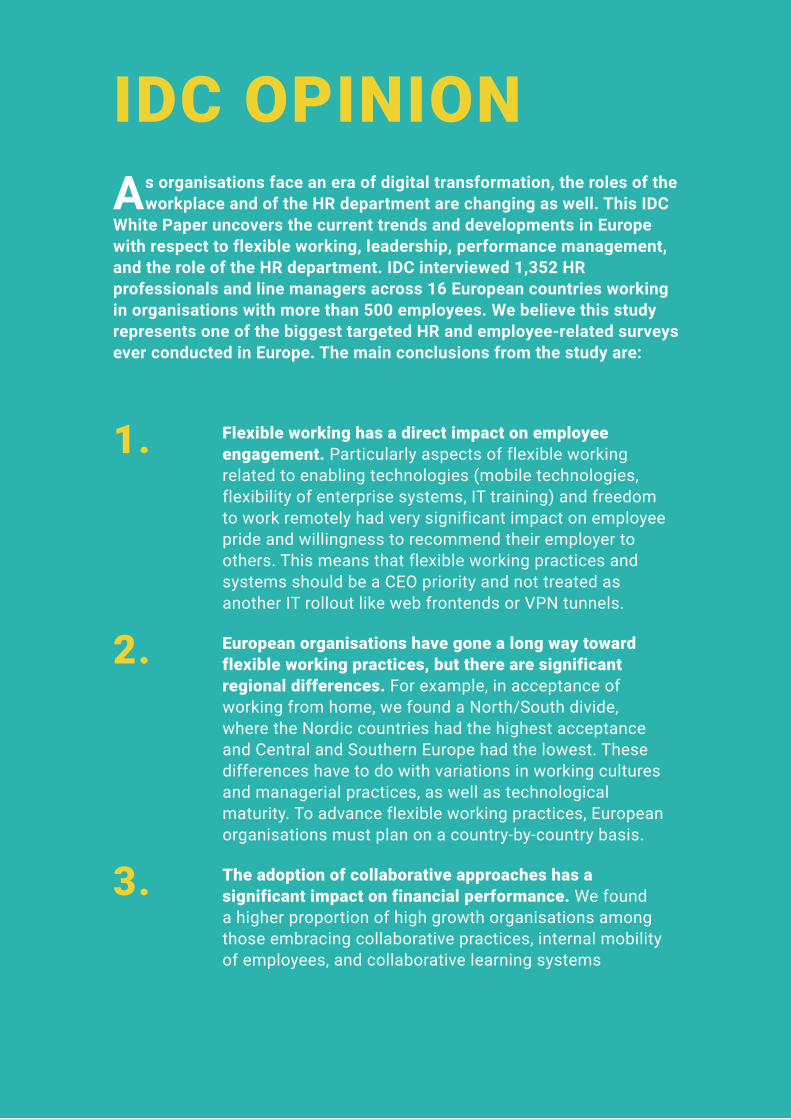
As organisations face an era of digital transformation, the roles of the workplace and of the HR department are changing as well. This IDC
White Paper uncovers the current trends and developments in Europe with respect to flexible working, leadership, performance management, and the role of the HR department. IDC interviewed 1,352 HR professionals and line managers across 16 European countries working in organisations with more than 500 employees. We believe this study represents one of the biggest targeted HR and employee-related surveys ever conducted in Europe. The main conclusions from the study are:
1. Flexible working has a direct impact on employee engagement. Particularly aspects of flexible working related to enabling technologies (mobile technologies, flexibility of enterprise systems, IT training) and freedom to work remotely had very significant impact on employee pride and willingness to recommend their employer to others. This means that flexible working practices and systems should be a CEO priority and not treated as another IT rollout like web frontends or VPN tunnels.
2. European organisations have gone a long way toward flexible working practices, but there are significant regional differences. For example, in acceptance of working from home, we found a North/South divide, where the Nordic countries had the highest acceptance and Central and Southern Europe had the lowest. These differences have to do with variations in working cultures and managerial practices, as well as technological maturity. To advance flexible working practices, European organisations must plan on a country-by-country basis.
3. The adoption of collaborative approaches has a significant impact on financial performance. We found a higher proportion of high growth organisations among those embracing collaborative practices, internal mobility of employees, and collaborative learning systems
IDC OPINION
3
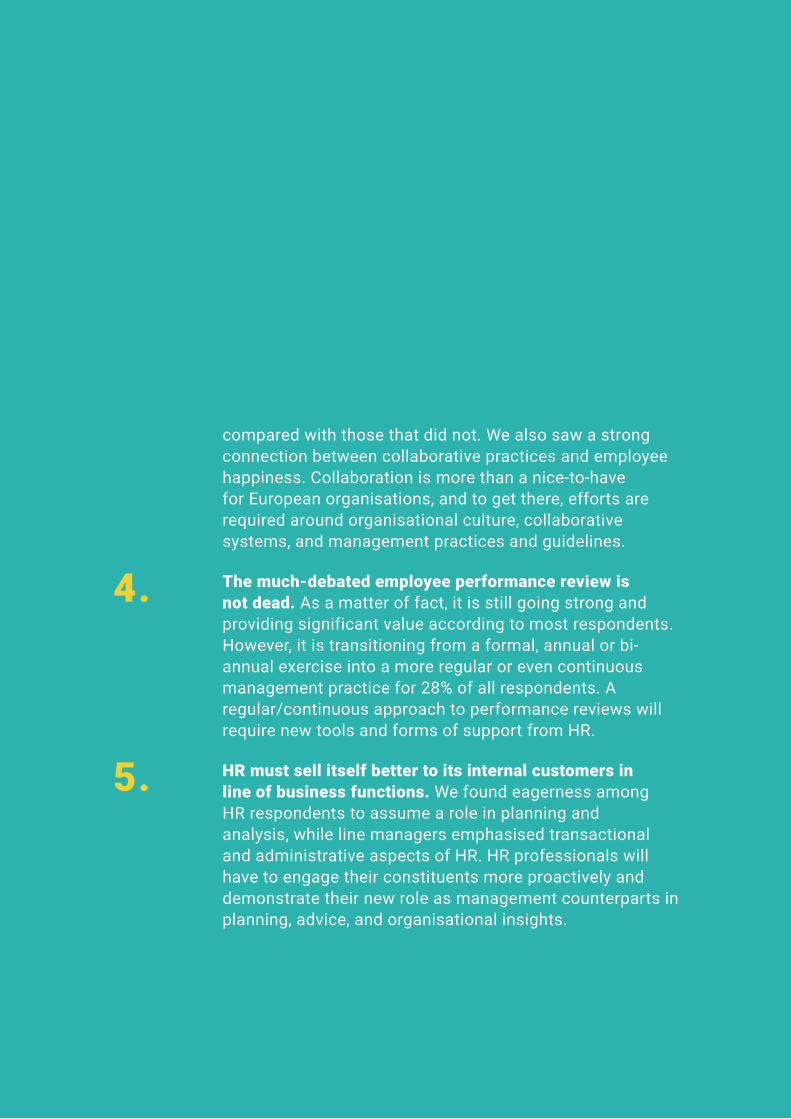
compared with those that did not. We also saw a strong connection between collaborative practices and employee happiness. Collaboration is more than a nice-to-have for European organisations, and to get there, efforts are required around organisational culture, collaborative systems, and management practices and guidelines.
4. The much-debated employee performance review is not dead. As a matter of fact, it is still going strong and providing significant value according to most respondents. However, it is transitioning from a formal, annual or bi-annual exercise into a more regular or even continuous management practice for 28% of all respondents. A regular/continuous approach to performance reviews will require new tools and forms of support from HR.
5. HR must sell itself better to its internal customers in line of business functions. We found eagerness among HR respondents to assume a role in planning and analysis, while line managers emphasised transactional and administrative aspects of HR. HR professionals will have to engage their constituents more proactively and demonstrate their new role as management counterparts in planning, advice, and organisational insights.
4
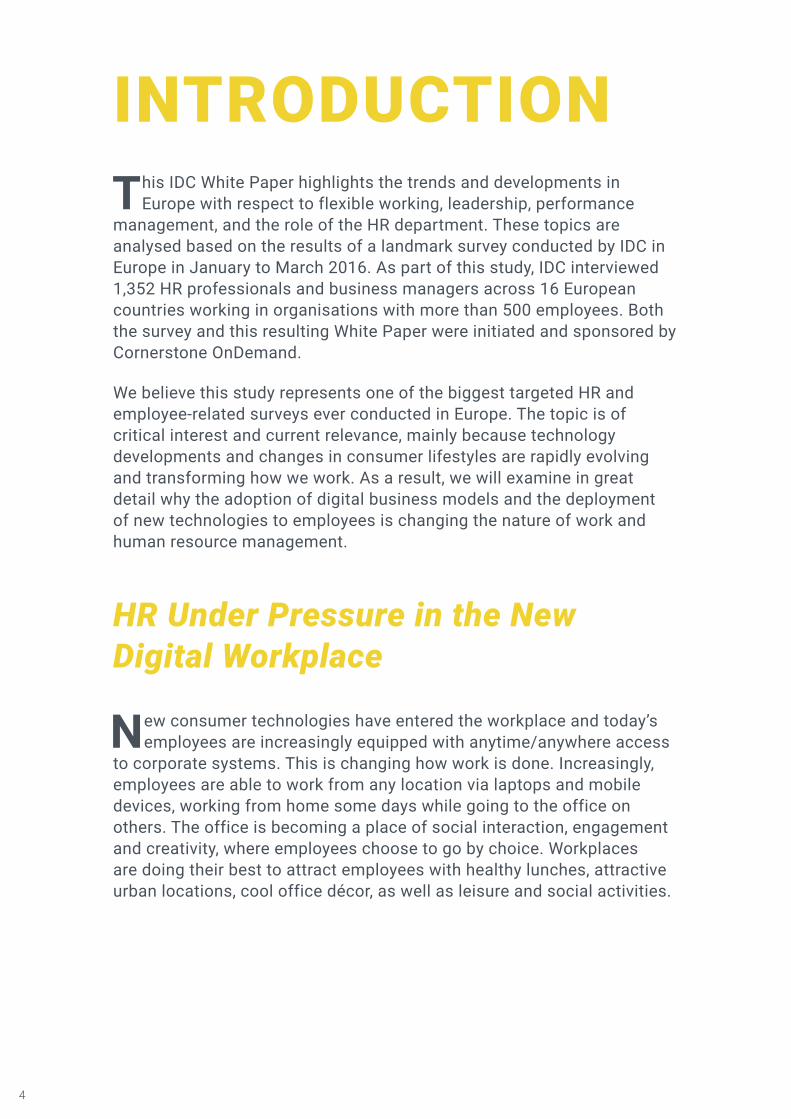
This IDC White Paper highlights the trends and developments in Europe with respect to flexible working, leadership, performance
management, and the role of the HR department. These topics are analysed based on the results of a landmark survey conducted by IDC in Europe in January to March 2016. As part of this study, IDC interviewed 1,352 HR professionals and business managers across 16 European countries working in organisations with more than 500 employees. Both the survey and this resulting White Paper were initiated and sponsored by Cornerstone OnDemand.
We believe this study represents one of the biggest targeted HR and employee-related surveys ever conducted in Europe. The topic is of critical interest and current relevance, mainly because technology developments and changes in consumer lifestyles are rapidly evolving and transforming how we work. As a result, we will examine in great detail why the adoption of digital business models and the deployment of new technologies to employees is changing the nature of work and human resource management.
HR Under Pressure in the New Digital Workplace
New consumer technologies have entered the workplace and today’s employees are increasingly equipped with anytime/anywhere access
to corporate systems. This is changing how work is done. Increasingly, employees are able to work from any location via laptops and mobile devices, working from home some days while going to the office on others. The office is becoming a place of social interaction, engagement and creativity, where employees choose to go by choice. Workplaces are doing their best to attract employees with healthy lunches, attractive urban locations, cool office décor, as well as leisure and social activities.
INTRODUCTION
5
With flexible working, organisations increasingly manage employees via goal measurement as opposed to supervision, since employees can be out of sight. New, more dispersed organisational structures have become possible as teams can interact continuously over digital channels and in some cases organisations without physical offices have emerged. Social technologies inspired by YouTube mean that employees become both learners and trainers, creating and posting new content to share on the corporate social networks or on the private ones. Employees also actively participate in peer evaluations via social feedback.
Meanwhile, employers are also changing and becoming digital as they use new technologies to adapt to or drive disruptive changes within their customer base and markets. An IDC survey showed that over half of European organisations (59% of respondents) declared digital transformation a key priority for 2015 and 2016 (source: IDC’s European Software Survey, n=1,451, April 2015).
Digital transformation strongly affects employees. Transactional customer-facing roles are on the decline, whereas new skills on digital design and engagement are in great demand. Key employee roles require training and new skills and we see an increased focus on internal employee mobility.
Furthermore, organisations are being exposed on social media networks. Successful talent attraction is highly dependent on a wide reach of relevant social media networks; applications are received as ‘one-click-submissions’ on LinkedIn, and employer attractiveness is continuously evaluated in public on Glassdoor. Employees themselves act as recruiters as they refer prospective new hires via social networks. The bar for excellence in recruiting and employer branding is constantly being raised.
6
These fundamental changes are challenging human resource management in three ways:
1. Employees demand flexible and collaborative workplaces with consumer-grade technologies. The influx of digital technologies from the consumer world into the workplace is opening a wealth of new possibilities for flexible working and productivity gains. But it is also raising the expectations of employees in terms of workplace flexibility and tech support. Those organisations that do not upgrade employee systems, devices, work policies, and physical conditions risk facing difficulties in attracting and keeping talented employees.
2. Organisations demand employee reviews that are less formal and more frequent and digital. The formal, annual appraisal is not in vogue and widely regarded as inflexible and bureaucratic. Today, HR professionals must find ways to apply the rigor and consistency of the annual appraisal processes to more frequent and informal feedback processes involving managers and employees. Furthermore, as managers take on more and more of the transactional HR tasks, HR professionals must figure out how best to support them. Finally, organisations are looking to link appraisals with employee development, skills review, and training, as opposed to a mere performance evaluation.
7
3. As HR processes become digital, HR and line management must agree on a new charter for the HR function. HR professionals that used to drown in emails, Excel sheets, Word-based forms, and paper, increasingly leave the transactional HR tasks to the relevant employees and managers. What started as simple employee and manager self-service portals are evolving into full-function employee and manager applications. Transactional HR tasks disappear as a result, while new opportunities arise for HR to do more strategic work mining digital HR data and getting actionable business insights. However, HR must carefully balance long-term aspirations with short-term efficiency and responsiveness in answering immediate requests.
This White Paper will analyse these challenges in three separate sections and provide actionable advice to management and HR professionals, based on the survey findings.

8
In this section, we will examine how European organisations have embraced flexible working practices and take a closer look at remote working and the connection between flexible working practices and employee motivation.
FLEXIBLE WORKING AND EMPLOYEE MOTIVATION
9
Some Flexible Working Practices Are Widely Accepted in Europe, While Others Less So
IDC asked the 1,352 respondents what flexible working practices are currently allowed in their organisation. We presented them with 11 types
of flexible working practices and the results are shown in Figure 1.
The main finding is that flexible working practices are widely accepted in Europe. More than two-thirds of organisations (71%) permit working from home and 76% have made company systems and data available for remote workers.
The flexible working practices least adopted in Europe are bring-your-own-device (BYOD — 52%), flexible work desks (53%), leisure activities in the workplace (55%), and availability of company applications on mobile devices (59%). IDC believes the inhibitors are partly technology-driven (such as concerns related to data control and potential data loss from BYOD, as well as lack of mobile UX of company legacy applications) and partly cultural (such as the belief in the need of the physical desk for each employee and scepticism on payback leisure activities).

10
The flexible working practices most adopted by those surveyed were the ability to apply to outside positions (88%), availability of IT systems training (83%), modern work technologies (79%), and flexible working hours (78%). These are mainstream work conditions and reflect the critical importance of information technology for most job roles as well as the acceleration of change in the European labour market, where the idea of lifetime employment has vanished in all but a few organisations.
Interestingly, when comparing the responses from HR professionals and line managers, we found that HR generally indicated higher levels of flexible working than the ones actually managing people; i.e., line managers. Especially in the cases of working from home, internal mobility (such as employees applying for new positions outside their department), and open workspaces, HR appeared to overestimate the state of flexible working in their organisations. HR’s responses were between five and six percentage points higher than those of line managers for these areas, indicating a lack of alignment between HR policies and actual work practices.
We can only speculate about this disconnect. Probably, HR has been in charge of making flexible working possible and answer according to the goals of these efforts, whereas line managers see the end result, which is in many cases below HR’s overly optimistic expectations.

11
Employees can apply for new positions outside their current department
Training on IT tools is available
Latest technologies available
Working flexible hours allowed
Remote working enabled
Open workspaces available
Working from home allowed
Mobile working enabled
Leisure activities at workplace available
Flexible work desks available
Personal devices are allowed (e.g. Bring Your Own Device)
Figure 1 Proportion of organisations adopting flexible working practices Q. Please let us know if the following statements apply to your organisation
Note: N=1,352 Source: IDC, Cornerstone OnDemand HR-LOB Survey, March 2016
YES
NO

12
European Countries Embrace Flexible Work Practices at Different Speeds
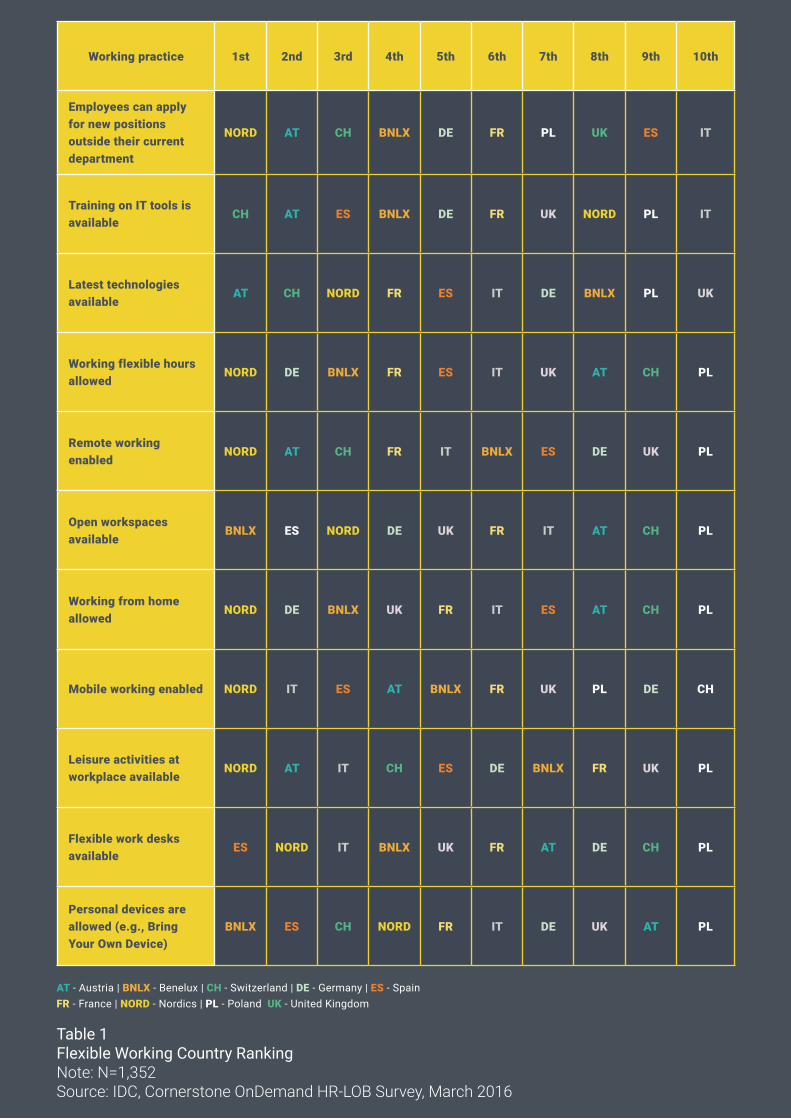
Despite the general positive adoption of flexible working in Europe, we found significant differences by geography. In Table 1, the differences
are shown as different colour coding ranging light blue (highest average overall adoption) to dark blue (lowest average overall adoption).
The table shows that European countries move at different speeds and with different preferences with respect to flexible working maturity. For example, among the respondents from Poland, less than 50% of surveyed organisations allowed employees to work from home, while the figure was 87% for the Nordic countries.
On average, the countries with lower flexible working adoption were Poland, the UK, Switzerland and Germany. In other words, the lowest flexible working maturity was clustered in Central and Eastern Europe and the UK. The countries with the highest general adoption of flexible working practices were the Nordics, Spain, Benelux and Austria.
We also found that country maturity patterns varied significantly depending on the specific flexible working practices. For example, Switzerland and Austria ranked highly on IT tools training and availability of the latest technologies, but ranked lower on open work spaces, flexible work desks, and acceptance of home working.
There were a few unexpected findings in this country ranking. We were surprised to see UK organisations have a relatively low position, given the competitive and deregulated labour market and the fact that recent third-party studies ranked the UK higher. Table 1 shows that the UK organisations were behind in technology factors, such as systems for remote working and BYOD, whereas the UK had a high adoption of work flexibility factors such as open work spaces and working from home. One reason for this could be a cultural bias, in which UK respondents “feel” they are not as flexible as they want, even if other studies show they are above average.
We were also surprised to see Spain rank highly in flexible working given the relatively high levels of unemployment and regulated labour market as well as low ranking of flexible working in Spain in EU studies. Spain appeared ahead in terms technology factors and open work spaces. Again, this could reflect a cultural bias in reverse, in which Spanish respondents feel further ahead in flexible than what is actually the case.
13
Table 1Flexible Working Country RankingNote: N=1,352Source: IDC, Cornerstone OnDemand HR-LOB Survey, March 2016
Working practice 1st 2nd 3rd 4th 5th 6th 7th 8th 9th 10th
Employees can apply for new positions outside their current department
NORD AT CH BNLX DE FR PL UK ES IT
Training on IT tools is available
CH AT ES BNLX DE FR UK NORD PL IT
Latest technologies available
AT CH NORD FR ES IT DE BNLX PL UK
Working flexible hours allowed
NORD DE BNLX FR ES IT UK AT CH PL
Remote working enabled
NORD AT CH FR IT BNLX ES DE UK PL
Open workspaces available
BNLX ES NORD DE UK FR IT AT CH PL
Working from home allowed
NORD DE BNLX UK FR IT ES AT CH PL
Mobile working enabled NORD IT ES AT BNLX FR UK PL DE CH
Leisure activities at workplace available
NORD AT IT CH ES DE BNLX FR UK PL
Flexible work desks available
ES NORD IT BNLX UK FR AT DE CH PL
Personal devices are allowed (e.g., Bring Your Own Device)
BNLX ES CH NORD FR IT DE UK AT PL
AT - Austria | BNLX - Benelux | CH - Switzerland | DE - Germany | ES - Spain FR - France | NORD - Nordics | PL - Poland UK - United Kingdom

14
Nature of Work Prevents Working From Home but So Do Security Concerns and IT Barriers
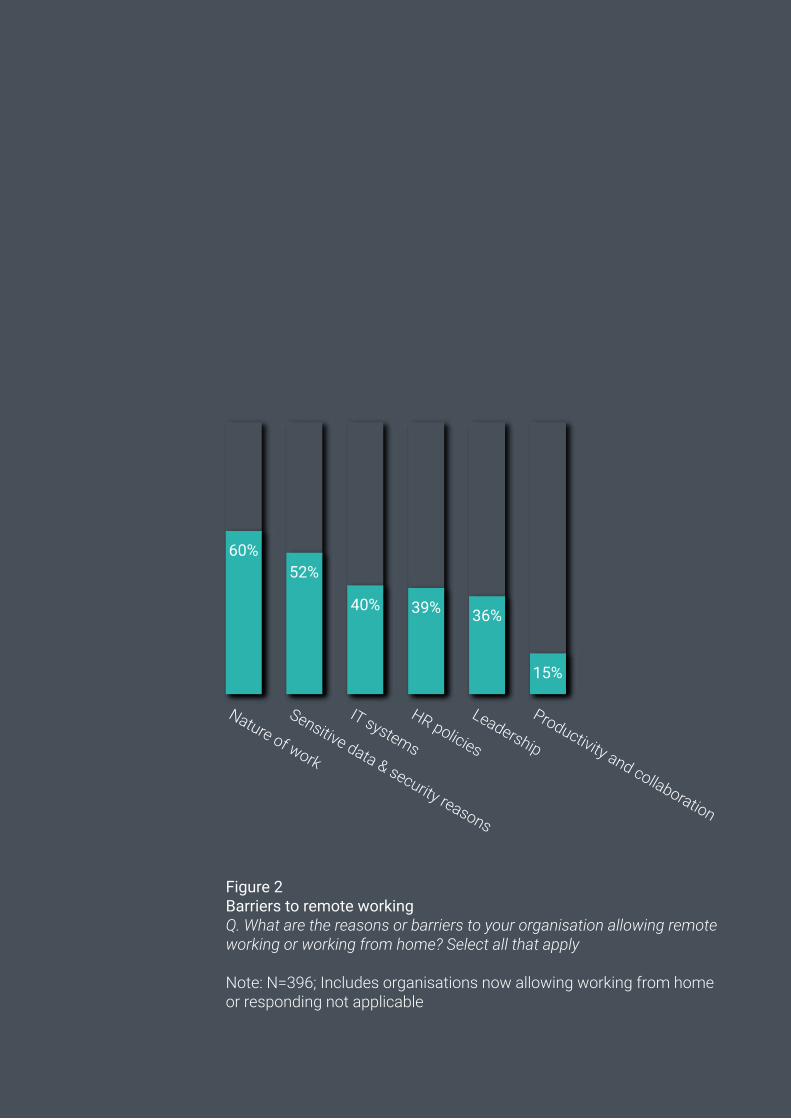
To gain more insight into home working as one of the key flexible working practices and why some organisations do not allow this, we
asked the 29% of respondents in organisations in which home working was not allowed why that was. The responses are shown in Figure 2.
Unsurprisingly, the most important reason was that the nature of the work prohibited working from home (60%). Examples could be production facilities, retail stores, branch banking, transportation, cleaning, patient or child care, etc. However, security concerns related to sensitive data (52%) were almost as important.
Interestingly, key barriers to working from home also included the inadequacy of IT tools for home working (40%), conflicts with HR policies (39%) and leadership opposition to home working (36%). These barriers used to be seen as the major obstacles, but the survey results show that IT, HR policies, and leadership preferences are no longer issues for the majority of organisations prohibiting home working.
IDC believes that all of these reasons for not allowing home working are somewhat dependent on perceptions and beliefs and will change over time as homeworking becomes more common. For example, many onsite jobs have significant administrative elements, which could be done offsite if needed. Furthermore, future development and adoption of cloud-based enterprise applications for all types of business processes as well as the adoption of web and mobile enabling middleware will allow more employees to work remotely.
15
Nature of work
Sensitive data & security reasons
IT systems
HR policies
Leadership
Productivity and collaboration
Figure 2 Barriers to remote workingQ. What are the reasons or barriers to your organisation allowing remote working or working from home? Select all that apply
Note: N=396; Includes organisations now allowing working from home or responding not applicable

16
In Organisations with Home Working Allowed, only 13% of Employees Do So
We asked organisations that allowed homeworking to specify the approximate proportion of the employee population that actually
works from home. The responses show that on average, only 13% of employees work from home. The remaining employees do not choose to work from home or are not allowed to do so.
The majority of respondents (59%) said that the proportion of employees working from home has increased over the past two years. Furthermore, the overwhelming majority (83%) agreed that those that work from home typically do so less than half of the workdays.
In terms of industries “Other Industries” (meaning telco, media, public sector, transportation) and Utilities and Business Services had the highest proportions, 15% and 13% respectively, of employees working from home. By country, Austria (30%), Nordics (19%), and Benelux (17%) had the highest proportions, while Poland (5%) and Switzerland (8%) had the lowest.
17
These results show that working from home is on the increase but it remains a privilege for a minority of employees. Moreover, the majority of employees practicing homeworking have a “blended approach” to their workplace, in which most days are spent at the company location and less than half of the workday is spent working from home. IDC believes that for many employees, the workplace is a critical source of professional identity, social interaction, and knowledge exchange. Companies enabling flexibility can get higher engagement as partial home office helps the work/life balance of employees.

18
Production, Operations, HR and IT Least Likely to be Allowed to Work from Home
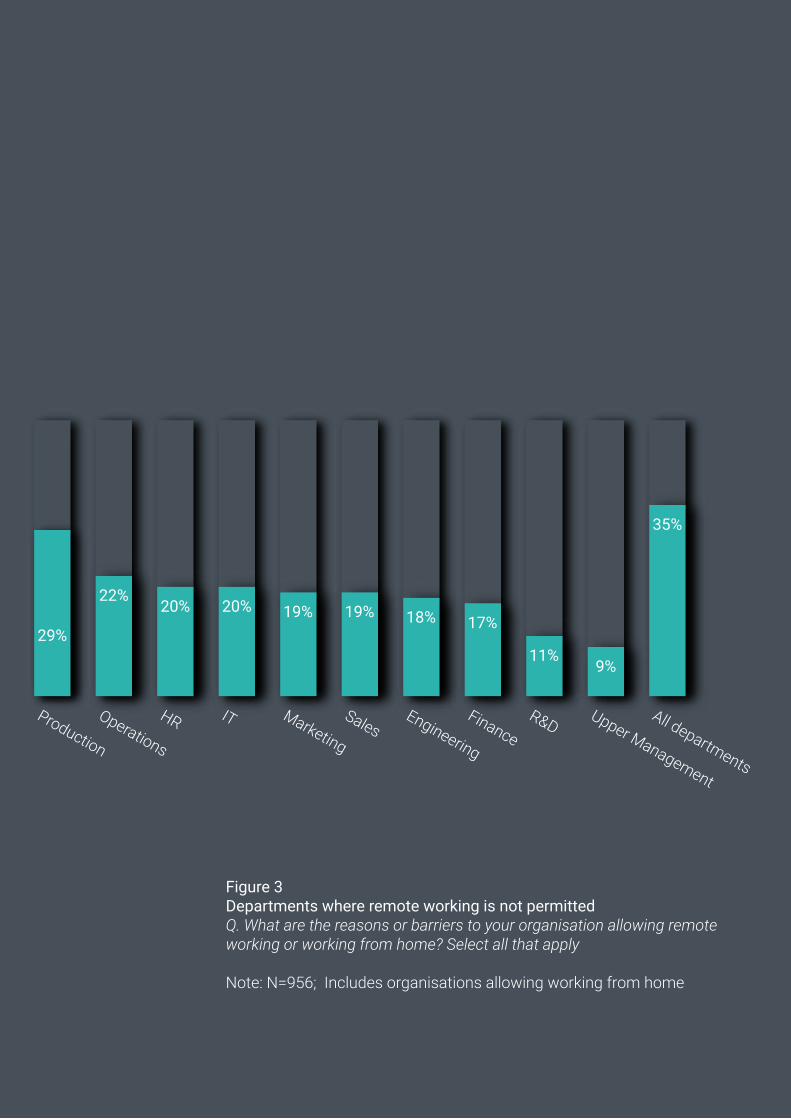
Figure 3 shows the responses of organisations that allowed home working if particular functions were excluded.
Over one-third of the respondents said all functions could work from home. However, a smaller proportion did call out the functions least permitted to work from home: Production (29%), Operations (22%), HR (20%), and IT (20%). The functions most permitted to work from home were Upper Management (only 9% not allowed) and R&D (11% not allowed).
The job roles that were least likely to be allowed to work from home were the job roles with more in-person communication and on-premise tasks, such as production line work or warehouse jobs. This was expected as physical presence is intrinsically linked to job tasks of these roles. However, it is less clear as to why do R&D and upper management have much more flexibility than the rest. One reason could be that organisational authority enables higher ranking job roles to define their role as suitable for remote working, as opposed to job roles with less authority.
Furthermore, it is interesting that more and more organisations may lift the ban on home working for all job roles in the future. The fact that over one-third said all roles could work from home shows that a sizeable proportion of organisations have already dispelled the idea of limiting working from home by job role or department. Given that flexible working typically only means partial home working, even job roles such as production or warehouse might have some of their tasks that could be performed remotely. Modern — and cheaper — mobile technology and social working capabilities should reinforce this trend.
19
Figure 3 Departments where remote working is not permitted Bar %Production 29%Operations 22%HR 20%IT 20%Marketing 19%Sales 19%Engineering 18%Finance 17%R&D 11%Upper Management 9%All departments allow remote working 35%Note: N=956; Includes organisations allowing working from home
Figure 3 Departments where remote working is not permitted Q. What are the reasons or barriers to your organisation allowing remote working or working from home? Select all that apply
Note: N=956; Includes organisations allowing working from home
Production
Operations
HR IT Marketing
SalesEngineering
FinanceR&D Upper Management
All departments
20
What Flexible Working Practices Make Employees Happy and Engaged?
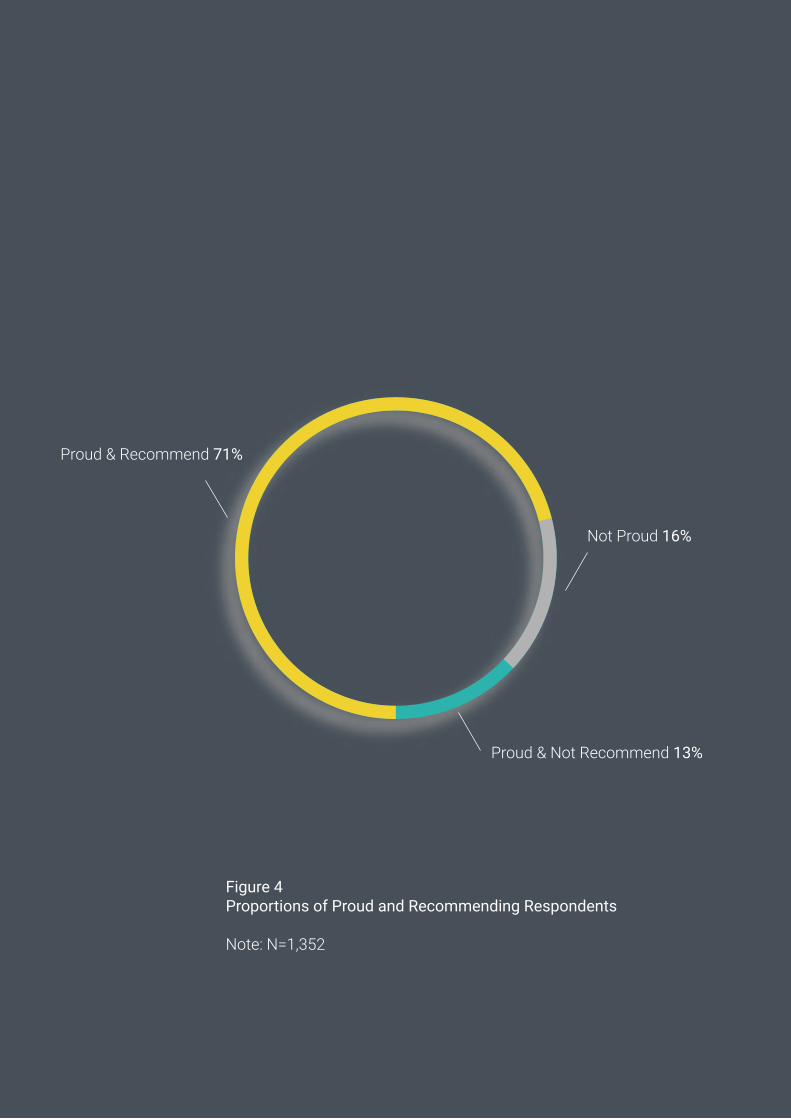
We asked the 1,352 HR professionals and line managers how they felt about the organisation they worked in. In order to classify as
a “happy” employee, we only selected respondents that somewhat or completely agreed to “I am proud to work for my organisation” AND somewhat or completely agreed to “I would recommend my current employer to others”. Figure 4 shows the distribution of the total sample between those two indicators of job happiness.
We were surprised to see that 29% of the surveyed line managers and HR professionals were not proud of their workplace or willing to recommend it to others. Managers and HR staff are after all key bearers of corporate values and engagement. Of the 29%, the majority were either not proud OR unwilling to recommend while a minority were both. Furthermore, the clear majority of those not proud and willing to recommend had responses of “Neither disagree nor agree” as opposed to being directly unhappy.
IDC sees the 71% “happiness” proportion as a clear sign that European organisations have room for improvement in how they motivate and engage their managers and HR staff. We also believe that regular employees (as opposed to line managers and HR staff) would have had even lower scores in pride and willingness to recommend.
21
Figure 4 Proportions of Proud and Recommending Respondents
Note: N=1,352
Proud & Recommend 71%
Not Proud 16%
Proud & Not Recommend 13%

22
Figure 5 shows proportions of respondent happiness (i.e., proud and willing to recommend) by country.
The figure shows that the respondents in Nordics 88%), Austria (84%), and Spain (81%) had highest scores, while respondents in Italy (59%) and Switzerland (64%) had the lowest.
The figure shows that respondents in the Nordics (88%), Austria (84%), and Spain (81%) had the highest scores, while respondents in Italy (59%) and Switzerland (64%) had the lowest.
We correlated the happiness scores with the adoption of flexible working patterns. Essentially, we compared the proportion of “happy” respondents between those adopting a certain flexible working practice and the respondents not adopting that practice. For example, we found that the proportion of “happy” respondents among those allowing employees to apply for new positions outside their own department to be 19% higher than for those not allowing this. That is a relatively high impact.

23
Mahilyow
Vitsyebsk
Homel'
Hrodna
Brest
Minsk
BELARUS
ALBANIA
Tirana
Figure 5 Respondent Happiness by Country
Note: N=1,352Source: IDC, Cornerstone OnDemand HR-LOB Survey, March 2016
86 - 90%
81 - 85%
71 - 80%
61 - 70%
Not Surveyed
51 - 60%
Proportion of resondents that areproud and willing to recommend
24
Figure 6 shows the happiness impact for each flexible working practice. Six areas had an impact of 15% or higher and are shown in green. Furthermore, four areas had an impact of between six and 11% on happiness, shown in orange, and finally one area (open workspaces) actually had a slightly negative correlation with happiness.
We can conclude that the most important flexible working practices in terms of respondent happiness are related to career flexibility and tool flexibility. Organisations with high tolerance of internal mobility had much happier respondents than those who did not. Organisations with flexible IT systems and policies to support remote working, working on mobile devices and personal devices in the workplace had a significantly better happiness score than those without such policies. Finally, the option to work from home also highly impacted happiness scores.
We believe trust is a key common denominator here, as the first five criteria are highly linked to the notion of trust from the company towards the employee: Do I trust my staff to be efficient in new positions, to use technology remotely for the good of the company, and to work from home without direct supervision. It simple terms, it seems that the more trusted the employees feel, the happier they are.

25
My office has open workspaces
Some or all employees haveflexible work desks
My organisation has leisure activities in my workplace
My organisation permits flexible hours
My organisation provides the latest technologies to help me work
I can do some or all tasks on phone or tablet
My organisation permits working from home
My organisation allows Bring Your Own Device (BYOD)
Training available on IT systems in my organisation
Applications and data are accessible for remote working
Acceptable for employees to apply for new positions outside their department
Figure 6 Happiness Impact of Flexible Working Initiatives
Note: N=1,352 Source: IDC, Cornerstone OnDemand HR-LOB Survey, March 2016

26
1. European organisations must realise that employee IT tools are not just a matter for the corporate IT department; they should concern the CEO. The survey revealed that having top notch IT tools is critical to the loyalty and pride of talented employees and managers. IT for mobile and remote working, the ability to use personal devices at work, and IT training are critical influencers in this respect.
2. Although Europe is already well progressed in the adoption of flexible working practices, much more can be done. The fact that acceptance of employees applying outside the department had a high impact on “happiness”, as did permission to work occasionally from home, shows what sort of flexible working initiatives would yield impact. It is not just about employee IT, it is also about flexible management and trust.
Call to Action on Flexible Working

27
3. Some barriers to working from home are intrinsic, others should be overcome. The survey confirmed that onsite, in-person nature of work is a key reason why it is not allowed for everyone. However, other barriers have more to do with HR policies, IT limitations, leadership beliefs. We found that some organisations let staff such as sales or finance work from home occasionally, whereas others do not. In such cases, IDC believes that European organisations will need to progress further to become attractive and flexible employers.
4. HR must understand that Europe is not one entity. The adoption of flexible working approaches varies widely and is subject to profound differences in culture, management traditions, and perceptions of “productive working”. New flexible working practices that are easily implemented in Nordic countries, for example, might encounter resistance in Poland or Switzerland.
28
Leadership has a direct impact on the performance and success of organisations. In this section, we will investigate how employee performance is currently reviewed in Europe, what HR professionals and line managers think about review and development, and the state of leadership in Europe.
TALENT REVIEW AND DEVELOPMENT – NEW LEADERSHIP STYLES
29
Performance Reviews, Still Going Strong!
The annual performance review has a tarnished reputation and has received much criticism. Employees are forced through formal
evaluations with a manager with whom they may have had very limited daily contact and who might struggle to remember even one concrete delivery to evaluate the employee on. Yet that same appraisal can have profound impact on promotion and salary negotiations. This can seem unfair and counterproductive. In recent years, large organisations, including Accenture, Microsoft, GE, and Adobe, have abandoned annual employee performance reviews.
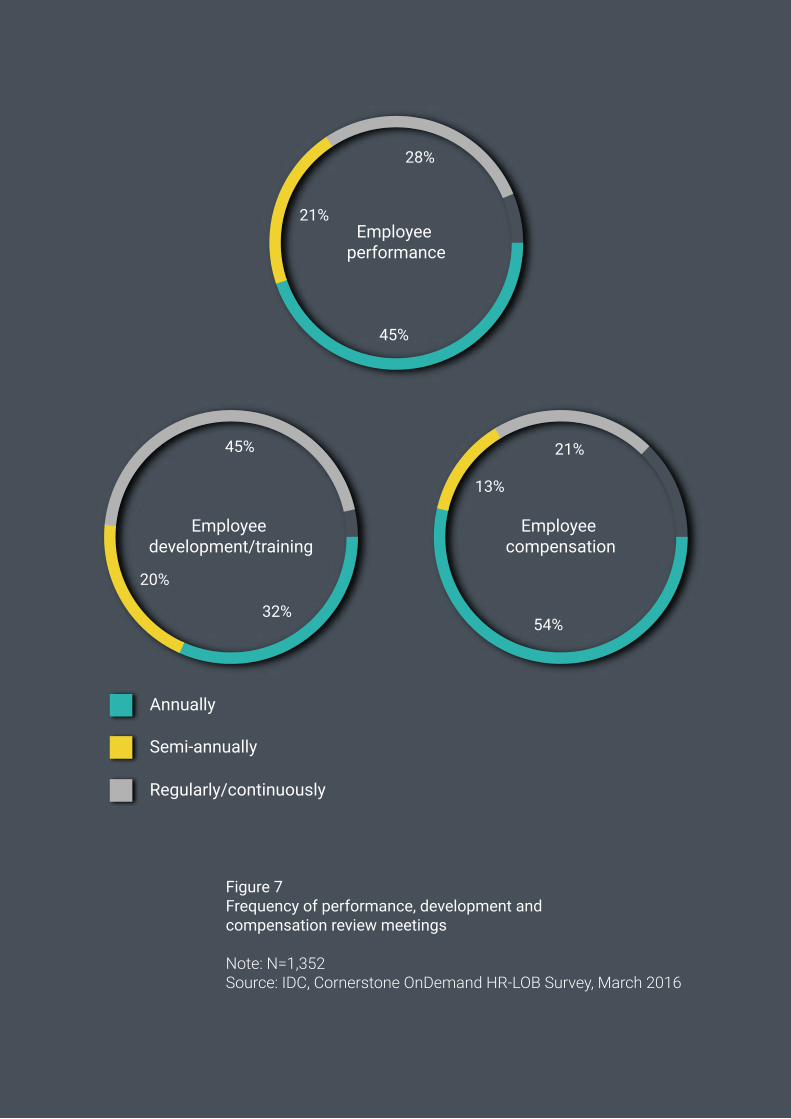
We asked the 1,352 respondents if they still carried out performance reviews. The results are shown in Figure 7 (please refer to next page).
The figure shows that almost two-thirds of organisations still carry out annual or semi-annual employee performance reviews and compensation talks. The periodic appraisal remains the dominant performance management practice in Europe. However, the survey also shows that more regular or continuous review practices are becoming more popular for employee development (45%) and performance (28%). Even in compensation, 21% of respondents said they review and discuss compensation more frequently than twice a year.
Instead of discarding the idea of the employee performance review, a sizeable proportion of European organisations have adopted regular or continuous reviews, particularly for development and performance discussions. The move from infrequent to regular reviews solves one of the main issues of annual performance reviews: the reviewing manager often struggling to remember concrete examples of employee performance going six or nine months back in time.
Interestingly, HR respondents generally underestimated the proportion of organisations with regular or continuous performance reviews, when comparing their responses to those of line managers. This could suggest that management, rather than HR, is “fixing” the issues with infrequent performance reviews and replacing these with much more frequent reviews.
30
28%
21%
45%
45%
20%
32%
13%
21%
54%
Employee performance
Employee development/training
Employee compensation
Annually
Semi-annually
Regularly/continuously
Figure 7 Frequency of performance, development and compensation review meetings
Note: N=1,352 Source: IDC, Cornerstone OnDemand HR-LOB Survey, March 2016
31
28%
21%
45%
45%
20%
32%
13%
21%
54%
Employee performance
Employee development/training
Employee compensation
Annually
Semi-annually
Regularly/continuously
Figure 7 Frequency of performance, development and compensation review meetings
Note: N=1,352 Source: IDC, Cornerstone OnDemand HR-LOB Survey, March 2016
Rumoured Death of the Performance Review is Greatly Exaggerated or Outright Wrong
We queried all respondents on their opinion of performance review practices. The proportion of HR professionals and line managers that
somewhat or completely agree with the statement is shown in Figure 8 (please refer to next page).
The respondents generally agreed with the statements, which indicates a relatively serious and comprehensive approach to performance reviews in most European organisations. Furthermore, over two-thirds consider performance reviews to be useful or very useful. These are strong indications that the rumoured death of the performance review is greatly exaggerated or outright wrong.
Praising achievements and turning the performance review into a positive experience for the employee was important and highlighted by almost 80% of respondents. Other statements related to making the review meaningful for the employee (understanding of review criteria and employee feedback to manager) were also agreed to by many respondents, 75% and 74% respectively.

32
100%
HR
LOB
Managers praise achievements
Performance review follows defined process
Review involves employee feedback
Managers provide frequent feedback
Employees know performance criteria
Managers think performance review is useful
Managers include stakeholder feedback
Performance mangament system is available
Managers receive training on conducting performance reviews
Figure 8 Proportion of line managers and HR professionals in agreement with performance management statements
Q. LOB: Please rate your agreement with the following statements regarding the performance review process with your teamQ. HR: Please rate your agreement with the following statements regarding the performance review process for your organisation
Note: HR: N=681; LOB: N=671 Source: IDC, Cornerstone OnDemand HR-LOB Survey, March 2016

33
The survey revealed some interesting differences between the responses from line managers and HR:
1. HR (78%) had higher a proportion expressing that a predefined review process was in place than line managers (70%)
2. HR (68%) also had a higher proportion expressing that a performance management system was in place than line managers (60%) and a higher proportion agreeing to availability of performance management training (67% versus 62% for line managers)
3. However, line managers (67%) were more confident than HR (63%) in their ability to properly explain the review criteria to employees
HR seems to overrate the buy-in and recognition from line managers when it comes to the employee review process itself, as well as the systems to support the review process, and underrate the ability of managers to explain the review process to employees.
In conclusion, European companies keep performance reviews because they are still useful for both the company and the employee in gathering important insight into competencies and to increase performance and engagement.
34
The Performance Review is No Longer Just for High Value Positions
The survey results confirmed that employee performance reviews are no longer confined to high-value employee sectors such as
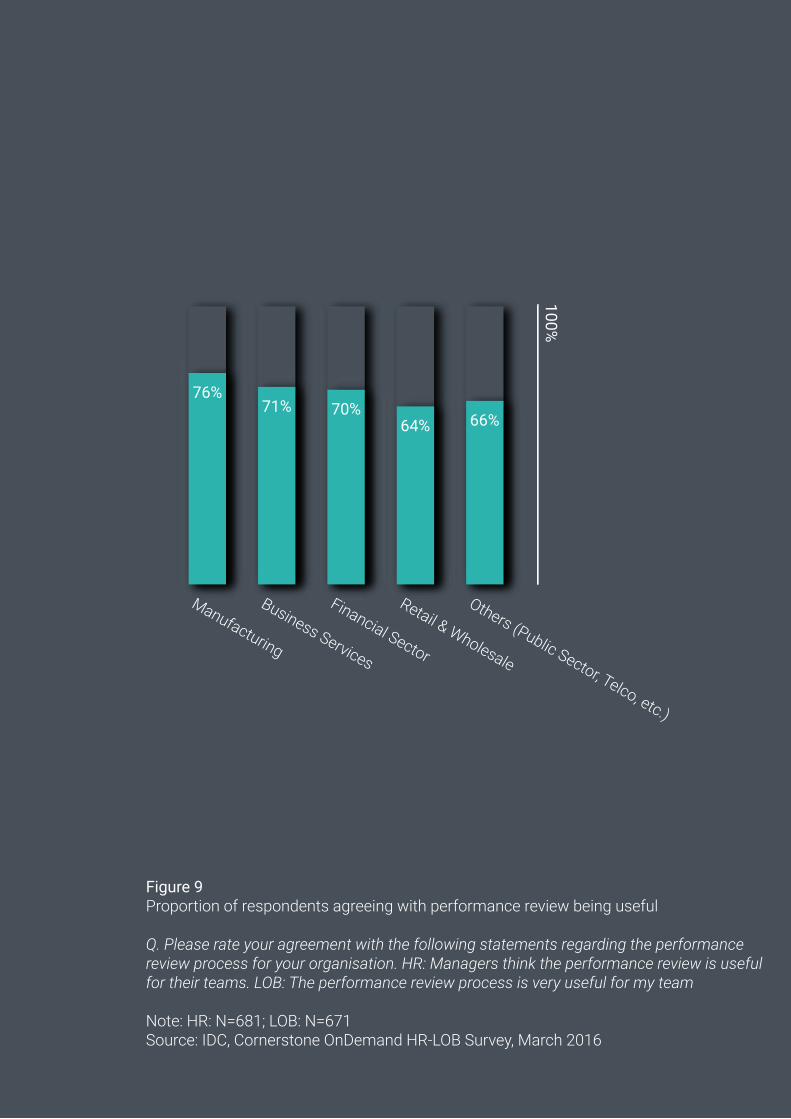
professional services. The share of respondents that answered “Not applicable” to the question “How frequently does your organisation conduct review meetings of employee performance?” was lower in retail/wholesale (5%) and manufacturing (6%) than in business services (8%).
This is consistent with the trend that we have witnessed in talent management software adoption in Europe, where organisations with lower-cost employees have been frequent buyers of such solutions. IDC believes that this shift in the market to include employee types in manual labour and other lower cost roles has partly been caused by improvements in the usability of performance management applications. Today, these applications are available on smart mobile devices and use gamification techniques to be intuitive and even entertaining to use. The other key reason is labour scarcity in countries/regions such as the UK, the Nordics, Germany, Austria, and Switzerland. This is forcing organisations to look for talent in the existing employee base at all levels and positions, given the difficulties of external recruitment.
Figure 9 shows the proportion of HR professionals and line managers that somewhat or completely agree that employee performance reviews are useful.
Manufacturing has the highest score, but the majority of line managers in all industry segments find performance reviews very useful. One could of course argue that these results mainly apply to high profile employees within these organisations. For manufacturers, much of the production line work takes place in off-shore locations and much of it is outsourced. IDC believes that the relatively consistent scores combined with the many cases of retailers and other lower wage organisations adopting new talent management solutions shows how performance management is targeting broader employee populations. This is aided by new, more intuitive and consumer-like application designs.
This trend could help spur higher degrees of internal mobility and richer career options for lower wage employees and help break the career “glass ceiling” for shop floor workers in Europe. This enablement of internal mobility opportunities is even stronger if the performance review is linked to talent development and training plans.
35
Manufacturing
Business Services
Financial Sector
Retail & Wholesale
Others (Public Sector, Telco, etc.)
Figure 9 Proportion of respondents agreeing with performance review being useful
Q. Please rate your agreement with the following statements regarding the performance review process for your organisation. HR: Managers think the performance review is useful for their teams. LOB: The performance review process is very useful for my team
Note: HR: N=681; LOB: N=671 Source: IDC, Cornerstone OnDemand HR-LOB Survey, March 2016

36
European Organisations are Highly Collaborative, but Systems are not Fully There to Support
Learning and development are key trends in human capital management in Europe. New solutions can help organisations to record and analyse the skill profiles of
employees and to target employee development efforts best.
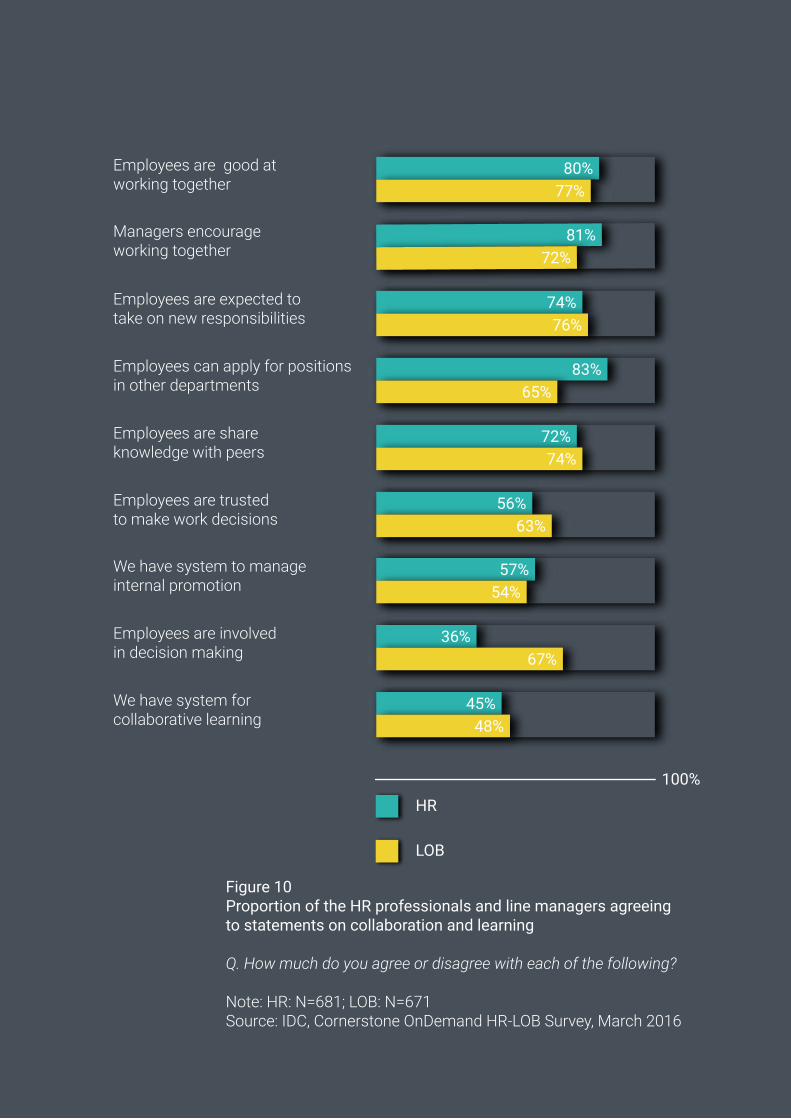
We can see that European organisations are, in general, highly collaborative, with a clear majority agreeing to employees being good at collaborating (78%), encouraged to collaborate (77%), and taking new responsibilities (75%).
While the highly collaborative practices in Europe are encouraging, the situation is less bright when it comes to the systems used to support collaboration. In terms of systems, respondents have much lower levels of agreement; 47% agree to having a system for collaborative learning and 52% agree to having a system to manage promotions (i.e., succession and career planning). So while the work practices are there, the supporting systems are much less so. IDC believes that this reflects the fact that many European organisations still use document-based approaches to reviews without automation.
When comparing the responses from HR professionals with those of line managers, two telling differences appeared:
1. Line managers involve employees much more (67%) in decision-making than HR believes (36%)
2. Line managers are less supportive (65%) of applications outside their department than HR believes (83%)
The diverging views between HR and line managers shows that HR is unaware of how much employees are involved in decision-making and that European organisations are relatively “democratic”. This high level of decision participation could require HR to rethink how employees are monitored, measured and compensated.
It also shows that internal mobility inside European organisations is more restricted by managers than HR thinks. That is a problem for HR and for their respective organisations. Earlier in this White Paper, we learned that the ability to apply for positions outside one’s department has the most influence on the employee’s happiness in that organisation. As European organisations are undergoing digital transformations, internal employee redeployments are highly needed and demanded by the employees themselves.
37
100%HR
LOB
Employees are good at working together
Managers encourage working together
Employees are expected to take on new responsibilities
Employees can apply for positions in other departments
Employees are share knowledge with peers
Employees are trusted to make work decisions
We have system to manage internal promotion
Employees are involved in decision making
We have system for collaborative learning
Figure 10 Proportion of the HR professionals and line managers agreeing to statements on collaboration and learning Q. How much do you agree or disagree with each of the following?
Note: HR: N=681; LOB: N=671 Source: IDC, Cornerstone OnDemand HR-LOB Survey, March 2016
38
100%
Employees are encouraged to work together
System to aid collaborative learning
Employees encouraged to share knowledge
Employees allowed to apply in other departments
Employees trusted to make decisions themselves
Employees involved in decision making
Employees encouraged to take on new responsibilities
System to manage internal promotion
Employees good at collaborating
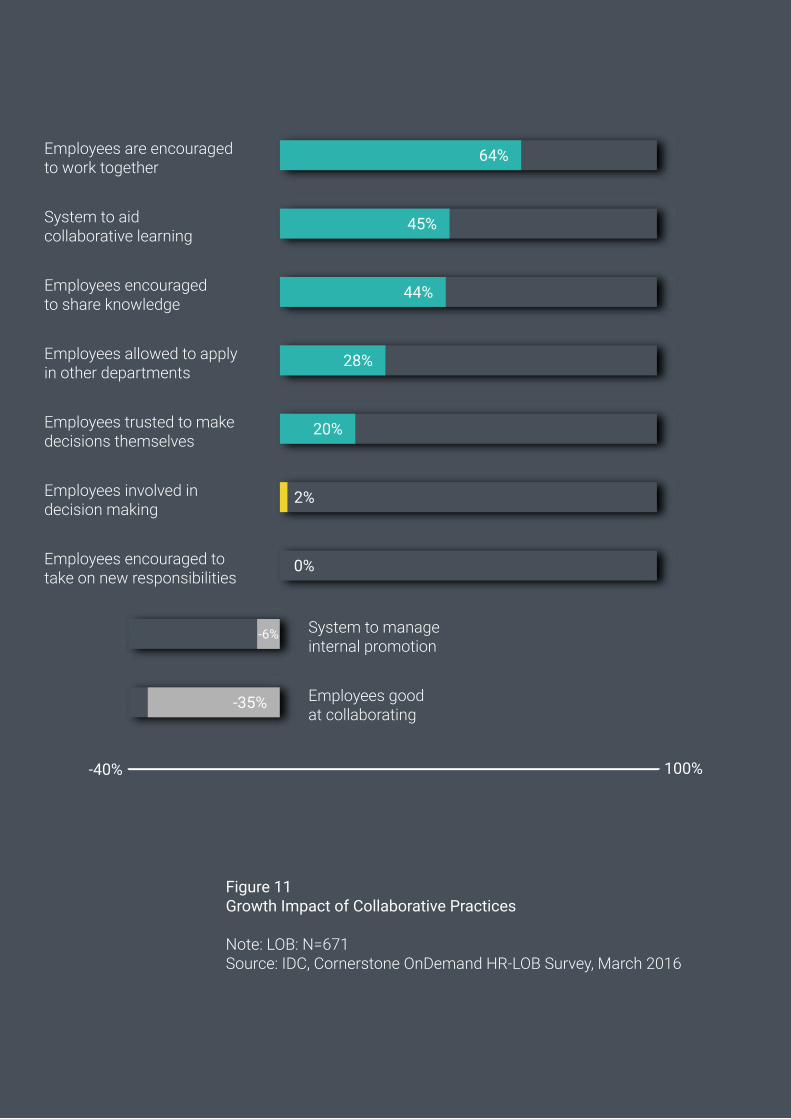
Figure 11 Growth Impact of Collaborative Practices
Note: LOB: N=671 Source: IDC, Cornerstone OnDemand HR-LOB Survey, March 2016
Collaborative Approaches Do Impact Business Performance
After concluding that European organisations are highly collaborative and that collaboration is greatly encouraged, we checked these
approaches (i.e., line managers agreeing to collaborative statements) against business performance (we used organisations with double digit revenue growth as a proxy of strong business performance).
Figure 11 shows a strong impact on business performance in a number of areas. In terms of how to interpret the information, “Employees are encouraged to work together, 64%” means that there is a 64% higher proportion of high-growth organisations among those agreeing to the statement compared to those not agreeing.
The collaborative statements with a high proportion of high-growth organisations agreeing revolved around working together, facilitating collaborative learning, sharing knowledge, permitting internal mobility of employees, and delegating decision-making. This connection emphasises the business value of fostering collaborative, trust-based cultures in organisations.
Of course, we cannot be certain of the causal relationship between collaboration and performance, as, hypothetically, high-performing organisations could need more collaboration in order to keep up with revenue growth. Despite our inability to prove collaboration as a contributing cause of high revenue growth, the strong correlations above cannot be ignored. They make a good case for European managers to build knowledge sharing, team working, and related tools for knowledge sharing and learning into the DNA of their respective organisations.
39
100%
Employees are encouraged to work together
System to aid collaborative learning
Employees encouraged to share knowledge
Employees allowed to apply in other departments
Employees trusted to make decisions themselves
Employees involved in decision making
Employees encouraged to take on new responsibilities
System to manage internal promotion
Employees good at collaborating
Figure 11 Growth Impact of Collaborative Practices
Note: LOB: N=671 Source: IDC, Cornerstone OnDemand HR-LOB Survey, March 2016
40
100%
Figure 12 Proportion of the HR professionals and line managers agreeing to statements on HR's management support
Q. Please rate your agreement with the following statements regarding HR involvement to support managers
Note: HR: N=681; LOB: N=671 Source: IDC, Cornerstone OnDemand HR-LOB Survey, March 2016
HR
LOB
HR offers training for people management skills
Managers can make autonomous decisions to meet goals
Managers get support from top management and HR to avoid stress
HR offers tools to recruit, reward and retain talent
HR processes are a major sources of management frustration
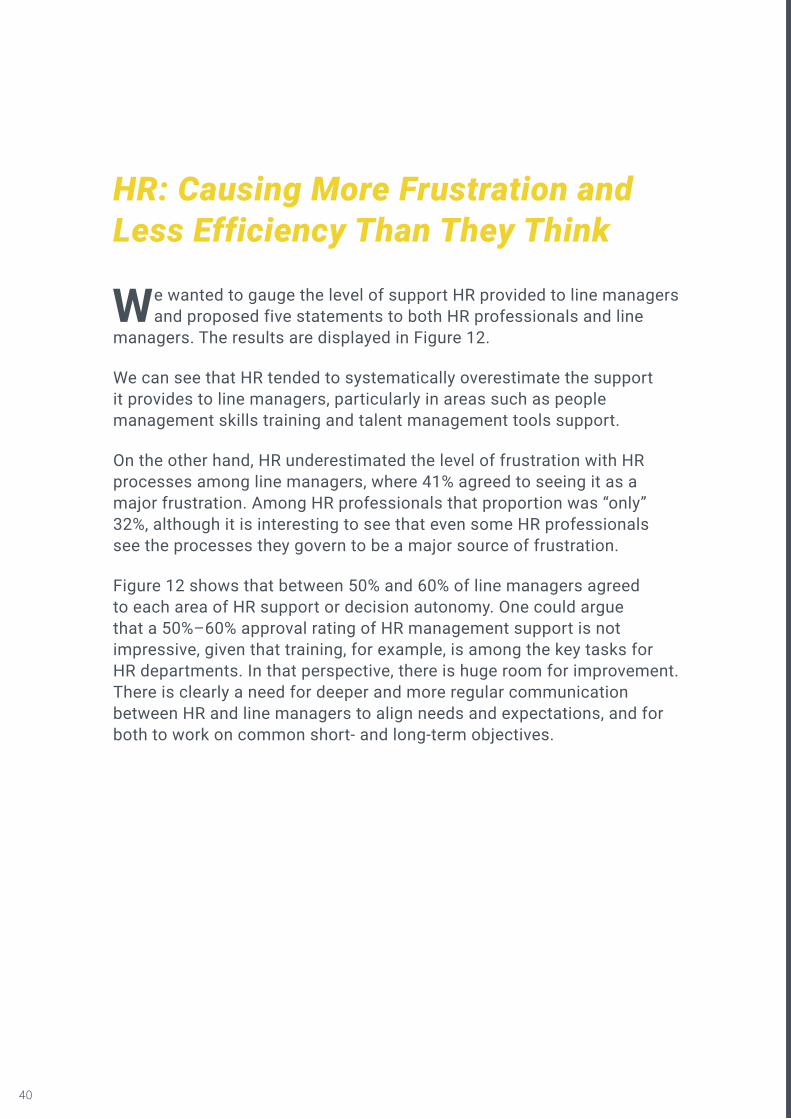
HR: Causing More Frustration and Less Efficiency Than They Think
We wanted to gauge the level of support HR provided to line managers and proposed five statements to both HR professionals and line
managers. The results are displayed in Figure 12.
We can see that HR tended to systematically overestimate the support it provides to line managers, particularly in areas such as people management skills training and talent management tools support.
On the other hand, HR underestimated the level of frustration with HR processes among line managers, where 41% agreed to seeing it as a major frustration. Among HR professionals that proportion was “only” 32%, although it is interesting to see that even some HR professionals see the processes they govern to be a major source of frustration.
Figure 12 shows that between 50% and 60% of line managers agreed to each area of HR support or decision autonomy. One could argue that a 50%–60% approval rating of HR management support is not impressive, given that training, for example, is among the key tasks for HR departments. In that perspective, there is huge room for improvement. There is clearly a need for deeper and more regular communication between HR and line managers to align needs and expectations, and for both to work on common short- and long-term objectives.

41
100%
Figure 12 Proportion of the HR professionals and line managers agreeing to statements on HR's management support
Q. Please rate your agreement with the following statements regarding HR involvement to support managers
Note: HR: N=681; LOB: N=671 Source: IDC, Cornerstone OnDemand HR-LOB Survey, March 2016
HR
LOB
HR offers training for people management skills
Managers can make autonomous decisions to meet goals
Managers get support from top management and HR to avoid stress
HR offers tools to recruit, reward and retain talent
HR processes are a major sources of management frustration
42
Call to Action on Employee Reviews and Collaboration
1. European organisations should not abandon the employee review, but transition it to something more frequent or even continuous. HR should facilitate this with new processes and tools, as under half of line managers agree to having the appropriate tools to support reviews. Interestingly, the survey also showed that line managers are further ahead in the transition to continuous feedback than HR thinks. Finally, conversations about career development and compensation reviews should be separated from the performance review itself, but with an eye on competency evolution as this will impact the discussion.
2. European organisations should invest in collaborative initiatives and in the development of collaborative cultures, where internal mobility is accepted. The survey showed that the proportion of high-growth organisations is significantly higher among those embracing collaborative
43
practices, internal mobility, and learning systems. It also showed that acceptance of internal mobility has a high impact on respondent “happiness”. Finally, we found that HR overestimates how accepted internal mobility is in organisations and that HR should actively engage with line managers to promote this.
3. HR professionals should work more closely and directly engage with line managers to understand requirements, set expectations, and promote HR strategies, tools, and processes. Line managers unfortunately appear to be more frustrated with and feel less supported by HR than HR thinks. Line managers are among the foremost internal “customers” of HR and they should be treated like and engaged with as such.

44
HR AND LINE-OF-BUSINESS ALIGNMENT ON KEY HR TOPICSHR professionals are increasingly leaving behind transactional tasks along with emails, Excel spreadsheets, and Word-based forms, to instead manage HR systems used by the employees and managers themselves. As HR is looking to redefine

45
its role in the organisation, do HR professionals and the line managers that they support agree? We investigated how each group viewed current HR tasks, the measurement of HR performance, and areas of future improvement for HR.

46
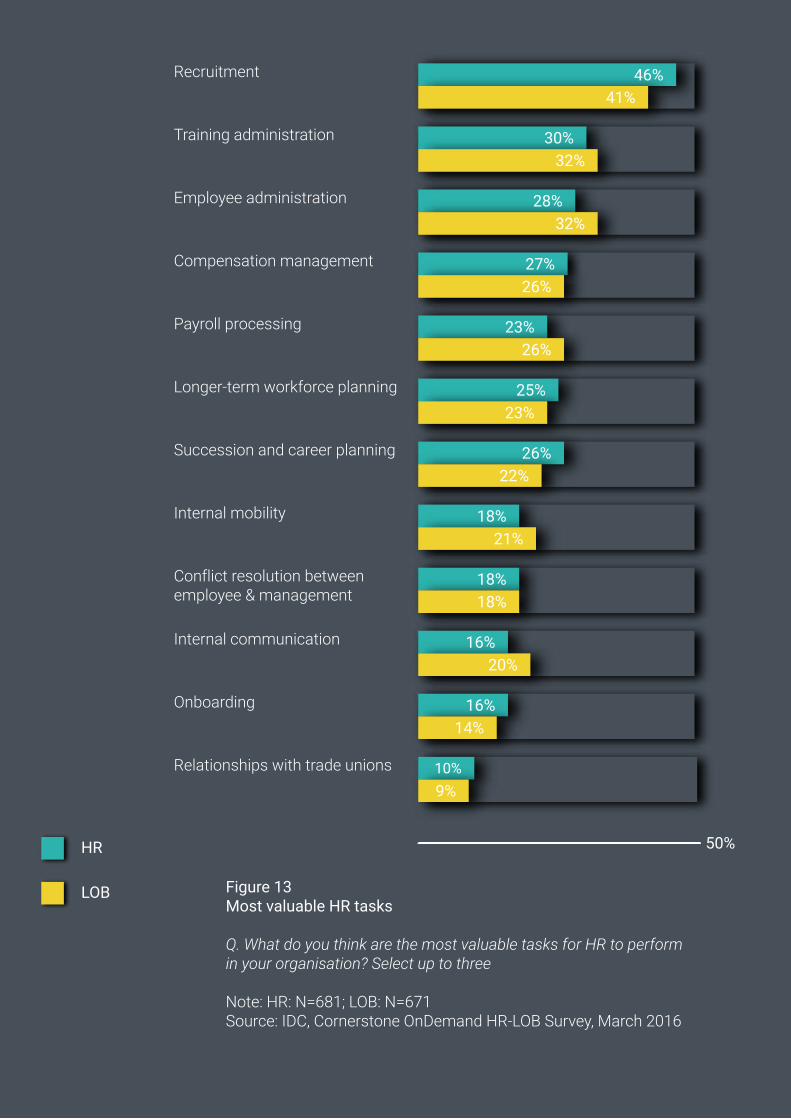
HR Leans Toward Strategic Tasks, While Line Managers Stress Transactional Tasks for HR
The HR department can potentially engage in a wide variety of tasks at different stages of the employee lifecycle, ranging from planning to
administration. We asked HR professionals and line managers what they believed were the most valuable tasks for the HR department.
First of all, both HR professionals and line managers agree that the top three HR tasks are recruitment, training administration, and employee administration. Employee and training administration are undisputedly core tasks for most HR departments, and it is hard to imagine contracting new hires without HR’s involvement.
Secondly, it is interesting to see that HR respondents place relatively high significance on advanced tasks, such as compensation management, long-term workforce planning, and career planning. Line managers, on the other hand, place much more emphasis on administrative tasks, such as payroll processing, internal communications, and internal mobility.
Finally, it is striking that each potential task, with the exception of recruitment, failed to be selected by more than a third of the respondents. This shows that there are many views and limited consensus in terms of what the key HR tasks are as HR moves into an age of digitalisation, self-service, and analytics.
It is also worth noting that we found significant country differences in terms of key HR tasks. For example, line managers in German-speaking countries and Spain put high emphasis on payroll processing, whereas other countries ranked it low. This is probably due to a higher degree of in-house payroll management in Central Europe and Spain. Another example is internal mobility, which was an important HR task according to line managers in France, the Nordics, Spain, and Switzerland, but less of a priority in the UK, Germany, and Benelux.
47
HR
LOB
Recruitment
Training administration
Employee administration
Compensation management
Payroll processing
Longer-term workforce planning
Succession and career planning
Internal mobility
Conflict resolution between employee & management
Internal communication
Onboarding
Relationships with trade unions
Figure 13 Most valuable HR tasks Q. What do you think are the most valuable tasks for HR to perform in your organisation? Select up to three
Note: HR: N=681; LOB: N=671 Source: IDC, Cornerstone OnDemand HR-LOB Survey, March 2016
48
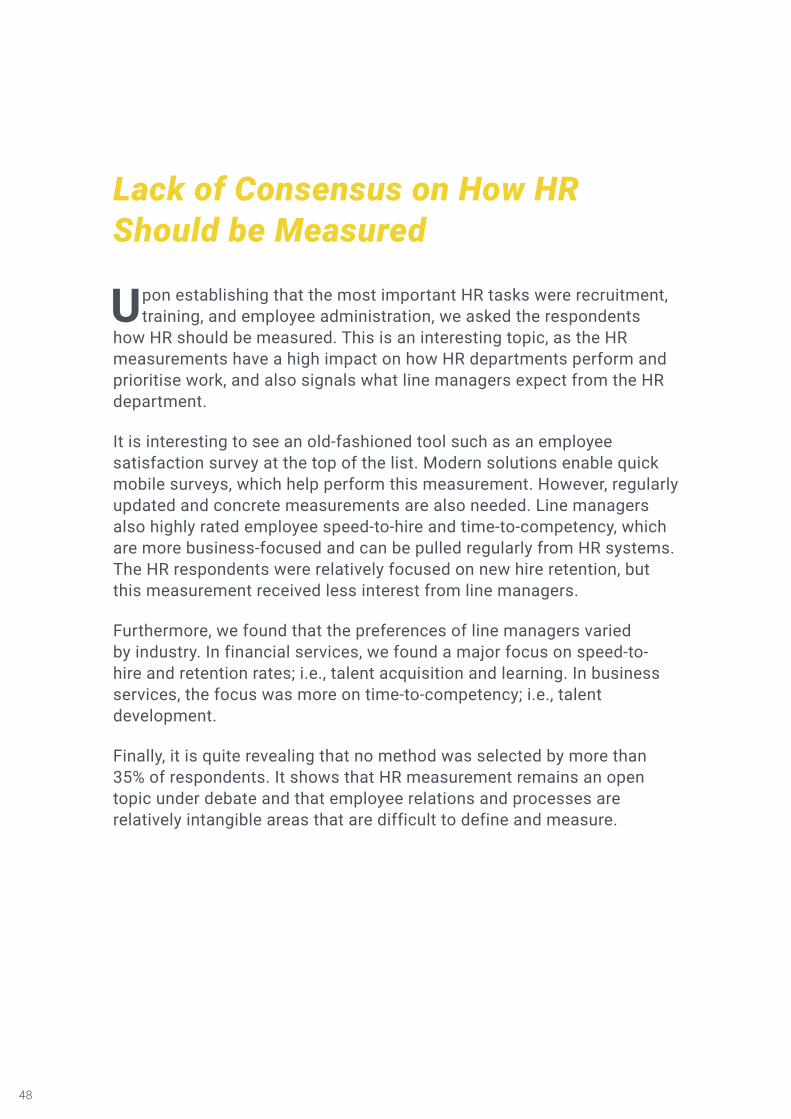
Lack of Consensus on How HR Should be Measured
Upon establishing that the most important HR tasks were recruitment, training, and employee administration, we asked the respondents
how HR should be measured. This is an interesting topic, as the HR measurements have a high impact on how HR departments perform and prioritise work, and also signals what line managers expect from the HR department.
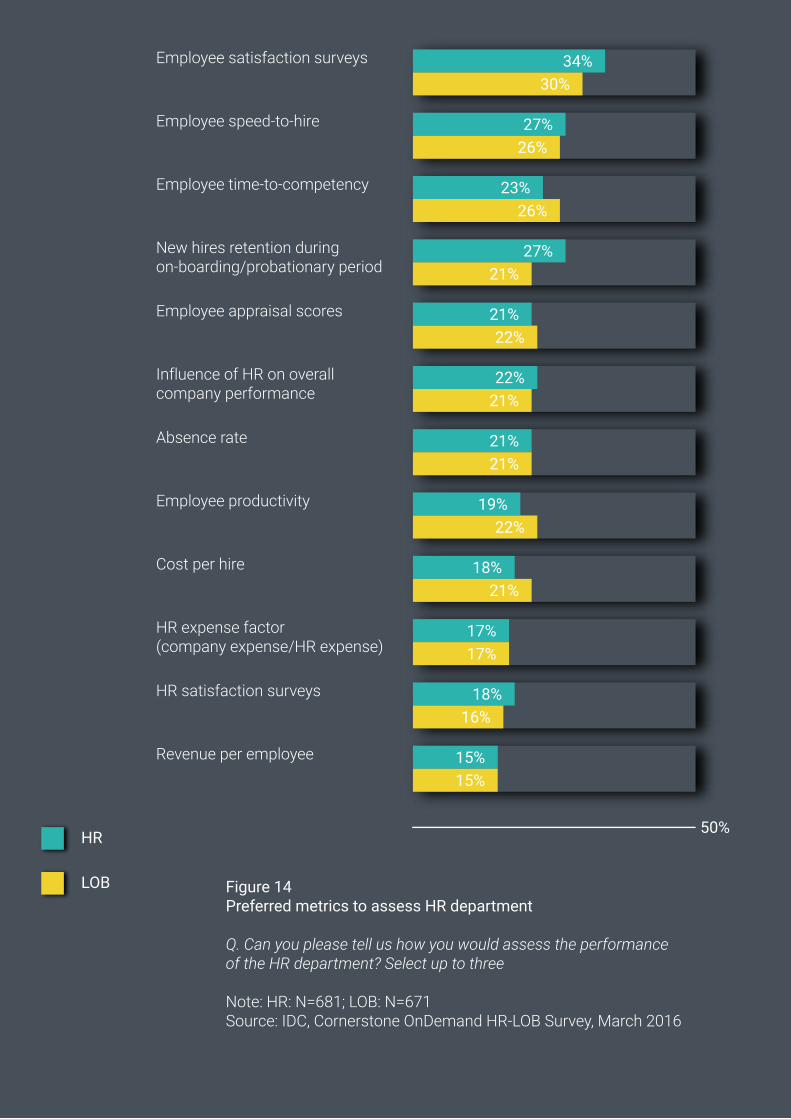
It is interesting to see an old-fashioned tool such as an employee satisfaction survey at the top of the list. Modern solutions enable quick mobile surveys, which help perform this measurement. However, regularly updated and concrete measurements are also needed. Line managers also highly rated employee speed-to-hire and time-to-competency, which are more business-focused and can be pulled regularly from HR systems. The HR respondents were relatively focused on new hire retention, but this measurement received less interest from line managers.
Furthermore, we found that the preferences of line managers varied by industry. In financial services, we found a major focus on speed-to-hire and retention rates; i.e., talent acquisition and learning. In business services, the focus was more on time-to-competency; i.e., talent development.
Finally, it is quite revealing that no method was selected by more than 35% of respondents. It shows that HR measurement remains an open topic under debate and that employee relations and processes are relatively intangible areas that are difficult to define and measure.
49
Employee satisfaction surveys
Employee speed-to-hire
Employee time-to-competency
New hires retention during on-boarding/probationary period
Employee appraisal scores
Influence of HR on overall company performance
Absence rate
Employee productivity
Cost per hire
HR expense factor(company expense/HR expense)
HR satisfaction surveys
Revenue per employee
Figure 14 Preferred metrics to assess HR department
Q. Can you please tell us how you would assess the performance of the HR department? Select up to three
Note: HR: N=681; LOB: N=671 Source: IDC, Cornerstone OnDemand HR-LOB Survey, March 2016
HR
LOB
50
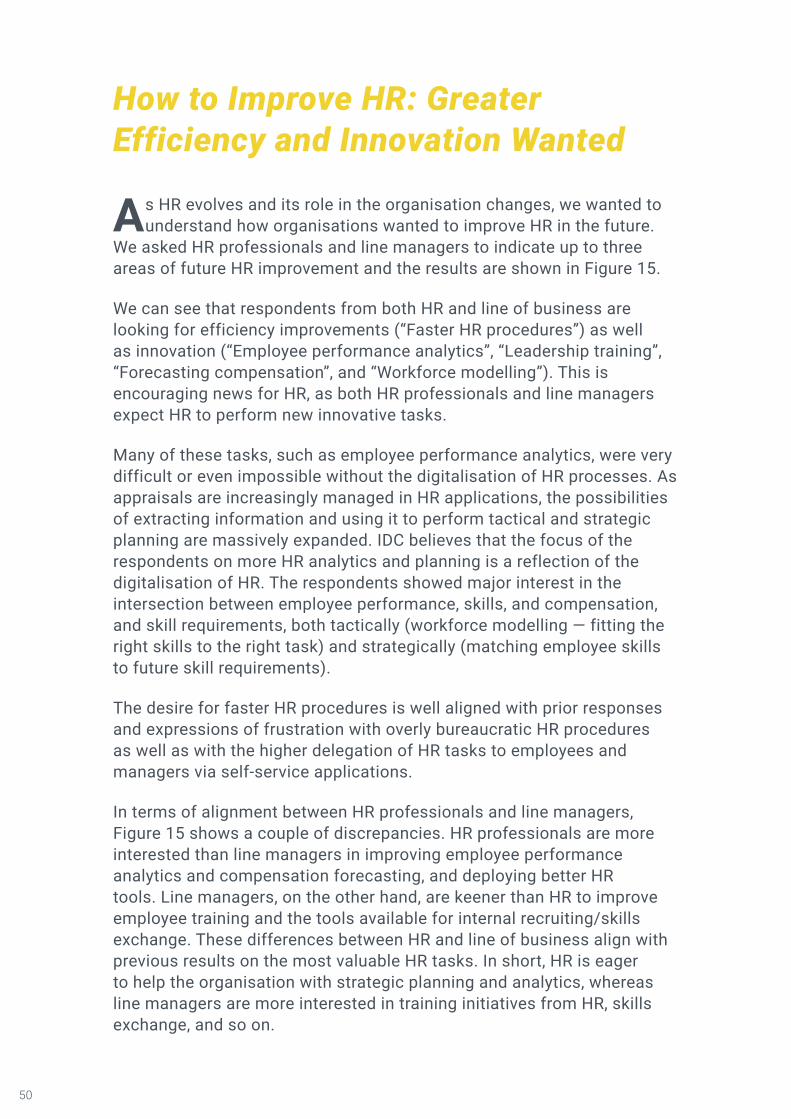
How to Improve HR: Greater Efficiency and Innovation Wanted
As HR evolves and its role in the organisation changes, we wanted to understand how organisations wanted to improve HR in the future.
We asked HR professionals and line managers to indicate up to three areas of future HR improvement and the results are shown in Figure 15.
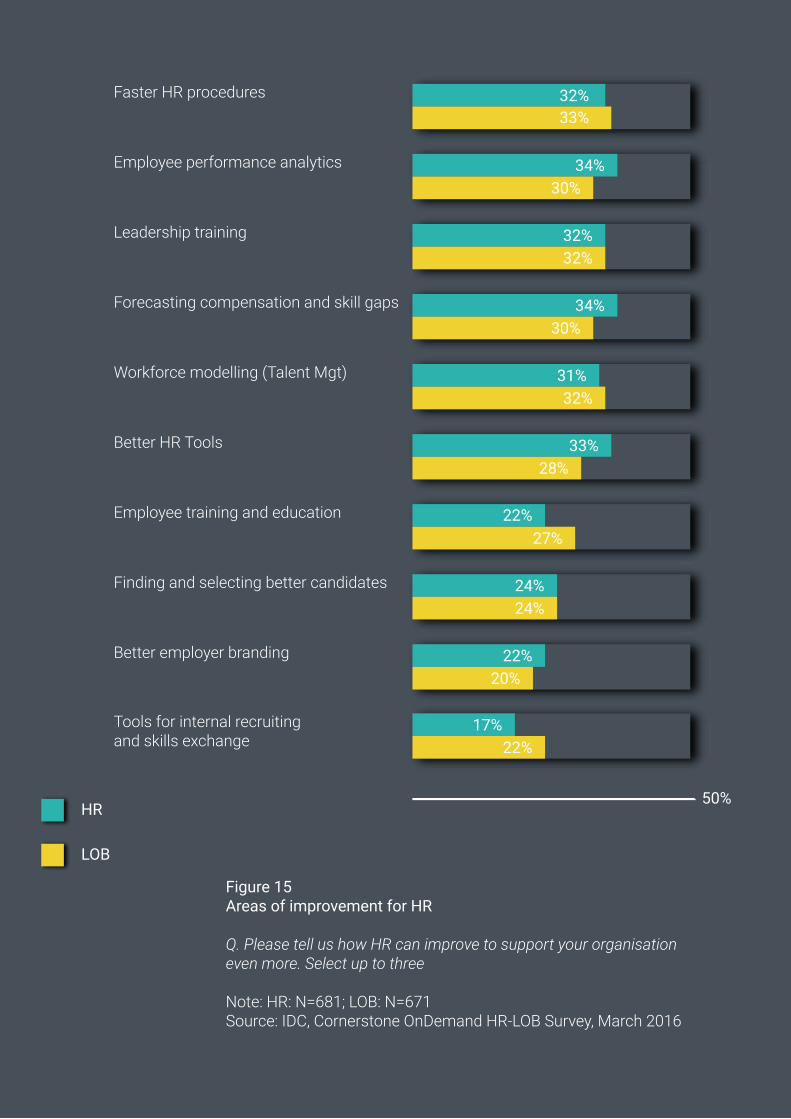
We can see that respondents from both HR and line of business are looking for efficiency improvements (“Faster HR procedures”) as well as innovation (“Employee performance analytics”, “Leadership training”, “Forecasting compensation”, and “Workforce modelling”). This is encouraging news for HR, as both HR professionals and line managers expect HR to perform new innovative tasks.
Many of these tasks, such as employee performance analytics, were very difficult or even impossible without the digitalisation of HR processes. As appraisals are increasingly managed in HR applications, the possibilities of extracting information and using it to perform tactical and strategic planning are massively expanded. IDC believes that the focus of the respondents on more HR analytics and planning is a reflection of the digitalisation of HR. The respondents showed major interest in the intersection between employee performance, skills, and compensation, and skill requirements, both tactically (workforce modelling — fitting the right skills to the right task) and strategically (matching employee skills to future skill requirements).
The desire for faster HR procedures is well aligned with prior responses and expressions of frustration with overly bureaucratic HR procedures as well as with the higher delegation of HR tasks to employees and managers via self-service applications.
In terms of alignment between HR professionals and line managers, Figure 15 shows a couple of discrepancies. HR professionals are more interested than line managers in improving employee performance analytics and compensation forecasting, and deploying better HR tools. Line managers, on the other hand, are keener than HR to improve employee training and the tools available for internal recruiting/skills exchange. These differences between HR and line of business align with previous results on the most valuable HR tasks. In short, HR is eager to help the organisation with strategic planning and analytics, whereas line managers are more interested in training initiatives from HR, skills exchange, and so on.
51
50%
Faster HR procedures
Employee performance analytics
Leadership training
Forecasting compensation and skill gaps
Workforce modelling (Talent Mgt)
Better HR Tools
Employee training and education
Finding and selecting better candidates
Better employer branding
Tools for internal recruiting and skills exchange
Figure 15 Areas of improvement for HR Q. Please tell us how HR can improve to support your organisation even more. Select up to three Note: HR: N=681; LOB: N=671 Source: IDC, Cornerstone OnDemand HR-LOB Survey, March 2016
HR
LOB

52
Larger Organisations Demand Faster HR Procedures
The desired HR improvement from the point of view of line management varied significantly by company size. As shown in Table
2, “Faster HR procedures” was a more urgent desire among the larger organisations in the sample. Larger organisations typically have more elaborate HR procedures in place with associated frustrations, so this is not surprising. The HR improvement, that was relatively sought after in larger organisations, was “Leadership training”. Again, formal leadership training is more common and more practiced in larger organisations.
It was interesting to see that line managers in midsized organisations with fewer than 1,000 employees were relatively interested in analytics and planning, more specifically compensation planning, workforce modelling (matching task skill requirements with available employee skills), and employee performance analytics. This shows that employee-related difficulties are also felt among midsized organisations and that these have a need for digital HR processes with the related analytics.

53
1st 2nd 3rd 4th 5th
Less than 1,000
Forecasting compensation and skill gaps
(35%)
Workforce modelling
(Talent Mgmt.) (34%)
Employee performance
analytics (30%)
Faster HR procedures
(30%)
Better HR Self-Service Tools (29%)
1,000 to 2,499 Leadership training (34%)
Workforce modelling
(Talent Mgmt) (33%)
Faster HR procedures
(32%)
Employee training and education
(30%)
Forecasting compensation and skill gaps
(30%)
2,500 +Faster HR
procedures (36%)
Leadership training (34%)
Employee performance
analytics (31%)
Workforce modelling
(Talent Mgmt) (30%)
Better HR Self-Service Tools (26%)
Table 2Line Manager’s Desired HR Improvements by Company Size
Note: LOB: N=671Source: IDC, Cornerstone OnDemand HR-LOB Survey, March 2016
54
HR Priorities in High Growth Versus Normal Organisations
We wanted to check for significant differences between respondents in high growth organisations versus respondents from non-high
growth organisations. In table 3 we compare the top 3 HR tasks, preferred measurements, and improvement areas between organisations that are high growth and those that are not.
From the table, we can see a number of similarities. For example, both types of organisation prefer employee satisfaction surveys to gauge HR performance. However, we also found some clear differences.
High growth organisations were more concerned with compensation management as a key HR task and less concerned with recruitment and training administration. They were also relatively keen to measure HR via employee appraisal scores and much less concerned with speed-to-hire. Finally, high growth organisations were relatively keen on HR improving efficiency, on better matching employee skills to tasks, and on improving HR self-service tools, while they found employee performance analytics a less important improvement area.

55
1st 2nd 3rd
Top 3 HR Tasks High Growth
Employee Admin. (31%) Recruitment (31%) Compensation Mgmt.
(30%)
Top 3 HR Tasks Non-High Growth Recruitment (44%) Training Admin. (32%) Employee Admin.
(30%)
Top 3 HR Measurements High
Growth
Employee satisfaction surveys (36%)
Employee appraisal scores (30%)
Time-to-competency (27%)
Top 3 HR Measurements Non
High Growth
Employee satisfaction surveys (32%)
Speed-to-hire (27%)Time-to-competency
(25%)
Top 3 HR Improvements High Growth
Perform HR tasks faster (36%)
Workforce modelling (32%)
Better HR Self-Service Tools (31%)
Top 3 HR Improvements Non High Growth
Employee performance analytics (33%)
Perform HR tasks faster (33%)
Leadership training (32%)
Table 3Top HR Priorities: High Growth vs Not High Growth
Note: N=1,123; All respondents that indicated organisation revenue growthSource: IDC, Cornerstone OnDemand HR-LOB Survey, March 2016

56
1. HR must sell itself better to its internal customers. HR considered itself ready to be a strategic partner for management with planning and analysis tasks, while line managers had a tendency to confine HR to its traditional transaction tasks related to employee and training administration. HR must demonstrate its strategic capabilities to its stakeholders and actively work to change the traditional bureaucratic image of HR as back-office clerks.
2. HR must embrace training and competency building as a low-hanging fruit. Across the survey, the HR respondents generally estimated the need for training and development to be significantly lower than the line managers they are supposed to serve. Building competencies, recording these and reviewing them, and matching skills to incoming tasks
Call to Action on HR Issues and HR / LoB Alignment
57
were high on the line manager’s radar. Doubling up on skills management, training, and associated tools is a clear path to recognition for HR.
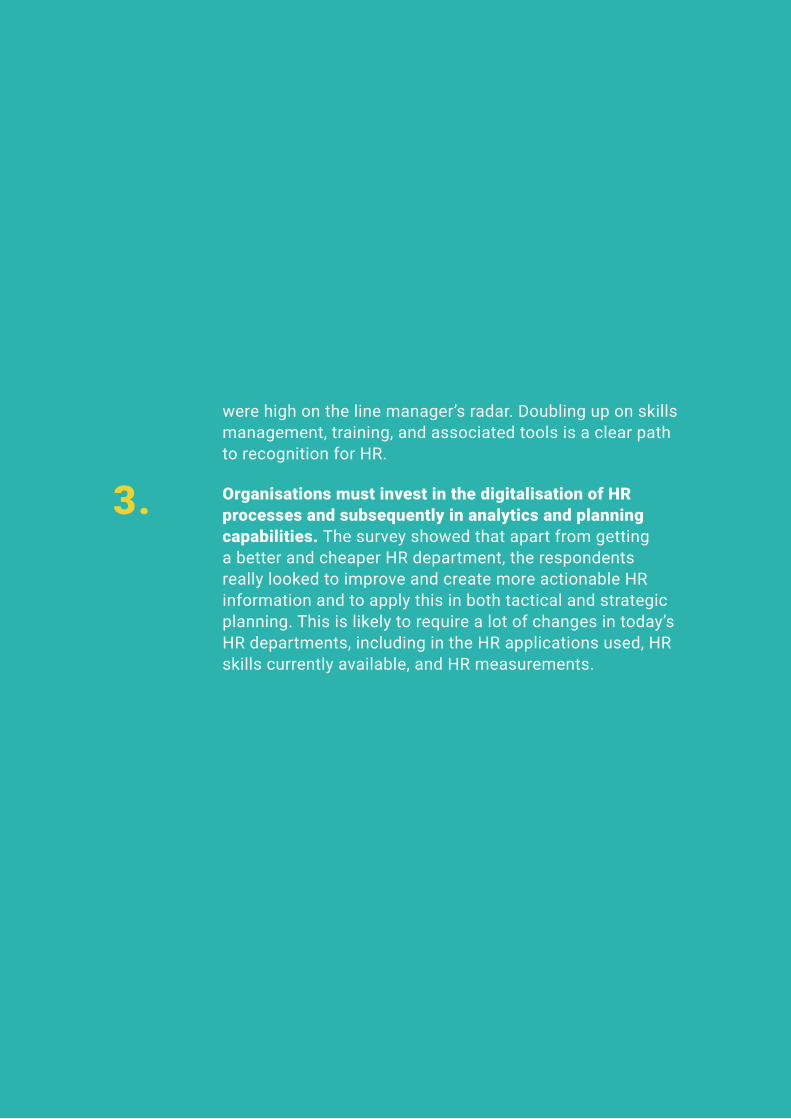
3. Organisations must invest in the digitalisation of HR processes and subsequently in analytics and planning capabilities. The survey showed that apart from getting a better and cheaper HR department, the respondents really looked to improve and create more actionable HR information and to apply this in both tactical and strategic planning. This is likely to require a lot of changes in today’s HR departments, including in the HR applications used, HR skills currently available, and HR measurements.

58
Digital transformation is changing the way organisations operate and is transforming employees’ work processes. These fundamental
changes are posing tremendous challenges to human resource management. Firstly, today’s employees demand flexible and collaborative workplaces with consumer-grade technologies. Those organisations that are slipping behind are finding it hard to attract and keep talented staff. Secondly, traditional management practices such as the formal, annual employee appraisal are widely regarded as inflexible and bureaucratic and have to be reformed. Thirdly, as HR processes become digital, HR and line management must agree on a new charter for the HR function. Employees and managers are increasingly performing HR tasks themselves in self-service solutions and this opens up possibilities for HR to explore new roles.
In this White Paper IDC has uncovered some of the main trends and developments in Europe with regards to flexible working, leadership, performance management, and the role of the HR department. We have concluded the following:
1. Flexible working has a direct impact on employee engagement. Aspects of flexible working related to enabling technologies (mobile technologies, flexibility of enterprise systems, IT training) and the freedom to work remotely in particular had a very significant impact on employee pride and willingness to recommend their employer to others. This means that flexible working practices and systems should be a CEO priority and not treated as another IT rollout, for example of web frontends or VPN tunnels.
2. European organisations have come a long way in flexible working practices, but there are significant regional differences. For example, we found a north/south divide in the acceptance of working from home, as Nordic countries had the highest acceptance and Central and Southern Europe had the lowest. These differences have to do with
CONCLUSION
59
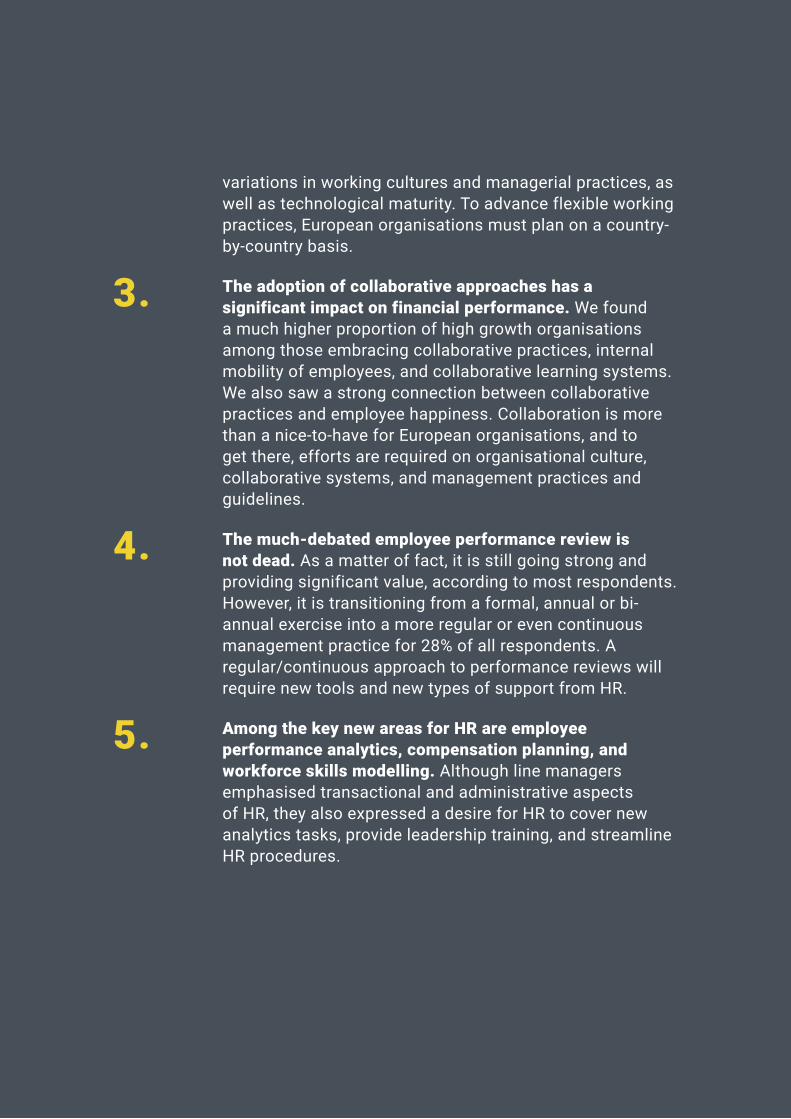
variations in working cultures and managerial practices, as well as technological maturity. To advance flexible working practices, European organisations must plan on a country-by-country basis.
3. The adoption of collaborative approaches has a significant impact on financial performance. We found a much higher proportion of high growth organisations among those embracing collaborative practices, internal mobility of employees, and collaborative learning systems. We also saw a strong connection between collaborative practices and employee happiness. Collaboration is more than a nice-to-have for European organisations, and to get there, efforts are required on organisational culture, collaborative systems, and management practices and guidelines.
4. The much-debated employee performance review is not dead. As a matter of fact, it is still going strong and providing significant value, according to most respondents. However, it is transitioning from a formal, annual or bi-annual exercise into a more regular or even continuous management practice for 28% of all respondents. A regular/continuous approach to performance reviews will require new tools and new types of support from HR.
5. Among the key new areas for HR are employee performance analytics, compensation planning, and workforce skills modelling. Although line managers emphasised transactional and administrative aspects of HR, they also expressed a desire for HR to cover new analytics tasks, provide leadership training, and streamline HR procedures.
60
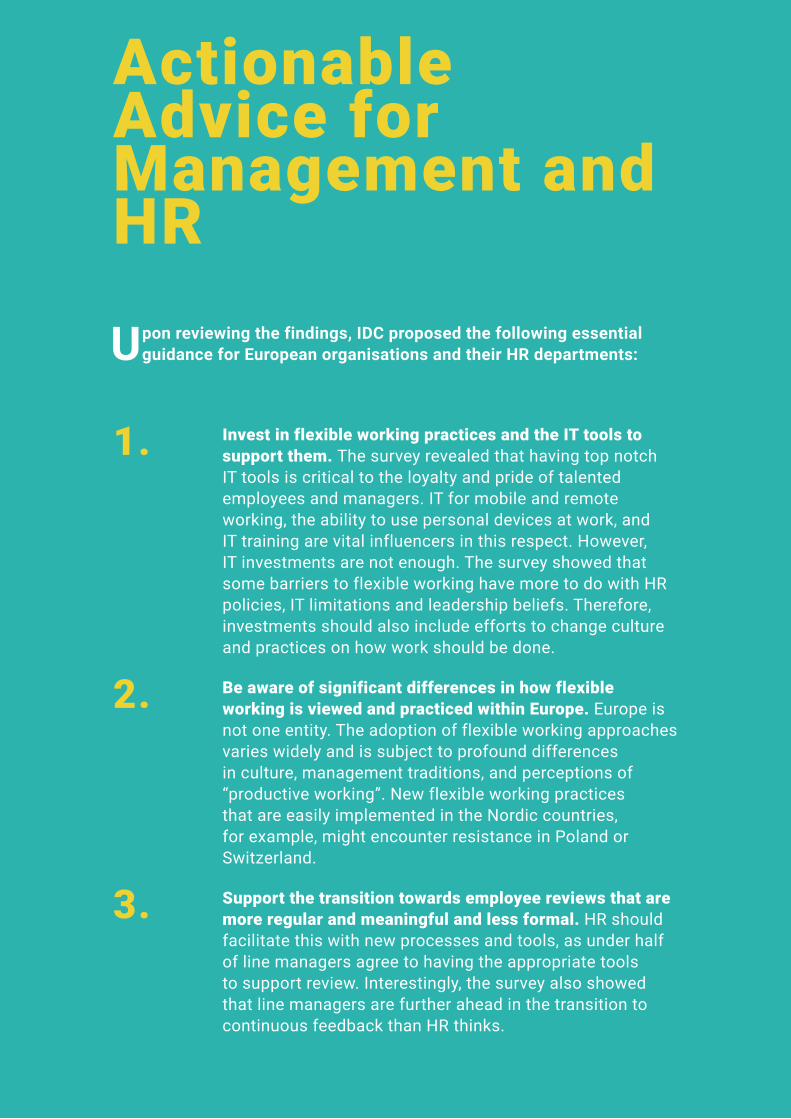
Upon reviewing the findings, IDC proposed the following essential guidance for European organisations and their HR departments:
1. Invest in flexible working practices and the IT tools to support them. The survey revealed that having top notch IT tools is critical to the loyalty and pride of talented employees and managers. IT for mobile and remote working, the ability to use personal devices at work, and IT training are vital influencers in this respect. However, IT investments are not enough. The survey showed that some barriers to flexible working have more to do with HR policies, IT limitations and leadership beliefs. Therefore, investments should also include efforts to change culture and practices on how work should be done.
2. Be aware of significant differences in how flexible working is viewed and practiced within Europe. Europe is not one entity. The adoption of flexible working approaches varies widely and is subject to profound differences in culture, management traditions, and perceptions of “productive working”. New flexible working practices that are easily implemented in the Nordic countries, for example, might encounter resistance in Poland or Switzerland.
3. Support the transition towards employee reviews that are more regular and meaningful and less formal. HR should facilitate this with new processes and tools, as under half of line managers agree to having the appropriate tools to support review. Interestingly, the survey also showed that line managers are further ahead in the transition to continuous feedback than HR thinks.
Actionable Advice for Management and HR

61
4. Invest in collaborative initiatives and in the development of collaborative cultures, where internal mobility is accepted. The survey showed that the proportion of high growth organisations is significantly higher among those embracing collaborative practices, internal mobility, and learning systems. It also showed that acceptance of internal mobility has a major impact on respondent “happiness”. Finally, we found that HR overestimates how accepted internal mobility is in organisations, and that HR should actively engage with line managers to promote this.
5. Promote more direct and proactive engagement between HR professionals and their internal customers in line-of-business units. HR needs to better understand management requirements, set expectations, and promote HR strategies, tools, and processes. Line managers unfortunately appear to be more frustrated with and feel less supported by HR than HR thinks. We also found that HR considered itself ready to be a strategic partner for management with planning and analysis tasks, while line managers had a tendency to confine HR to its traditional transaction tasks related to employee and training administration. Successful HR managers must work hard to align themselves and their activities to their internal “customers”.
6. Embrace training and competency building as a low-hanging fruit for HR recognition. Across the survey, HR respondents generally estimated the need for training and development to be significantly lower than the line managers they are supposed to serve. Building competencies, recording these and reviewing them, and matching skills to incoming tasks were high on the line managers’ radar. If HR doubles down on skills management, training, and associated tools, it will fulfil a need in the organisation.
7. Invest in the digitalisation of HR processes and subsequently in analytics and planning capabilities. The survey showed that apart from getting a better and cheaper HR department, the respondents really looked to improve and create more actionable HR information and to apply this information in both tactical and strategic planning. This is likely to require a lot of changes in today’s HR departments, including in the HR applications used, HR skills currently available, and HR measurements.
62
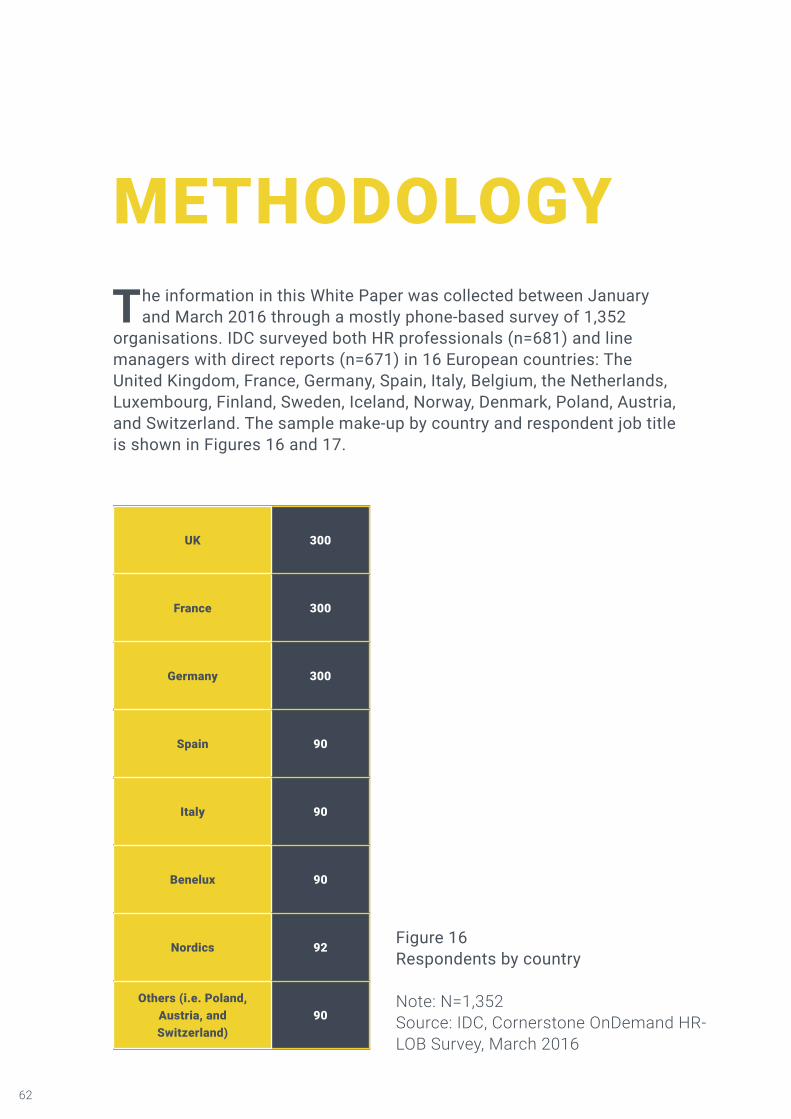
METHODOLOGYThe information in this White Paper was collected between January
and March 2016 through a mostly phone-based survey of 1,352 organisations. IDC surveyed both HR professionals (n=681) and line managers with direct reports (n=671) in 16 European countries: The United Kingdom, France, Germany, Spain, Italy, Belgium, the Netherlands, Luxembourg, Finland, Sweden, Iceland, Norway, Denmark, Poland, Austria, and Switzerland. The sample make-up by country and respondent job title is shown in Figures 16 and 17.
UK 300
France 300
Germany 300
Spain 90
Italy 90
Benelux 90
Nordics 92
Others (i.e. Poland, Austria, and Switzerland)
90
Figure 16Respondents by country
Note: N=1,352Source: IDC, Cornerstone OnDemand HR-LOB Survey, March 2016
63
Manufacturing 21%
Business services 19%
Financial services 19%
Retail & Wholesale 18%
IT & Telecommunications
6%
Energy & Utilities 4%
Media and Entertainment
3%
Transport & Logistics 2%
Education 2%
Local / central government
2%
Healthcare & Lifesciences
2%
Other 1%
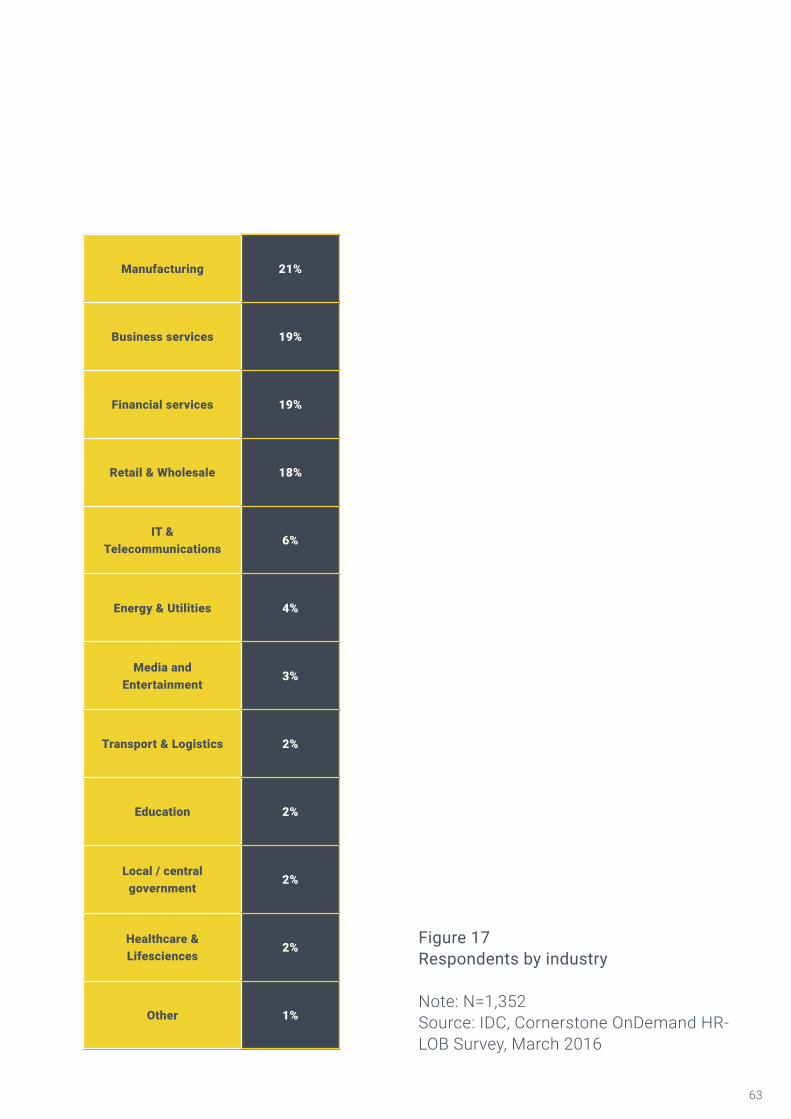
Figure 17Respondents by industry
Note: N=1,352Source: IDC, Cornerstone OnDemand HR-LOB Survey, March 2016
64
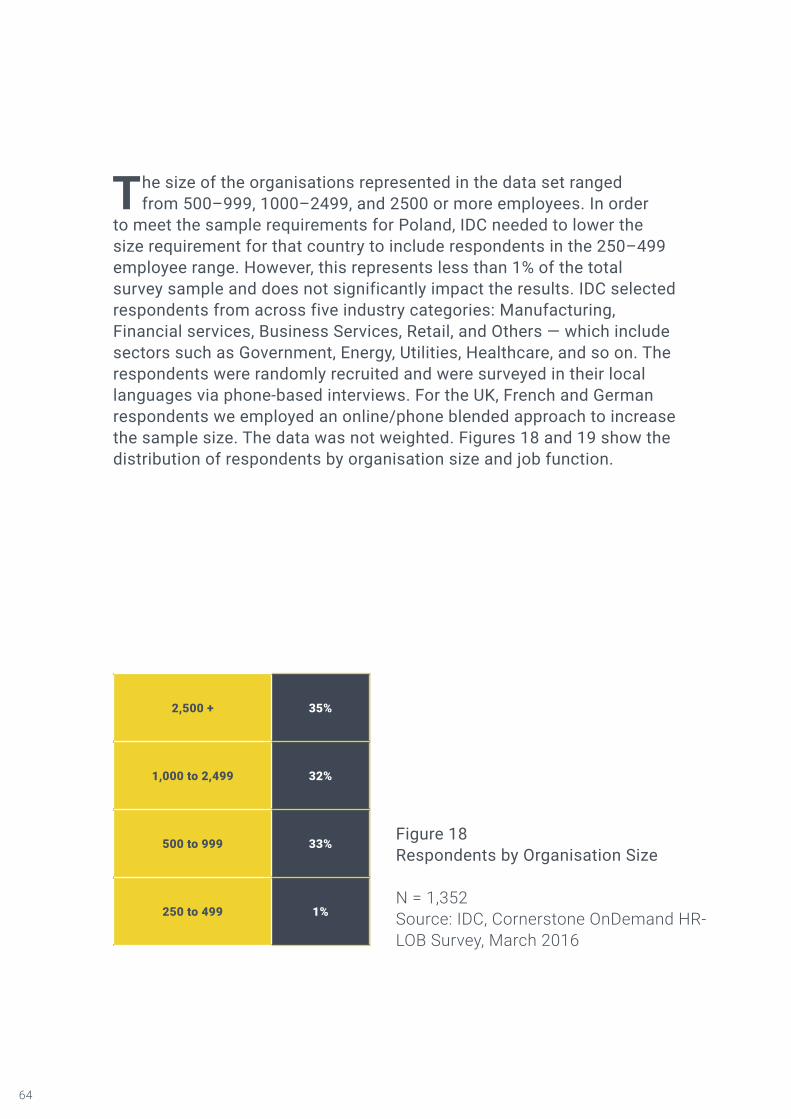
The size of the organisations represented in the data set ranged from 500–999, 1000–2499, and 2500 or more employees. In order
to meet the sample requirements for Poland, IDC needed to lower the size requirement for that country to include respondents in the 250–499 employee range. However, this represents less than 1% of the total survey sample and does not significantly impact the results. IDC selected respondents from across five industry categories: Manufacturing, Financial services, Business Services, Retail, and Others — which include sectors such as Government, Energy, Utilities, Healthcare, and so on. The respondents were randomly recruited and were surveyed in their local languages via phone-based interviews. For the UK, French and German respondents we employed an online/phone blended approach to increase the sample size. The data was not weighted. Figures 18 and 19 show the distribution of respondents by organisation size and job function.
2,500 + 35%
1,000 to 2,499 32%
500 to 999 33%
250 to 499 1%
Figure 18Respondents by Organisation Size
N = 1,352Source: IDC, Cornerstone OnDemand HR-LOB Survey, March 2016

65
Human Resources (HR) 50%
Sales 13%
Marketing 12%
Information Technology (IT)
10%
Operations or Logistics 5%
Finance & Accounting 5%
Production 2%
Other 3%
Figure 19Respondents by function
N = 1,352Source: IDC, Cornerstone OnDemand HR-LOB Survey, March 2016

66
About IDC
International Data Corporation (IDC) is the premier global provider of market intelligence, advisory services, and events for the information technology,
telecommunications, and consumer technology markets. IDC helps IT professionals, business executives, and the investment community make fact-based decisions on technology purchases and business strategy. More than 1,100 IDC analysts provide global, regional, and local expertise on technology and industry opportunities and trends in over 110 countries worldwide. For 50 years, IDC has provided strategic insights to help our clients achieve their key business objectives. IDC is a subsidiary of IDG, the world’s leading technology media, research, and events company.
IDC UK5th Floor, Ealing Cross, 85 Uxbridge RoadLondon W5 5TH, United Kingdom44.208.987.7100Twitter: @IDCidc-community.comwww.idc.com
About Cornerstone OnDemand
Cornerstone OnDemand (NASDAQ: CSOD) is a global leader in cloud-based learning and talent management software. The company’s solutions help
organisations realise the potential of a modern workforce. From recruitment, onboarding, training and collaboration, to performance management, compensation, succession planning and analytics, Cornerstone is designed to enable a lifetime of learning and development that is fundamental to the growth of employees and organisations. Based in Santa Monica, California, the company’s solutions are used by approximately 2,600 clients worldwide, spanning more than 23.8 million users across 191 countries and 42 languages.Based in Santa Monica, California, the company’s solutions are used by approximately 2,600 clients worldwide, spanning more than 23.8 million users.www.csod.co.uk @csod-emea

67
Copyright and Restrictions
Any IDC information or reference to IDC that is to be used in advertising, press releases, or promotional materials requires prior written approval from IDC. For permission requests contact the Custom Solutions information line at 508-988-7610 or [email protected]. Translation and/or localization of this document require an additional license from IDC. For more information on IDC visit www.idc.com. For more information on IDC Custom Solutions, visit http://www.idc.com/prodserv/custom_solutions/index.jsp.Global Headquarters: 5 Speen Street Framingham, MA 01701 USA P.508.872.8200 F.508.935.4015 www.idc.com
Copyright 2016 IDC. Reproduction is forbidden unless authorized. All rights reserved.
68
Sponsored by:
FuturePeople
Workplace Evolution in the Age of Digital Transformation
Copyright 2016 IDC. Reproduction is forbidden unless authorised. All rights reserved.