
Future of the Czech Defense Industry Attractiveness ... - SP.pdfFuture of the Czech Defense Industry...
19
Report Price: US$ 1250 (Single User) Future of the Czech Defense Industry – Market Attractiveness, Competitive Landscape and Forecasts to 2020
Transcript of Future of the Czech Defense Industry Attractiveness ... - SP.pdfFuture of the Czech Defense Industry...

Report Price: US$ 1250 (Single User)
Future of the Czech Defense Industry – Market
Attractiveness, Competitive Landscape and
Forecasts to 2020
Future of the Czech Defense Industry – Market Attractiveness, Competitive Landscape and Forecasts to 2020
2
Summary
“Future of the Czech Defense Industry – Market Attractiveness, Competitive Landscape and Forecasts to
2020” report offers the reader detailed analysis of the defense budget over the next five years. Alongside it
offers insights into the market opportunities and entry strategies adopted by foreign OEMs (original
equipment manufacturers) to gain a market share in the Czech defense industry.
The report provides detailed analysis of the current industry size and growth expectations during 2016–
2020, including highlights of the key growth stimulators. It also benchmarks the industry against key global
markets and provides detailed understanding of emerging opportunities in specific areas.
Key Findings
The Czech Republic defense budget values US$XX billion in 2015, registering a CAGR of -XX% during the
historic period. An increase in defense expenditure is anticipated during the forecast period, primarily due
to renewed equipment procurement in the wake of the Ukraine crisis, peacekeeping operations, and
counter terrorism. Consequently, defense spending is projected to value US$XX billion in 2020, growing
at a CAGR of XX% during 2016-2020. In addition, capital expenditure is expected to increase at a CAGR
of XX% during the forecast period, to value US$XX million in 2020. On a cumulative basis, the country is
estimated to spend US$XX billion over the forecast period on the procurement of defense equipment. In
the coming years, demand for equipment is mainly expected to revolve around multi-purpose aircraft and
mine resistant ambush protected (MRAP) vehicles. The majority of the defense budget will go towards
revenue expenditure, which includes personnel salaries, operational expenses, training, and development.
Key Features and Benefits
The report provides detailed analysis of the Czech defense industry during 2011–2020, including the
factors that influence the military expenditure. It provides detailed expectations of growth rates and
projected total expenditure.
It provides the manufacturers with insights on market opportunities along with industry structure and
dynamics prevalent in the country. In addition, the report focuses on the regulations governing the Czech
defense industry and the potential market entry strategies with an expert analysis of the competitive
structure.

Future of the Czech Defense Industry – Market Attractiveness, Competitive Landscape and Forecasts to 2020
3
1. Market Attractiveness and Emerging Opportunities
1.1. Defense Market Size Historical and Forecast
1.1.1. Czech defense expenditure expected to register a CAGR of XX% over the forecast period
The Czech government allocated US$XX billion to its total defense budget in 2015, recording a CAGR of -
XX%. The decline in the historic period was primarily due to the global financial crisis and rising government
debt faced by the country. However, the defense budget is expected to register a CAGR of XX% during the
forecast period to value US$XX billion in 2020. The increase is primarily due to the country’s efforts in
protecting its interests in the Ukrainian region in light of growing Russian assertiveness and participation in
peacekeeping and counter terrorism operations. The country is anticipated to cumulatively spend US$XX
billion over the forecast period.
The following table and figure show the Czech defense expenditure during the historic period:
Table 1: Czech Defense Expenditure ( US$ Billion), 2011–2015
Year Defense expenditure (US$ bn)
Defense growth percentage
2011
2012
2013
2014
2015
CAGR 2011–2015
Source: Ministry of Defense and SDI analysis © SDI
Figure 1: Czech Defense Expenditure (US$ Billion), 2011–2015
Source: Ministry of Defense and SDI analysis © SDI
-5%
0%
5%
10%
15%
20%
25%
30%
35%
0
1
2
3
4
5
6
2011 2012 2013 2014 2015
Gro
wth
rate
(%)
Def
ense
exp
end
itu
re (U
S$
Bill
ion
)
Defense expenditure (US$ bn) Defense growth percentage

Future of the Czech Defense Industry – Market Attractiveness, Competitive Landscape and Forecasts to 2020
4
The following table and figure show projected defense expenditure of the Czech over the forecast period:
Table 2: Czech Defense Expenditure (US$ Billion), 2016–2020
Year Defense expenditure (US$ bn)
Defense growth percentage
2016
2017
2018
2019
2020
CAGR 2016–2020
Source: Ministry of Defense and SDI analysis © SDI
Figure 2: Czech Defense Expenditure (US$ Billion), 2016–2020
Source: Ministry of Defense and SDI analysis © SDI
0%
1%
2%
3%
4%
5%
6%
7%
8%
9%
0
1
2
3
4
5
6
7
2016 2017 2018 2019 2020
Gro
wth
ra
te (
%)
De
fen
se
ex
pe
nd
itu
re (
US
$ B
illi
on
)
Defense expenditure (US$ bn) Defense growth percentage

Future of the Czech Defense Industry – Market Attractiveness, Competitive Landscape and Forecasts to 2020
5
1.2. Analysis of Defense Budget Allocation
1.2.1. Share of capital expenditure expected to increase over forecast period
During 2011–2015, an average of XX% of the country’s defense budget was allocated to capital expenditure,
while an average of XX% was reserved for revenue expenditure. Capital expenditure is anticipated to grow at
an average of XX% during the forecast period. The increase is primarily due to the country’s focus on
replacing its obsolete military equipment. The remaining budget is allocated to revenue expenditure, which
includes personnel salaries, and the operation and maintenance costs of equipment and defense facilities.
The following table and chart display the Czech defense budget share of capital and revenue expenditure
during the historic period:
Table 3: Czech Defense Budget Split Between Capital and Revenue Expenditure (%), 2011–2015
Year Capital Expenditure Share Revenue Expenditure Share
2011
2012
2013
2014
2015
Source: Ministry of Defense, Czech Republic and SDI analysis © SDI
Figure 3: Czech Defense Budget Split Between Capital and Revenue Expenditure (%), 2011–2015
Source: Ministry of Defense and SDI analysis © SDI
0%
10%
20%
30%
40%
50%
60%
70%
80%
90%
100%
2011 2012 2013 2014 2015
Def
ense
Bud
get
Spl
it (%
)
Capital Expenditure Share Revenue Expenditure Share

Future of the Czech Defense Industry – Market Attractiveness, Competitive Landscape and Forecasts to 2020
6
The following table and chart display the Czech defense budget share of capital and revenue expenditure
over the forecast period:
Table 4: Czech Defense Budget Split Between Capital and Revenue Expenditure (%), 2016–2020
Year Capital Expenditure Share Revenue Expenditure Share
2016
2017
2018
2019
2020
Source: Ministry of Defense, Czech Republic and SDI analysis © SDI
Figure 4: Czech Defense Budget Split Between Capital and Revenue Expenditure (%), 2016–2020
Source: Ministry of Defense and SDI analysis © SDI
0%
10%
20%
30%
40%
50%
60%
70%
80%
90%
100%
2016 2017 2018 2019 2020
Defe
nse B
ud
get
Sp
lit
(%)
Capital Expenditure Share Revenue Expenditure Share

Future of the Czech Defense Industry – Market Attractiveness, Competitive Landscape and Forecasts to 2020
7
1.3. Homeland Security Market Size and Forecast
1.3.1. Czech homeland security expected to grow at a steady pace
The Czech Republic’s homeland security values US$XX billion in 2015 and registered a CAGR of -XX%.
However, it is expected to increase over the forecast period at a CAGR of XX% to value US$XX billion in
2020. The increase in expenditure is primarily due to the government’s focus to combat the policing of
extremism, drug trafficking, espionage, and illegal immigration. Consequently, the country plans to procure
surveillance and intelligence technologies such as electronic identification documents, automated border
crossing systems, and CCTV (closed circuit television) systems.
The table and chart below show the Czech homeland security expenditure during the historic period:
Table 5: Czech Homeland Security Expenditure (US$ Billion), 2011–2015
Year Homeland expenditure
(US$ billion) % Growth
2011
2012
2013
2014
2015
Source: Ministry of Interior, Czech Republic and SDI analysis © SDI
Figure 5: Czech Homeland Security Expenditure (US$ Billion), 2011–2015
Source: Ministry of Interior, Czech Republic and SDI analysis © SDI
-20%
-15%
-10%
-5%
0%
5%
10%
15%
20%
25%
0
1
2
3
4
5
6
7
2011 2012 2013 2014 2015
Gro
wth
rate
(%)
Ho
mel
and
Sec
uri
ty e
xpen
dit
ure
(US
$ B
illio
n)
Homeland Security Budget (US$ bn) Growth rate (%)
Future of the Czech Defense Industry – Market Attractiveness, Competitive Landscape and Forecasts to 2020
8
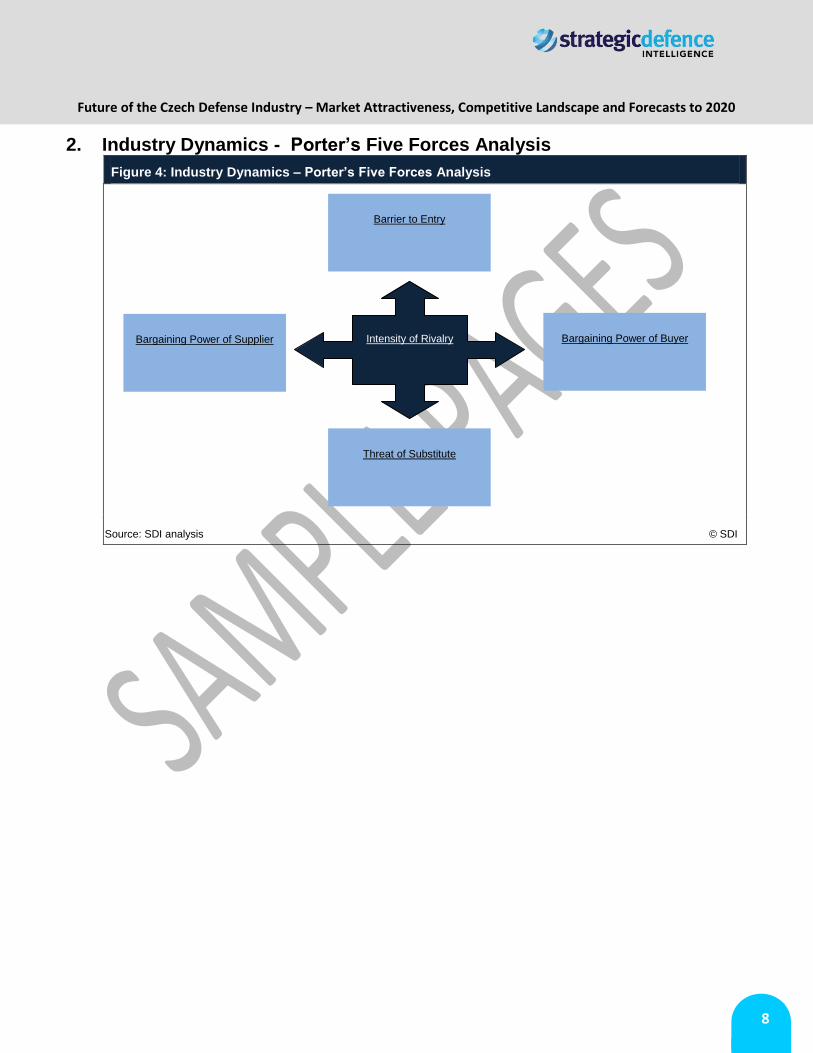
2. Industry Dynamics - Porter’s Five Forces Analysis
Figure 4: Industry Dynamics – Porter’s Five Forces Analysis
Source: SDI analysis © SDI
Intensity of Rivalry Bargaining Power of Supplier
Bargaining Power of Buyer
Barrier to Entry
Threat of Substitute

Future of the Czech Defense Industry – Market Attractiveness, Competitive Landscape and Forecasts to 2020
9
Report Methodology
SDI’s dedicated research and analysis teams consist of experienced professionals with a background in
industry research and consulting in the defense sector. The following research methodology is followed for all
databases and reports:
Secondary Research
The research process begins with exhaustive secondary research to source reliable qualitative and
quantitative information related to the defense market. The secondary research sources that are typically
referred to include, but are not limited to:
Industry associations
National government documents and statistical databases
Company websites, annual reports, financial reports, broker reports, investor presentations
Industry trade journals and other literature
Internal and external proprietary databases
News articles, press releases, and webcasts specific to the companies operating in the market
Primary Research
SDI conducts hundreds of primary interviews a year with industry participants and commentators in order to
validate its data and analysis. A typical research interview fulfills the following functions:
Provides first-hand information on market size, market trends, growth trends, competitive landscape,
and future outlook
Helps to validate and strengthen secondary research findings
Further develops the analysis team’s expertise and market understanding
Primary research involves e-mail interactions, telephone interviews, and face-to-face interviews for
each market category, division, and sub-division across geographies
The participants who typically take part in such a process include, but are not limited to:
Industry participants: CEOs, VPs, business development managers, market intelligence managers,
and national sales managers
External experts: investment bankers, valuation experts, research analysts, and key opinion leaders
specializing in defense markets
Conventions
Currency conversions are performed on the basis of average annual conversion rate format
calculations
All the values in tables, with the exception of compounded annual growth rate (CAGR) and
compounded annual rate of change (CARC), are displayed to one decimal place; therefore, due to
this rounding method, growth rates may appear inconsistent with absolute values
The forecasted values are projected on the basis of nominal values; the inflation was not taken into account
Future of the Czech Defense Industry – Market Attractiveness, Competitive Landscape and Forecasts to 2020
10
TABLE OF CONTENTS
1. Introduction ........................................................................................................................... 9
1.1. What is this Report About? ........................................................................................................... 9
1.2. Definitions ....................................................................................................................................... 9
1.3. Summary Methodology .................................................................................................................11
1.4. SDI Terrorism Index ......................................................................................................................12
1.5. About Strategic Defence Intelligence...........................................................................................12
2. Executive Summary ............................................................................................................ 13
3. Market Attractiveness and Emerging Opportunities ........................................................ 14
3.1. Defense Market Size Historical and Forecast ..............................................................................15
3.1.1. Czech defense expenditure estimated to be US$XX billion over the forecast period .............................. 15
3.1.2. Peacekeeping operations and counter-terrorism are expected to drive the Czech defense expenditure 19
3.1.3. Defense expenditure as a percentage of GDP expected to fall during the forecast period ..................... 21
3.2. Analysis of Defense Budget Allocation .......................................................................................23
3.2.1. Capital expenditure allocation is expected to increase over the forecast period ..................................... 23
3.2.2. Capital expenditure expected to increase over the forecast period ......................................................... 25
3.2.3. Central support and administration expenditure account for the majority of the Czech defense budget . 29
3.2.4. Army expenditure to increase over the forecast period ............................................................................ 31
3.2.5. Air Force expenditure is expected to increase in forecast period............................................................. 35
3.2.6. Central support and administration expenditure to remain consistent over the forecast period .............. 39
3.2.7. Per capita defense expenditure expected to increase over the forecast period ...................................... 43
3.3. Homeland Security Market Size and Forecast .............................................................................45
3.3.1. Homeland security budget projected to increase over the forecast period .............................................. 45
3.3.2. Extremism, drug trafficking, espionage, and illegal immigration are forecast to drive the homeland
security market ...................................................................................................................................................... 49
3.3.3. The Czech Republic considered at ‘some risk’ of terrorist attack............................................................. 50
3.3.4. The Czech Republic experienced low terror activity during the review period ......................................... 52
3.4. Benchmarking with Key Global Markets ......................................................................................54
3.4.1. Czech defense budget expected to register marginal growth over the forecast period ........................... 54
3.4.2. Czech military expenditure is expected to remain low compared to other leading spenders .................. 56
3.4.3. The country allocates a lower percentage of GDP towards defense than other NATO members ........... 57
3.5. Market Opportunities: Key Trends and Growth Stimulators ......................................................58
3.5.1. Multi-role aircraft ....................................................................................................................................... 58
3.5.2. Transport Aircraft expected to create new market opportunity over the forecast period ......................... 59
3.5.3. Military Helicopters expected to create new market opportunities ........................................................... 60
4. Defense Procurement Market Dynamics ........................................................................... 61
Future of the Czech Defense Industry – Market Attractiveness, Competitive Landscape and Forecasts to 2020
11
4.1. Import Market Dynamics ...............................................................................................................62
4.1.1. Defense imports registered a decline during 2010–2014 ......................................................................... 62
4.1.2. Spain and Austria were the major exporters to the country ..................................................................... 63
4.1.3. Aircraft and armored vehicles are the largest imported military hardware ............................................... 64
4.2. Export Market Dynamics ...............................................................................................................65
4.2.1. Czech defense industry witnessed declining trend in exports during the historic period ......................... 65
4.2.2. Cambodia and Russia were the key importers of Czech defense goods ................................................. 66
4.2.3. Aircraft accounts for the highest portion of Czech defense exports ......................................................... 67
5.1. Five Forces Analysis .....................................................................................................................68
5.1.1. Bargaining power of supplier: low to medium ........................................................................................... 69
5.1.2. Bargaining power of buyer: medium ......................................................................................................... 69
5.1.3. Barrier to entry: medium ........................................................................................................................... 69
5.1.4. Intensity of rivalry: medium to high ........................................................................................................... 69
5.1.5. Threat of substitution: Medium to high ..................................................................................................... 69
6.1. Market Regulation .........................................................................................................................70
6.1.1. Offset policy aids the development of the domestic defense industry ..................................................... 70
6.1.2. The Czech Republic allows 100% foreign direct investment in the defense sector ................................. 71
6.2. Market Entry Route........................................................................................................................72
6.2.1. Subsidiaries and branch offices provide attractive market entry routes ................................................... 72
6.2.2. Foreign OEMs enter the market through the acquisition of domestic defense companies ...................... 72
6.2.3. Foreign OEMs enter into the market through the formation of consortiums and product development
agreements ........................................................................................................................................................... 73
6.3. Key Challenges ..............................................................................................................................74
6.3.1. Limited defense budget limits the market entry of foreign companies ..................................................... 74
6.3.2. Corruption acts as an obstacle for market entry ....................................................................................... 74
7. Competitive Landscape and Strategic Insights ................................................................ 75
7.1. Competitive Landscape Overview ................................................................................................75
7.2. Key Domestic Companies .............................................................................................................75
7.2.1. Aero Vodochody A.S.: overview ............................................................................................................... 75
7.2.2. Aero Vodochody A.S.: products and services .......................................................................................... 75
7.2.3. Aero Vodochody A.S.: recent announcements and strategic initiatives ................................................... 76
7.2.4. Aero Vodochody A.S.: alliances ............................................................................................................... 77
7.2.5. Aero Vodochody A.S.: recent contract wins ............................................................................................. 78
7.2.6. Lom Praha s.p.: overview ......................................................................................................................... 79
7.2.7. Lom Praha s.p.: products and services .................................................................................................... 79
7.2.8. Lom Praha s.p.: recent announcements and strategic initiatives ............................................................. 80
7.2.9. Lom Praha s.p.: alliances ......................................................................................................................... 80

Future of the Czech Defense Industry – Market Attractiveness, Competitive Landscape and Forecasts to 2020
12
7.2.10. Lom Praha s.p.: recent contract wins ....................................................................................................... 80
7.2.11. VOP 025 Nový Jičín, s.p.: overview ......................................................................................................... 81
7.2.12. VOP 025 Nový Jičín, s.p.: product and services ...................................................................................... 81
7.2.13. VOP 025 Nový Jičín, s.p.: recent announcements and strategic initiatives ............................................. 81
7.2.14. VOP 025 Nový Jičín, s.p.: recent contract wins........................................................................................ 82
7.2.15. Omnipol a.s.: overview ............................................................................................................................. 82
7.2.16. Omnipol a.s.: product and services .......................................................................................................... 82
7.2.17. Omnipol a.s.: recent announcements and strategic initiatives ................................................................. 83
7.2.18. Omnipol a.s.: alliances .............................................................................................................................. 84
7.2.19. Omnipol a.s.: recent contract wins ........................................................................................................... 84
7.2.20. Aura s.r.o.: overview ................................................................................................................................. 84
7.2.21. Aura s.r.o.: product and services .............................................................................................................. 85
7.2.22. Aura s.r.o.: recent announcements and strategic initiatives ..................................................................... 85
7.2.23. Aura s.r.o.: recent contract wins ............................................................................................................... 86
7.2.24. Dicom, spol. s.r.o.: overview ..................................................................................................................... 86
7.2.25. Dicom, spol. s.r.o.: product and services .................................................................................................. 86
7.2.26. Dicom, spol. s.r.o.: recent announcements and strategic initiatives ........................................................ 87
7.2.27. Dicom, spol. s.r.o.: recent contract wins ................................................................................................... 87
7.2.28. Quittner & Schimek s.r.o.: overview ......................................................................................................... 88
7.2.29. Quittner & Schimek s.r.o.: product and services ...................................................................................... 88
7.2.30. Quittner & Schimek s.r.o.: recent contract wins........................................................................................ 89
7.2.31. Česká zbrojovka a.s.: overview ................................................................................................................ 90
7.2.32. Česká zbrojovka a.s.: product and services ............................................................................................. 90
7.2.33. Česká zbrojovka a.s.: recent announcements and strategic initiatives .................................................... 91
7.2.34. Česká zbrojovka a.s.: recent contract wins .............................................................................................. 92
7.2.35. Tesla, akciova spolecnost: overview ........................................................................................................ 92
7.2.36. Tesla, akciova spolecnost: product and services ..................................................................................... 92
7.2.37. Tesla, akciova spolecnost: recent announcements and strategic initiatives ............................................ 93
7.2.38. Tatra a.s.: overview .................................................................................................................................. 94
7.2.39. Tatra a.s.: product and services ............................................................................................................... 94
7.2.40. Tatra a.s.: recent announcements and strategic initiatives ...................................................................... 95
7.2.41. Tatra a.s.: alliances ................................................................................................................................... 96
7.2.42. Tatra a.s.: recent contract wins ................................................................................................................ 96
7.3. Key Foreign Companies................................................................................................................97
7.3.1. Letov Letecká Výroba s.r.o.: overview ...................................................................................................... 97
7.3.2. Letov Letecká Výroba s.r.o.: product and services .................................................................................. 97
7.3.3. Letov Letecká Výroba s.r.o.: alliances ...................................................................................................... 98
Future of the Czech Defense Industry – Market Attractiveness, Competitive Landscape and Forecasts to 2020
13
8. Business Environment and Country Risk ......................................................................... 99
8.1. Demographics ...............................................................................................................................99
8.1.1. Total Rural population ............................................................................................................................... 99
8.1.2. Total urban population ............................................................................................................................ 100
8.1.3. Number of households............................................................................................................................ 101
8.2. Economic Performance .............................................................................................................. 102
8.2.1. GDP per capita at constant prices .......................................................................................................... 102
8.2.2. GDP at current prices (US$) ................................................................................................................... 103
8.2.3. Exports of goods and services (current US$ Billions) ............................................................................ 104
8.2.4. Imports of goods and services (current US$ Billions) ............................................................................ 105
8.2.5. Gross national disposable income (US$ Billions) ................................................................................... 106
8.2.6. Manufacturing output (US$ Billions) ....................................................................................................... 107
8.2.7. Consumer price index ............................................................................................................................. 108
8.2.8. Wholesale price index ............................................................................................................................. 109
8.2.9. CZK per US$ (period average) ............................................................................................................... 110
8.2.10. Market capitalization of listed companies (US$ Billions) ........................................................................ 111
8.2.11. Market capitalization of listed companies (% of GDP) ........................................................................... 112
8.2.12. Total Government cash surplus/deficit (CZK Billion) .............................................................................. 113
8.2.13. Government cash surplus/deficit as a percentage of GDP (CZK) .......................................................... 114
8.2.14. Central government debt (CZK Billion) ................................................................................................... 115
8.2.15. Central government debt as a percentage of GDP (CZK) ...................................................................... 116
8.2.16. Goods exports as a percentage of GDP................................................................................................. 117
8.2.17. Goods imports as a percentage of GDP................................................................................................. 118
8.2.18. Services imports as a percentage of GDP ............................................................................................. 119
8.2.19. Service exports as a percentage of GDP ............................................................................................... 120
8.2.20. Services balance as a percentage of GDP............................................................................................. 121
8.2.21. Foreign direct investment, net (Bop, current US$ Billions) ..................................................................... 122
8.2.22. International reserves, including gold (US$ Billions) .............................................................................. 123
8.3. Energy and utilities ..................................................................................................................... 124
8.3.1. Total Conventional Thermal Electricity Net Generation (Billion kWh) .................................................... 124
8.3.2. Hydroelectricity Net Generation (Billion kWh) ........................................................................................ 125
8.3.3. Nuclear Electricity Net Generation (Billion kWh) .................................................................................... 126
8.3.4. Total Conventional Thermal Electricity Installed Capacity (Million kW) ................................................. 127
8.3.5. Total Petroleum Consumption (Thousand Barrels Per Day) .................................................................. 128
8.3.6. Total Non-Hydro Renewable Electricity Net Generation (Billion kW) ..................................................... 129
8.4. Infrastructure Quality and Availability ....................................................................................... 130
8.4.1. Air transport, freight (Million ton-km) ...................................................................................................... 130

Future of the Czech Defense Industry – Market Attractiveness, Competitive Landscape and Forecasts to 2020
14
8.5. Mineral.......................................................................................................................................... 131
8.5.1. Mining, Manufacturing, Utilities Output (US$ Billions) ............................................................................ 131
8.6. Technology .................................................................................................................................. 132
8.6.1. Research and development expenditure (CZK thousands) ................................................................... 132
8.6.2. Patents Granted ...................................................................................................................................... 133
8.7. Telecommunication ..................................................................................................................... 134
8.7.1. Telephone lines (in Millions) ................................................................................................................... 134
8.7.2. Telephone lines Penetration Rate (per 100 people) ............................................................................... 135
9. Appendix ............................................................................................................................ 136
9.1. About SDI ..................................................................................................................................... 136
9.2. Disclaimer .................................................................................................................................... 136

Future of the Czech Defense Industry – Market Attractiveness, Competitive Landscape and Forecasts to 2020
15
LIST OF FIGURES
Figure 1: Czech Defense Expenditure (US$ Billion), 2011–2015 ......................................................................... 15
Figure 2: Czech Defense Expenditure (US$ Billion), 2016–2020 ......................................................................... 16
Figure 3: Czech Defense Expenditure (CZK Billion), 2011–2015 ........................................................................ 17
Figure 4: Czech Defense Expenditure (CZK Billion), 2016–2020 ........................................................................ 18
Figure 5: Czech GDP Growth vs. Defense Expenditure Growth and Defense Expenditure as Percentage of
GDP Growth, 2011–2015 ...................................................................................................................................... 21
Figure 6: Czech GDP Growth vs. Defense Expenditure Growth and Defense Expenditure as Percentage of
GDP Growth, 2016–2020 ...................................................................................................................................... 22
Figure 7: Czech Defense Expenditure Allocation for Capital and Revenue Expenditure (%), 2011–2015 .......... 23
Figure 8: Czech Defense Expenditure Allocation for Capital and Revenue Expenditure (%), 2016–2020 .......... 24
Figure 9: Czech Defense Capital Expenditure (US$ Million), 2011–2015 ............................................................ 25
Figure 10: Czech Defense Capital Expenditure (US$ Million), 2016–2020 .......................................................... 26
Figure 11: Czech Defense Capital Expenditure (CZK Billion), 2011–2015 .......................................................... 27
Figure 12: Czech Defense Capital Expenditure (CZK Billion), 2016–2020 .......................................................... 28
Figure 13: Czech Defense budget breakdown (%), 2011–2015 ........................................................................... 29
Figure 14: Czech Defense budget breakdown (%), 2016–2020 ........................................................................... 30
Figure 15: Czech Republic’s Defense Expenditure budget for Army (US$ Million), 2011–2015 .......................... 31
Figure 16: Czech Republic’s Defense Expenditure budget for Army (US$ Million), 2016–2020 .......................... 32
Figure 17: Czech Republic’s Defense Expenditure budget for Army (CZK Bn), 2011–2015 ............................... 33
Figure 18: Czech Republic’s Defense Expenditure budget for Army (CZK Bn), 2016–2020 ............................... 34
Figure 19: Czech Air Force Spending Allocation (US$ Billion), 2011–2015 ......................................................... 35
Figure 20: Czech Air Force Spending Allocation (US$ Million), 2016–2020 ........................................................ 36
Figure 21: Czech Air Force Spending Allocation (CZK Billion), 2011–2015 ......................................................... 37
Figure 22: Czech Air Force Spending Allocation (CZK Billion), 2016–2020 ......................................................... 38
Figure 23: Czech Republic’s Defense Budget Allocation for Central Support and Administration (US$ Billion),
2011–2015 ............................................................................................................................................................ 39
Figure 24: Czech Republic’s Defense Budget Allocation for Central Support and Administration (US$ Billion),
2016–2020 ............................................................................................................................................................ 40
Figure 25: Czech Republic’s Defense Budget Allocation for Central Support and Administration (CZK Billion),
2011–2015 ............................................................................................................................................................ 41
Figure 26: Czech Republic’s Defense Budget Allocation for Central Support and Administration (CZK Billion),
2016–2020 ............................................................................................................................................................ 42
Figure 27: Czech Republic per capita defense expenditure (US$), 2011–2015 .................................................. 43
Figure 28: Czech Republic per capita defense expenditure (US$), 2016–2020 .................................................. 44
Figure 29: Czech Homeland Security Budget (US$ Billion), 2011–2015 ............................................................. 45
Figure 30: Czech Homeland Security Budget (US$ Billion), 2016–2020 ............................................................. 46
Figure 31: Czech Homeland Security Budget (CZK Billion), 2011–2015 ............................................................. 47

Future of the Czech Defense Industry – Market Attractiveness, Competitive Landscape and Forecasts to 2020
16
Figure 32: Czech Homeland Security Budget (CZK Billion), 2016–2020 ............................................................. 48
Figure 33: SDI Terrorism Heat Map, 2015 ............................................................................................................ 50
Figure 34: SDI Terrorism Index, 2015 ................................................................................................................... 51
Figure 35: Benchmarking with Key Global Markets: 2011–2015 vs. 2016–2020 ................................................. 55
Figure 36: Defense Expenditure of Countries with the Largest Global Military Expenditure (US$ Billion), 2015
and 2020 ............................................................................................................................................................... 56
Figure 37: Defense Expenditure as percentage of GDP of Countries with the Largest Military Expenditure (%),
2015 .................................................................................................................................................................. 57
Figure 38: Multi-role Aircraft Market Size (US$ Million), 2015–2025 .................................................................... 58
Figure 39: Transport Aircraft Market Size (US$ Million), 2015–2025 ................................................................... 59
Figure 40: Military Helicopters Market Size (US$ Million), 2015–2025 ................................................................ 60
Figure 41: Czech Defense Imports (US$ Million), 2010–2014 ............................................................................. 62
Figure 42: Czech Defense Imports by Country (US$ Million), 2010–2014 ........................................................... 63
Figure 43: Czech Defense Imports by Category (US$ Million), 2010–2014 ......................................................... 64
Figure 44: Czech Defense Exports (US$ Million), 2010–2014 ............................................................................. 65
Figure 45: Czech Defense Exports by Country (US$ Million), 2010–2014 ........................................................... 66
Figure 46: Czech Defense Exports by Category (US$ Million), 2010–2014 ......................................................... 67
Figure 47: Industry Dynamics - Porter’s Five Forces Analysis ............................................................................. 68
Figure 48: Czech Rural population (Million), 2014–2024 ...................................................................................... 99
Figure 49: Czech Urban population (Million), 2015–2024 .................................................................................. 100
Figure 50: Czech Republic - Number of Households (Million), 2008–2017 ........................................................ 101
Figure 51: Czech GDP Per Capita at Constant Prices (US$), 2005–2014 ......................................................... 102
Figure 52: Czech GDP at Current Prices (US$ Billion), 2015–2024 .................................................................. 103
Figure 53: Czech Exports of goods and services (US$), 2003–2012 ................................................................. 104
Figure 54: Czech Imports of goods and services (US$ Billion), 2003–2012 ...................................................... 105
Figure 55: Czech Gross national disposable income (US$ Billion), 2003–2012 ................................................ 106
Figure 56: Czech Manufacturing output (US$ Billion), 2003–2012 .................................................................... 107
Figure 57: Czech Consumer price index, 2015–2024 ........................................................................................ 108
Figure 58: Czech Wholesale price index, 2003–2012 ........................................................................................ 109
Figure 59: Czech Republic CZK per US$, 2015–2024 ....................................................................................... 110
Figure 60: Czech market capitalization of listed companies (US$ Billion), 2003–2012 ..................................... 111
Figure 61: Czech market capitalization of listed companies (% of GDP), 2002–2011 ....................................... 112
Figure 62: Czech Total Government cash surplus/deficit (CZK Billion), 2002–2011.......................................... 113
Figure 63: Czech Government cash surplus/deficit as % of GDP (CZK), 2002–2011 ....................................... 114
Figure 64: Czech Central government debt (CZK Billion), 2002–2011 .............................................................. 115
Figure 65: Czech Central government debt as % of GDP (CZK), 2002–2011 ................................................... 116
Figure 66: Czech Republic- Goods exports as a % of GDP (%), 2002–2011 .................................................... 117
Figure 67: Czech Republic- Goods imports as a % of GDP (%), 2002–2011 .................................................... 118
Figure 68: Czech Services imports as a % of GDP (%), 2002–2011 ................................................................. 119
Future of the Czech Defense Industry – Market Attractiveness, Competitive Landscape and Forecasts to 2020
17
Figure 69: Czech Service exports as a % of GDP (%), 2002–2011 ................................................................... 120
Figure 70: Czech Republic- Services balance as a % of GDP (%), 2002–2011 ................................................ 121
Figure 71: Czech Republic- Foreign direct investment, net (BoP, current US$ Billion), 2002–2011 ................. 122
Figure 72: Czech International reserves, including gold (US$ Billion), 2002-2011 ............................................ 123
Figure 73: Czech Total Conventional Thermal Electricity Net Generation (Billion Kilowatt hours),
2001–2010 .......................................................................................................................................................... 124
Figure 74: Czech Hydroelectricity Net Generation (Billion Kilowatt hours), 2003–2012 .................................... 125
Figure 75: Czech Nuclear Electricity Net Generation (Billion Kilowatt hours), 2003–2012 ................................ 126
Figure 76: Czech Total Conventional Thermal Electricity Installed Capacity (Million Kilowatts), 2001–2010 .... 127
Figure 77: Czech Total Petroleum Consumption (Thousand Barrels Per Day), 2003–2012 .............................. 128
Figure 78: Total Non-Hydro Renewable Electricity Net Generation (Billion Kilowatts), 2003–2012 .................. 129
Figure 79: Czech Air transport, freight (million ton-km), 2002–2011 .................................................................. 130
Figure 80: Czech Mining, Manufacturing, Utilities Output (US$ Billion), 2003–2012 ......................................... 131
Figure 81: Czech R&D expenditure (CZK thousands), 2001–2010 .................................................................... 132
Figure 82: Czech Patents Granted, 2003–2012 ................................................................................................. 133
Figure 83: Czech Telephone lines, 2003–2012 (Million) .................................................................................... 134
Figure 84: Czech Telephone lines Penetration Rate (per 100 people), 2003–2012 .......................................... 135

Future of the Czech Defense Industry – Market Attractiveness, Competitive Landscape and Forecasts to 2020
18
LIST OF TABLES
Table 1: Czech Defense Expenditure (US$ Billion), 2011–2015 .......................................................................... 15
Table 2: Czech Defense Expenditure (US$ Billion), 2016–2020 .......................................................................... 16
Table 3: Czech Defense Expenditure (CZK Billion), 2011–2015 .......................................................................... 17
Table 4: Czech Defense Expenditure (CZK Billion), 2016–2020 .......................................................................... 18
Table 5: Czech GDP Growth vs. Defense Expenditure Growth and Defense Expenditure as Percentage of
GDP Growth, 2011–2015 ...................................................................................................................................... 21
Table 6: Czech GDP Growth vs. Defense Expenditure Growth and Defense Expenditure as Percentage of
GDP Growth, 2016–2020 ...................................................................................................................................... 22
Table 7: Czech Defense Expenditure Allocation for Capital and Revenue Expenditure (%), 2011–2015 ........... 23
Table 8: Czech Defense Expenditure Allocation for Capital and Revenue Expenditure (%), 2016–2020 ........... 24
Table 9: Czech Defense Capital Expenditure (US$ Million), 2011–2015 ............................................................. 25
Table 10: Czech Defense Capital Expenditure (US$ Million), 2016–2020 ........................................................... 26
Table 11: Czech Defense Capital Expenditure (CZK Billion), 2011–2015 ........................................................... 27
Table 12: Czech Defense Capital Expenditure (CZK Billion), 2016–2020 ........................................................... 28
Table 13: Czech Defense budget breakdown (%), 2011–2015 ............................................................................ 29
Table 14: Czech Defense budget breakdown (%), 2016–2020 ............................................................................ 30
Table 15: Czech Republic’s Defense Expenditure budget for Army (US$ Million), 2011–2015 ........................... 31
Table 16: Czech Republic’s Defense Expenditure budget for Army (US$ Million), 2016–2020 ........................... 32
Table 17: Czech Republic’s Defense Expenditure budget for Army (CZK Bn), 2011–2015 ................................ 33
Table 18: Czech Republic’s Defense Expenditure budget for Army (CZK Bn), 2016–2020 ................................ 34
Table 19: Czech Air Force Spending Allocation (US$ Billion), 2011–2015 .......................................................... 35
Table 20: Czech Air Force Spending Allocation (US$ Million), 2016–2020 ......................................................... 36
Table 21: Czech Air Force Spending Allocation (CZK Billion), 2011–2015 .......................................................... 37
Table 22: Czech Air Force Spending Allocation (CZK Billion), 2016–2020 .......................................................... 38
Table 23: Czech Republic’s Defense Budget Allocation for Central Support and Administration (US$ billion),
2011–2015 ............................................................................................................................................................ 39
Table 24: Czech Republic’s Defense Budget Allocation for Central Support and Administration (US$ Billion),
2016–2020 ............................................................................................................................................................ 40
Table 25: Czech Republic’s Defense Budget Allocation for Central Support and Administration (CZK billion),
2011–2015 ............................................................................................................................................................ 41
Table 26: Czech Republic’s Defense Budget Allocation for Central Support and Administration (CZK Billion),
2016–2020 ............................................................................................................................................................ 42
Table 27: Czech Republic per capita defense expenditure (US$), 2011–2015.................................................... 43
Table 28: Czech Republic per capita defense expenditure (US$), 2016–2020.................................................... 44
Table 29: Czech Homeland Security Budget (US$ Billion), 2011–2015 ............................................................... 45
Table 30: Czech Homeland Security Budget (US$ Billion), 2016–2020 ............................................................... 46

Future of the Czech Defense Industry – Market Attractiveness, Competitive Landscape and Forecasts to 2020
19
Table 31: Czech Homeland Security Budget (CZK Billion), 2011–2015 .............................................................. 47
Table 32: Czech Homeland Security Budget (CZK Billion), 2016–2020 .............................................................. 48
Table 33: Strategic Defence Intelligence Terrorism Index .................................................................................... 52
Table 34: Offset Regulations in the Czech Republic ............................................................................................ 70
Table 35: Aero Vodochody A.S. – Product Focus ................................................................................................ 75
Table 36: Aero Vodochody A.S.: Alliances ........................................................................................................... 77
Table 37: Aero Vodochody A.S.: Recent Contract Wins ...................................................................................... 78
Table 38: Lom Praha s.p. – Product Focus .......................................................................................................... 79
Table 39: Lom Praha s.p.: Alliances ..................................................................................................................... 80
Table 40: Lom Praha s.p.: Recent Contract Wins ................................................................................................ 80
Table 41: VOP 025 Nový Jičín, s.p.– Product Focus ............................................................................................ 81
Table 42: VOP 025 Nový Jičín, s.p. : Recent Contract Wins ................................................................................ 82
Table 43: Omnipol a.s. – Product Focus ............................................................................................................... 82
Table 44: Omnipol a.s.: Alliances ......................................................................................................................... 84
Table 45: Omnipol a.s.: Recent Contract Wins ..................................................................................................... 84
Table 46: Auro s.r.o. – Product Focus .................................................................................................................. 85
Table 47: Auro s.r.o.: Recent Contract Wins ........................................................................................................ 86
Table 48: Dicom, spol. s.r.o. – Product Focus ...................................................................................................... 86
Table 49: Dicom, spol. s.r.o.: Recent Contract Wins ............................................................................................ 87
Table 50: Quittner & Schimek s.r.o. – Product Focus ........................................................................................... 88
Table 51: Quittner & Schimek s.r.o.: Recent Contract Wins ................................................................................. 89
Table 52: Česká zbrojovka a.s. – Product Focus ................................................................................................. 90
Table 53: Česká zbrojovka a.s.: Recent Contract Wins ....................................................................................... 92
Table 54: Tesla, akciova spolecnost – Product Focus ......................................................................................... 92
Table 55: Tatra a.s. – Product Focus .................................................................................................................... 94
Table 56: Tatra a.s.: Alliances .............................................................................................................................. 96
Table 57: Tatra a.s.: Recent Contract Wins .......................................................................................................... 96
Table 58: Letov Letecká Výroba s.r.o. – Product Focus ....................................................................................... 97
Table 59: Letov Letecká Výroba s.r.o.: Alliances .................................................................................................. 98