Attractiveness, Competitive Landscape and Forecasts to 2020 · Future of the Italian Defense...
17
Report Price: US$ 1250 (Single User) Future of the Italian Defense Industry – Market Attractiveness, Competitive Landscape and Forecasts to 2020
Transcript of Attractiveness, Competitive Landscape and Forecasts to 2020 · Future of the Italian Defense...

Report Price: US$ 1250 (Single User)
Future of the Italian Defense Industry – Market
Attractiveness, Competitive Landscape and
Forecasts to 2020

Future of the Italian Defense Industry – Market Attractiveness, Competitive Landscape and Forecasts to 2020
2
Summary
“Future of the Italian Defense Industry – Market Attractiveness, Competitive Landscape and Forecasts to
2020” report offers the reader detailed analysis of the defense budget over the next five years. Alongside it
offers insights into the market opportunities and entry strategies adopted by foreign OEMs (original
equipment manufacturers) to gain a market share in the Italian defense industry.
The report provides detailed analysis of the current industry size and growth expectations during 2016-2020,
including highlights of the key growth stimulators. It also benchmarks the industry against key global markets
and provides detailed understanding of emerging opportunities in specific areas.
Key Findings
Italy which is one of the largest defense spenders in Europe and twelfth largest spender in the world is projected to spend US$XX billion on its armed forces during the forecast period. In 2015, the Italian government allocated US$XX billion for the defense budget which recorded a CAGR of XX% between 2011 and 2015. Italian defense expenditure is primarily driven by increasing terrorist threats, participation in peacekeeping initiatives, replacing the ageing military equipment and the modernization of defense forces with advanced technology equipment. Capital expenditure will also see a marginal increase, which is anticipated to grow at XX% due to the country’s heavy procurement pattern during the forecast period. The Italian defense industry is expected to focus on the modernization of the armed forces by implementing various procurement programs, including the F-35 Joint Strike Fighter project. Typhoon multirole combat aircraft, FREMM frigates, NH 90 helicopters, and Medium Extended Air Defense System (MEADS) program
Key Features and Benefits
The report provides detailed analysis of the Italian defense industry during 2011–2020, including the factors
that influence the military expenditure. It provides detailed expectations of growth rates and projected total
expenditure.
It provides the manufacturers with insights on market opportunities along with industry structure and
dynamics prevalent in the country. In addition, the report focuses on the regulations governing the Italian
defense industry and the potential market entry strategies with an expert analysis of the competitive
structure.

Future of the Italian Defense Industry – Market Attractiveness, Competitive Landscape and Forecasts to 2020
3
1. Market Attractiveness and Emerging Opportunities
1.1. Defense Market Size Historical and Forecast
1.1.1. The Italian defense budget is expected to grow at an estimated CAGR of XX% during the forecast
period, to reach US$XX billion in 2020
Italy’s defense expenditure stood at US$XX billion in 2011 and decreased to US$XX billion in 2015,
recording a negative CAGR of XX%. This is primarily due to consistent defense expenditure cuts by the
government, with the aim of reducing the country’s overall expenditure. This trend is expected to change
over the forecast period owing to procurements, marginally increasing at a CAGR of XX% and, cumulatively
value US$XX billion. Growth is anticipated to be driven by modernization initiatives and procurement
programs adopted by the government.
The following table and figure show the Italian defense expenditure during the review period:
Table 1: Italian Defense Expenditure, 2011-2015
Year Defense expenditure (US$ bn)
Defense growth percentage
2011
2012
2013
2014
2015
CAGR 2011-2015
Source: Ministry of Defense and SDI analysis © SDI
Figure 1: Italian Defense Expenditure, 2011-2015
Source: Ministry of Defense and SDI analysis © SDI
-5%
0%
5%
10%
15%
20%
25%
30%
0
10
20
30
40
50
60
70
80
90
100
2011 2012 2013 2014 2015
Gro
wth
rate
(%)
Def
ense
exp
end
itu
re (U
S$
Bill
ion
)
Defense expenditure (US$ bn) Defense growth percentage
Future of the Italian Defense Industry – Market Attractiveness, Competitive Landscape and Forecasts to 2020
4
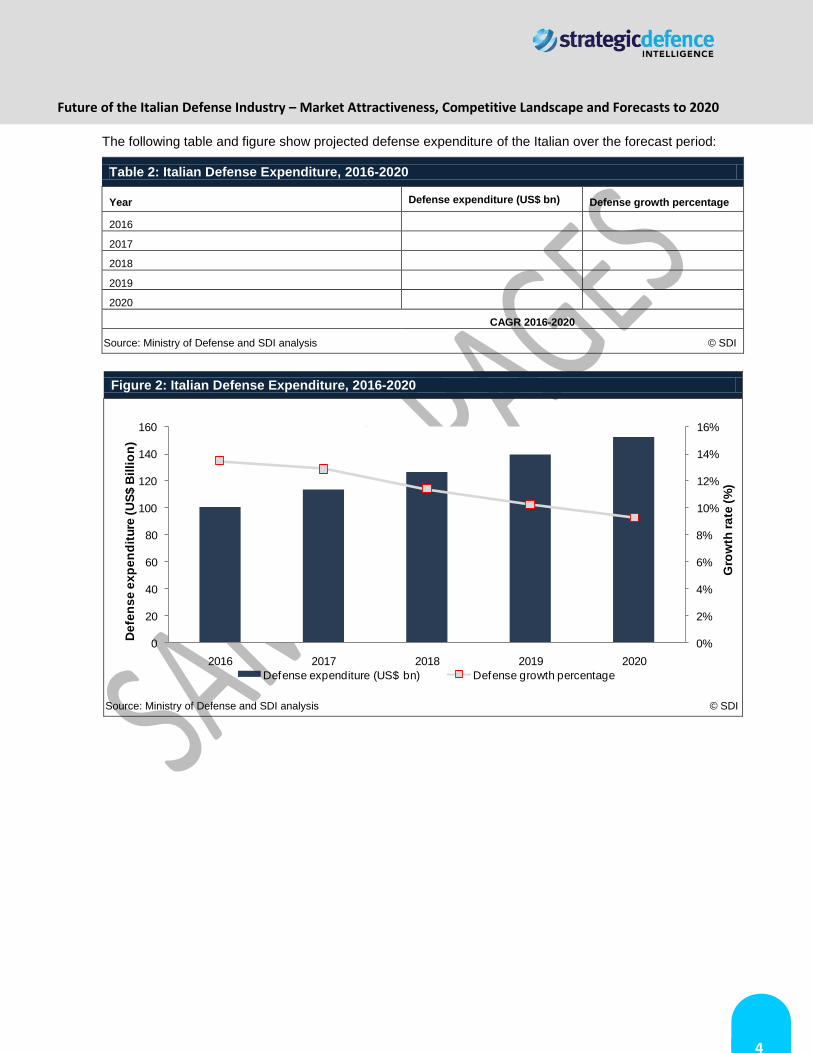
The following table and figure show projected defense expenditure of the Italian over the forecast period:
Table 2: Italian Defense Expenditure, 2016-2020
Year Defense expenditure (US$ bn)
Defense growth percentage
2016
2017
2018
2019
2020
CAGR 2016-2020
Source: Ministry of Defense and SDI analysis © SDI
Figure 2: Italian Defense Expenditure, 2016-2020
Source: Ministry of Defense and SDI analysis © SDI
0%
2%
4%
6%
8%
10%
12%
14%
16%
0
20
40
60
80
100
120
140
160
2016 2017 2018 2019 2020
Gro
wth
ra
te (
%)
De
fen
se
ex
pe
nd
itu
re (
US
$ B
illi
on
)
Defense expenditure (US$ bn) Defense growth percentage

Future of the Italian Defense Industry – Market Attractiveness, Competitive Landscape and Forecasts to 2020
5
1.2. Analysis of Defense Budget Allocation
1.2.1. Capital expenditure allocation in the overall defense budget set to increase over the forecast period
The Italian MoD allocated an average of XX% of the total defense budget towards capital expenditure during
the review period, which is expected to increase over the forecast period to be XX%. This is predominantly
due to Italy’s planned armed force modernization program and procurement plans along with the increasing
nuclear threat from North Korea as outlined in the recently published defense white paper. The country’s
revenue expenditure, which can be attributed to the additional recruitment, training, and development
programs for military personnel, is expected to decline from an average of XX% between 2010 and 2014 to
XX% during the forecast period.
The following table and chart display Italy’s defense budget share of capital, revenue and other expenditure
during the review period:
Table 3: Italian Defense Budget Split Between Capital and Revenue Expenditure (%), 2011–2015
Year Capital Expenditure Share Revenue Expenditure Share
2011
2012
2013
2014
2015
Source: Ministry of Finance, Italy and SDI analysis © SDI
Figure 3: Italian Defense Budget Split Between Capital and Revenue Expenditure (%), 2011-2015
Source: Ministry of Defense and SDI analysis © SDI
0%
10%
20%
30%
40%
50%
60%
70%
80%
90%
100%
2011 2012 2013 2014 2015
Defe
nse B
ud
get
Sp
lit
(%)
Capital Expenditure Share Revenue Expenditure Share

Future of the Italian Defense Industry – Market Attractiveness, Competitive Landscape and Forecasts to 2020
6
The following table and chart display Italy’s defense budget share of capital, revenue and other expenditure
over the forecast period:
Table 4: Italian Defense Budget Split Between Capital and Revenue Expenditure (%), 2016–2020
Year Capital Expenditure Share Revenue Expenditure Share
2016
2017
2018
2019
2020
Source: Ministry of Finance, Italy and SDI analysis © SDI
Figure 4: Italian Defense Budget Split Between Capital, Revenue and Other Expenditure (%), 2016-
2020
Source: Ministry of Defense and SDI analysis © SDI
0%
10%
20%
30%
40%
50%
60%
70%
80%
90%
100%
2016 2017 2018 2019 2020
Defe
nse B
ud
get
Sp
lit
(%)
Capital Expenditure Share Revenue Expenditure Share

Future of the Italian Defense Industry – Market Attractiveness, Competitive Landscape and Forecasts to 2020
7
2. Industry Dynamics - Porter’s Five Forces Analysis
Figure 4: Industry Dynamics – Porter’s Five Forces Analysis
Source: SDI analysis © SDI
Intensity of Rivalry Bargaining Power of Supplier
Bargaining Power of Buyer
Barrier to Entry
Threat of Substitute

Future of the Italian Defense Industry – Market Attractiveness, Competitive Landscape and Forecasts to 2020
8
Report Methodology
SDI’s dedicated research and analysis teams consist of experienced professionals with a background in
industry research and consulting in the defense sector. The following research methodology is followed for all
databases and reports:
Secondary Research
The research process begins with exhaustive secondary research to source reliable qualitative and
quantitative information related to the defense market. The secondary research sources that are typically
referred to include, but are not limited to:
Industry associations
National government documents and statistical databases
Company websites, annual reports, financial reports, broker reports, investor presentations
Industry trade journals and other literature
Internal and external proprietary databases
News articles, press releases, and webcasts specific to the companies operating in the market
Primary Research
SDI conducts hundreds of primary interviews a year with industry participants and commentators in order to
validate its data and analysis. A typical research interview fulfills the following functions:
Provides first-hand information on market size, market trends, growth trends, competitive landscape,
and future outlook
Helps to validate and strengthen secondary research findings
Further develops the analysis team’s expertise and market understanding
Primary research involves e-mail interactions, telephone interviews, and face-to-face interviews for
each market category, division, and sub-division across geographies
The participants who typically take part in such a process include, but are not limited to:
Industry participants: CEOs, VPs, business development managers, market intelligence managers,
and national sales managers
External experts: investment bankers, valuation experts, research analysts, and key opinion leaders
specializing in defense markets
Conventions
Currency conversions are performed on the basis of average annual conversion rate format
calculations
All the values in tables, with the exception of compounded annual growth rate (CAGR) and
compounded annual rate of change (CARC), are displayed to one decimal place; therefore, due to
this rounding method, growth rates may appear inconsistent with absolute values
The forecasted values are projected on the basis of nominal values; the inflation was not taken into account

Future of the Italian Defense Industry – Market Attractiveness, Competitive Landscape and Forecasts to 2020
9
TABLE OF CONTENTS
1. Introduction ......................................................................................................................... 11
1.1 What is this Report About? ..........................................................................................................11
1.2 Definitions .....................................................................................................................................11
1.3 Summary Methodology .................................................................................................................13
1.4 SDI Terrorism Index ......................................................................................................................14
1.5 About Strategic Defence Intelligence ..........................................................................................14
2. Executive Summary ............................................................................................................ 15
3. Market Attractiveness and Emerging Opportunities ........................................................ 17
3.1. Defense Market Size Historical and Forecast..............................................................................18
3.1.1. Italian annual defense expenditure valued US$XX billion in 2015 ........................................................... 18
3.1.2. Modernization of defense systems, participation in peacekeeping initiatives, and maintaining NATO,
EU, and UN stipulations expected to drive Italian defense expenditure .......................................................... 22
3.1.3. Defense expenditure as a percentage of GDP is expected to average XX% during the forecast period 23
3.2. Analysis of Defense Budget Allocation .......................................................................................27
3.2.1. The majority of Italy’s defense budget is allocated for revenue expenditure ........................................... 27
3.2.2. Overall capital expenditure is expected to grow at a CAGR of XX% during the forecast period ............. 29
3.2.3. Common services leads the defense function budget allocation list, with XX% share during 2011 to
2015 ................................................................................................................................................................. 33
3.2.4. Army expenditure expected to reach US$XX billion by 2020 ................................................................... 35
3.2.5. Air force expenditure expected to remain the same during forecast period ............................................. 39
3.2.6. Cumulative navy expenditure expected to be USXX billion cumulatively during the forecast period ...... 43
3.2.7. Common services expenditure is expected to beUS$XX billion cumulatively over the forecast period... 47
3.3. Homeland Security Market Size and Forecast ............................................................................49
3.3.1. Homeland security expenditure expected to decline from US$XX billion to US$XX billion during the
forecast period ...................................................................................................................................................... 49
3.3.2. Homeland security expenditure in Italy is mainly driven by activities such as terrorism in the country,
mafia wars, and rising anarchist groups ............................................................................................................... 53
3.3.3. SDI Terrorism Index rates Italy as a “some risk” region ........................................................................... 54
3.3.4. Italy has a score of 0.1 on the SDI Research Intelligence Terrorism Index ............................................. 55
3.4. Benchmarking with Key Global Markets .....................................................................................56
3.4.1. Italian defense expenditure expected to increase marginally over the forecast period ........................... 56
3.4.2. Italy has the twelfth largest defense budget in the world .......................................................................... 58
3.4.3. Italy expected to spend an average of XX% of its GDP on defense over the forecast period ................. 59
3.4.4. Italy faces “some risk” by acts of terrorism ............................................................................................... 60
3.5. Market Opportunities: Key Trends and Drivers ..........................................................................62

Future of the Italian Defense Industry – Market Attractiveness, Competitive Landscape and Forecasts to 2020
10
3.5.1. Frigates ..................................................................................................................................................... 62
3.5.2. Fighters and Multi-role aircraft .................................................................................................................. 63
3.5.3. C4ISR Airborne ......................................................................................................................................... 64
3.5.4. Transport and Utility Helicopter ................................................................................................................ 65
3.5.5. Counter Terrorism ..................................................................................................................................... 66
4. Defense Procurement Market Dynamics ........................................................................... 67
4.1. Import Market Dynamics ...............................................................................................................68
4.1.1. Arms imports expected to revive during the forecast period .................................................................... 68
4.1.2. European countries such as Germany and the UK have entered in import market in competition with
the US 69
4.1.3. Aircraft, sensors, and missiles were the key defense imports during 2009-2013 .................................... 70
4.2. Export Market Dynamics ..............................................................................................................71
4.2.1. Development of domestic defense capability is expected to fuel exports in Italy’s emerging military
industry .................................................................................................................................................................. 71
4.2.2. Asia to account for a major portion of Italian defense exports ................................................................. 72
4.2.3. Aircraft was the main exported defense product during 2009-2013 ......................................................... 73
5. Industry Dynamics .............................................................................................................. 74
5.1. Five Forces Analysis.....................................................................................................................74
5.1.1. Bargaining power of supplier: medium ..................................................................................................... 75
5.1.2. Bargaining power of buyer: medium ......................................................................................................... 76
5.1.3. Barrier to entry: low ................................................................................................................................... 76
5.1.4. Intensity of rivalry: low .............................................................................................................................. 76
5.1.5. Threat of substitution: low ......................................................................................................................... 76
6. Market Entry Strategy ......................................................................................................... 77
6.1. Market Regulation .........................................................................................................................77
6.1.1. The Italian defense industry is largely driven by government regulation and policy ................................ 77
6.1.2. Restrictive defense policies to prevent increase in foreign investment .................................................... 77
6.2. Market Entry Route .......................................................................................................................78
6.2.1. Technology transfer provides good market entry opportunities ............................................................... 78
6.2.2. Research and development collaborations offer market access .............................................................. 78
6.2.3. Joint ventures, partnerships, and licensing agreements are key market entry strategies in Italy ............ 79
6.3. Key Challenges .............................................................................................................................80
6.3.1. Defense budget cuts across Europe challenge domestic defense companies ........................................ 80
6.3.2. Restrictive foreign policy poses a challenge for non-European companies to enter the Italian defense
industry .................................................................................................................................................................. 80
7. Competitive Landscape and Strategic Insights ................................................................ 81
7.1. Competitive Landscape Overview ...............................................................................................81

Future of the Italian Defense Industry – Market Attractiveness, Competitive Landscape and Forecasts to 2020
11
7.2. Key Domestic Companies ............................................................................................................81
7.2.1. Finmeccanica: overview ........................................................................................................................... 81
7.2.2. Finmeccanica: products and services ...................................................................................................... 81
7.2.3. Finmeccanica: recent announcements and strategic initiatives ............................................................... 82
7.2.4. Finmeccanica: alliances............................................................................................................................ 83
7.2.5. Finmeccanica: recent contract wins ......................................................................................................... 84
7.2.6. Finmeccanica: financial analysis .............................................................................................................. 85
7.2.7. Selex ES: overview ................................................................................................................................... 87
7.2.8. Selex ES: products and services .............................................................................................................. 87
7.2.9. Selex ES: recent announcements and strategic initiatives ....................................................................... 90
7.2.10. Selex ES: alliances ................................................................................................................................... 91
7.2.11. Selex ES: recent contract wins ................................................................................................................. 92
7.2.12. Oto Melara: overview ................................................................................................................................ 93
7.2.13. Oto Melara: products and services ........................................................................................................... 93
7.2.14. Oto Melara: recent announcements and strategic initiatives .................................................................... 94
7.2.15. Oto Melara: alliances ................................................................................................................................ 94
7.2.16. Oto Melara: recent contract wins .............................................................................................................. 95
7.2.17. Fincantieri: overview ................................................................................................................................. 96
7.2.18. Fincantieri: defense products ................................................................................................................... 96
7.2.19. Fincantieri: recent announcements and strategic initiatives ..................................................................... 97
7.2.20. Fincantieri: alliances ................................................................................................................................. 98
7.2.21. Fincantieri: recent contract wins ............................................................................................................... 98
7.2.22. Fincantieri: financial analysis .................................................................................................................... 99
7.2.23. MBDA: overview ..................................................................................................................................... 101
7.2.24. MBDA: defense products ........................................................................................................................ 101
7.2.25. MBDA: recent announcements and strategic initiatives ......................................................................... 103
7.2.26. MBDA: alliances ..................................................................................................................................... 104
7.2.27. MBDA: recent contract wins ................................................................................................................... 105
7.2.28. WASS: overview ..................................................................................................................................... 106
7.2.29. WASS: products and services ................................................................................................................ 106
7.2.30. WASS: alliances ..................................................................................................................................... 107
7.2.31. WASS: recent contract wins ................................................................................................................... 107
7.3. Key Private Companies .............................................................................................................. 108
7.3.1. Elettronica: overview ............................................................................................................................... 108
7.3.2. Elettronica: products and services .......................................................................................................... 108
7.3.3. Elettronica: recent announcements and strategic initiatives .................................................................. 109
7.3.4. Elettronica: alliances ............................................................................................................................... 109
7.3.5. Elettronica: recent contract wins ............................................................................................................. 110

Future of the Italian Defense Industry – Market Attractiveness, Competitive Landscape and Forecasts to 2020
12
8. Business Environment and Country Risk ....................................................................... 111
8.1. Demographics & Social Statistics .............................................................................................. 111
8.1.1. Population – Rural .................................................................................................................................. 111
8.1.2. Population - Urban .................................................................................................................................. 112
8.1.3. Population – Number of Households ...................................................................................................... 113
8.2. Economic Performance .............................................................................................................. 114
8.2.1. Gross Domestic per Capita..................................................................................................................... 114
8.2.2. Gross Domestic Product, current US$ ................................................................................................... 115
8.2.3. Exports of Goods and Services .............................................................................................................. 116
8.2.4. Imports of Goods and Services .............................................................................................................. 117
8.2.5. Gross National Disposable Income ........................................................................................................ 118
8.2.6. Manufacturing Output ............................................................................................................................. 119
8.2.7. Consumer Price Index ............................................................................................................................ 120
8.2.8. Wholesale Price Index ............................................................................................................................ 121
8.2.9. Local Currency Unit per USD ................................................................................................................. 122
8.2.10. Market Capitalization of Listed Companies ............................................................................................ 123
8.2.11. Market Capitalization of Listed Companies (% of GDP) ......................................................................... 124
8.2.12. Total Government Cash Surplus/Deficit (LCU bn) ................................................................................. 125
8.2.13. Goods Exports as a % of GDP ............................................................................................................... 126
8.2.14. Goods Imports as a % of GDP ............................................................................................................... 127
8.2.15. Goods balance as a % of GDP ............................................................................................................... 128
8.2.16. Services Imports as a % of GDP ............................................................................................................ 129
8.2.17. Services Exports as a % of GDP ............................................................................................................ 130
8.2.18. Services balance (% of GDP) ................................................................................................................. 131
8.2.19. Net Foreign Direct Investment (BoP, current US$ bn) ........................................................................... 132
8.2.20. Net FDI as a % of GDP ........................................................................................................................... 133
8.2.21. International reserves, including Gold (US$ bn) ..................................................................................... 134
8.3. Energy and Utilities ..................................................................................................................... 135
8.3.1. Total Conventional Thermal Electricity Net Generation (Bn kWh) ......................................................... 135
8.3.2. Hydroelectricity Net Generation (Billion kWh) ........................................................................................ 136
8.3.3. Nuclear Electricity Net Generation(Billion kWh) ..................................................................................... 137
8.3.4. Total Conventional Thermal Electricity Installed Capacity(Million kW) .................................................. 138
8.3.5. Proved reserves of Natural Gas(Trillion Cubic Feet) .............................................................................. 139
8.3.6. Total Petroleum Consumption (Thousand Barrels Per Day) .................................................................. 140
8.4. Infrastructure Quality and Availability ....................................................................................... 141
8.4.1. Rail lines (total route km) ........................................................................................................................ 141
8.4.2. Air transport, freight (Million ton-km) ...................................................................................................... 142

Future of the Italian Defense Industry – Market Attractiveness, Competitive Landscape and Forecasts to 2020
13
8.4.3. Overall Construction (US$ million) ......................................................................................................... 143
8.5. Minerals ....................................................................................................................................... 144
8.5.1. Mining, Manufacturing, Utilities Output (US$ billion) .............................................................................. 144
8.6. Technology .................................................................................................................................. 145
8.6.1. Research and development expenditure (thousands LCU) ................................................................... 145
8.6.2. Patents Granted ...................................................................................................................................... 146
8.7. Telecommunication .................................................................................................................... 147
8.7.1. Telephone lines (in mn) .......................................................................................................................... 147
8.7.2. Telephone lines Penetration Rate (per 100 people) ............................................................................... 148
9. Appendix ............................................................................................................................ 149
9.1. About SDI ..................................................................................................................................... 149
9.2. Disclaimer .................................................................................................................................... 149
Future of the Italian Defense Industry – Market Attractiveness, Competitive Landscape and Forecasts to 2020
14
LIST OF FIGURES
Figure 1: Italian Defense Expenditure (US$ Billion), 2011–2015 ......................................................................................................................... 18 Figure 2: Italian Defense Expenditure (US$ Billion), 2016–2020 ......................................................................................................................... 19 Figure 3: Italian Defense Expenditure (EUR Billion), 2011–2015 ........................................................................................................................ 20 Figure 4: Italian Defense Expenditure (EUR Billion), 2016–2020 ........................................................................................................................ 21 Figure 5: Italian GDP Growth vs. Defense Expenditure Growth and Defense Expenditure as Percentage of GDP, 2011–2015 ......................... 23 Figure 6: Italian GDP Growth vs. Defense Expenditure Growth and Defense Expenditure as Percentage of GDP, 2016–2020 ......................... 24 Figure 7: Italian GDP Growth vs. Defense Expenditure Growth and Defense Expenditure as Percentage of GDP (in EUR), 2011–2015 ........... 25 Figure 8: Italian GDP Growth vs. Defense Expenditure Growth and Defense Expenditure as Percentage of GDP (in EU), 2016–2020 ............. 26 Figure 9:Italian Defense Budget Split Between Capital and Revenue Expenditure (%), 2011–2015.................................................................... 27 Figure 10: Italian Defense Budget Split Between Capital and Revenue Expenditure (%), 2016–2020 ................................................................. 28 Figure 11: Italian Capital Expenditure (US$ billion), 2011–2015 ......................................................................................................................... 29 Figure 12:Italian Capital Expenditure (US$ billion), 2016–2020 .......................................................................................................................... 30 Figure 13: Italian Capital Expenditure (EUR billion), 2011–2015 ......................................................................................................................... 31 Figure 14: Italian Capital Expenditure (EUR billion), 2016–2020 ......................................................................................................................... 32 Figure 15: Italian Defense Expenditure Allocation (US$ billion), 2011–2015 ....................................................................................................... 33 Figure 16: Italian Defense Expenditure Allocation (US$ billion), 2016–2020 ....................................................................................................... 34 Figure 17: Italian Army Expenditure (US$ Billion), 2011–2015 ............................................................................................................................ 35 Figure 18: Italian Army Expenditure (US$ Billion), 2016–2020 ............................................................................................................................ 36 Figure 19: Italian Army Expenditure (EUR Billion), 2011–2015 ........................................................................................................................... 37 Figure 20: Italian Army Expenditure (EUR Billion), 2016–2020 ........................................................................................................................... 38 Figure 21: Italian Air force Expenditure (US$ Billion), 2011–2015 ....................................................................................................................... 39 Figure 22: Italian Air Force Expenditure (US$ Billion), 2016–2020 ...................................................................................................................... 40 Figure 23: Italian Air force Expenditure (EUR Billion), 2011–2015 ...................................................................................................................... 41 Figure 24: Italian Air Force Expenditure (EUR Billion), 2016–2020 ..................................................................................................................... 42 Figure 25: Italian Navy Expenditure (US$ Billion), 2011–2015 ............................................................................................................................ 43 Figure 26: Italian Navy Expenditure (US$ Billion), 2016–2020 ............................................................................................................................ 44 Figure 27: Italian Navy Expenditure (EUR Billion), 2011–2015 ........................................................................................................................... 45 Figure 28: Italian Navy Expenditure (EUR Billion), 2016–2020 ........................................................................................................................... 46 Figure 29: Italian Common Services Expenditure (US$ Billion), 2011–2015 ....................................................................................................... 47 Figure 30: Italian Common Services Expenditure (US$ Billion), 2016–2020 ....................................................................................................... 48 Figure 31: Italian Homeland Security Budget (US$ billion), 2011–2015 .............................................................................................................. 49 Figure 32: Italian Homeland Security Budget (US$ billion), 2016–2020 .............................................................................................................. 50 Figure 33: Italian Homeland Security Budget (EUR billion), 2011–2015 .............................................................................................................. 51 Figure 34: Italian Homeland Security Budget (EUR billion), 2016–2020 .............................................................................................................. 52 Figure 35: SDI Terrorism Heat Map, 2015 .......................................................................................................................................................... 54 Figure 36: SDI Terrorism Index, 2015 ................................................................................................................................................................. 55 Figure 37: Benchmarking with Key Markets – 2011–2015 vs. 2016–2020 .......................................................................................................... 57 Figure 38: Defense Expenditure of the World’s Largest Military Spenders (US$ Billion), 2015 and 2020 ............................................................ 58 Figure 39: Defense Expenditure as a Percentage of GDP of Largest Military Spenders (%), 2015 ..................................................................... 59 Figure 40: Frigates Market (US$ Million), 2015–2025 ......................................................................................................................................... 62 Figure 41: Fighters & Multi-Role Aircraft (US$ Million), 2015–2025..................................................................................................................... 63 Figure 42:C4ISR Airborne (US$ Million), 2015–2025 .......................................................................................................................................... 64 Figure 43: Transport and Utility Aircraft (US$ Million), 2015–2025 ...................................................................................................................... 65 Figure 44: Counter Terrorism (US$ Million), 2015–2025 ..................................................................................................................................... 66 Figure 45: Italian Defense Import Trend, 2009–2013 (TIV values) ...................................................................................................................... 68 Figure 46: Italian Defense Imports by Country (%), 2009–2013 .......................................................................................................................... 69 Figure 47: Italian Defense Imports by Category (%), 2009–2013 ........................................................................................................................ 70 Figure 48: Italian Defense Exports By Value (US$ million), 2009–2013 .............................................................................................................. 71 Figure 49: Italian Defense Exports by Country (%), 2009–2013 .......................................................................................................................... 72 Figure 50: Italian Defense Exports by Category (%), 2009–2013 ........................................................................................................................ 73 Figure 51: Industry Dynamics – Porter’s Five Forces Analysis ............................................................................................................................ 75 Figure 52: Finmeccanica- Revenue Trend Analysis (EUR Million), 2009–2013 ................................................................................................... 85 Figure 53: Finmeccanica- Net Profit Trend Analysis (EUR Million), 2009–2013 .................................................................................................. 86 Figure 54: Finmeccanica- Operating Profit Trend Analysis (EUR Million), 2009–2013 ........................................................................................ 86 Figure 55: Fincantieri - Revenue Trend Analysis (Euro Million), 2008–2012 ....................................................................................................... 99

Future of the Italian Defense Industry – Market Attractiveness, Competitive Landscape and Forecasts to 2020
15
Figure 56: Fincantieri - Operating Profit Trend Analysis (Euro Million), 2008–2012 ............................................................................................100 Figure 57: Fincantieri - Net Profit Trend Analysis (Euro Million), 2008–2012 ......................................................................................................100 Figure 58: Italy Population – Rural (In Millions), 2016–2025 .............................................................................................................................111 Figure 59: Italy Population – Urban (In Millions), 2016–2025 .............................................................................................................................112 Figure 60: Italy Population – Number of Households (In Millions), 2008–2017 ...................................................................................................113 Figure 61: Italy GDP per capita, 2011–2020 ......................................................................................................................................................114 Figure 62: Italy Gross Domestic Product (current US$ Bn), 2011–2020 .............................................................................................................115 Figure 63: Italy Exports of goods and services (current US$ Bn), 2003–2012 ....................................................................................................116 Figure 64: Italy Imports of goods and services (current US$ Bn), 2003–2012 ....................................................................................................117 Figure 65: Italy Gross national disposable income (US$ Bn), 2003–2012 ..........................................................................................................118 Figure 66: Italy Manufacturing Output (US$ Bn), 2003–2012 .............................................................................................................................119 Figure 67: Italy Consumer Price Index, 2009–2018 ...........................................................................................................................................120 Figure 68: Italy Wholesale Price Index, 2003–2012 ...........................................................................................................................................121 Figure 69: Italy LCU per US$, 2009–2018 .........................................................................................................................................................122 Figure 70: Italy Market Capitalization of listed Companies (US$ Bn), 2003–2012 ..............................................................................................123 Figure 71: Italy Market Capitalization of listed companies as a % of GDP, 2002–2011 ......................................................................................124 Figure 72: Italy Government cash surplus/deficit (LCU Bn), 2001–2010 ............................................................................................................125 Figure 73: Italy Goods Exports as a % of GDP, 2004–2013 ...............................................................................................................................126 Figure 74: Italy Goods Imports as a % of GDP, 2004–2013 ...............................................................................................................................127 Figure 75: Italy Goods balance as a % of GDP, 2004–2013 ..............................................................................................................................128 Figure 76: Italy Services Imports as a % of GDP, 2004–2013 ............................................................................................................................129 Figure 77: Italy Services Exports as a % of GDP, 2004–2013............................................................................................................................130 Figure 78: Italy Services balance as a % of GDP, 2004–2013 ...........................................................................................................................131 Figure 79: Italy Net Foreign Direct Investment (current US$ bn), 2004–2013.....................................................................................................132 Figure 80: Italy Net FDI as a % of GDP, 2004–2013 ..........................................................................................................................................133 Figure 81: Italy International reserves, including Gold (US$ Bn), 2004–2013 .....................................................................................................134 Figure 82: Italy Total Conventional Thermal Electricity Net Generation (Billion Kilowatt Hours), 2003–2012 ......................................................135 Figure 83: Italy Hydroelectricity Net Generation (~Billion Kilowatt Hours), 2003–2012 .......................................................................................136 Figure 84: Italy Nuclear Electricity Net Generation (Billion Kilowatt Hours), 2003–2012 .....................................................................................137 Figure 85: Italy Total Conventional Thermal Electricity Installed Capacity (Million Kilowatts), 2003–2012 ..........................................................138 Figure 86: Italy Proved reserves of Natural Gas (Trillion Cubic feet), 2004–2013 ..............................................................................................139 Figure 87: Italy Total Petroleum Consumption (Thousand Barrels per Day), 2004–2013 ...................................................................................140 Figure 88: Italy Rail lines (Total route Km), 2003–2012 .....................................................................................................................................141 Figure 89: Italy Air transport, freight (Million ton-Km), 2003–2012 ......................................................................................................................142 Figure 90: Italy Overall Construction (US$ Bn), 2008–2017 ...............................................................................................................................143 Figure 91: Italy Mining, Manufacturing, Utilities Output(US$ Bn), 2004–2013 ....................................................................................................144 Figure 92: Italy Research and Development (thousands LCU), 2002–2011 .......................................................................................................145 Figure 93: Italy Patents Granted, 2004–2013 ....................................................................................................................................................146 Figure 94: Italy Telephone lines (in mn), 2003–2012 .........................................................................................................................................147 Figure 95: Italy Telephone lines Penetration Rate (per 100 people), 2003–2012 ...............................................................................................148

Future of the Italian Defense Industry – Market Attractiveness, Competitive Landscape and Forecasts to 2020
16
LIST OF TABLES
Table 1: Italian Defense Expenditure (US$ Billion), 2011–2015 .......................................................................................................................... 18 Table 2: Italian Defense Expenditure (US$ Billion), 2016–2020 .......................................................................................................................... 19 Table 3: Italian Defense Expenditure (EUR Billion), 2011–2015 ......................................................................................................................... 20 Table 4: Italian Defense Expenditure (EUR Billion), 2016–2020 ......................................................................................................................... 21 Table 5: Italian GDP Growth vs. Defense Expenditure Growth and Defense Expenditure as Percentage of GDP, 2011–2015 ........................... 23 Table 6: Italian GDP Growth vs. Defense Expenditure Growth and Defense Expenditure as Percentage of GDP, 2016–2020 ........................... 24 Table 7: Italian GDP Growth vs. Defense Expenditure Growth and Defense Expenditure as Percentage of GDP (in EUR), 2011–2015 ............. 25 Table 8: Italian GDP Growth vs. Defense Expenditure Growth and Defense Expenditure as Percentage of GDP (in EU), 2016–2020 ............... 26 Table 9: Italian Defense Budget Split Between Capital and Revenue Expenditure (%), 2011–2015 .................................................................... 27 Table 10: Italian Defense Budget Split Between Capital and Revenue Expenditure (%), 2016–2020 .................................................................. 28 Table 11: Italian Capital Expenditure (US$ billion), 2011–2015........................................................................................................................... 29 Table 12: Italian Capital Expenditure (US$ billion), 2016–2020........................................................................................................................... 30 Table 13: Italian Capital Expenditure (EUR billion), 2011–2015 .......................................................................................................................... 31 Table 14: Italian Capital Expenditure (EUR billion), 2016–2020 .......................................................................................................................... 32 Table 15: Italian Defense Expenditure Split (%), 2011–2015 .............................................................................................................................. 33 Table 16: Italian Defense Expenditure Split (%), 2016–2020 .............................................................................................................................. 34 Table 17: Italian Army Expenditure (US$ Billion), 2011–2015 ............................................................................................................................. 35 Table 18: Italian Army Expenditure (US$ Billion), 2016–2020 ............................................................................................................................. 36 Table 19: Italian Army Expenditure (EUR Billion), 2011–2015 ............................................................................................................................ 37 Table 20: Italian Army Expenditure (EUR Billion), 2016–2020 ............................................................................................................................ 38 Table 21: Italian Air Force Expenditure (US$ Billion), 2011–2015 ....................................................................................................................... 39 Table 22: Italian Air Force Expenditure (US$ Billion), 2016–2020 ....................................................................................................................... 40 Table 23: Italian Air Force Expenditure (EUR Billion), 2011–2015 ...................................................................................................................... 41 Table 24: Italian Air Force Expenditure (EUR Billion), 2016–2020 ...................................................................................................................... 42 Table 25: Italian Navy Expenditure (US$ Billion), 2011–2015 ............................................................................................................................. 43 Table 26: Italian Navy Expenditure (US$ Billion), 2016–2020 ............................................................................................................................. 44 Table 27: Italian Navy Expenditure (EUR Billion), 2011–2015............................................................................................................................. 45 Table 28: Italian Navy Expenditure (EUR Billion), 2016–2020............................................................................................................................. 46 Table 29: Italian Common Services Expenditure (US$ Billion), 2011–2015 ........................................................................................................ 47 Table 30: Italian Common Services Expenditure (US$ Billion), 2016–2020 ........................................................................................................ 48 Table 31: Italian Homeland Security Budget (US$ billion), 2011–2015 ............................................................................................................... 49 Table 32: Italian Homeland Security Budget (US$ billion), 2016–2020 ............................................................................................................... 50 Table 33: Italian Homeland Security Budget (EUR billion), 2011–2015 ............................................................................................................... 51 Table 34: Italian Homeland Security Budget (EUR billion), 2016–2020 ............................................................................................................... 52 Table 35: Benchmarking with Key Markets – 2011–2015 vs. 2016–2020............................................................................................................ 56 Table36: SDI Terrorism Index ............................................................................................................................................................................. 60 Table 37: Offset Regulations in Italy ................................................................................................................................................................... 77 Table 38: Italian Joint Development Programs for Missile Defense Systems ...................................................................................................... 78 Table 39: Finmeccanica – Product Focus ........................................................................................................................................................... 81 Table 40: Finmeccanica - Alliances .................................................................................................................................................................... 83 Table 41: Finmeccanica- Recent Contract Wins ................................................................................................................................................. 84 Table 42: Selex ES– Product Focus ................................................................................................................................................................... 87 Table 43: Selex ES - Alliances............................................................................................................................................................................ 91 Table 44: Selex ES - Recent Contract Wins ....................................................................................................................................................... 92 Table 45: Oto Melara – Product Focus ............................................................................................................................................................... 93 Table 46: Oto Melara - Alliances ......................................................................................................................................................................... 94 Table 47: Oto Melara - Recent Contract Wins..................................................................................................................................................... 95 Table 48: Fincantieri – Product Focus ................................................................................................................................................................ 96 Table 49: Fincantieri - Alliances .......................................................................................................................................................................... 98 Table 50: Fincantieri – Recent Contract Wins ..................................................................................................................................................... 98 Table 51: MBDA – Product Focus....................................................................................................................................................................101 Table 52: MBDA - Alliances ...............................................................................................................................................................................104 Table 53: MBDA - Recent Contract Wins ...........................................................................................................................................................105 Table 54: WASS – Product Focus ....................................................................................................................................................................106 Table 55: WASS - Alliances ...............................................................................................................................................................................107

Future of the Italian Defense Industry – Market Attractiveness, Competitive Landscape and Forecasts to 2020
17
Table 56: WASS - Recent Contract Wins ...........................................................................................................................................................107 Table 57: Elettronica – Product Focus ..............................................................................................................................................................108 Table 58: Elettronica - Alliances ........................................................................................................................................................................109 Table 59: Elettronica - Recent Contract Wins ....................................................................................................................................................110