
Future of Global Health Procurement - cgdev.org · Final summary presentation. April 2018 ....
27
Future of Global Health Procurement Final summary presentation April 2018 Prepared by the Clinton Health Access Initiative (CHAI)
Transcript of Future of Global Health Procurement - cgdev.org · Final summary presentation. April 2018 ....
Future of Global Health Procurement
Final summary presentationApril 2018
Prepared by the Clinton Health Access Initiative (CHAI)
Agenda
2
• Project Framework
• Highlights of current procurement landscape
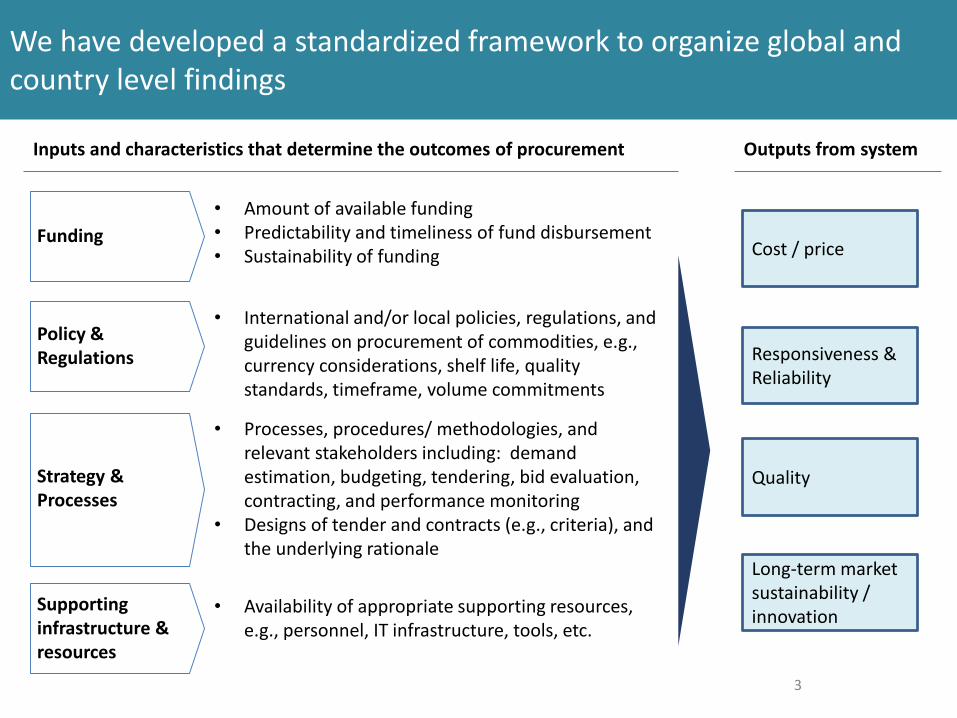
We have developed a standardized framework to organize global and country level findings
3
Inputs and characteristics that determine the outcomes of procurement
Funding
Policy & Regulations
Strategy & Processes
Supporting infrastructure & resources
Outputs from system
Cost / price
Responsiveness & Reliability
Quality
Long-term market sustainability / innovation
• Amount of available funding• Predictability and timeliness of fund disbursement• Sustainability of funding
• International and/or local policies, regulations, and guidelines on procurement of commodities, e.g., currency considerations, shelf life, quality standards, timeframe, volume commitments
• Processes, procedures/ methodologies, and relevant stakeholders including: demand estimation, budgeting, tendering, bid evaluation, contracting, and performance monitoring
• Designs of tender and contracts (e.g., criteria), and the underlying rationale
• Availability of appropriate supporting resources, e.g., personnel, IT infrastructure, tools, etc.

Agenda
5
• Project Framework
• Highlights of current procurement landscape
– Key observations from global procurers
– Key observations from visited countries

USAID/ PSM – Key observations
6
Funding
Policy & Regulations
Supporting infrastructure & resources
Strategy & Processes
• Annual funding/ appropriations cycle drives procurement cycle• Funding expected to be fairly stable across years – except reproductive health
Highlights
• Annual budget commitments impede multi-year volume commitments• Different quality policies for various therapeutic areas (e.g. FDA approval required for ARVs
but not FP products)• Shelf life requirements defined as percentages affected procurers’ flexibility & efficiency
• Emphasizes market-specific strategies, i.e., set up of product-specific commodity group councils to develop targeted plans
• Shared-risk arrangements; framework contracts; use of forward looking operational plans (e.g., malaria) to provide high level estimates for suppliers
• Exploring optimization of SKUs to allow for consolidation of orders• Emphasis on supply security – e.g. target ~3 suppliers per product in awards • Data quality and forecast accuracy issues create challenges• Starting to explore local procurement
• Developing / refining supporting systems in collaboration with IBM with a view to enhancing On Time In Full (OTIF) performance
• Standardization of information and data• Attempting to strengthen visibility into supply chain, i.e., PPMR for HIV/AIDs as a pilot
Sources: Interviews with GHSC-PSM/ IBM; GHSC-PSM/ HIV/AIDS; USAID/ Supply Chain for Health for HIV/AIDS
6
NON-EXHAUSTIVE
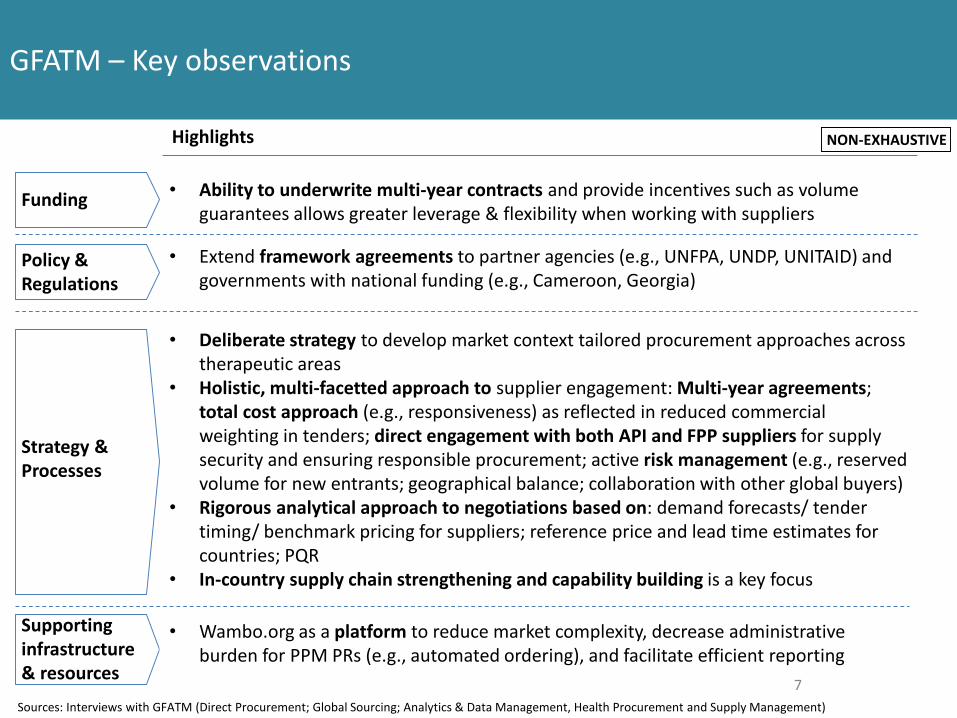
GFATM – Key observations
Funding
Policy & Regulations
Supporting infrastructure & resources
Strategy & Processes
• Ability to underwrite multi-year contracts and provide incentives such as volume guarantees allows greater leverage & flexibility when working with suppliers
Highlights
• Extend framework agreements to partner agencies (e.g., UNFPA, UNDP, UNITAID) and governments with national funding (e.g., Cameroon, Georgia)
• Deliberate strategy to develop market context tailored procurement approaches across therapeutic areas
• Holistic, multi-facetted approach to supplier engagement: Multi-year agreements; total cost approach (e.g., responsiveness) as reflected in reduced commercial weighting in tenders; direct engagement with both API and FPP suppliers for supply security and ensuring responsible procurement; active risk management (e.g., reserved volume for new entrants; geographical balance; collaboration with other global buyers)
• Rigorous analytical approach to negotiations based on: demand forecasts/ tender timing/ benchmark pricing for suppliers; reference price and lead time estimates for countries; PQR
• In-country supply chain strengthening and capability building is a key focus
• Wambo.org as a platform to reduce market complexity, decrease administrative burden for PPM PRs (e.g., automated ordering), and facilitate efficient reporting
Sources: Interviews with GFATM (Direct Procurement; Global Sourcing; Analytics & Data Management, Health Procurement and Supply Management)
7
NON-EXHAUSTIVE

UNFPA – Key observations
Funding
Policy & Regulations
Supporting infrastructure & resources
Strategy & Processes
• Lack of visibility into long-term funding• Funding received in annual tranches (which are sometimes topped up within the
year) which limits flexibility with procurement; newly created bridge financing mechanism could help
Highlights
• Orders will only be placed with “cash in the bank”; this extends to third party procurement mechanism where countries have to pay upfront
• Use of multi-year contracts but with no committed volumes; ensure supply security by diversifying FPP and API sources
• Collaboration with other partners:– Conducts procurement of condoms for Global Fund (pilot in 2017) and help
generate savings through its greater scale and assure quality– Standardization of data collection with USAID and other UN Agencies
• Leverage its scale to encourage manufacturers to adopt green manufacturing practices, e.g., ISO 14000
• Categorization of countries to facilitate preparation for future transition, e.g., For “category c” countries, 75% of funding is targeted for technical support with 25% for commodity procurement vs. 75% for commodity for other countries
• Third party procurement services to countries for a 5% administrative fee• Manual systems: implementing partners reporting back to UNFPA country offices
currently use excel spreadsheets; Warehouse manager has to report manually on different excel sheets
Sources: Interviews with UNFPA (CSB & PSB)
8
NON-EXHAUSTIVE

PAHO – Key observations
Funding
Policy & Regulations
Supporting infrastructure & resources
Strategy & Processes
• Majority of funds used to procure comes from governments directly, very limited donor funding; use of the fund has grown significantly as countries transition out of donor funds (3X from 2011 to 2016)
Highlights
• Orders will only be placed with “cash in the bank”; hence capital account is very beneficial to countries
• Use of multi-year contracts, but with no committed volumes, for key products deemed as important for public health or requested by many countries
• Lack of demand visibility makes it difficult for some negotiations, however suppliers still provide more favorable terms than to countries because PAHO is a reliable payer
• Strategic fund is positioned as a tool to improve access for countries as opposed to procurement-focused; no obligation from countries to procure
• Countries vary in engagement with the fund; some use the fund to benchmark prices to local suppliers or for budgetary purposes, others use to procure products they have limited access to
• Capital account provides interest free loans (60 days from purchase order) for countries to place orders through Strategic Fund; funded through 3%+1.5% admin fee on all purchase orders
Sources: Interviews with PAHO (Procurement Strategic Fund; Revolving Fund)
9
NON-EXHAUSTIVE

Agenda
10
• Project Framework
• Highlights of current procurement landscape
– Key observations from global procurers
– Key observations from visited countries
Uganda – Country overview
11
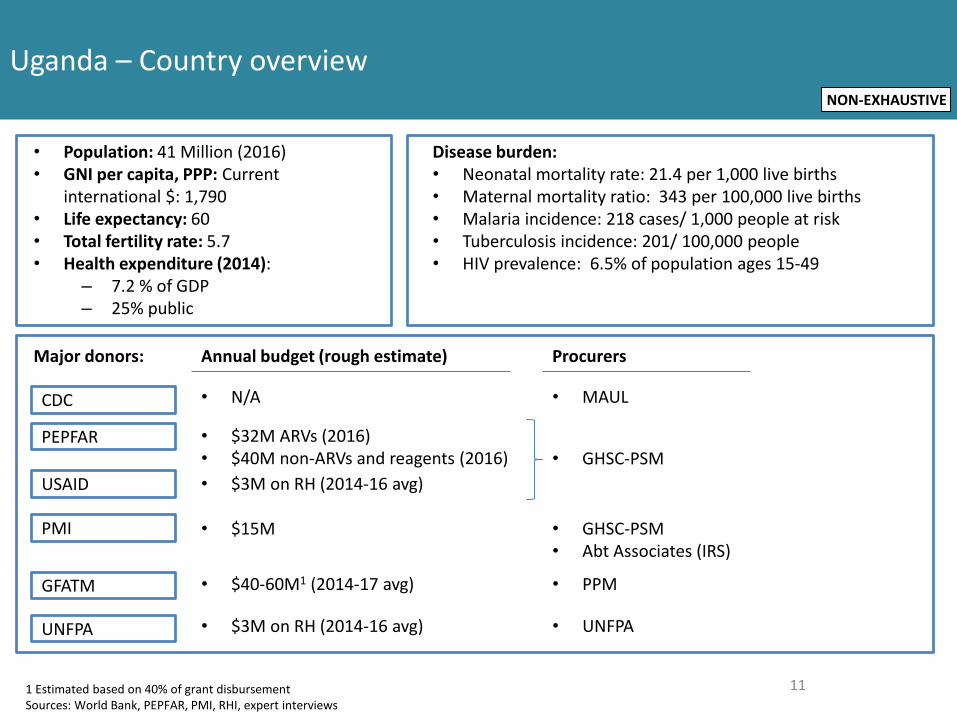
• Population: 41 Million (2016)• GNI per capita, PPP: Current
international $: 1,790• Life expectancy: 60• Total fertility rate: 5.7• Health expenditure (2014):
– 7.2 % of GDP– 25% public
1 Estimated based on 40% of grant disbursementSources: World Bank, PEPFAR, PMI, RHI, expert interviews
Major donors:
Disease burden:• Neonatal mortality rate: 21.4 per 1,000 live births• Maternal mortality ratio: 343 per 100,000 live births• Malaria incidence: 218 cases/ 1,000 people at risk• Tuberculosis incidence: 201/ 100,000 people• HIV prevalence: 6.5% of population ages 15-49
CDC
PEPFAR
PMI
USAID
GFATM
UNFPA
Annual budget (rough estimate)
• N/A
• $32M ARVs (2016)• $40M non-ARVs and reagents (2016)
• $15M
• $3M on RH (2014-16 avg)
• $3M on RH (2014-16 avg)
• $40-60M1 (2014-17 avg)
Procurers
• MAUL
• GHSC-PSM
• GHSC-PSM• Abt Associates (IRS)
• PPM
• UNFPA
NON-EXHAUSTIVE

Uganda – Overview of current procurement mechanism and key stakeholders (non-exhaustive)
12
Funders
Procurement Agent
Central warehouses
Public Sector Private Sector (Not for profit)
Gov’t of Uganda GFATM USAID CDC
National Medical
Store (NMS)
PSM MAUL
NMS
Joint Medical
Store (JMS)
GF-PPM
Commodities• ARVs• TB• ACTs• EM• RH/FP
• ARVs• Labs• ACTs• Bednets
Uganda Cancer
Institute
• Cancer drugs
UNFPA
UNFPA
UHMG
• RH/ FP • ARVs• EM
Faith-based orgs
JMS
• EM• ARVs• Labs
Sources: Interviews with government officials, donors, and implementing partners (NMS, QPPU, UNFPA, USAID, PSM)
NON-EXHAUSTIVE
Uganda – Key observations
13
Funding
Policy & Regulations
Supporting infrastructure & resources
Strategy & Processes
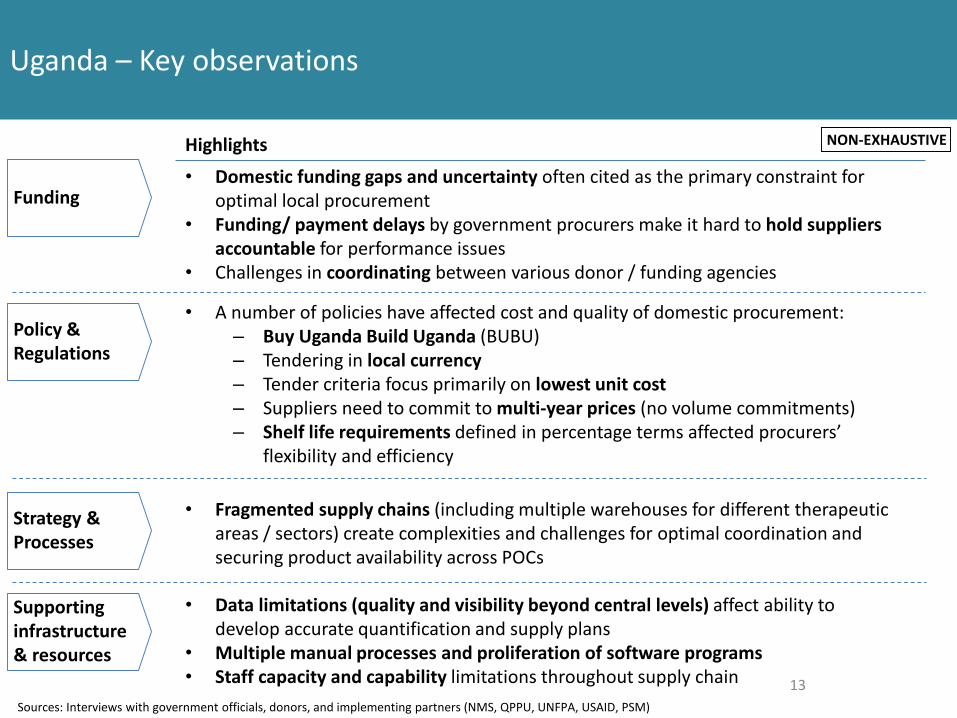
• Domestic funding gaps and uncertainty often cited as the primary constraint for optimal local procurement
• Funding/ payment delays by government procurers make it hard to hold suppliers accountable for performance issues
• Challenges in coordinating between various donor / funding agencies
Highlights
• A number of policies have affected cost and quality of domestic procurement:– Buy Uganda Build Uganda (BUBU)– Tendering in local currency– Tender criteria focus primarily on lowest unit cost– Suppliers need to commit to multi-year prices (no volume commitments)– Shelf life requirements defined in percentage terms affected procurers’
flexibility and efficiency
• Fragmented supply chains (including multiple warehouses for different therapeutic areas / sectors) create complexities and challenges for optimal coordination and securing product availability across POCs
• Data limitations (quality and visibility beyond central levels) affect ability to develop accurate quantification and supply plans
• Multiple manual processes and proliferation of software programs• Staff capacity and capability limitations throughout supply chain
Sources: Interviews with government officials, donors, and implementing partners (NMS, QPPU, UNFPA, USAID, PSM)
NON-EXHAUSTIVE
Kenya – Country overview
14
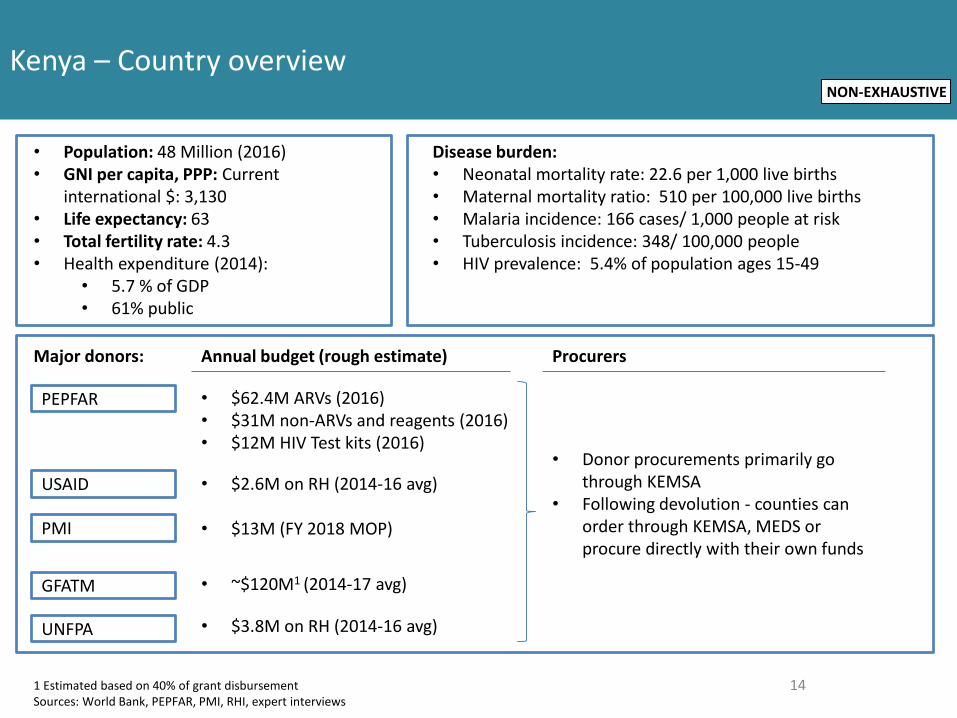
• Population: 48 Million (2016)• GNI per capita, PPP: Current
international $: 3,130• Life expectancy: 63• Total fertility rate: 4.3• Health expenditure (2014):
• 5.7 % of GDP• 61% public
1 Estimated based on 40% of grant disbursementSources: World Bank, PEPFAR, PMI, RHI, expert interviews
Major donors:
Disease burden:• Neonatal mortality rate: 22.6 per 1,000 live births• Maternal mortality ratio: 510 per 100,000 live births• Malaria incidence: 166 cases/ 1,000 people at risk• Tuberculosis incidence: 348/ 100,000 people• HIV prevalence: 5.4% of population ages 15-49
PEPFAR
PMI
USAID
GFATM
UNFPA
Annual budget (rough estimate)
• $62.4M ARVs (2016)• $31M non-ARVs and reagents (2016)• $12M HIV Test kits (2016)
• $13M (FY 2018 MOP)
• $2.6M on RH (2014-16 avg)
• $3.8M on RH (2014-16 avg)
• ~$120M1 (2014-17 avg)
Procurers
• Donor procurements primarily go through KEMSA
• Following devolution - counties can order through KEMSA, MEDS or procure directly with their own funds
NON-EXHAUSTIVE

Kenya – Overview of procurement mechanism and key stakeholders
15
Kenya supply chain overview - 20041
1 – Source: KEMSA Study, Pamela Steele and Silvia Rossi Tafuri2 - Yadav, Prashant. 2014. ‘Kenya Medical Supplies Authority (KEMSA): a case study of the ongoing transition from an ungainly bureaucracy to a competitive and customer focused medical logistics organization’. Study conducted by the World Bank.Sources: Expert interviews, literature review
Discussion
• Following a vote in 2010, responsibility for procurement was decentralized to 47 counties
• Counties have the ability to chose how to procure; effectively creating a market
• Both donors and GOK have invested in creating a strong procurement function – KEMSA.
• Yadav 20142 attributes the success of this to the following factors:– Recruiting leadership talent– Creating an Appropriate Legal Framework– Robust and Effective Governance Structure– Greater Transparency– Building a Change Coalition– Robust Quality Assurance– Adequate Staffing
• USAID announced an expansion of its collaboration with KEMSA in June 2016 – it will procure US $650 million through KEMSA under a multi-year agreement
NON-EXHAUSTIVE

Kenya – Key observations
16
Funding
Policy & Regulations
Notes
Strategy & Processes
• Funding uncertainty (both government and donors) cited as the biggest constraint for optimal procurement
• Inability to roll-over government funding between periods• Lack of coordination amongst donors and GOK in funding cycles
Highlights
• 2010 devolution put much of the power to purchase at the county level • Counties can chose how to procure (KEMSA, MEDs, direct tendering)• Shelf life requirements defined as percentages affect procurers’ flexibility & efficiency
• Fragmented demand (at county level) coupled with lack of accurate data systems at lower levels (varies by disease category) complicate quantification and tendering
• Donor procurements and procurement of certain GOK-funded commodities (e.g. oncology drugs) all flow through KEMSA
• KEMSA charges a 10% fee for its procurement, warehousing and distribution services• Donors and GOK invested heavily in upskilling KEMSA and the current institution is
seen as reliable and successful• USAID agreed to a multi-year award to KEMSA in June 2016• KEMSA has had to suspend deliveries to counties due to non-payment, these counties
then often procure through other channels (e.g. MEDs)
Sources: Interviews with USAID HIV Division and other Kenya procurement experts; literature review
NON-EXHAUSTIVE

India – Procurement for national disease programs is done at the central level (not exhaustive)
17
Funders
Procurement Agent
National Disease programs (e.g., HIV, TB, MNCH, Vaccines)
Central Medical Services Society
(CMSS)
Rail India Technical and Economic
Services (RITES) Ltd
Central Government
State Governments
Donors (e.g., World Bank, GFATM)
Coordinating Programs
Disease programs, e.g., NACO – National
Aids Control Organization
Sources: Interviews with experts and government officials (CMSS, TNMSC, MPPHSCL, Prabal Singh) ; lit search
• Set up as an autonomous, non-governmental body in 2012 with a grant from government
• Aims to self-sustain through 3% fee
• Procures for national disease programs
NON-EXHAUSTIVE

India – Various models exist at the state level, with Tamil Nadu being recognized as a role model with its centralized set-up (not exhaustive)
18
Funders
Tamil Nadu
State Government
Procurement Agent
Maharashtra
State Government
Tamil Nadu Medical Service Corporation
(TNMSC)Districts Health
Facilities
• Other states such as MP and Chhattisgarh had outsourced procurement to TNMSC in the past
• Kerala has built a system modeled after TNMSC with further emphasis in technology and product selection (BGx)
Sources: Interviews with experts and government officials (CMSS, TNMSC, MPPHSCL, Prabal Singh) ; lit search
NON-EXHAUSTIVE
Tamil Nadu – Impact by TNMSC
19
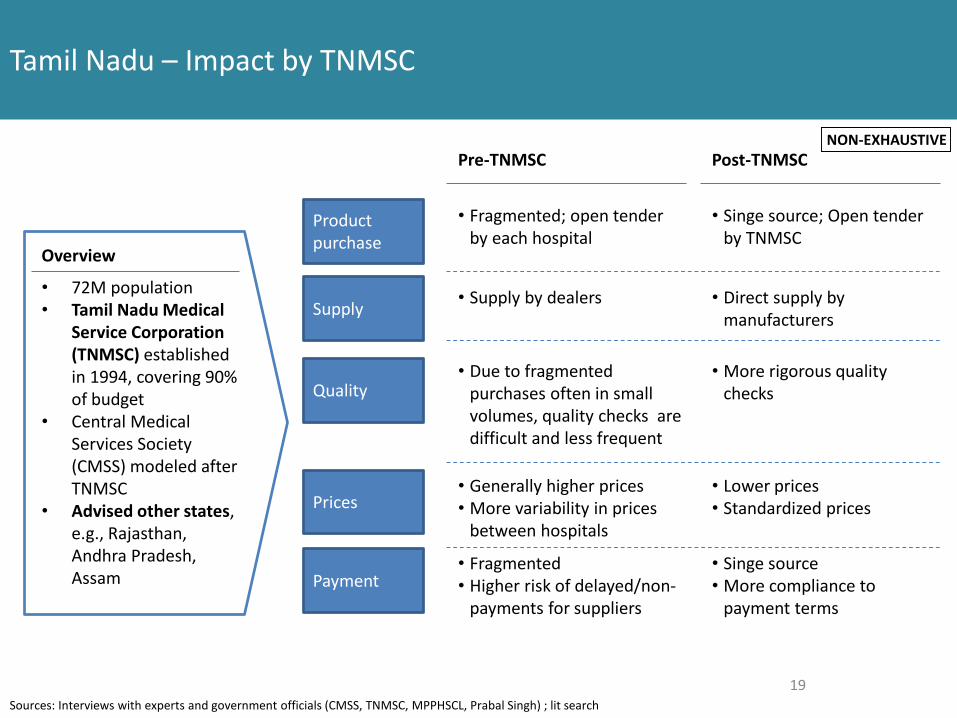
Overview
• 72M population• Tamil Nadu Medical
Service Corporation (TNMSC) established in 1994, covering 90% of budget
• Central Medical Services Society (CMSS) modeled after TNMSC
• Advised other states, e.g., Rajasthan, Andhra Pradesh, Assam
Product purchase
Supply
Quality
Prices
Payment
Pre-TNMSC
• Fragmented; open tender by each hospital
• Supply by dealers
• Due to fragmented purchases often in small volumes, quality checks are difficult and less frequent
• Generally higher prices• More variability in prices
between hospitals
• Fragmented• Higher risk of delayed/non-
payments for suppliers
Post-TNMSC
• Singe source; Open tender by TNMSC
• Direct supply by manufacturers
• More rigorous quality checks
• Lower prices• Standardized prices
• Singe source• More compliance to
payment terms
Sources: Interviews with experts and government officials (CMSS, TNMSC, MPPHSCL, Prabal Singh) ; lit search
NON-EXHAUSTIVE

India – Key observations
20
Funding
Policy & Regulations
Supporting infrastructure & resources
Strategy & Processes
• Central government funds and procures for national disease programs (e.g., HIV, TB) and national organizations (e.g., armed forces)
• State government procures for others with funding from central and state levels
Highlights
• Governments have indicated disagreements with regulatory authorities on approving new products, e.g., HIV Peds (LPV/r pellets), TB (FDC for rifampicin/isoniazid)
• To ensure product quality, Kerala has instituted a BGx policy
• Degree of procurement centralization differs by state: however more centralized ones such as Tamil Nadu and Kerala appear to have benefited from:
– Tighter control over quality and supplier performance, e.g., own quality assessment and penalty clauses for supplier under-performance; PHCs in Maharashtra face supplier unresponsiveness and failing to meet delivery schedule
– Management of product ranges (~260 essential drugs vs. over 1800 in Maharashtra) – Better prices through increased scale and greater efficiency, e.g., Tamil Nadu pays INR 500 per
CT scan vs. 1700 in some other states• Tamil Nadu merged all health programs except AIDS; with Tamil Nadu Medical Service Corporation
(TNMSC) managing ~90% of procurement budget; TNMSC is known as a role model and provides consultancy projects for others (e.g., Andhra Pradesh)
• States have different bidding and evaluation processes, creating complexity and costs for suppliers• To tackle uncertainties in demand estimation, Kerala state has a two-PO system where the first is
75% of the estimated order and the second will be set later with more data• State reflect preference for in-state suppliers and public-sector undertakings (PSUs), e.g., In Kerala
15% premium for state PSU and 10% premium for small/ micro companies
• Lack of trained staff on supply chain management (e.g., inventory management, data reporting)• Tamil Nadu enjoys greater visibility of supply chain due to computerization
Sources: Interviews with experts and government officials (CMSS, TNMSC, MPPHSCL, Prabal Singh) ; lit search
NON-EXHAUSTIVE
Nigeria – Country overview
21
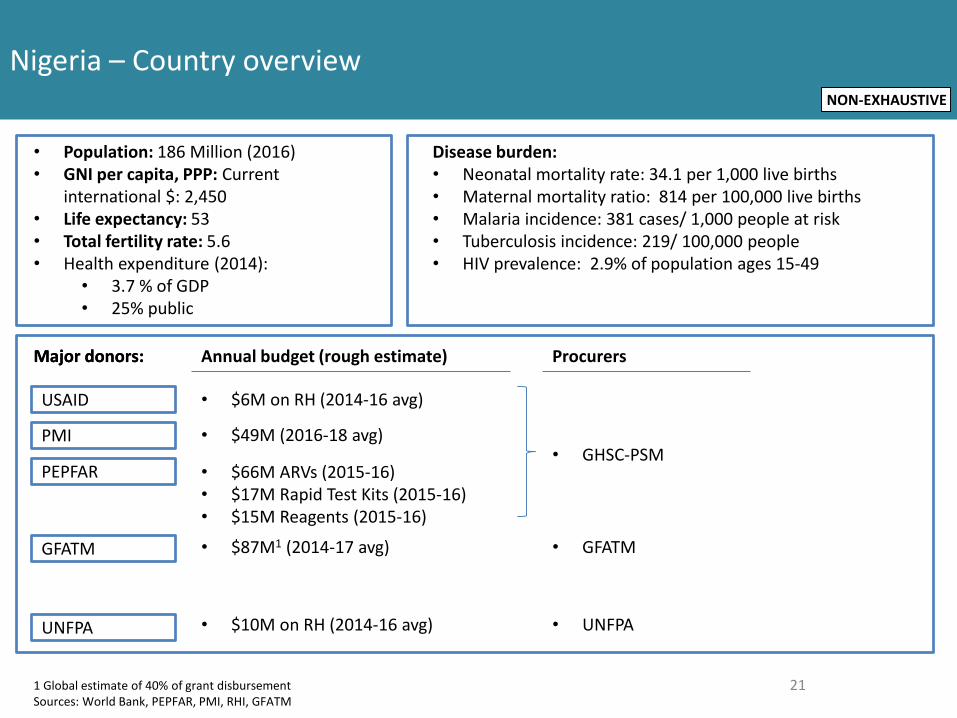
• Population: 186 Million (2016)• GNI per capita, PPP: Current
international $: 2,450• Life expectancy: 53• Total fertility rate: 5.6• Health expenditure (2014):
• 3.7 % of GDP• 25% public
Major donors:
Disease burden:• Neonatal mortality rate: 34.1 per 1,000 live births• Maternal mortality ratio: 814 per 100,000 live births• Malaria incidence: 381 cases/ 1,000 people at risk• Tuberculosis incidence: 219/ 100,000 people• HIV prevalence: 2.9% of population ages 15-49
Annual budget (rough estimate) ProcurersMajor donors:
PEPFAR
USAID
GFATM
UNFPA
• $66M ARVs (2015-16)• $17M Rapid Test Kits (2015-16)• $15M Reagents (2015-16)
• $6M on RH (2014-16 avg)
• $10M on RH (2014-16 avg)
• $87M1 (2014-17 avg) • GFATM
• UNFPA
PMI • $49M (2016-18 avg)• GHSC-PSM
1 Global estimate of 40% of grant disbursementSources: World Bank, PEPFAR, PMI, RHI, GFATM
NON-EXHAUSTIVE
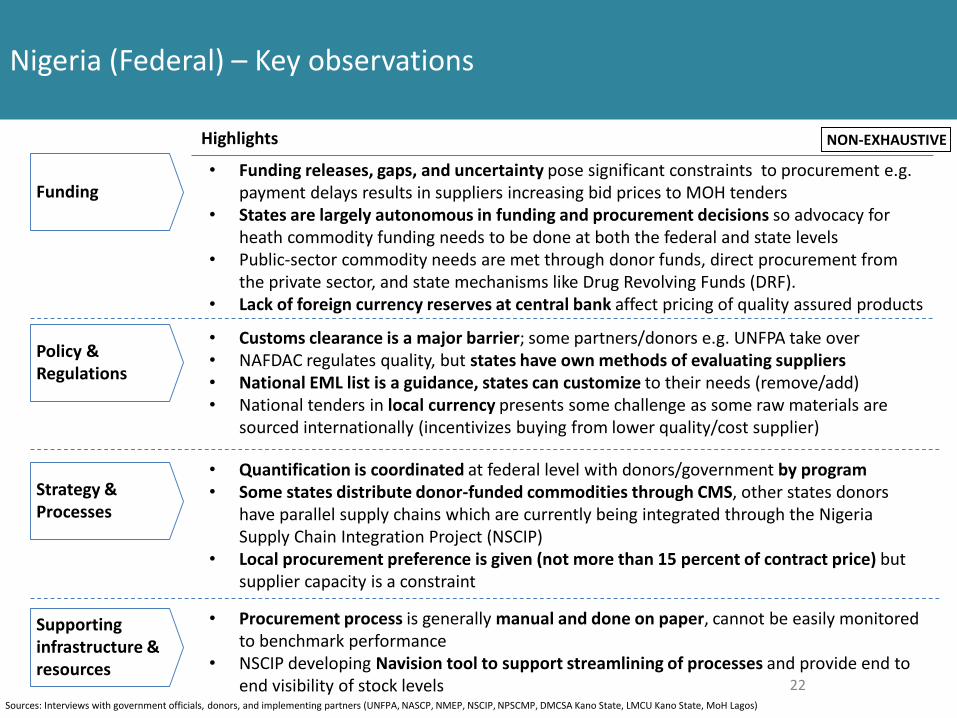
Nigeria (Federal) – Key observations
Funding
Policy & Regulations
Supporting infrastructure & resources
Strategy & Processes
• Funding releases, gaps, and uncertainty pose significant constraints to procurement e.g. payment delays results in suppliers increasing bid prices to MOH tenders
• States are largely autonomous in funding and procurement decisions so advocacy for heath commodity funding needs to be done at both the federal and state levels
• Public-sector commodity needs are met through donor funds, direct procurement from the private sector, and state mechanisms like Drug Revolving Funds (DRF).
• Lack of foreign currency reserves at central bank affect pricing of quality assured products
Highlights
• Customs clearance is a major barrier; some partners/donors e.g. UNFPA take over • NAFDAC regulates quality, but states have own methods of evaluating suppliers • National EML list is a guidance, states can customize to their needs (remove/add)• National tenders in local currency presents some challenge as some raw materials are
sourced internationally (incentivizes buying from lower quality/cost supplier)
• Quantification is coordinated at federal level with donors/government by program • Some states distribute donor-funded commodities through CMS, other states donors
have parallel supply chains which are currently being integrated through the Nigeria Supply Chain Integration Project (NSCIP)
• Local procurement preference is given (not more than 15 percent of contract price) but supplier capacity is a constraint
• Procurement process is generally manual and done on paper, cannot be easily monitored to benchmark performance
• NSCIP developing Navision tool to support streamlining of processes and provide end to end visibility of stock levels
Sources: Interviews with government officials, donors, and implementing partners (UNFPA, NASCP, NMEP, NSCIP, NPSCMP, DMCSA Kano State, LMCU Kano State, MoH Lagos)
22
NON-EXHAUSTIVE
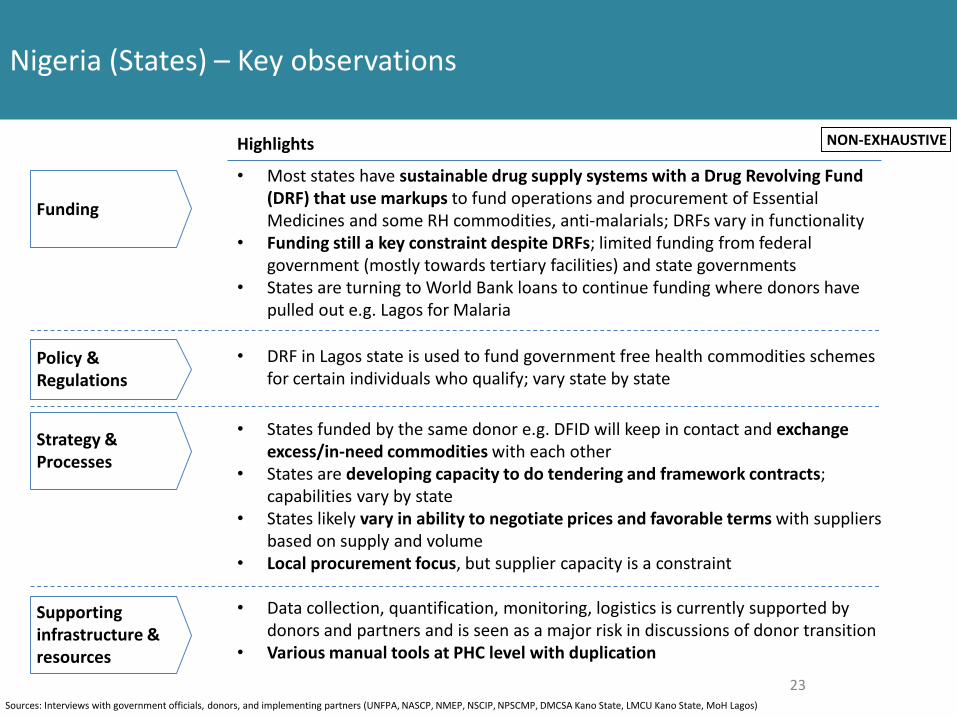
Nigeria (States) – Key observations
Funding
Policy & Regulations
Supporting infrastructure & resources
Strategy & Processes
• Most states have sustainable drug supply systems with a Drug Revolving Fund (DRF) that use markups to fund operations and procurement of Essential Medicines and some RH commodities, anti-malarials; DRFs vary in functionality
• Funding still a key constraint despite DRFs; limited funding from federal government (mostly towards tertiary facilities) and state governments
• States are turning to World Bank loans to continue funding where donors have pulled out e.g. Lagos for Malaria
Highlights
• DRF in Lagos state is used to fund government free health commodities schemes for certain individuals who qualify; vary state by state
• States funded by the same donor e.g. DFID will keep in contact and exchange excess/in-need commodities with each other
• States are developing capacity to do tendering and framework contracts; capabilities vary by state
• States likely vary in ability to negotiate prices and favorable terms with suppliers based on supply and volume
• Local procurement focus, but supplier capacity is a constraint
• Data collection, quantification, monitoring, logistics is currently supported by donors and partners and is seen as a major risk in discussions of donor transition
• Various manual tools at PHC level with duplication
23Sources: Interviews with government officials, donors, and implementing partners (UNFPA, NASCP, NMEP, NSCIP, NPSCMP, DMCSA Kano State, LMCU Kano State, MoH Lagos)
NON-EXHAUSTIVE
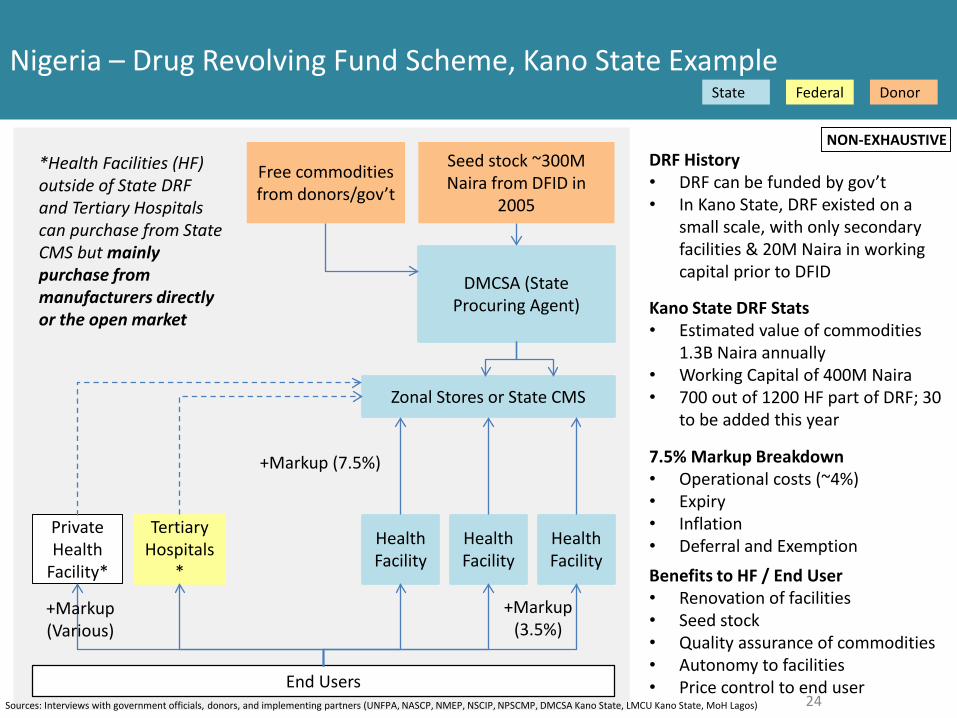
Nigeria – Drug Revolving Fund Scheme, Kano State Example
24
Seed stock ~300M Naira from DFID in
2005
Free commodities from donors/gov’t
Health Facility
Health Facility
Health Facility
Zonal Stores or State CMS
DMCSA (State Procuring Agent)
Tertiary Hospitals
*
7.5% Markup Breakdown• Operational costs (~4%)• Expiry• Inflation • Deferral and Exemption
Kano State DRF Stats• Estimated value of commodities
1.3B Naira annually• Working Capital of 400M Naira• 700 out of 1200 HF part of DRF; 30
to be added this year
*Health Facilities (HF) outside of State DRF and Tertiary Hospitals can purchase from State CMS but mainly purchase from manufacturers directly or the open market
Benefits to HF / End User• Renovation of facilities• Seed stock• Quality assurance of commodities• Autonomy to facilities• Price control to end userEnd Users
Private Health
Facility*
+Markup (7.5%)
DRF History• DRF can be funded by gov’t• In Kano State, DRF existed on a
small scale, with only secondary facilities & 20M Naira in working capital prior to DFID
+Markup (Various)
+Markup (3.5%)
State Federal Donor
Sources: Interviews with government officials, donors, and implementing partners (UNFPA, NASCP, NMEP, NSCIP, NPSCMP, DMCSA Kano State, LMCU Kano State, MoH Lagos) 24
NON-EXHAUSTIVE
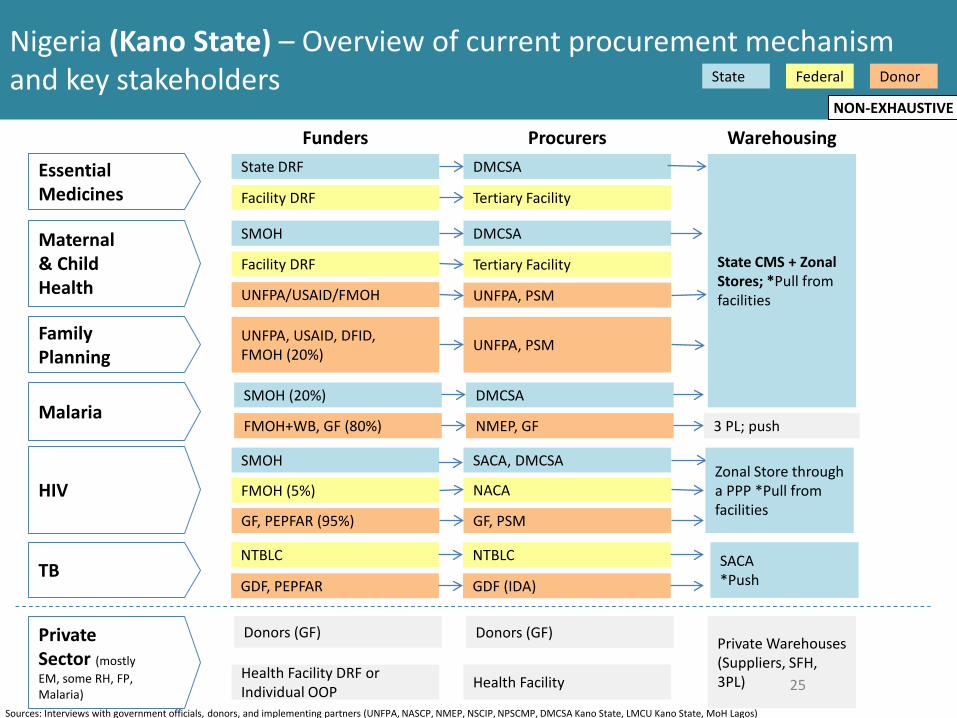
Nigeria (Kano State) – Overview of current procurement mechanism and key stakeholders State Federal Donor
Essential Medicines
FundersState DRF
State CMS + Zonal Stores; *Pull from facilities
Facility DRF
Health Facility DRF or Individual OOP
DMCSA
Tertiary Facility
Health Facility
Procurers Warehousing
Maternal & Child Health
SMOH
Facility DRF
DMCSA
Tertiary Facility
UNFPA/USAID/FMOH UNFPA, PSM
UNFPA, USAID, DFID,FMOH (20%) UNFPA, PSM
Family Planning
TB
HIV
Private Sector (mostly EM, some RH, FP, Malaria)
FMOH (5%)
GF, PEPFAR (95%)
NACA
GF, PSM
NTBLC
GDF, PEPFAR
NTBLC
GDF (IDA)
SMOH SACA, DMCSA
Private Warehouses (Suppliers, SFH, 3PL)
SACA*Push
MalariaSMOH (20%) DMCSA
FMOH+WB, GF (80%) NMEP, GF 3 PL; push
Donors (GF) Donors (GF)
Zonal Store through a PPP *Pull from facilities
Sources: Interviews with government officials, donors, and implementing partners (UNFPA, NASCP, NMEP, NSCIP, NPSCMP, DMCSA Kano State, LMCU Kano State, MoH Lagos)
25
NON-EXHAUSTIVE
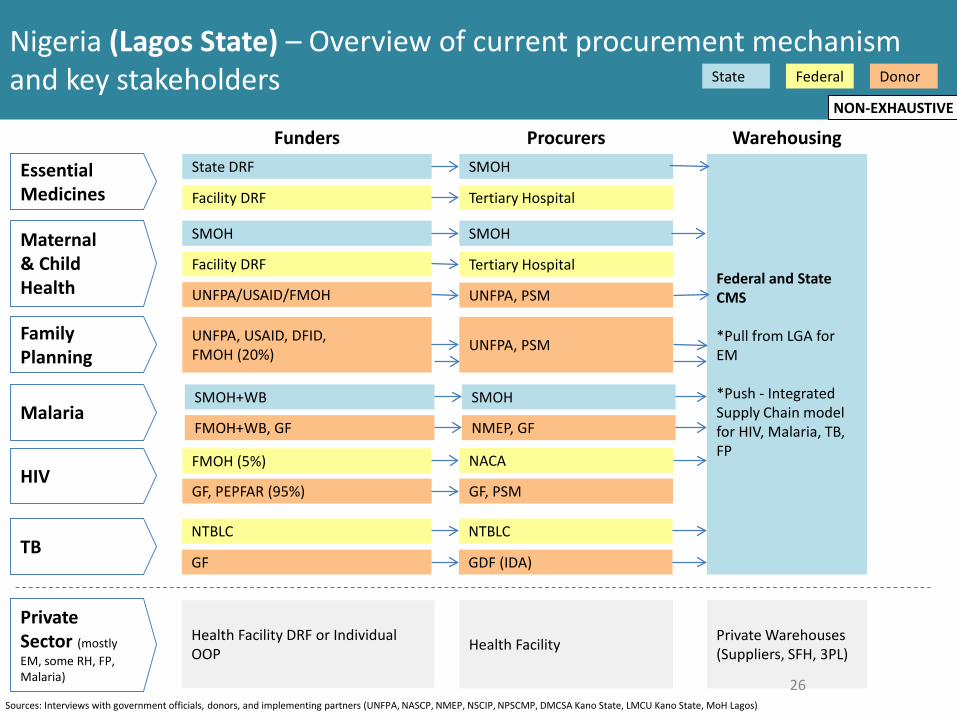
Nigeria (Lagos State) – Overview of current procurement mechanism and key stakeholders
Essential Medicines
FundersState DRF
Federal and State CMS
*Pull from LGA for EM
*Push - Integrated Supply Chain model for HIV, Malaria, TB, FP
Facility DRF
Health Facility DRF or Individual OOP
SMOH
Tertiary Hospital
Health Facility
Procurers Warehousing
Maternal & Child Health
SMOH
Facility DRF
SMOH
Tertiary Hospital
UNFPA/USAID/FMOH UNFPA, PSM
UNFPA, USAID, DFID,FMOH (20%) UNFPA, PSM
Family Planning
TB
HIV
Private Sector (mostly EM, some RH, FP, Malaria)
FMOH (5%)
GF, PEPFAR (95%)
NACA
GF, PSM
NTBLC
GF
NTBLC
GDF (IDA)
Private Warehouses (Suppliers, SFH, 3PL)
MalariaSMOH+WB SMOH
FMOH+WB, GF NMEP, GF
Sources: Interviews with government officials, donors, and implementing partners (UNFPA, NASCP, NMEP, NSCIP, NPSCMP, DMCSA Kano State, LMCU Kano State, MoH Lagos)
26
State Federal Donor
NON-EXHAUSTIVE

South Africa – Country overview
27
• Population: 56 Million (2016)• GNI per capita, PPP: 5,480 (2016)• Life expectancy: 62 years (2015)• Total fertility rate: 2.5• Health expenditure (2014):
• 4.2% of GDP (public)• 48% public
1 Global Estimates based on 40% of grant disbursementSources: World Bank, GFATM
Major donors:
Disease burden:• Neonatal mortality rate: 12 per 1000 live births• Maternal mortality ratio: 138 per 100,000 live births• Malaria incidence: 3.1 cases / 1,000 people at risk• Tuberculosis incidence: 781 cases / 100,000 people at risk• HIV prevalence: 18.9% of population ages 15-49
Annual budget (rough estimate) Procurers
GFATM • $33M1 (2014-17 avg) • SA government
Remainder of commodity procurement is domestically funded
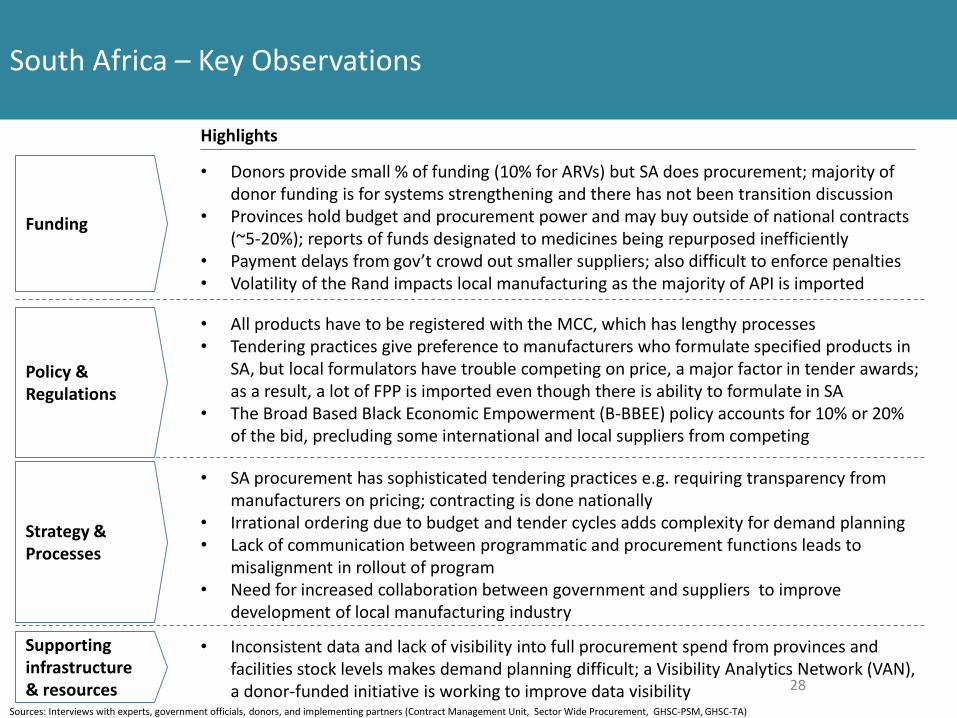
• Donors provide small % of funding (10% for ARVs) but SA does procurement; majority of donor funding is for systems strengthening and there has not been transition discussion
• Provinces hold budget and procurement power and may buy outside of national contracts (~5-20%); reports of funds designated to medicines being repurposed inefficiently
• Payment delays from gov’t crowd out smaller suppliers; also difficult to enforce penalties• Volatility of the Rand impacts local manufacturing as the majority of API is imported
South Africa – Key Observations
Funding
Policy & Regulations
Supporting infrastructure & resources
Strategy & Processes
Highlights
• All products have to be registered with the MCC, which has lengthy processes• Tendering practices give preference to manufacturers who formulate specified products in
SA, but local formulators have trouble competing on price, a major factor in tender awards; as a result, a lot of FPP is imported even though there is ability to formulate in SA
• The Broad Based Black Economic Empowerment (B-BBEE) policy accounts for 10% or 20% of the bid, precluding some international and local suppliers from competing
• SA procurement has sophisticated tendering practices e.g. requiring transparency from manufacturers on pricing; contracting is done nationally
• Irrational ordering due to budget and tender cycles adds complexity for demand planning• Lack of communication between programmatic and procurement functions leads to
misalignment in rollout of program• Need for increased collaboration between government and suppliers to improve
development of local manufacturing industry
• Inconsistent data and lack of visibility into full procurement spend from provinces and facilities stock levels makes demand planning difficult; a Visibility Analytics Network (VAN), a donor-funded initiative is working to improve data visibility
Sources: Interviews with experts, government officials, donors, and implementing partners (Contract Management Unit, Sector Wide Procurement, GHSC-PSM, GHSC-TA)
28