
Funding Notes - U.S. Housing and Mortgage Market - Fannie Mae
11
For Fannie Mae’s Investors and Dealers 1 Online at www.fanniemae.com → Debt Securities → FundingNotes ©2010, Fannie Mae. No part of this document may be dupli- cated, reproduced, distributed or displayed in public in any manner or by any means without the written permission of Fannie Mae. This document is for the private information of dealers in Fannie Mae securities (“Dealers”) and qualified sophisticated institutional investors. Fannie Mae does not intend to solicit and is not soliciting any action with respect to any Fannie Mae security based upon this document. This document does not constitute, and under no circumstances should it be used as, or considered to be, an offer to sell or a solicitation of an offer to buy the securities or other instru- ments mentioned herein or derived from such securities or instruments. Fannie Mae expects Dealers to make every effort to assist investors to consider and understand the risks of the securities or instruments mentioned herein. The securities or other instruments mentioned in this document may not be eligible for sale in certain jurisdictions or to certain persons and may not be suitable for all types of investors. Opinions and estimates expressed herein constitute our present judgment and are subject to change without notice. Such opinions or estimates should not be construed as either projections or predictions of value, performance or results; nor as legal, tax, financial, or accounting advice. (See back cover.) February – March 2010 This edition of FundingNotes is written by Fannie Mae’s Economic and Mortgage Market Analysis (EMMA) group. U.S. Housing and Mortgage Market Outlook Housing Market in 2009: Troughs in Activity Established Following three years of housing recession, most measures of housing ac- tivity appear to have troughed in early 2009 and have embarked on varying degrees of recovery. After suffering the most severe peak-to-trough decline, 80 percent 1 , in six decades, single-family housing starts experienced a small uneven rebound. While they posted steady increases through July 2009, they have lost steam and have since moved sideways. For all of 2009, single-family starts were at 445,200, a record low and an amazing plunge from a record high of 1.7 million just four years ago (see Figure 1). Multifamily starts also fell to a record low of 109,300 for the year. 0 200 400 600 800 1,000 1,200 1,400 1,600 1,800 2000 2001 2002 2003 2004 2005 2006 2007 2008 2009 Single-Family Starts Drop to Another Record Low Thousands of units Source: Census Bureau Figure 1 The rebound in home sales, which also started in early 2009, showed starkly different pictures of the housing markets for new and existing homes. Despite historically low mortgage rates and the first-time home- buyer tax credit, the recovery in the new home market was tepid, mir- roring that of single-family starts. In contrast, the existing home market soared in the second half of 2009, benefitting from distressed sales in addition to the tax credit and low mortgage rates. Both new and existing home markets suffered some payback in the final month of the year, as sales were pulled forward in a rush to beat the expiration of the tax credit, which was tentatively set at the end of November (see Figure 2). 1 The peak (monthly, seasonally adjusted annual rate) in single-family housing starts was 1,823,000 in January 2006 and the trough was 357,000 (Jan and Feb 2009). The peak annual level was in 2005 at 1,719,000.
Transcript of Funding Notes - U.S. Housing and Mortgage Market - Fannie Mae
For Fannie Mae’s Investors and Dealers
1Online at www.fanniemae.com → Debt Securities → FundingNotes
©2010, Fannie Mae. No part of this document may be dupli-cated, reproduced, distributed or displayed in public in any manner or by any means without the written permission of Fannie Mae. This document is for the private information of dealers in Fannie Mae securities (“Dealers”) and qualified sophisticated institutional investors. Fannie Mae does not intend to solicit and is not soliciting any action with respect to any Fannie Mae security based upon this document. This document does not constitute, and under no circumstances should it be used as, or considered to be, an offer to sell or a solicitation of an offer to buy the securities or other instru-ments mentioned herein or derived from such securities or instruments. Fannie Mae expects Dealers to make every effort to assist investors to consider and understand the risks of the securities or instruments mentioned herein. The securities or other instruments mentioned in this document may not be eligible for sale in certain jurisdictions or to certain persons and may not be suitable for all types of investors. Opinions and estimates expressed herein constitute our present judgment and are subject to change without notice. Such opinions or estimates should not be construed as either projections or predictions of value, performance or results; nor as legal, tax, financial, or accounting advice. (See back cover.)
February – March 2010
This edition of FundingNotes is written by Fannie Mae’s Economic and Mortgage Market Analysis (EMMA) group.
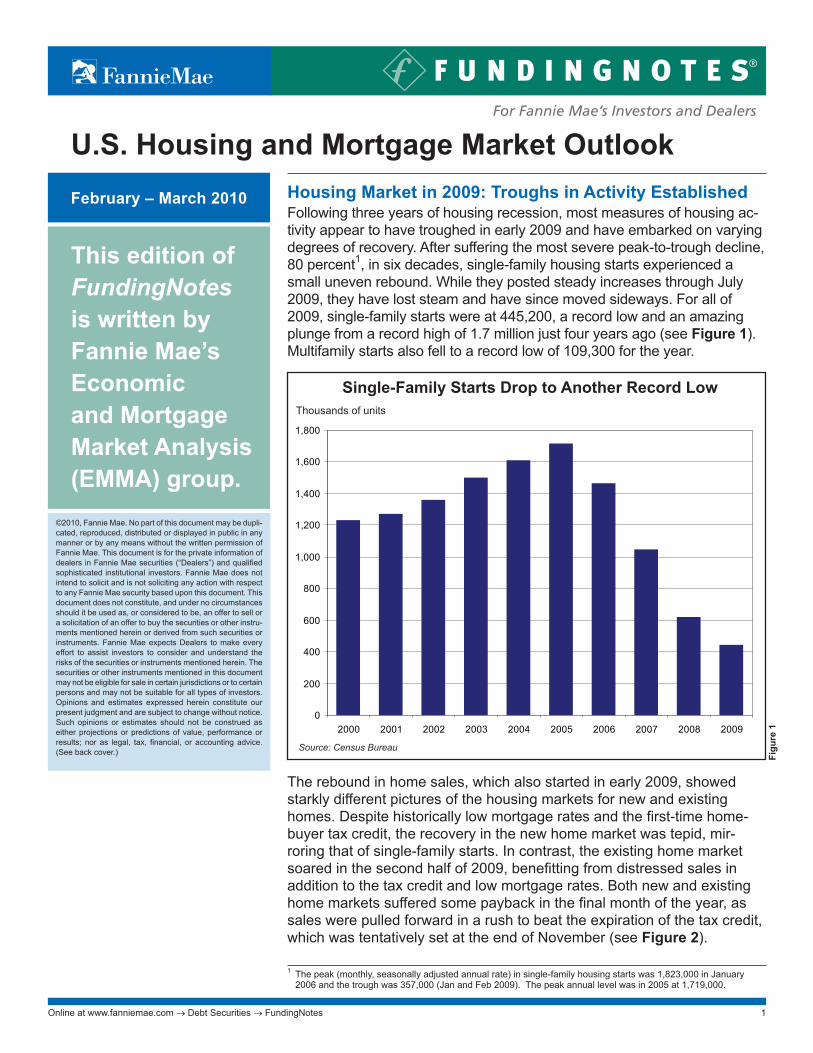
U.S. Housing and Mortgage Market OutlookHousing Market in 2009: Troughs in Activity Established Following three years of housing recession, most measures of housing ac-tivity appear to have troughed in early 2009 and have embarked on varying degrees of recovery. After suffering the most severe peak-to-trough decline, 80 percent1, in six decades, single-family housing starts experienced a small uneven rebound. While they posted steady increases through July 2009, they have lost steam and have since moved sideways. For all of 2009, single-family starts were at 445,200, a record low and an amazing plunge from a record high of 1.7 million just four years ago (see Figure 1). Multifamily starts also fell to a record low of 109,300 for the year.
0
200
400
600
800
1,000
1,200
1,400
1,600
1,800
2000 2001 2002 2003 2004 2005 2006 2007 2008 2009
Single-Family Starts Drop to Another Record LowThousands of units
Source: Census Bureau
Figu
re 1
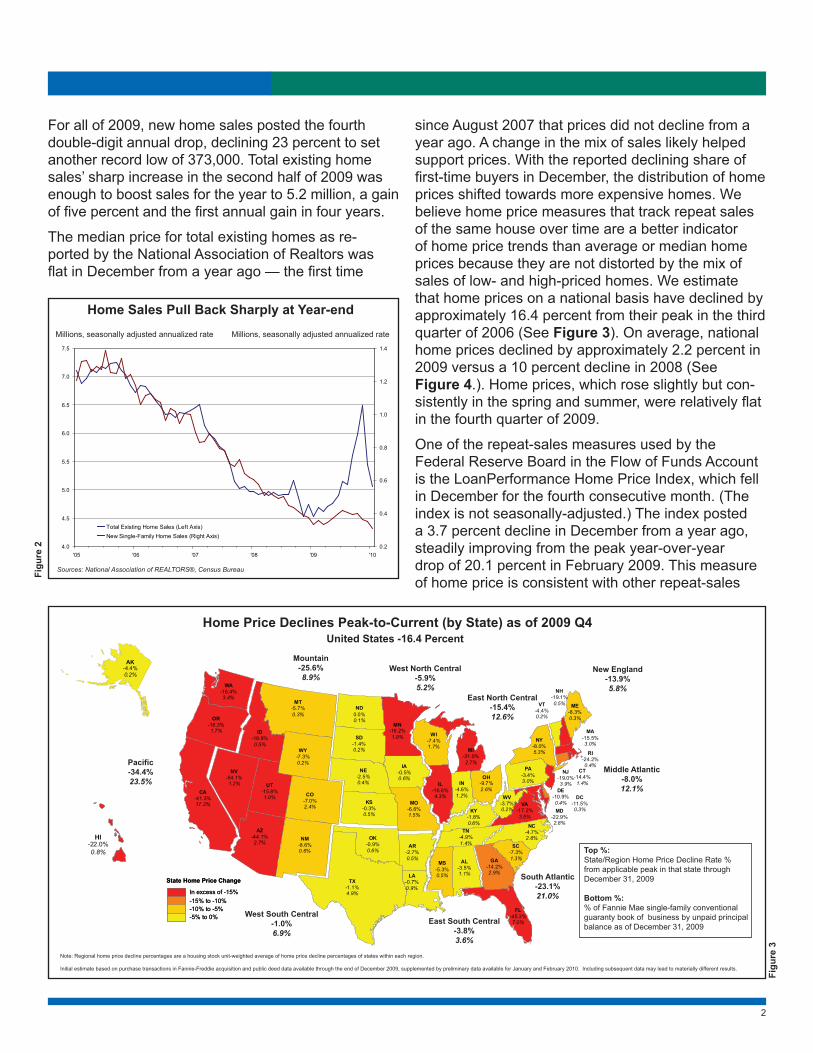
The rebound in home sales, which also started in early 2009, showed starkly different pictures of the housing markets for new and existing homes. Despite historically low mortgage rates and the first-time home-buyer tax credit, the recovery in the new home market was tepid, mir-roring that of single-family starts. In contrast, the existing home market soared in the second half of 2009, benefitting from distressed sales in addition to the tax credit and low mortgage rates. Both new and existing home markets suffered some payback in the final month of the year, as sales were pulled forward in a rush to beat the expiration of the tax credit, which was tentatively set at the end of November (see Figure 2).
1 The peak (monthly, seasonally adjusted annual rate) in single-family housing starts was 1,823,000 in January 2006 and the trough was 357,000 (Jan and Feb 2009). The peak annual level was in 2005 at 1,719,000.
2
For all of 2009, new home sales posted the fourth double-digit annual drop, declining 23 percent to set another record low of 373,000. Total existing home sales’ sharp increase in the second half of 2009 was enough to boost sales for the year to 5.2 million, a gain of five percent and the first annual gain in four years.
The median price for total existing homes as re-ported by the National Association of Realtors was flat in December from a year ago — the first time
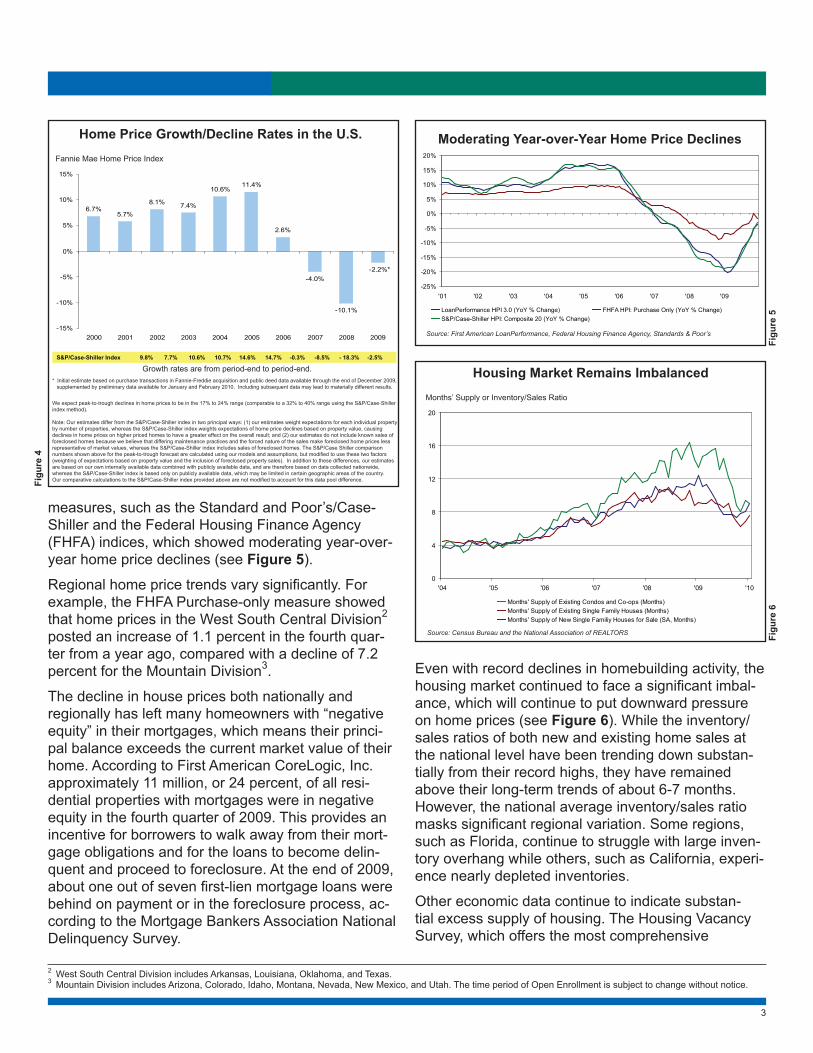
since August 2007 that prices did not decline from a year ago. A change in the mix of sales likely helped support prices. With the reported declining share of first-time buyers in December, the distribution of home prices shifted towards more expensive homes. We believe home price measures that track repeat sales of the same house over time are a better indicator of home price trends than average or median home prices because they are not distorted by the mix of sales of low- and high-priced homes. We estimate that home prices on a national basis have declined by approximately 16.4 percent from their peak in the third quarter of 2006 (See Figure 3). On average, national home prices declined by approximately 2.2 percent in 2009 versus a 10 percent decline in 2008 (See Figure 4.). Home prices, which rose slightly but con-sistently in the spring and summer, were relatively flat in the fourth quarter of 2009.
One of the repeat-sales measures used by the Federal Reserve Board in the Flow of Funds Account is the LoanPerformance Home Price Index, which fell in December for the fourth consecutive month. (The index is not seasonally-adjusted.) The index posted a 3.7 percent decline in December from a year ago, steadily improving from the peak year-over-year drop of 20.1 percent in February 2009. This measure of home price is consistent with other repeat-sales
4.0
4.5
5.0
5.5
6.0
6.5
7.0
7.5
'05 '06 '07 '08 '09 '100.2
0.4
0.6
0.8
1.0
1.2
1.4
Total Existing Home Sales (Left Axis)New Single-Family Home Sales (Right Axis)
Home Sales Pull Back Sharply at Year-endMillions, seasonally adjusted annualized rate Millions, seasonally adjusted annualized rate
Sources: National Association of REALTORS®, Census BureauFigu
re 2
Home Price Declines Peak-to-Current (by State) as of 2009 Q4
Top %:State/Region Home Price Decline Rate %from applicable peak in that state throughDecember 31, 2009
Bottom %:% of Fannie Mae single-family conventionalguaranty book of business by unpaid principalbalance as of December 31, 2009
United States -16.4 Percent
Note: Regional home price decline percentages are a housing stock unit-weighted average of home price decline percentages of states within each region.
Initial estimate based on purchase transactions in Fannie-Freddie acquisition and public deed data available through the end of December 2009, supplemented by preliminary data available for January and February 2010. Including subsequent data may lead to materially different results.
State Home Price Change
In excess of -15%-15% to -10%
-5% to 0%-10% to -5%
State Home Price Change
In excess of -15%-15% to -10%
-5% to 0%-10% to -5%
ND0.0%0.1%
VT-4.4%0.2%
ME-8.3%0.3%
NY-8.0%5.3%
WV-3.7%0.2%
PA-3.4%3.0%
OH-9.7%2.6%
WI-7.4%1.7%
IN-4.6%1.2%
NC-4.7%2.6%
SC-7.3%1.3%
MS-5.3%0.5%
AL-3.5%1.1%
TN-4.9%1.4%
KY-1.8%0.6%
MO-6.6%1.5%
IA-0.5%0.6%
NE-2.5%0.4%
KS-0.3%0.5%
LA-0.7%0.9%
AR-2.7%0.5%
OK-0.9%0.6%
TX-1.1%4.9%
SD-1.4%0.2%WY
-7.3%0.2%
NM-8.6%0.6%
CO-7.0%2.4%
MT-5.7%0.3%
NH-19.1%0.5%
MI-31.0%2.7%
MA-15.5%3.0%
RI-24.2%0.4%
DE-10.9%0.4%
CT-14.4%1.4%
MD-22.9%2.8%
DC-11.5%0.3%
AZ-44.1%2.7%
NJ-19.0%3.9%IL
-16.6%4.3%
VA-17.2%3.5%
FL-45.3%7.0%
GA-14.2%2.9%
MN-16.2%1.9%
ID-18.9%0.5%
UT-15.8%1.0%
NV-54.1%1.2%
OR-18.3%1.7%
WA-16.4%3.4%
CA-41.3%17.3%
AK-4.4%0.2%
HI-22.0%0.8%
Mountain-25.6%8.9%
West North Central-5.9%5.2%
East North Central-15.4%12.6%
New England-13.9%5.8%
Middle Atlantic-8.0%12.1%
South Atlantic-23.1%21.0%
East South Central-3.8%3.6%
West South Central-1.0%6.9%
Pacific-34.4%23.5%
Figu
re 3
3
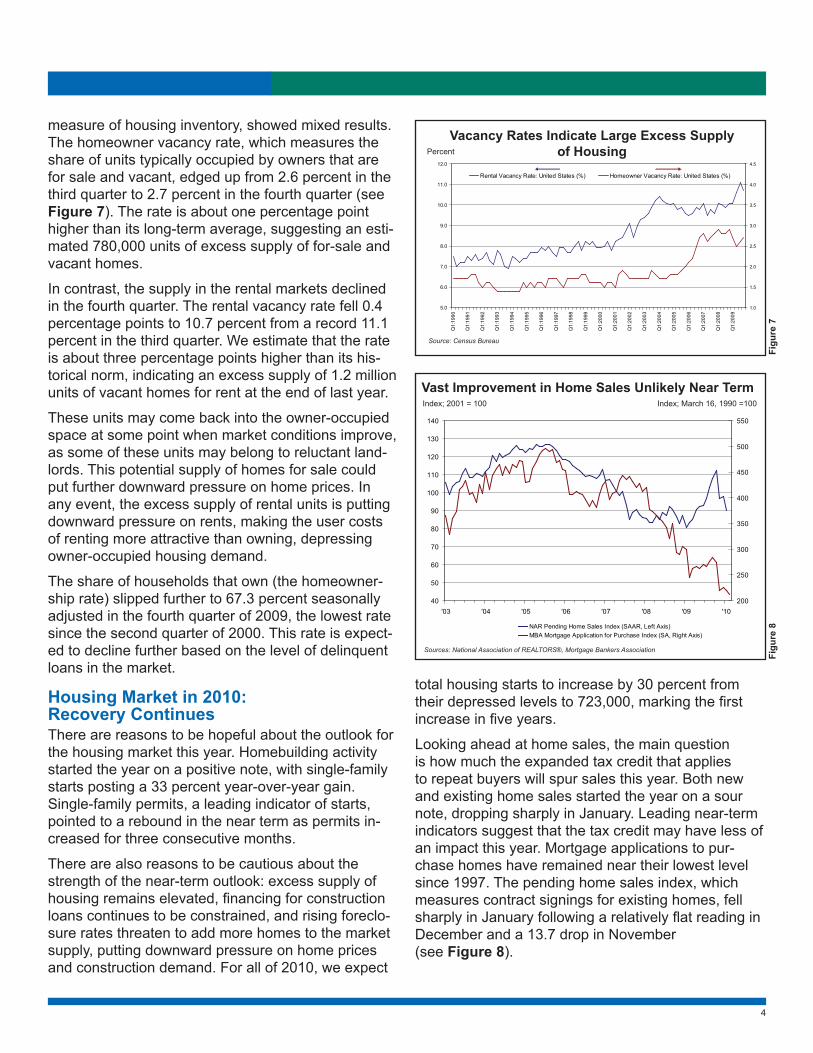
Home Price Growth/Decline Rates in the U.S.Fannie Mae Home Price Index
6.7%5.7%
8.1% 7.4%
10.6%11.4%
2.6%
-4.0%
-10.1%
-2.2%*
-15%
-10%
-5%
0%
5%
10%
15%
2000 2001 2002 2003 2004 2005 2006 2007 2008 2009
S&P/Case-Shiller Index 9.8% 7.7% 10.6% 10.7% 14.6% 14.7% -0.3% -8.5% - 18.3% -2.5%
Growth rates are from period-end to period-end.* Initial estimate based on purchase transactions in Fannie-Freddie acquisition and public deed data available through the end of December 2009, supplemented by preliminary data available for January and February 2010. Including subsequent data may lead to materially different results.
We expect peak-to-trough declines in home prices to be in the 17% to 24% range (comparable to a 32% to 40% range using the S&P/Case-Shillerindex method).
Note: Our estimates differ from the S&P/Case-Shiller index in two principal ways: (1) our estimates weight expectations for each individual propertyby number of properties, whereas the S&P/Case-Shiller index weights expectations of home price declines based on property value, causingdeclines in home prices on higher priced homes to have a greater effect on the overall result; and (2) our estimates do not include known sales offoreclosed homes because we believe that differing maintenance practices and the forced nature of the sales make foreclosed home prices lessrepresentative of market values, whereas the S&P/Case-Shiller index includes sales of foreclosed homes. The S&P/Case Shiller comparisonnumbers shown above for the peak-to-trough forecast are calculated using our models and assumptions, but modified to use these two factors(weighting of expectations based on property value and the inclusion of foreclosed property sales). In addition to these differences, our estimatesare based on our own internally available data combined with publicly available data, and are therefore based on data collected nationwide,whereas the S&P/Case-Shiller index is based only on publicly available data, which may be limited in certain geographic areas of the country.Our comparative calculations to the S&P/Case-Shiller index provided above are not modified to account for this data pool difference.Fi
gure
4
measures, such as the Standard and Poor’s/Case-Shiller and the Federal Housing Finance Agency (FHFA) indices, which showed moderating year-over-year home price declines (see Figure 5).
Regional home price trends vary significantly. For example, the FHFA Purchase-only measure showed that home prices in the West South Central Division2
posted an increase of 1.1 percent in the fourth quar-ter from a year ago, compared with a decline of 7.2 percent for the Mountain Division3.
The decline in house prices both nationally and regionally has left many homeowners with “negative equity” in their mortgages, which means their princi-pal balance exceeds the current market value of their home. According to First American CoreLogic, Inc. approximately 11 million, or 24 percent, of all resi-dential properties with mortgages were in negative equity in the fourth quarter of 2009. This provides an incentive for borrowers to walk away from their mort-gage obligations and for the loans to become delin-quent and proceed to foreclosure. At the end of 2009, about one out of seven first-lien mortgage loans were behind on payment or in the foreclosure process, ac-cording to the Mortgage Bankers Association National Delinquency Survey.
Figu
re 6
Housing Market Remains ImbalancedMonths’ Supply or Inventory/Sales Ratio
Source: Census Bureau and the National Association of REALTORS
0
4
8
12
16
20
'04 '05 '06 '07 '08 '09 '10
Months' Supply of Existing Condos and Co-ops (Months)Months' Supply of Existing Single Family Houses (Months)Months' Supply of New Single Familiy Houses for Sale (SA, Months)
Even with record declines in homebuilding activity, the housing market continued to face a significant imbal-ance, which will continue to put downward pressure on home prices (see Figure 6). While the inventory/sales ratios of both new and existing home sales at the national level have been trending down substan-tially from their record highs, they have remained above their long-term trends of about 6-7 months. However, the national average inventory/sales ratio masks significant regional variation. Some regions, such as Florida, continue to struggle with large inven-tory overhang while others, such as California, experi-ence nearly depleted inventories.
Other economic data continue to indicate substan-tial excess supply of housing. The Housing Vacancy Survey, which offers the most comprehensive
2 West South Central Division includes Arkansas, Louisiana, Oklahoma, and Texas.3 Mountain Division includes Arizona, Colorado, Idaho, Montana, Nevada, New Mexico, and Utah. The time period of Open Enrollment is subject to change without notice.
Moderating Year-over-Year Home Price Declines
Source: First American LoanPerformance, Federal Housing Finance Agency, Standards & Poor’s
-25%
-20%
-15%
-10%
-5%
0%
5%
10%
15%
20%
'01 '02 '03 '04 '05 '06 '07 '08 '09
LoanPerformance HPI 3.0 (YoY % Change) FHFA HPI: Purchase Only (YoY % Change)S&P/Case-Shiller HPI: Composite 20 (YoY % Change)
Figu
re 5
4
measure of housing inventory, showed mixed results. The homeowner vacancy rate, which measures the share of units typically occupied by owners that are for sale and vacant, edged up from 2.6 percent in the third quarter to 2.7 percent in the fourth quarter (see Figure 7). The rate is about one percentage point higher than its long-term average, suggesting an esti-mated 780,000 units of excess supply of for-sale and vacant homes.
In contrast, the supply in the rental markets declined in the fourth quarter. The rental vacancy rate fell 0.4 percentage points to 10.7 percent from a record 11.1 percent in the third quarter. We estimate that the rate is about three percentage points higher than its his-torical norm, indicating an excess supply of 1.2 million units of vacant homes for rent at the end of last year.
These units may come back into the owner-occupied space at some point when market conditions improve, as some of these units may belong to reluctant land-lords. This potential supply of homes for sale could put further downward pressure on home prices. In any event, the excess supply of rental units is putting downward pressure on rents, making the user costs of renting more attractive than owning, depressing owner-occupied housing demand.
The share of households that own (the homeowner-ship rate) slipped further to 67.3 percent seasonally adjusted in the fourth quarter of 2009, the lowest rate since the second quarter of 2000. This rate is expect-ed to decline further based on the level of delinquent loans in the market.
Housing Market in 2010: Recovery ContinuesThere are reasons to be hopeful about the outlook for the housing market this year. Homebuilding activity started the year on a positive note, with single-family starts posting a 33 percent year-over-year gain. Single-family permits, a leading indicator of starts, pointed to a rebound in the near term as permits in-creased for three consecutive months.
There are also reasons to be cautious about the strength of the near-term outlook: excess supply of housing remains elevated, financing for construction loans continues to be constrained, and rising foreclo-sure rates threaten to add more homes to the market supply, putting downward pressure on home prices and construction demand. For all of 2010, we expect
total housing starts to increase by 30 percent from their depressed levels to 723,000, marking the first increase in five years.
Looking ahead at home sales, the main question is how much the expanded tax credit that applies to repeat buyers will spur sales this year. Both new and existing home sales started the year on a sour note, dropping sharply in January. Leading near-term indicators suggest that the tax credit may have less of an impact this year. Mortgage applications to pur-chase homes have remained near their lowest level since 1997. The pending home sales index, which measures contract signings for existing homes, fell sharply in January following a relatively flat reading in December and a 13.7 drop in November (see Figure 8).
Vacancy Rates Indicate Large Excess Supplyof Housing
Source: Census Bureau
Percent
5.0
6.0
7.0
8.0
9.0
10.0
11.0
12.0
Q1:
1990
Q1:
1991
Q1:
1992
Q1:
1993
Q1:
1994
Q1:
1995
Q1:
1996
Q1:
1997
Q1:
1998
Q1:
1999
Q1:
2000
Q1:
2001
Q1:
2002
Q1:
2003
Q1:
2004
Q1:
2005
Q1:
2006
Q1:
2007
Q1:
2008
Q1:
2009
1.0
1.5
2.0
2.5
3.0
3.5
4.0
4.5
Rental Vacancy Rate: United States (%) Homeowner Vacancy Rate: United States (%)
Figu
re 7
Figu
re 8
Vast Improvement in Home Sales Unlikely Near Term
Sources: National Association of REALTORS®, Mortgage Bankers Association
Index; 2001 = 100 Index; March 16, 1990 =100
40
50
60
70
80
90
100
110
120
130
140
'03 '04 '05 '06 '07 '08 '09 '10200
250
300
350
400
450
500
550
NAR Pending Home Sales Index (SAAR, Left Axis)MBA Mortgage Application for Purchase Index (SA, Right Axis)
5
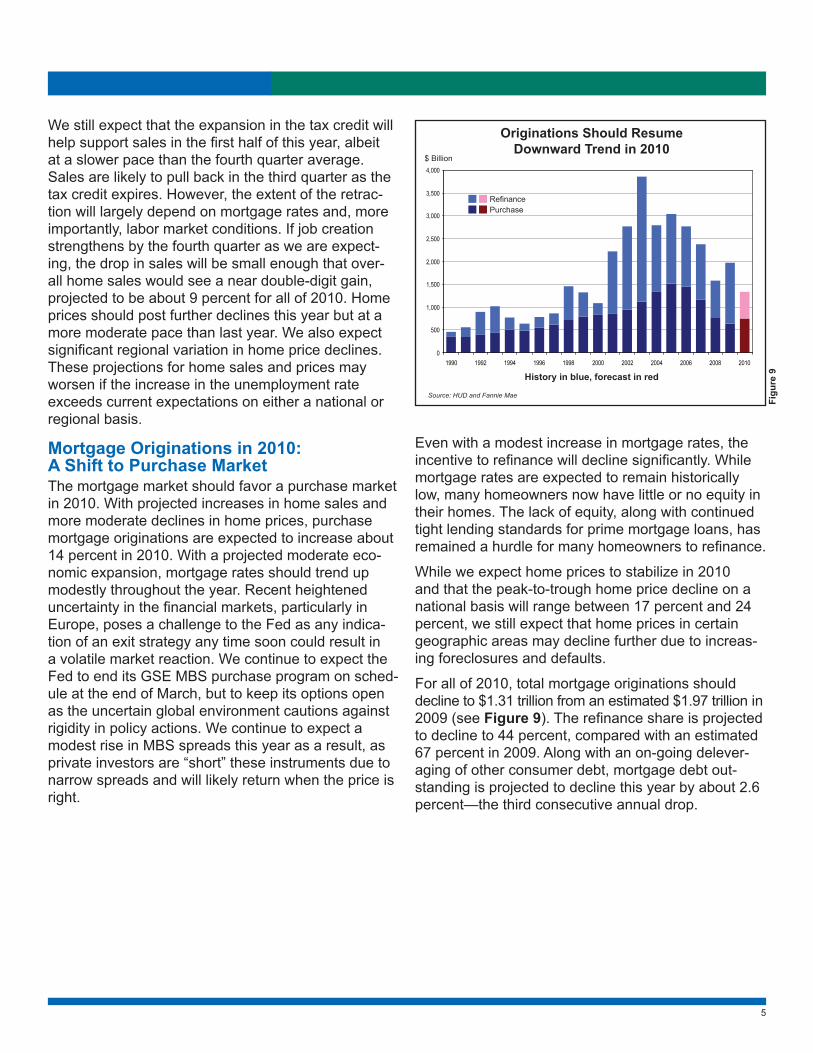
We still expect that the expansion in the tax credit will help support sales in the first half of this year, albeit at a slower pace than the fourth quarter average. Sales are likely to pull back in the third quarter as the tax credit expires. However, the extent of the retrac-tion will largely depend on mortgage rates and, more importantly, labor market conditions. If job creation strengthens by the fourth quarter as we are expect-ing, the drop in sales will be small enough that over-all home sales would see a near double-digit gain, projected to be about 9 percent for all of 2010. Home prices should post further declines this year but at a more moderate pace than last year. We also expect significant regional variation in home price declines. These projections for home sales and prices may worsen if the increase in the unemployment rate exceeds current expectations on either a national or regional basis.
Mortgage Originations in 2010: A Shift to Purchase MarketThe mortgage market should favor a purchase market in 2010. With projected increases in home sales and more moderate declines in home prices, purchase mortgage originations are expected to increase about 14 percent in 2010. With a projected moderate eco-nomic expansion, mortgage rates should trend up modestly throughout the year. Recent heightened uncertainty in the financial markets, particularly in Europe, poses a challenge to the Fed as any indica-tion of an exit strategy any time soon could result in a volatile market reaction. We continue to expect the Fed to end its GSE MBS purchase program on sched-ule at the end of March, but to keep its options open as the uncertain global environment cautions against rigidity in policy actions. We continue to expect a modest rise in MBS spreads this year as a result, as private investors are “short” these instruments due to narrow spreads and will likely return when the price is right.
Figu
re 9
Originations Should ResumeDownward Trend in 2010
History in blue, forecast in red
Source: HUD and Fannie Mae
$ Billion
0
500
1,000
1,500
2,000
2,500
3,000
3,500
4,000
1990 1992 1994 1996 1998 2000 2002 2004 2006 2008 2010
RefinancePurchase
Even with a modest increase in mortgage rates, the incentive to refinance will decline significantly. While mortgage rates are expected to remain historically low, many homeowners now have little or no equity in their homes. The lack of equity, along with continued tight lending standards for prime mortgage loans, has remained a hurdle for many homeowners to refinance.
While we expect home prices to stabilize in 2010 and that the peak-to-trough home price decline on a national basis will range between 17 percent and 24 percent, we still expect that home prices in certain geographic areas may decline further due to increas-ing foreclosures and defaults.
For all of 2010, total mortgage originations should decline to $1.31 trillion from an estimated $1.97 trillion in 2009 (see Figure 9). The refinance share is projected to decline to 44 percent, compared with an estimated 67 percent in 2009. Along with an on-going delever-aging of other consumer debt, mortgage debt out-standing is projected to decline this year by about 2.6 percent—the third consecutive annual drop.

6
ADDENDUM: Highlights of Fannie Mae’s ACCESS® ProgramBackgroundIn September 1992, Fannie Mae established Fannie Mae’s ACCESS program. The program was designed to increase the participation of minority- and women-owned broker-dealers in the markets for Fannie Mae’s debt securities. After publicizing the program broadly, we selected 10 firms to serve as the initial group of ACCESS participants. These firms officially began to act as members of Fannie Mae’s debt selling group in January 1993.
Housing and Economic Recovery Act Fannie Mae is legally bound to provide opportunities to minority- and women-owned businesses. In the wake of the passage of the Housing and Economic Recovery Act (HERA), section 1116 is devoted to making “Women and Minority Inclusion” a priority and Fannie Mae has always reached out to minority and women-owned businesses in the past. It has become even more critical that Fannie Mae strives to include these businesses in our funding activities. We will now be reporting our activity to the Federal Housing Finance Agency and our ACCESS program provides an avenue in which we involve minority- and women-owned broker-dealers in our funding activities.
ACCESSibility to Fannie Mae Debentures ACCESS firms are permitted to participate in all Fannie Mae debt programs: Short-Term Notes, includ-ing Discount Notes and Benchmark Bills; Medium-Term Notes, including callable debt securities and structured notes; and noncallable Benchmark Notes. With Short-Term Notes, all ACCESS firms are mem-bers of the primary selling group. ACCESS firms may underwrite a Medium-Term Note, or receive notes on a reallowance basis. Benchmark Notes are issued via a named syndicate. ACCESS firms may be chosen to participate as a co-manager or selling group member.
Some investors, such as certain state pension funds, are required to receive bids from minority- and wom-en-owned broker-dealers as part of their competi-tive process when purchasing investments for their portfolios. With their ability to purchase Fannie Mae debt securities in the primary market, ACCESS firms are able to offer their clients an additional breadth of investments.
ACCESS MembershipTo become an ACCESS firm, a minority- or women-owned broker-dealer must meet certain minimum requirements as well as add value to the existing program. For example, the prospective firm must either meet the minimum excess net capital require-ment of $2.5 million or provide a third-party guaranty letter. Fannie Mae has a continuing Open Enrollment4 policy, in which prospective minority- and women-owned broker-dealers are able to apply to the pro-gram throughout the year. During the application process, the prospective firm meets with Fannie Mae representatives and submits required documenta-tion. Upon the conclusion of the application process, Fannie Mae will evaluate the firm and either extend an invitation to join the program or inform the firm that they were not selected. Applicants may re-apply to the program at any time.
To retain membership in the ACCESS program, each firm must play an active role in the distribution of Fannie Mae debt securities and must provide timely financial statements. Fannie Mae continually monitors the financial standing, as well as the performance, of each ACCESS firm to ensure that the program continues to play a vital part of Fannie Mae’s funding programs.
The list of current ACCESS firms is available on Fannie Mae’s web site at the following location: http://www.fanniemae.com/markets/debt/access/index.jhtml.
Additional InformationFor more information about Fannie Mae’s ACCESS program, including program eligibility requirements, please contact Helen McNally at 202.752.7704 or [email protected].
4 The time period of Open Enrollment is subject to change without notice.

7
FundingNotes is published by Fannie Mae’sFixed-Income Securities Marketing Group
John The Losen Vice President and EditorOrawin Velz Director, EconomicsGregorio Druehl Director (202) 752-5659Helen McNally Senior Product Manager (202) 752-7704Website: http://www.fanniemae.com E-mail: [email protected] Helpline: (888) BONDHLP
© 2010, Fannie Mae. This document is based upon information and assumptions (including financial, statistical or historical data and computations based upon such data) that we consider reliable and reasonable, but we do not represent that such information, assumptions, data or computations are accurate or complete, or appropriate or useful in any particular context, including the context of any investment decision, and it should not be relied upon as such. In addition, we do not undertake to update any information, data, or computations contained herein, or to communicate any change in the opinions and estimates expressed herein. No representation is made that any strategy, performance or result illustrated herein can or will be achieved or duplicated. The effect of factors other than those assumed, including factors not mentioned, considered or foreseen, by themselves or in conjunction with other factors, could produce dramatically different performance or results. Fannie Mae is the issuer of certain securities and instruments mentioned herein and Fannie Mae or its employees may from time to time have long or short positions in, and buy or sell or engage in other transactions, as principal, with respect to or relating to such securities or instruments. Fannie Mae securities are more fully described in applicable offering circulars, prospectuses, or supplements thereto (such applicable offering circulars, prospectuses and supplements, the “Offering Documentation”), which discuss certain investment risks and contain a more complete description of such securities. All statements made herein are qualified in their entirety by reference to the Offering Documentation. An offering only may be made through delivery of the Offering Documentation. Investors considering purchasing a Fannie Mae security should consult their own financial and legal advisors for information about such security, the risks and investment considerations arising from an investment in such security, the appropriate tools to analyze such investment, and the suitability of such investment in each investor’s particular circumstances. The Debt Securities, together with interest thereon, are not guaranteed by the United States and do not constitute a debt or obligation of the United States or of any agency or instrumentality thereof other than Fannie Mae. On September 6, 2008, the Federal Housing Finance Agency, or FHFA, placed Fannie Mae into conservatorship. As the conservator, FHFA succeeded to all rights, titles, powers and privileges of Fannie Mae, and of any stockholder, officer, or director of Fannie Mae with respect to Fannie Mae and the assets of Fannie Mae. On September 7, 2008, the U.S. Treasury entered into a Senior Preferred Stock Purchase Agreement (subsequently amended) with Fannie Mae pursuant to which the U.S. Treasury committed to provide funds to Fannie Mae, under certain conditions, up to an aggregate of $200 billion. The U.S. Treasury subsequently increased its maximum funding commitment to us to include the amount necessary to accommodate any net worth deficits for calendar quarters in 2010 through 2012. For any net worth deficits after December 31, 2012, the U.S. Treasury’s remaining funding commitment will be $124.8 billion, less any positive net worth as of December 31, 2012. This Agreement contains covenants that significantly restrict our operations. In exchange for entering into this Agreement, the U.S. Treasury received $1 billion of Fannie Mae’s Senior Preferred Stock and a Warrant to purchase 79.9% of our common stock. Refer to our Current Report on Form 8-K filed with the SEC on September 11, 2008 for additional information.
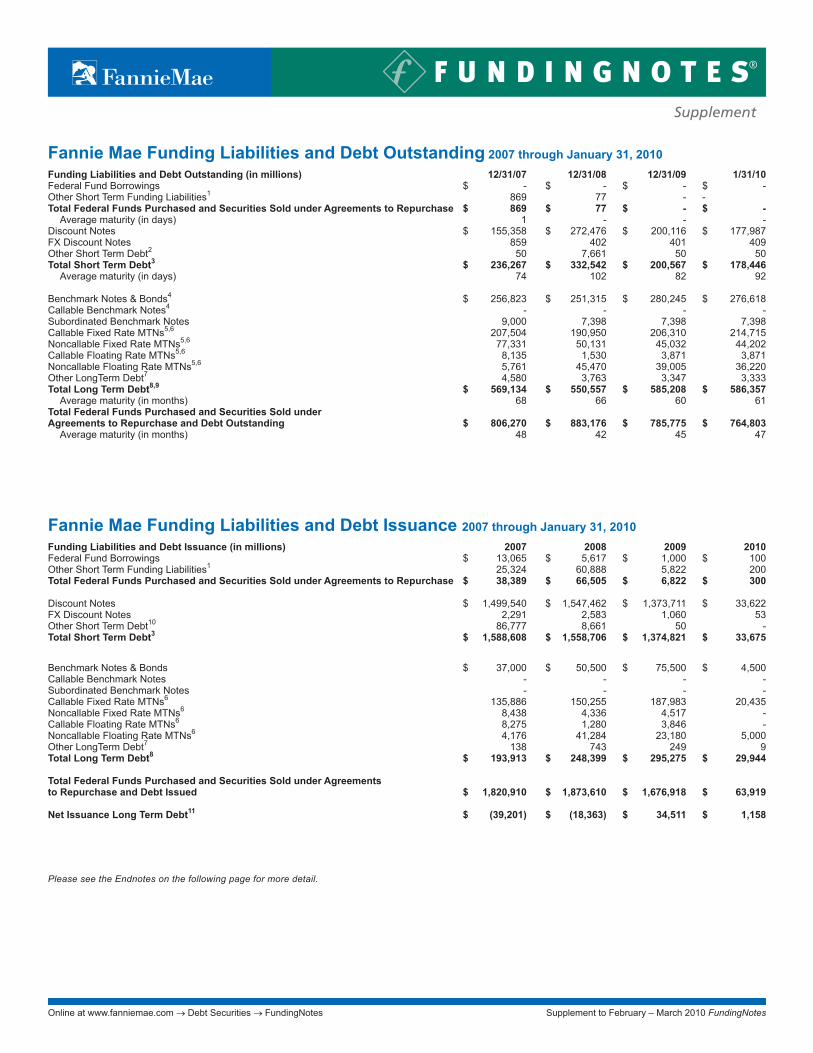
Fannie Mae Funding Liabilities and Debt Outstanding 2007 through January 31, 2010
Funding Liabilities and Debt Outstanding (in millions) 12/31/07 12/31/08 12/31/09 1/31/10Federal Fund Borrowings $ - $ - $ - $ -Other Short Term Funding Liabilities1 869 77 - -Total Federal Funds Purchased and Securities Sold under Agreements to Repurchase $ 869 $ 77 $ - $ - Average maturity (in days) 1 - - -Discount Notes $ 155,358 $ 272,476 $ 200,116 $ 177,987FX Discount Notes 859 402 401 409Other Short Term Debt2 50 7,661 50 50Total Short Term Debt3 $ 236,267 $ 332,542 $ 200,567 $ 178,446 Average maturity (in days) 74 102 82 92 Benchmark Notes & Bonds4 $ 256,823 $ 251,315 $ 280,245 $ 276,618Callable Benchmark Notes4 - - - -Subordinated Benchmark Notes 9,000 7,398 7,398 7,398Callable Fixed Rate MTNs5,6 207,504 190,950 206,310 214,715Noncallable Fixed Rate MTNs5,6 77,331 50,131 45,032 44,202Callable Floating Rate MTNs5,6 8,135 1,530 3,871 3,871Noncallable Floating Rate MTNs5,6 5,761 45,470 39,005 36,220Other LongTerm Debt7 4,580 3,763 3,347 3,333Total Long Term Debt8,9 $ 569,134 $ 550,557 $ 585,208 $ 586,357 Average maturity (in months) 68 66 60 61Total Federal Funds Purchased and Securities Sold underAgreements to Repurchase and Debt Outstanding $ 806,270 $ 883,176 $ 785,775 $ 764,803 Average maturity (in months) 48 42 45 47
Please see the Endnotes on the following page for more detail.
Fannie Mae Funding Liabilities and Debt Issuance 2007 through January 31, 2010Funding Liabilities and Debt Issuance (in millions) 2007 2008 2009 2010Federal Fund Borrowings $ 13,065 $ 5,617 $ 1,000 $ 100Other Short Term Funding Liabilities1 25,324 60,888 5,822 200Total Federal Funds Purchased and Securities Sold under Agreements to Repurchase $ 38,389 $ 66,505 $ 6,822 $ 300 Discount Notes $ 1,499,540 $ 1,547,462 $ 1,373,711 $ 33,622FX Discount Notes 2,291 2,583 1,060 53Other Short Term Debt10 86,777 8,661 50 -Total Short Term Debt3 $ 1,588,608 $ 1,558,706 $ 1,374,821 $ 33,675
Benchmark Notes & Bonds $ 37,000 $ 50,500 $ 75,500 $ 4,500Callable Benchmark Notes - - - -Subordinated Benchmark Notes - - - -Callable Fixed Rate MTNs6 135,886 150,255 187,983 20,435Noncallable Fixed Rate MTNs6 8,438 4,336 4,517 -Callable Floating Rate MTNs6 8,275 1,280 3,846 -Noncallable Floating Rate MTNs6 4,176 41,284 23,180 5,000Other LongTerm Debt7 138 743 249 9Total Long Term Debt8 $ 193,913 $ 248,399 $ 295,275 $ 29,944 Total Federal Funds Purchased and Securities Sold under Agreements to Repurchase and Debt Issued $ 1,820,910 $ 1,873,610 $ 1,676,918 $ 63,919 Net Issuance Long Term Debt11 $ (39,201) $ (18,363) $ 34,511 $ 1,158
Online at www.fanniemae.com → Debt Securities → FundingNotes
Supplement
Supplement to February – March 2010 FundingNotes
* InJuly2009thedefinitionofGlobalschangedduetoachangeinindexmethodology.Previously,ifabondwasclassifiedastheEurodollarIndex,thenitwas“Global.”Currently,ifabondisclearedinDTC,Euroclear/Clearstreamand/orotherclearances,thenitis“Global.”
** ComponentsofBroad(BIG)Index:Treasury,GSE,Corporate,Mortgage*** Includes US agencies **** Includes World Bank global issues This data has been compiled from reports supplied by Citigroup and Barclays Capital and is reproduced here with their permission. The indexes are constructed according to rulesdevelopedbythesefirmsandtheindexvaluesarecalculatedbythem.
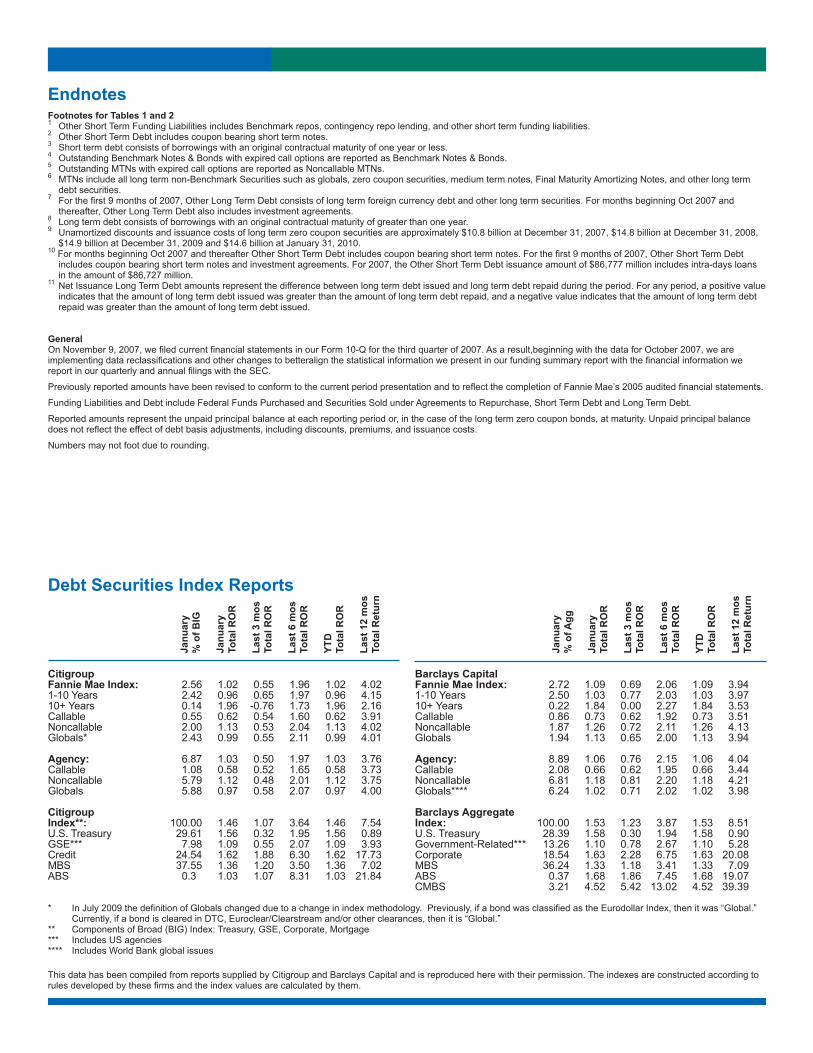
Debt Securities Index Reports
Citigroup Fannie Mae Index: 2.56 1.02 0.55 1.96 1.02 4.021-10 Years 2.42 0.96 0.65 1.97 0.96 4.1510+ Years 0.14 1.96 -0.76 1.73 1.96 2.16Callable 0.55 0.62 0.54 1.60 0.62 3.91Noncallable 2.00 1.13 0.53 2.04 1.13 4.02Globals* 2.43 0.99 0.55 2.11 0.99 4.01 Agency: 6.87 1.03 0.50 1.97 1.03 3.76Callable 1.08 0.58 0.52 1.65 0.58 3.73Noncallable 5.79 1.12 0.48 2.01 1.12 3.75Globals 5.88 0.97 0.58 2.07 0.97 4.00 Citigroup Index**: 100.00 1.46 1.07 3.64 1.46 7.54U.S. Treasury 29.61 1.56 0.32 1.95 1.56 0.89GSE*** 7.98 1.09 0.55 2.07 1.09 3.93Credit 24.54 1.62 1.88 6.30 1.62 17.73MBS 37.55 1.36 1.20 3.50 1.36 7.02ABS 0.3 1.03 1.07 8.31 1.03 21.84
Barclays Capital Fannie Mae Index: 2.72 1.09 0.69 2.06 1.09 3.941-10 Years 2.50 1.03 0.77 2.03 1.03 3.9710+ Years 0.22 1.84 0.00 2.27 1.84 3.53Callable 0.86 0.73 0.62 1.92 0.73 3.51Noncallable 1.87 1.26 0.72 2.11 1.26 4.13Globals 1.94 1.13 0.65 2.00 1.13 3.94 Agency: 8.89 1.06 0.76 2.15 1.06 4.04Callable 2.08 0.66 0.62 1.95 0.66 3.44Noncallable 6.81 1.18 0.81 2.20 1.18 4.21Globals**** 6.24 1.02 0.71 2.02 1.02 3.98 Barclays Aggregate Index: 100.00 1.53 1.23 3.87 1.53 8.51U.S. Treasury 28.39 1.58 0.30 1.94 1.58 0.90Government-Related*** 13.26 1.10 0.78 2.67 1.10 5.28Corporate 18.54 1.63 2.28 6.75 1.63 20.08MBS 36.24 1.33 1.18 3.41 1.33 7.09ABS 0.37 1.68 1.86 7.45 1.68 19.07CMBS 3.21 4.52 5.42 13.02 4.52 39.39
Janu
ary
% o
f Agg
Janu
ary
Tota
l RO
R
Last
3 m
os
Tota
l RO
R
Last
6 m
os
Tota
l RO
R
YTD
To
tal R
OR
Last
12
mos
To
tal R
etur
n
EndnotesFootnotes for Tables 1 and 21 Other Short Term Funding Liabilities includes Benchmark repos, contingency repo lending, and other short term funding liabilities.2 Other Short Term Debt includes coupon bearing short term notes. 3 Short term debt consists of borrowings with an original contractual maturity of one year or less.4 Outstanding Benchmark Notes & Bonds with expired call options are reported as Benchmark Notes & Bonds.5 Outstanding MTNs with expired call options are reported as Noncallable MTNs.6 MTNs include all long term non-Benchmark Securities such as globals, zero coupon securities, medium term notes, Final Maturity Amortizing Notes, and other long term
debt securities.7 Forthefirst9monthsof2007,OtherLongTermDebtconsistsoflongtermforeigncurrencydebtandotherlongtermsecurities.FormonthsbeginningOct2007and
thereafter, Other Long Term Debt also includes investment agreements.8 Long term debt consists of borrowings with an original contractual maturity of greater than one year.9 Unamortized discounts and issuance costs of long term zero coupon securities are approximately $10.8 billion at December 31, 2007, $14.8 billion at December 31, 2008,
$14.9 billion at December 31, 2009 and $14.6 billion at January 31, 2010.10FormonthsbeginningOct2007andthereafterOtherShortTermDebtincludescouponbearingshorttermnotes.Forthefirst9monthsof2007,OtherShortTermDebt
includes coupon bearing short term notes and investment agreements. For 2007, the Other Short Term Debt issuance amount of $86,777 million includes intra-days loans in the amount of $86,727 million.
11 Net Issuance Long Term Debt amounts represent the difference between long term debt issued and long term debt repaid during the period. For any period, a positive value indicates that the amount of long term debt issued was greater than the amount of long term debt repaid, and a negative value indicates that the amount of long term debt repaid was greater than the amount of long term debt issued.
GeneralOnNovember9,2007,wefiledcurrentfinancialstatementsinourForm10-Qforthethirdquarterof2007.Asaresult,beginningwiththedataforOctober2007,weareimplementingdatareclassificationsandotherchangestobetteralignthestatisticalinformationwepresentinourfundingsummaryreportwiththefinancialinformationwereportinourquarterlyandannualfilingswiththeSEC.
PreviouslyreportedamountshavebeenrevisedtoconformtothecurrentperiodpresentationandtoreflectthecompletionofFannieMae’s2005auditedfinancialstatements.
FundingLiabilitiesandDebtincludeFederalFundsPurchasedandSecuritiesSoldunderAgreementstoRepurchase,ShortTermDebtandLongTermDebt.
Reported amounts represent the unpaid principal balance at each reporting period or, in the case of the long term zero coupon bonds, at maturity. Unpaid principal balance doesnotreflecttheeffectofdebtbasisadjustments,includingdiscounts,premiums,andissuancecosts.
Numbers may not foot due to rounding.
Janu
ary
% o
f BIG
Janu
ary
Tota
l RO
R
Last
3 m
os
Tota
l RO
R
Last
6 m
os
Tota
l RO
R
YTD
To
tal R
OR
Last
12
mos
To
tal R
etur
n
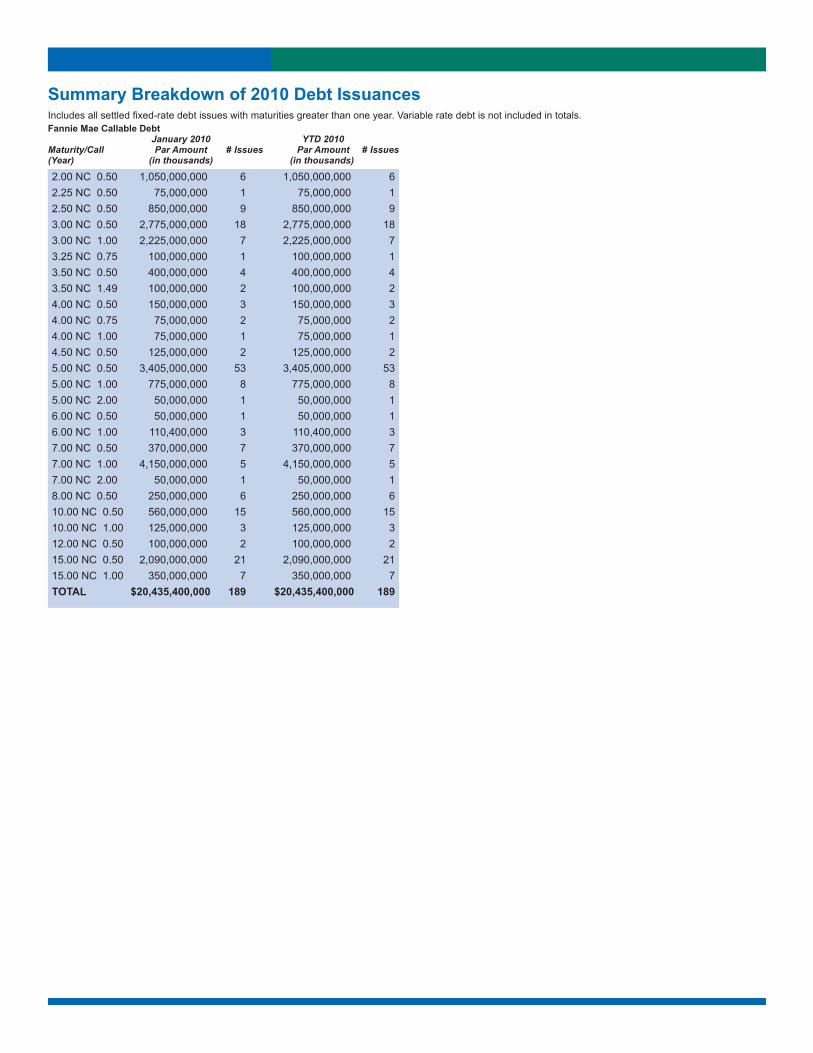
Summary Breakdown of 2010 Debt IssuancesIncludesallsettledfixed-ratedebtissueswithmaturitiesgreaterthanoneyear.Variableratedebtisnotincludedintotals.
2.00 NC 0.50 1,050,000,000 6 1,050,000,000 62.25 NC 0.50 75,000,000 1 75,000,000 12.50 NC 0.50 850,000,000 9 850,000,000 93.00 NC 0.50 2,775,000,000 18 2,775,000,000 183.00 NC 1.00 2,225,000,000 7 2,225,000,000 73.25 NC 0.75 100,000,000 1 100,000,000 13.50 NC 0.50 400,000,000 4 400,000,000 43.50 NC 1.49 100,000,000 2 100,000,000 24.00 NC 0.50 150,000,000 3 150,000,000 34.00 NC 0.75 75,000,000 2 75,000,000 24.00 NC 1.00 75,000,000 1 75,000,000 14.50 NC 0.50 125,000,000 2 125,000,000 25.00 NC 0.50 3,405,000,000 53 3,405,000,000 535.00 NC 1.00 775,000,000 8 775,000,000 85.00 NC 2.00 50,000,000 1 50,000,000 16.00 NC 0.50 50,000,000 1 50,000,000 16.00 NC 1.00 110,400,000 3 110,400,000 37.00 NC 0.50 370,000,000 7 370,000,000 77.00 NC 1.00 4,150,000,000 5 4,150,000,000 57.00 NC 2.00 50,000,000 1 50,000,000 18.00 NC 0.50 250,000,000 6 250,000,000 610.00 NC 0.50 560,000,000 15 560,000,000 1510.00 NC 1.00 125,000,000 3 125,000,000 312.00 NC 0.50 100,000,000 2 100,000,000 215.00 NC 0.50 2,090,000,000 21 2,090,000,000 2115.00 NC 1.00 350,000,000 7 350,000,000 7TOTAL $20,435,400,000 189 $20,435,400,000 189
Fannie Mae Callable Debt January 2010 YTD 2010 Maturity/Call Par Amount # Issues Par Amount # Issues(Year) (in thousands) (in thousands)
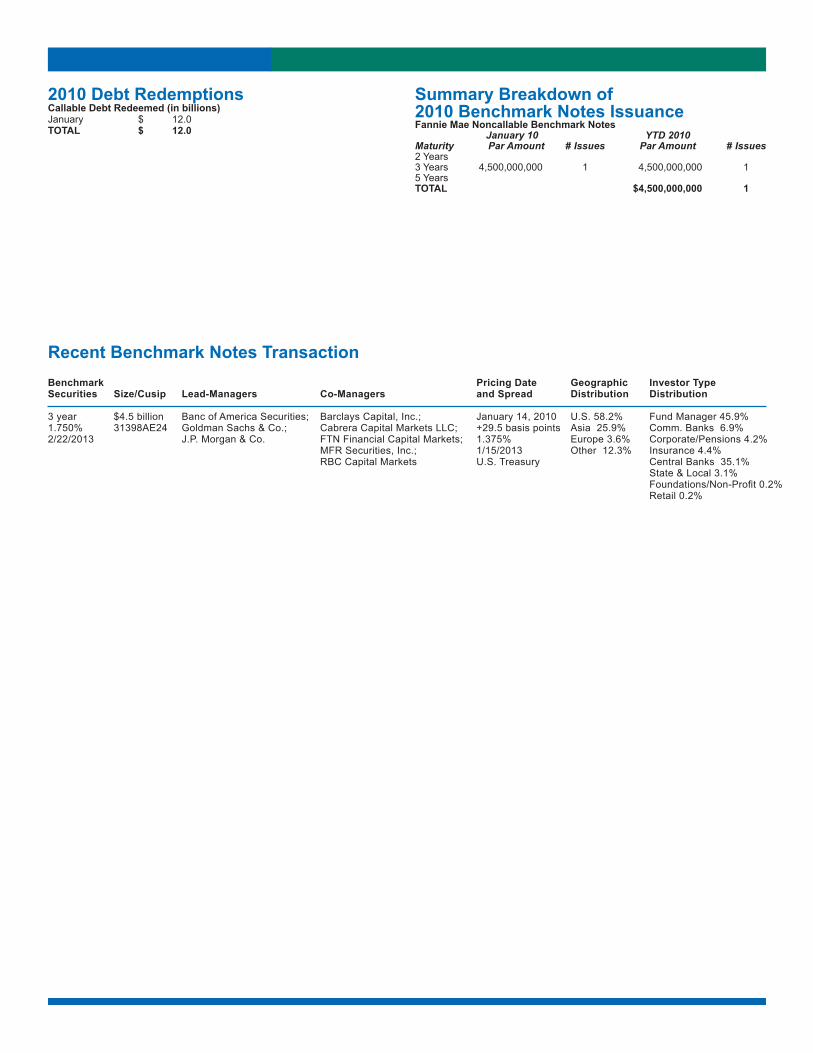
2010 Debt RedemptionsCallable Debt Redeemed (in billions)January $ 12.0TOTAL $ 12.0
Summary Breakdown of 2010 Benchmark Notes IssuanceFannie Mae Noncallable Benchmark Notes January 10 YTD 2010 Maturity Par Amount # Issues Par Amount # Issues2 Years3 Years 4,500,000,000 1 4,500,000,000 15 YearsTOTAL $4,500,000,000 1
Recent Benchmark Notes TransactionBenchmark Securities
3 year1.750%2/22/2013
Size/Cusip
$4.5 billion31398AE24
Co-Managers
Barclays Capital, Inc.;Cabrera Capital Markets LLC;FTN Financial Capital Markets;MFR Securities, Inc.;RBC Capital Markets
Pricing Date and Spread
January 14, 2010+29.5 basis points1.375%1/15/2013U.S. Treasury
Geographic Distribution
U.S. 58.2%Asia 25.9%Europe3.6%Other 12.3%
Investor TypeDistribution
Fund Manager 45.9%Comm. Banks 6.9%Corporate/Pensions4.2%Insurance 4.4%Central Banks 35.1%State & Local 3.1%Foundations/Non-Profit0.2%Retail 0.2%
Lead-Managers
Banc of America Securities;GoldmanSachs&Co.;J.P.Morgan&Co.