Mortgage Lender Sentiment Survey® - Fannie Mae
65
© 2020 Fannie Mae. Trademarks of Fannie Mae. © 2020 Fannie Mae. Trademarks of Fannie Mae. Mortgage Lender Sentiment Survey® Providing Insights Into Current Lending Activities and Market Expectations Q4 2020 Full Report – published December 9, 2020
Transcript of Mortgage Lender Sentiment Survey® - Fannie Mae
© 2020 Fannie Mae. Trademarks of Fannie Mae.
© 2020 Fannie Mae. Trademarks of Fannie Mae.
Mortgage Lender Sentiment Survey®
Providing Insights Into Current Lending Activities and Market Expectations Q4 2020 Full Report – published December 9, 2020
© 2020 Fannie Mae. Trademarks of Fannie Mae.2
Opinions, analyses, estimates, forecasts, and other views of Fannie Mae's Economic & Strategic Research (ESR) group or survey respondents included in these materials should not be construed as indicating Fannie Mae's business prospects or expected results, are based on a number of assumptions, and are subject to change without notice. How this information affects Fannie Mae will depend on many factors. Although the ESR group bases its opinions, analyses, estimates, forecasts, and other views on information it considers reliable, it does not guarantee that the information provided in these materials is accurate, current, or suitable for any particular purpose. Changes in the assumptions or the information underlying these views could produce materially different results. The analyses, opinions, estimates, forecasts, and other views published by the ESR group represent the views of that group or survey respondents as of the date indicated and do not necessarily represent the views of Fannie Mae or its management.
Disclaimer
Q4 2020 Mortgage Lender Sentiment Survey®

© 2020 Fannie Mae. Trademarks of Fannie Mae.
Table of ContentsSummary of Key Findings………………………………………………………………………………………….……..………………………………………….. 4
Research Objectives…………………………………………………………………………………………………………………………………………………… 5
Q4 2020 Respondent Sample and Groups…..………………………………………………………………..................................................................... 6
Key Findings
U.S. Economy and Consumer Demand (Purchase and Refinance Mortgages)…......................................................................................................................................... 8
Credit Standards……………..………………………………………………………………………………………………………..................................................................... 12
Profit Margin Outlook…………………………………………………………………………………………………………………................................................................... 14
Appendix………………………………………………………………………………………………………………………………………………………………… 18
Survey Methodology Details………………………………………………………………………………………………………………………………………………………… 19
Economic and Housing Sentiment……………………………………………………………………………………………............................................................................. 27
Consumer Demand (Purchase Mortgages)………………………………………………………………………………………………………………………………..……….. 30
Consumer Demand (Refinance Mortgages)………………………………………………………………………………………………………………………………..………. 43
Credit Standards………………....................................................................................................................................................................................................................... 50
Profit Margin Outlook……………………………………………………………………………………………………………………………………………………...………… 58
Survey Question Text……………………………………………………………………………………………………………………………………………………….………... 63
© 2020 Fannie Mae. Trademarks of Fannie Mae.4
The latest survey showed signs of continued optimism for the mortgage industry with strong mortgage demand reported, but lenders now expect less profitability and further tightening of credit standards moving into 2021.
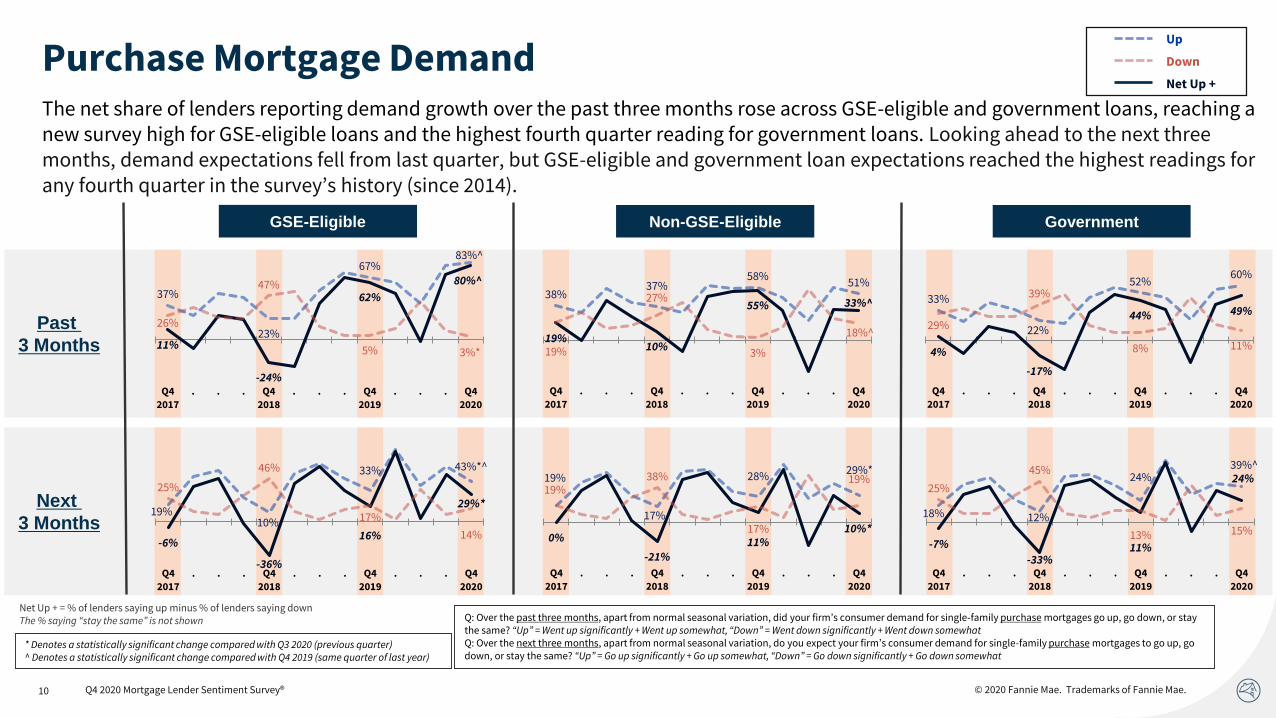
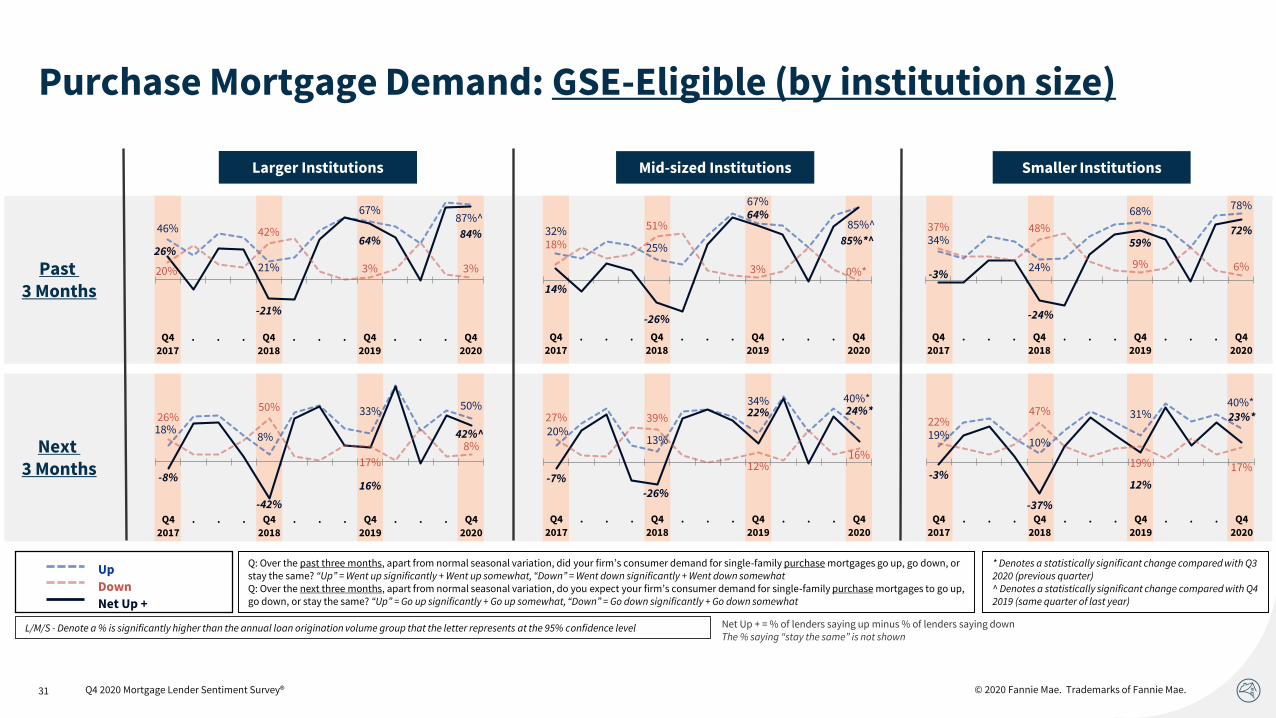
• For purchase mortgages, the net share of lenders reporting demand growth over the past three months rose across GSE-eligible and government loans, reaching a new survey high for GSE-eligible loans and the highest fourth quarter reading for government loans. Looking ahead to the next three months, demand expectations fell from last quarter, but GSE-eligible and government loan expectations reached the highest readings for any fourth quarter in the survey’s history (since 2014).
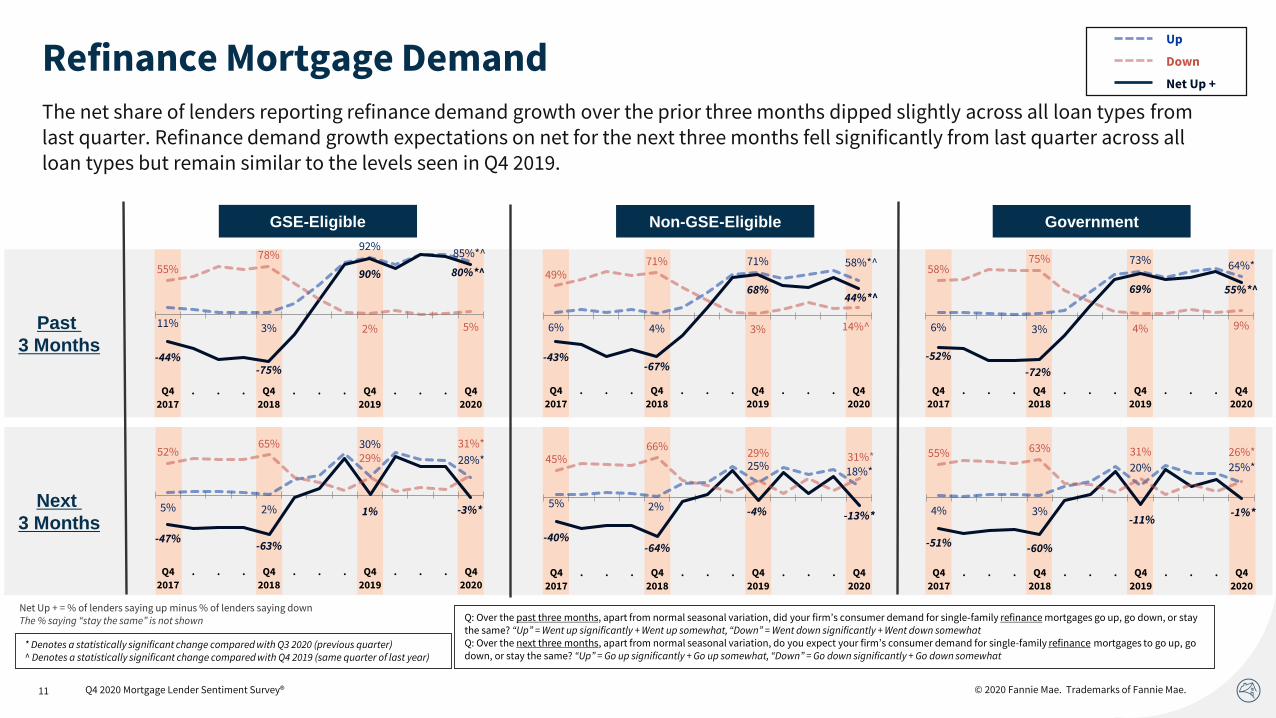
• For refinance mortgages, the net share of lenders reporting refinance demand growth over the prior three months dipped slightly across all loan types from last quarter. Refinance demand growth expectations on net for the next three months fell significantly from last quarter across all loan types but remain similar to the levels seen in Q4 2019.
• Lenders’ net profit margin outlook declined significantly this quarter, with a higher share of lenders expecting profit margins to decrease. “Competition from other lenders” and “GSE pricing and policies” were cited as the top reasons by those lenders expecting lower profit margins.
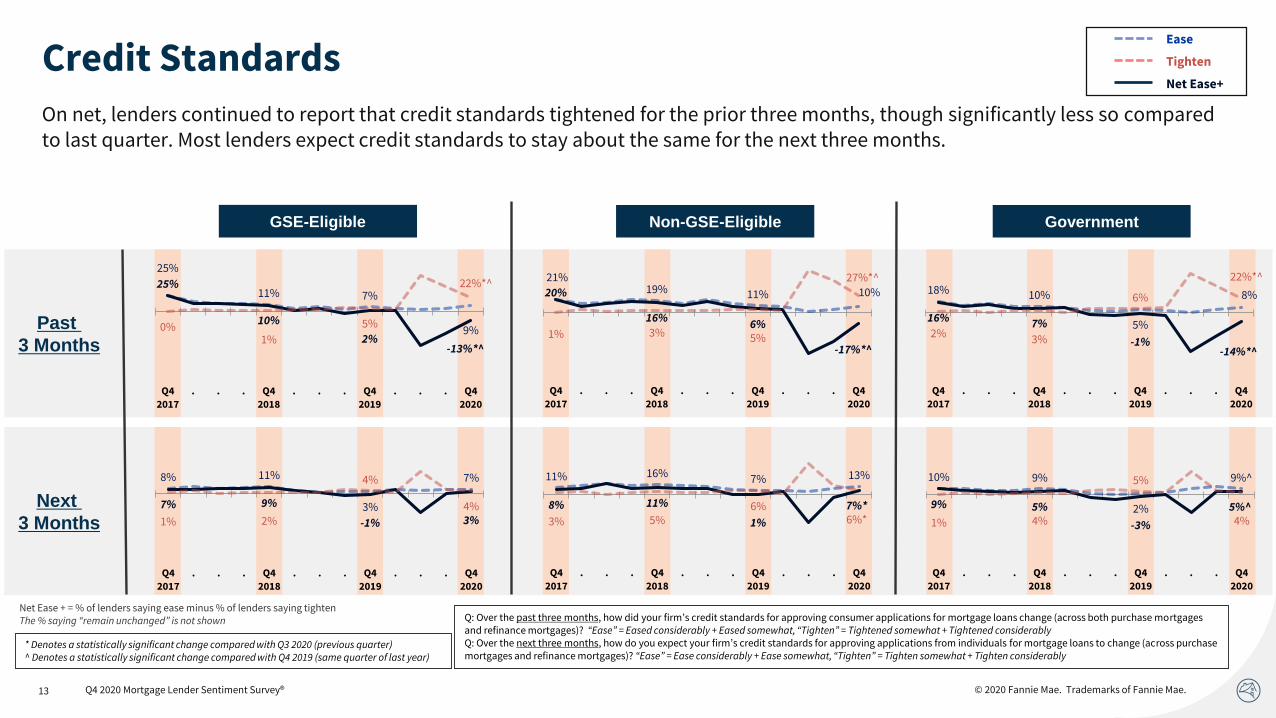
• On net, lenders continued to report that credit standards tightened for the prior three months, though significantly less so compared to last quarter. Most lenders expect credit standards to stay about the same for the next three months.
Key Findings – Q4 2020
Mortgage Demand
Profit Margin Outlook
Q4 2020 Mortgage Lender Sentiment Survey®
Credit Standards
© 2020 Fannie Mae. Trademarks of Fannie Mae.
The Mortgage Lender Sentiment Survey® (MLSS), which debuted in March 2014, is a quarterly online survey among senior executives in the mortgage industry. The survey is unique because it is used not only to track lenders’ current impressions of the mortgage industry, but also their insights into the future.
Objectives of Mortgage Lender Sentiment Survey®
Tracks insights and provides benchmarks into current and future mortgage lending activities and practices.
Quarterly Regular Questions
– Consumer Mortgage Demand
– Credit Standards
– Profit Margin Outlook
Featured Specific Topic Analyses
– CONDO Mortgage Lending Opportunities
– COVID-19 Challenges and Lender Business Priorities
– Impact of Technology on Lender Workforce Management
– Business Priorities and Industry Competition
– APIs and Mortgage Lending
– Artificial Intelligence for Mortgage Lending
The MLSS is a quarterly 10-15 minute online survey of senior executives, such as CEOs and CFOs, of Fannie Mae’s lending institution customers. The results are reported at the lending institution parent-company level. If more than one individual from the same institution completes the survey, their responses are averaged to represent their parent company.
5 Q4 2020 Mortgage Lender Sentiment Survey®
© 2020 Fannie Mae. Trademarks of Fannie Mae.6 Q4 2020 Mortgage Lender Sentiment Survey®
Smaller Institutions Bottom 65% of lenders
Larger Institutions Top 15% of lenders
Mid-sized Institutions Top 16% - 35% of lenders
100%
85%
65%
Lender Size Groups**
LOWER loan origination volume
HIGHER loan origination volume
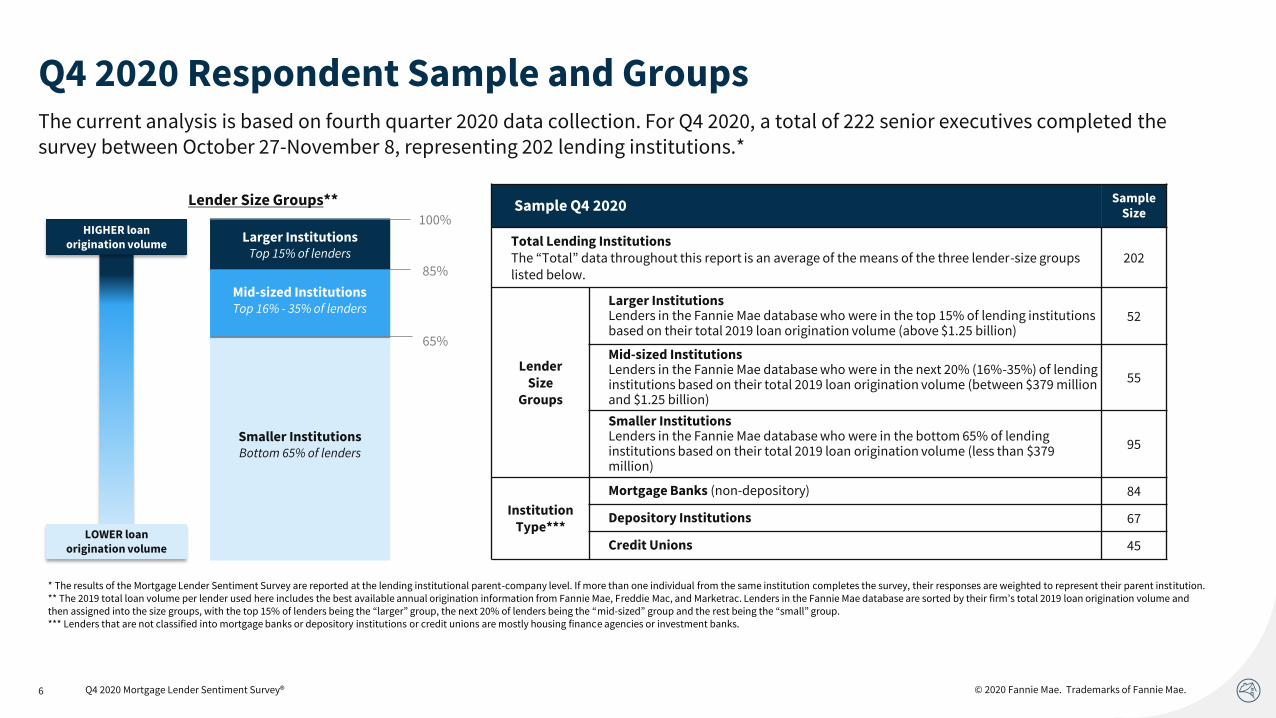
The current analysis is based on fourth quarter 2020 data collection. For Q4 2020, a total of 222 senior executives completed the survey between October 27-November 8, representing 202 lending institutions.*
Q4 2020 Respondent Sample and Groups
Sample Q4 2020Sample
Size
Total Lending InstitutionsThe “Total” data throughout this report is an average of the means of the three lender-size groups listed below.
202
Lender Size
Groups
Larger InstitutionsLenders in the Fannie Mae database who were in the top 15% of lending institutions based on their total 2019 loan origination volume (above $1.25 billion)
52
Mid-sized Institutions Lenders in the Fannie Mae database who were in the next 20% (16%-35%) of lending institutions based on their total 2019 loan origination volume (between $379 million and $1.25 billion)
55
Smaller Institutions Lenders in the Fannie Mae database who were in the bottom 65% of lending institutions based on their total 2019 loan origination volume (less than $379 million)
95
Institution Type***
Mortgage Banks (non-depository) 84
Depository Institutions 67
Credit Unions 45
* The results of the Mortgage Lender Sentiment Survey are reported at the lending institutional parent-company level. If more than one individual from the same institution completes the survey, their responses are weighted to represent their parent institution. ** The 2019 total loan volume per lender used here includes the best available annual origination information from Fannie Mae, Freddie Mac, and Marketrac. Lenders in the Fannie Mae database are sorted by their firm’s total 2019 loan origination volume and then assigned into the size groups, with the top 15% of lenders being the “larger” group, the next 20% of lenders being the “mid-sized” group and the rest being the “small” group.*** Lenders that are not classified into mortgage banks or depository institutions or credit unions are mostly housing finance agencies or investment banks.
© 2020 Fannie Mae. Trademarks of Fannie Mae.7
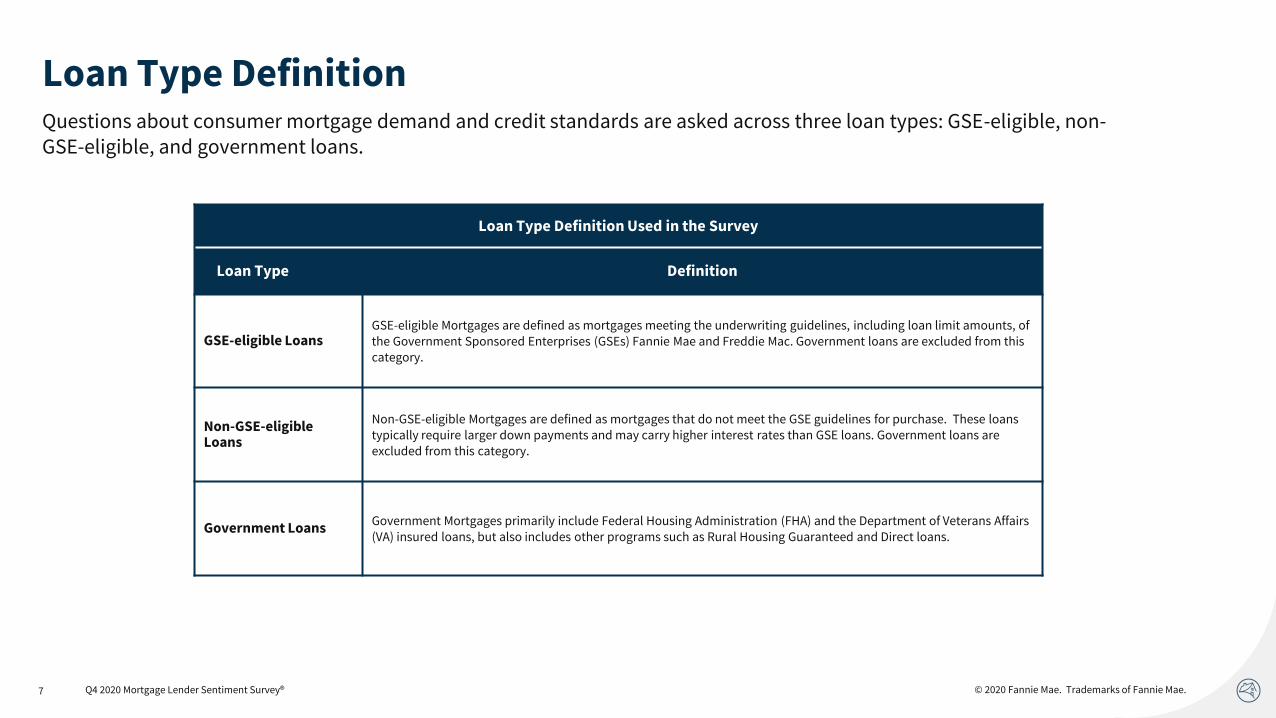
Loan Type DefinitionQuestions about consumer mortgage demand and credit standards are asked across three loan types: GSE-eligible, non-GSE-eligible, and government loans.
Loan Type Definition Used in the Survey
Loan Type Definition
GSE-eligible LoansGSE-eligible Mortgages are defined as mortgages meeting the underwriting guidelines, including loan limit amounts, of the Government Sponsored Enterprises (GSEs) Fannie Mae and Freddie Mac. Government loans are excluded from this category.
Non-GSE-eligible Loans
Non-GSE-eligible Mortgages are defined as mortgages that do not meet the GSE guidelines for purchase. These loans typically require larger down payments and may carry higher interest rates than GSE loans. Government loans are excluded from this category.
Government LoansGovernment Mortgages primarily include Federal Housing Administration (FHA) and the Department of Veterans Affairs (VA) insured loans, but also includes other programs such as Rural Housing Guaranteed and Direct loans.
Q4 2020 Mortgage Lender Sentiment Survey®
© 2020 Fannie Mae. Trademarks of Fannie Mae.8
U.S. Economy and Consumer Demand
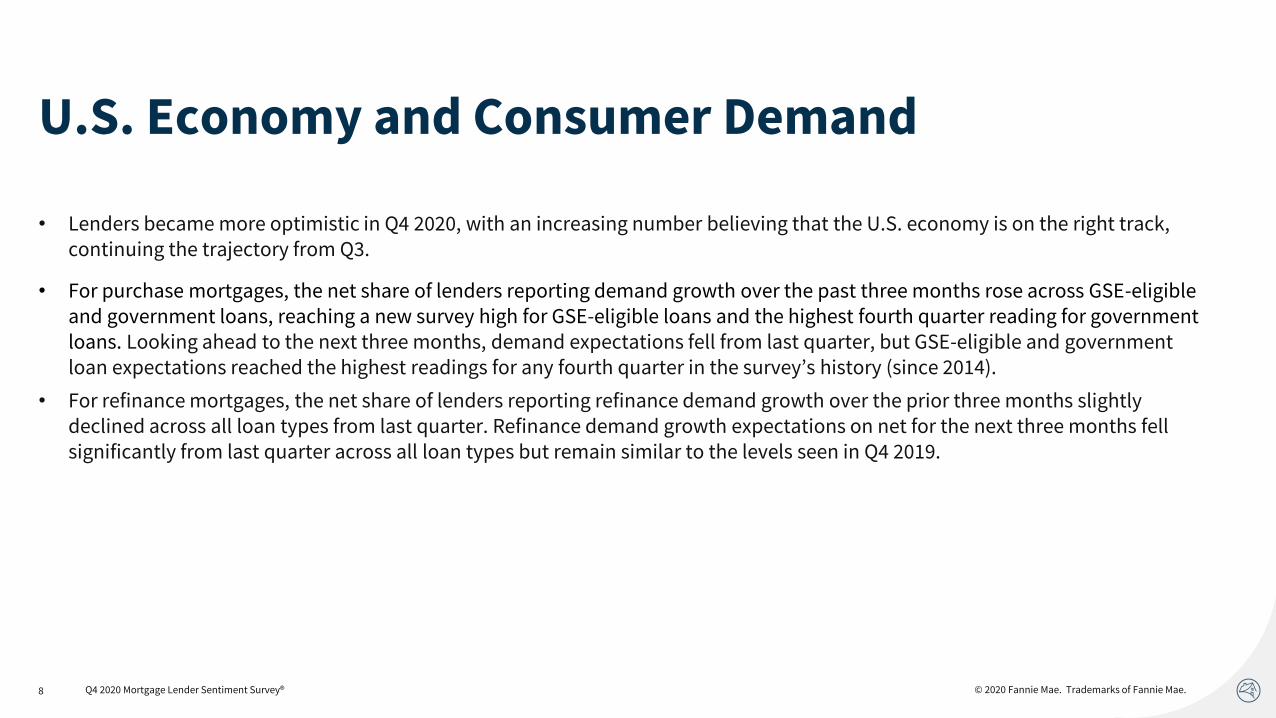
• Lenders became more optimistic in Q4 2020, with an increasing number believing that the U.S. economy is on the right track, continuing the trajectory from Q3.
• For purchase mortgages, the net share of lenders reporting demand growth over the past three months rose across GSE-eligible and government loans, reaching a new survey high for GSE-eligible loans and the highest fourth quarter reading for government loans. Looking ahead to the next three months, demand expectations fell from last quarter, but GSE-eligible and government loan expectations reached the highest readings for any fourth quarter in the survey’s history (since 2014).
• For refinance mortgages, the net share of lenders reporting refinance demand growth over the prior three months slightly declined across all loan types from last quarter. Refinance demand growth expectations on net for the next three months fell significantly from last quarter across all loan types but remain similar to the levels seen in Q4 2019.
Q4 2020 Mortgage Lender Sentiment Survey®
© 2020 Fannie Mae. Trademarks of Fannie Mae.9
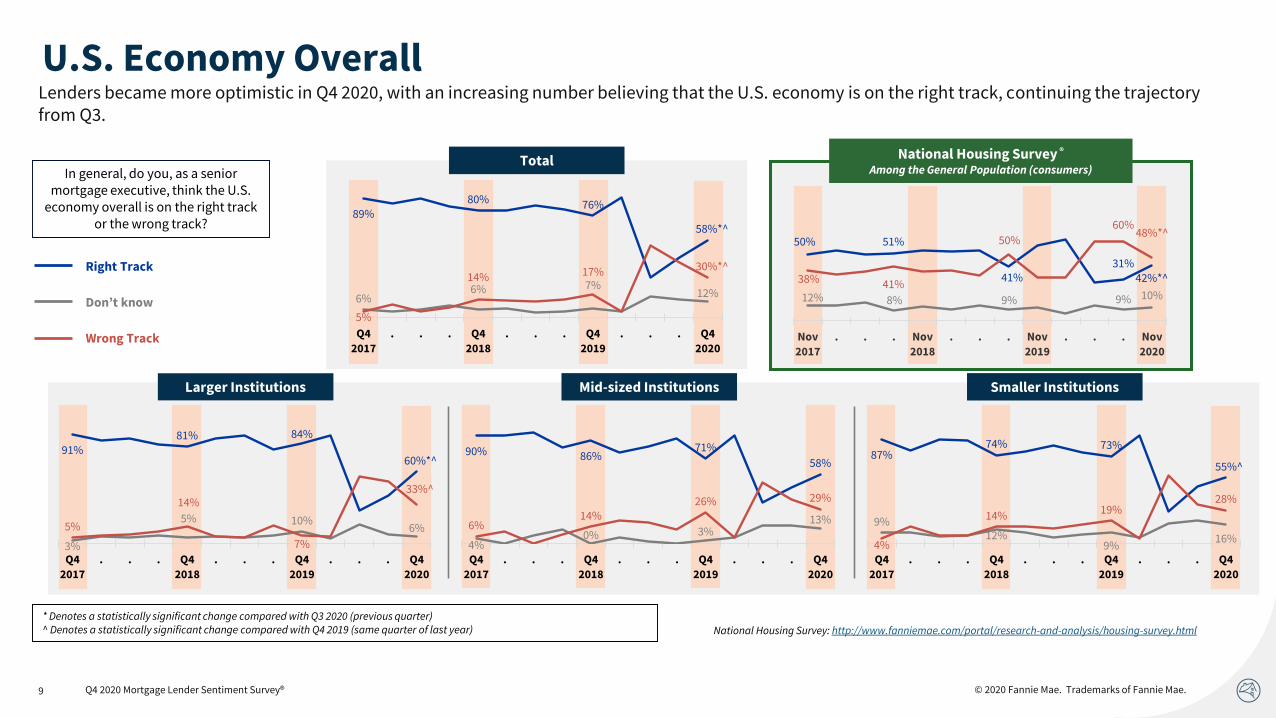
* Denotes a statistically significant change compared with Q3 2020 (previous quarter)^ Denotes a statistically significant change compared with Q4 2019 (same quarter of last year) National Housing Survey: http://www.fanniemae.com/portal/research-and-analysis/housing-survey.html
In general, do you, as a senior mortgage executive, think the U.S.
economy overall is on the right track or the wrong track?
Total
Larger Institutions Mid-sized Institutions Smaller Institutions
National Housing Survey ®
Among the General Population (consumers)
89%80% 76%
58%*^
6%6% 7%
12%
5%
14% 17% 30%*^
Q4
2017
. . . Q4
2018
. . . Q4
2019
. . . Q4
2020
50% 51%
41%31%
42%*^
12% 8% 9% 9% 10%
38% 41%
50%
60%48%*^
Nov
2017
. . . Nov
2018
. . . Nov
2019
. . . Nov
2020
91%81% 84%
60%*^
3%
5% 10%6%5%
14%
7%
33%^
Q4
2017
. . . Q4
2018
. . . Q4
2019
. . . Q4
2020
90% 86%71%
58%
4%0% 3%
13%6%14%
26% 29%
Q4
2017
. . . Q4
2018
. . . Q4
2019
. . . Q4
2020
87%74% 73%
55%^
9%12%
9%16%
4%
14%19%
28%
Q4
2017
. . . Q4
2018
. . . Q4
2019
. . . Q4
2020
Q4 2020 Mortgage Lender Sentiment Survey®
Right Track
Don’t know
Wrong Track
Lenders became more optimistic in Q4 2020, with an increasing number believing that the U.S. economy is on the right track, continuing the trajectory from Q3.
U.S. Economy Overall
© 2020 Fannie Mae. Trademarks of Fannie Mae.10
The net share of lenders reporting demand growth over the past three months rose across GSE-eligible and government loans, reaching a new survey high for GSE-eligible loans and the highest fourth quarter reading for government loans. Looking ahead to the next three months, demand expectations fell from last quarter, but GSE-eligible and government loan expectations reached the highest readings for any fourth quarter in the survey’s history (since 2014).
Purchase Mortgage Demand
Q: Over the past three months, apart from normal seasonal variation, did your firm’s consumer demand for single-family purchase mortgages go up, go down, or stay the same? “Up” = Went up significantly + Went up somewhat, “Down” = Went down significantly + Went down somewhatQ: Over the next three months, apart from normal seasonal variation, do you expect your firm’s consumer demand for single-family purchase mortgages to go up, go down, or stay the same? “Up” = Go up significantly + Go up somewhat, “Down” = Go down significantly + Go down somewhat
Net Up + = % of lenders saying up minus % of lenders saying downThe % saying “stay the same” is not shown
* Denotes a statistically significant change compared with Q3 2020 (previous quarter)^ Denotes a statistically significant change compared with Q4 2019 (same quarter of last year)
Non-GSE-EligibleGSE-Eligible Government
Past
3 Months
Next
3 Months
37%
23%
67%83%^
11%
-24%
62%
80%^
26%
47%
5% 3%*
Q4
2017
. . . Q4
2018
. . . Q4
2019
. . . Q4
2020
38%37%
58%51%
19%10%
55% 33%^
19%
27%
3%
18%^
Q4
2017
. . . Q4
2018
. . . Q4
2019
. . . Q4
2020
33%
22%
52%60%
4%
-17%
44% 49%29%
39%
8% 11%
Q4
2017
. . . Q4
2018
. . . Q4
2019
. . . Q4
2020
19%10%
33% 43%*^
-6%
-36%
16%
29%*
25%
46%
17%
14%
Q4
2017
. . . Q4
2018
. . . Q4
2019
. . . Q4
2020
19%
17%
28%29%*
0%
-21%11%
10%*
19%38%
17%
19%
Q4
2017
. . . Q4
2018
. . . Q4
2019
. . . Q4
2020
18% 12%
24%39%^
-7%
-33%11%
24%25%
45%
13% 15%
Q4
2017
. . . Q4
2018
. . . Q4
2019
. . . Q4
2020
Q4 2020 Mortgage Lender Sentiment Survey®
Up
Net Up +
Down
© 2020 Fannie Mae. Trademarks of Fannie Mae.11
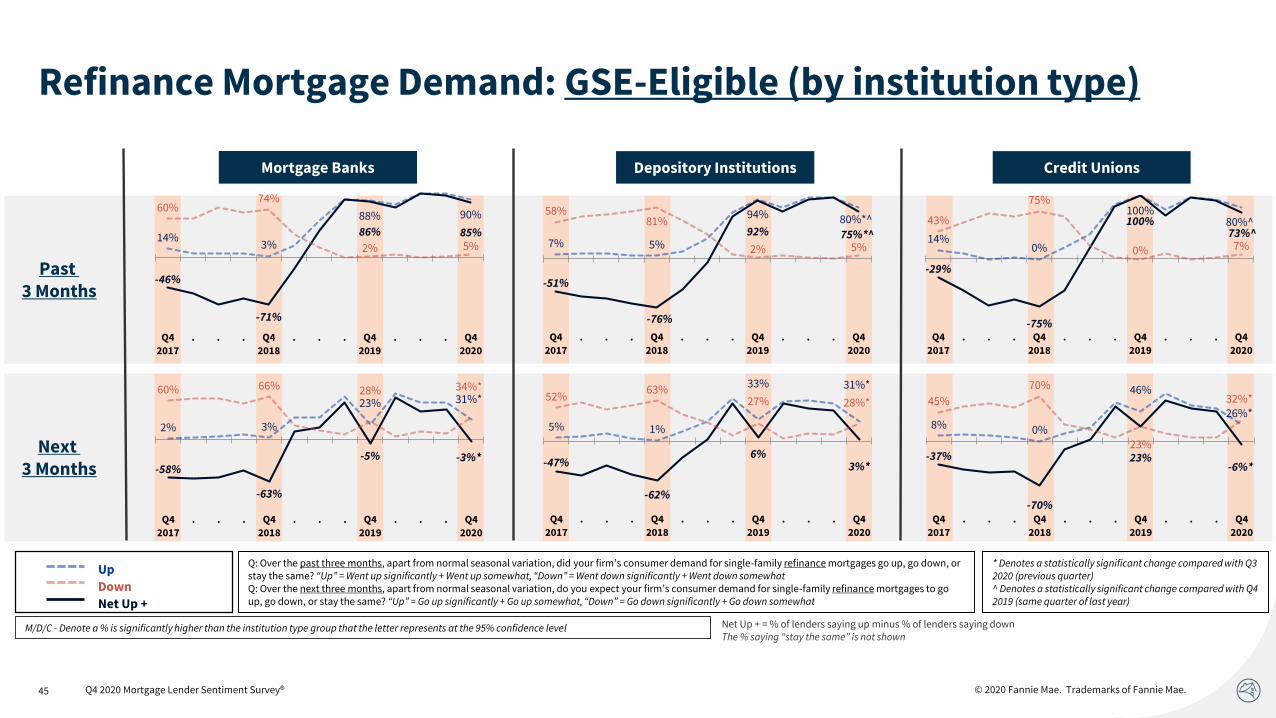
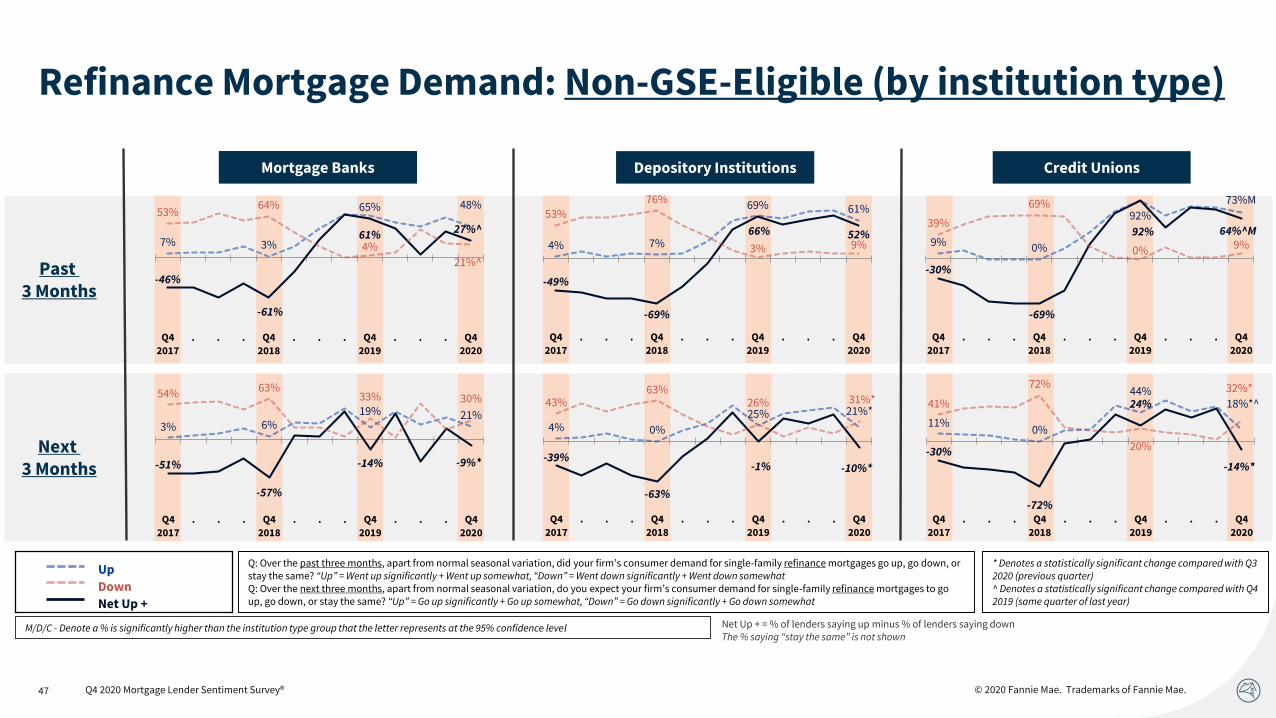
The net share of lenders reporting refinance demand growth over the prior three months dipped slightly across all loan types from last quarter. Refinance demand growth expectations on net for the next three months fell significantly from last quarter across all loan types but remain similar to the levels seen in Q4 2019.
Refinance Mortgage Demand
Q: Over the past three months, apart from normal seasonal variation, did your firm’s consumer demand for single-family refinance mortgages go up, go down, or stay the same? “Up” = Went up significantly + Went up somewhat, “Down” = Went down significantly + Went down somewhatQ: Over the next three months, apart from normal seasonal variation, do you expect your firm’s consumer demand for single-family refinance mortgages to go up, go down, or stay the same? “Up” = Go up significantly + Go up somewhat, “Down” = Go down significantly + Go down somewhat
* Denotes a statistically significant change compared with Q3 2020 (previous quarter)^ Denotes a statistically significant change compared with Q4 2019 (same quarter of last year)
Up
Net Up +
Down
Up
Net Up +
Down
Q4 2020 Mortgage Lender Sentiment Survey®
6% 4%
71% 58%*^
-43%-67%
68%44%*^
49%71%
3% 14%^
Q4
2017. . . Q4
2018. . . Q4
2019. . . Q4
2020
11% 3%
92%85%*^
-44%-75%
90% 80%*^55%78%
2% 5%
Q4
2017
. . . Q4
2018
. . . Q4
2019
. . . Q4
2020
6% 3%
73% 64%*
-52%
-72%
69% 55%*^
58%75%
4% 9%
Q4
2017. . . Q4
2018. . . Q4
2019. . . Q4
2020
5% 2%
25% 18%*
-40%-64%
-4% -13%*
45%66%
29% 31%*
Q4
2017
. . . Q4
2018
. . . Q4
2019
. . . Q4
2020
5% 2%
30%
28%*
-47%-63%
1% -3%*
52%65%
29%31%*
Q4
2017
. . . Q4
2018
. . . Q4
2019
. . . Q4
2020
4% 3%
20% 25%*
-51% -60%
-11%-1%*
55% 63% 31% 26%*
Q4
2017
. . . Q4
2018
. . . Q4
2019
. . . Q4
2020
Past
3 Months
Next
3 Months
Net Up + = % of lenders saying up minus % of lenders saying downThe % saying “stay the same” is not shown
Non-GSE-EligibleGSE-Eligible Government
Up
Net Up +
Down
© 2020 Fannie Mae. Trademarks of Fannie Mae.12
Credit Standards
• On net, lenders continued to report that credit standards tightened for the prior three months, though significantly less so compared to last quarter. Most lenders expect credit standards to stay about the same for the next three months.
Q4 2020 Mortgage Lender Sentiment Survey®
© 2020 Fannie Mae. Trademarks of Fannie Mae.13
On net, lenders continued to report that credit standards tightened for the prior three months, though significantly less so compared to last quarter. Most lenders expect credit standards to stay about the same for the next three months.
Credit Standards
Q: Over the past three months, how did your firm’s credit standards for approving consumer applications for mortgage loans change (across both purchase mortgages and refinance mortgages)? “Ease” = Eased considerably + Eased somewhat, “Tighten” = Tightened somewhat + Tightened considerablyQ: Over the next three months, how do you expect your firm’s credit standards for approving applications from individuals for mortgage loans to change (across purchase mortgages and refinance mortgages)? “Ease” = Ease considerably + Ease somewhat, “Tighten” = Tighten somewhat + Tighten considerably
Net Ease + = % of lenders saying ease minus % of lenders saying tightenThe % saying “remain unchanged” is not shown
Ease
Net Ease+
Tighten
* Denotes a statistically significant change compared with Q3 2020 (previous quarter)^ Denotes a statistically significant change compared with Q4 2019 (same quarter of last year)
Q4 2020 Mortgage Lender Sentiment Survey®
25%
11% 7%
9%
25%
10%
2%-13%*^
0%1%
5%
22%*^
Q4
2017
. . . Q4
2018
. . . Q4
2019
. . . Q4
2020
21%19% 11% 10%20%
16%6%
-17%*^
1% 3% 5%
27%*^
Q4
2017. . . Q4
2018. . . Q4
2019. . . Q4
2020
18% 10%
5%
8%
16% 7%
-1%-14%*^
2% 3%
6%
22%*^
Q4
2017. . . Q4
2018. . . Q4
2019. . . Q4
2020
8% 11%
3%
7%
7% 9%
-1% 3%1% 2%
4%
4%
Q4
2017. . . Q4
2018. . . Q4
2019. . . Q4
2020
11% 16% 7% 13%
8% 11%
1%
7%*
3% 5%6%
6%*
Q4
2017
. . . Q4
2018
. . . Q4
2019
. . . Q4
2020
10% 9%
2%
9%^
9% 5%
-3%
5%^
1% 4%
5%
4%
Q4
2017
. . . Q4
2018
. . . Q4
2019
. . . Q4
2020
Past
3 Months
Next
3 Months
Non-GSE-EligibleGSE-Eligible Government
Ease
Net Ease+
Tighten
© 2020 Fannie Mae. Trademarks of Fannie Mae.14
Profit Margin Outlook
• Lenders’ net profit margin outlook declined significantly this quarter, with a higher share of lenders expecting profit margins to decrease.
• For seven consecutive quarters, “consumer demand” was cited as the top reason by lenders who expressed a more optimistic profitability outlook. “Operational efficiency” was the second most important reason cited.
• For the twelfth consecutive quarter, “competition from other lenders” was cited as the primary reason by lenders who expect a lower profit margin outlook. “GSE pricing and policies” jumped to the second most important reason, reaching a new survey high.
Q4 2020 Mortgage Lender Sentiment Survey®
© 2020 Fannie Mae. Trademarks of Fannie Mae.15
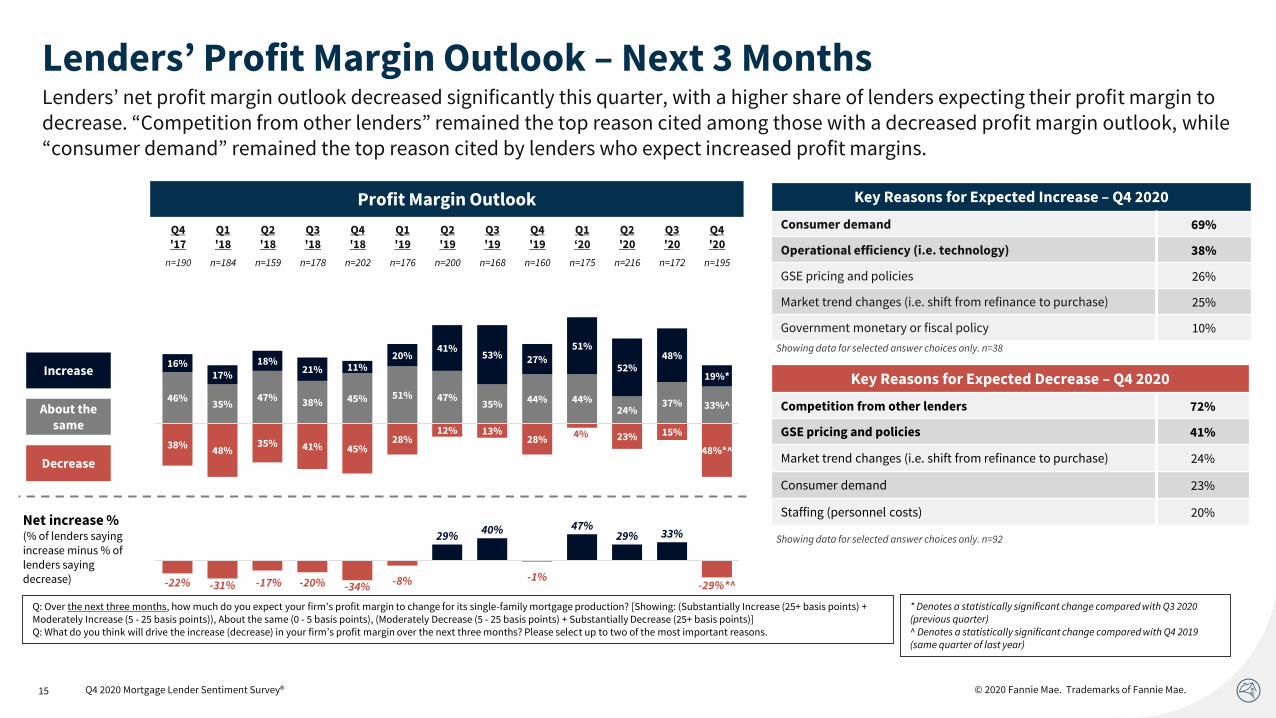
Lenders’ net profit margin outlook decreased significantly this quarter, with a higher share of lenders expecting their profit margin to decrease. “Competition from other lenders” remained the top reason cited among those with a decreased profit margin outlook, while “consumer demand” remained the top reason cited by lenders who expect increased profit margins.
Lenders’ Profit Margin Outlook – Next 3 Months
Increase
About the same
Decrease
Q: Over the next three months, how much do you expect your firm's profit margin to change for its single-family mortgage production? [Showing: (Substantially Increase (25+ basis points) + Moderately Increase (5 - 25 basis points)), About the same (0 - 5 basis points), (Moderately Decrease (5 - 25 basis points) + Substantially Decrease (25+ basis points)]Q: What do you think will drive the increase (decrease) in your firm’s profit margin over the next three months? Please select up to two of the most important reasons.
* Denotes a statistically significant change compared with Q3 2020 (previous quarter)^ Denotes a statistically significant change compared with Q4 2019 (same quarter of last year)
Key Reasons for Expected Decrease – Q4 2020
Competition from other lenders 72%
GSE pricing and policies 41%
Market trend changes (i.e. shift from refinance to purchase) 24%
Consumer demand 23%
Staffing (personnel costs) 20%
Key Reasons for Expected Increase – Q4 2020
Consumer demand 69%
Operational efficiency (i.e. technology) 38%
GSE pricing and policies 26%
Market trend changes (i.e. shift from refinance to purchase) 25%
Government monetary or fiscal policy 10%
Net increase %(% of lenders saying increase minus % of lenders saying decrease)
Showing data for selected answer choices only. n=92
Showing data for selected answer choices only. n=38
-22% -31% -17% -20% -34% -8%
29%40%
-1%
47%29% 33%
-29%*^
46%35%
47% 38% 45% 51% 47%35% 44% 44%
24%37% 33%^
16%17%
18%21% 11%
20%41%
53% 27%
51%
52%48%
19%*
38%48%
35% 41% 45%28%
12% 13%28%
4% 23% 15%
48%*^
Profit Margin Outlook
Q4'17
Q1'18
Q2'18
Q3'18
Q4'18
Q1'19
Q2'19
Q3'19
Q4'19
Q1‘20
Q2'20
Q3'20
Q4'20
n=190 n=184 n=159 n=178 n=202 n=176 n=200 n=168 n=160 n=175 n=216 n=172 n=195
Q4 2020 Mortgage Lender Sentiment Survey®
© 2020 Fannie Mae. Trademarks of Fannie Mae.16
Increased Profit Margin Outlook – Top Drivers
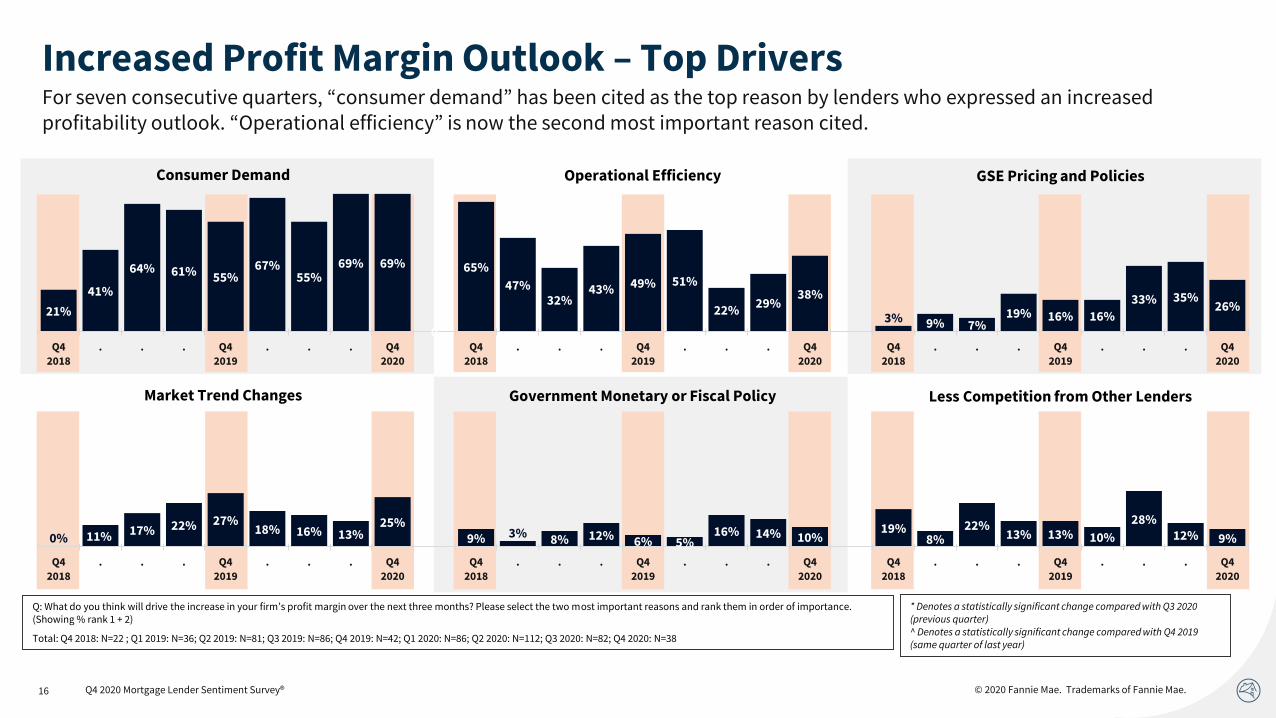
Q: What do you think will drive the increase in your firm’s profit margin over the next three months? Please select the two most important reasons and rank them in order of importance. (Showing % rank 1 + 2)
Total: Q4 2018: N=22 ; Q1 2019: N=36; Q2 2019: N=81; Q3 2019: N=86; Q4 2019: N=42; Q1 2020: N=86; Q2 2020: N=112; Q3 2020: N=82; Q4 2020: N=38
* Denotes a statistically significant change compared with Q3 2020 (previous quarter)^ Denotes a statistically significant change compared with Q4 2019 (same quarter of last year)
c
c c
0% 11% 17% 22% 27%18% 16% 13%
25%9% 3% 8% 12% 6% 5%
16% 14% 10%19%
8%22%
13% 13% 10%
28%12% 9%
Q4
2018
. . . Q4
2019
. . . Q4
2020
Q4
2018
. . . Q4
2019
. . . Q4
2020
Q4
2018
. . . Q4
2019
. . . Q4
2020
Consumer Demand
21%
41%
64% 61% 55%67%
55%69% 69%
0
65%
47%32%
43% 49% 51%
22%29%
38%
3% 9% 7%19% 16% 16%
33% 35%26%
Q4
2018
. . . Q4
2019
. . . Q4
2020
Q4
2018
. . . Q4
2019
. . . Q4
2020
Q4
2018
. . . Q4
2019
. . . Q4
2020
Operational Efficiency GSE Pricing and Policies
Market Trend Changes Government Monetary or Fiscal Policy Less Competition from Other Lenders
Q4 2020 Mortgage Lender Sentiment Survey®
For seven consecutive quarters, “consumer demand” has been cited as the top reason by lenders who expressed an increased profitability outlook. “Operational efficiency” is now the second most important reason cited.
© 2020 Fannie Mae. Trademarks of Fannie Mae.17
Decreased Profit Margin Outlook – Top Drivers
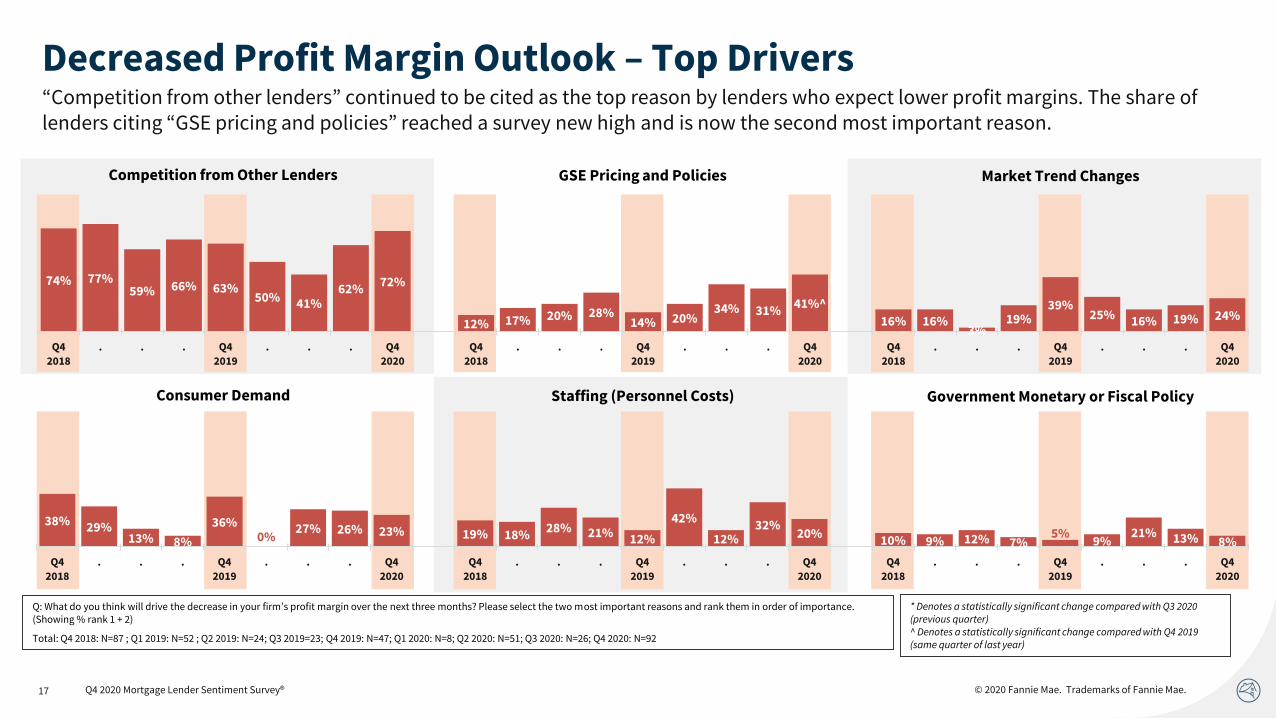
Q: What do you think will drive the decrease in your firm’s profit margin over the next three months? Please select the two most important reasons and rank them in order of importance. (Showing % rank 1 + 2)
Total: Q4 2018: N=87 ; Q1 2019: N=52 ; Q2 2019: N=24; Q3 2019=23; Q4 2019: N=47; Q1 2020: N=8; Q2 2020: N=51; Q3 2020: N=26; Q4 2020: N=92
* Denotes a statistically significant change compared with Q3 2020 (previous quarter)^ Denotes a statistically significant change compared with Q4 2019(same quarter of last year)
c
c c
38% 29%13% 8%
36%0%
27% 26% 23% 19% 18%28% 21% 12%
42%
12%32%
20%10% 9% 12% 7%
5%9%
21% 13% 8%
Q4
2018
. . . Q4
2019
. . . Q4
2020
Q4
2018
. . . Q4
2019
. . . Q4
2020
Q4
2018
. . . Q4
2019
. . . Q4
2020
Competition from Other Lenders
74% 77%59% 66% 63%
50% 41%62%
72%
12% 17% 20% 28%14% 20%
34% 31%41%^
16% 16%3%
19%39%
25% 16% 19% 24%
Q4
2018
. . . Q4
2019
. . . Q4
2020
Q4
2018
. . . Q4
2019
. . . Q4
2020
Q4
2018
. . . Q4
2019
. . . Q4
2020
GSE Pricing and Policies Market Trend Changes
Consumer Demand Staffing (Personnel Costs) Government Monetary or Fiscal Policy
Q4 2020 Mortgage Lender Sentiment Survey®
“Competition from other lenders” continued to be cited as the top reason by lenders who expect lower profit margins. The share of lenders citing “GSE pricing and policies” reached a survey new high and is now the second most important reason.

© 2020 Fannie Mae. Trademarks of Fannie Mae.
Appendix
© 2020 Fannie Mae. Trademarks of Fannie Mae.
Appendix
Survey Methodology Details……………………………………………………………….………… 19
Economic and Housing Sentiment…………………………………………………….……………. 27
Consumer Demand (Purchase Mortgages)……………………………………………………….... 30
Consumer Demand (Refinance Mortgages)…………………………………………………..……. 43
Credit Standards………………………………………………………………………………………. 50
Profit Margin Outlook………………………………………………………………………………… 58
Survey Question Text…………………………………………………………………………………. 63
© 2020 Fannie Mae. Trademarks of Fannie Mae.20
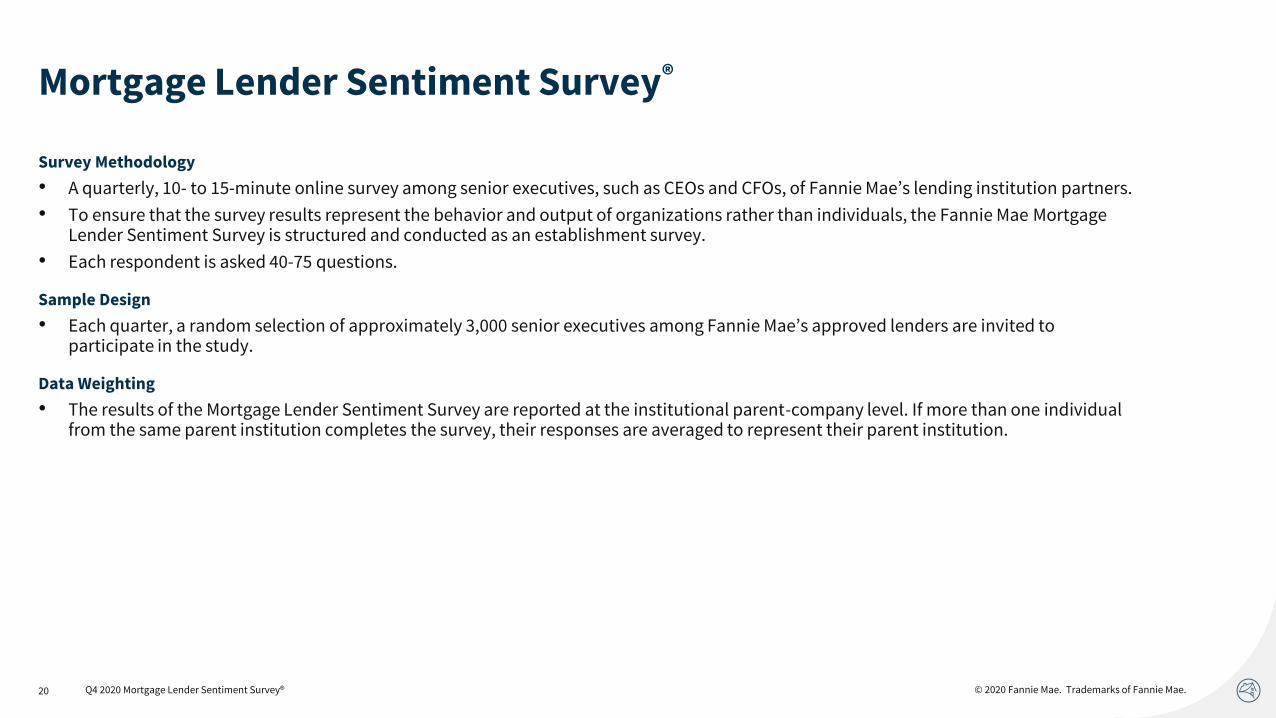
Mortgage Lender Sentiment Survey®
Survey Methodology
• A quarterly, 10- to 15-minute online survey among senior executives, such as CEOs and CFOs, of Fannie Mae’s lending institution partners.
• To ensure that the survey results represent the behavior and output of organizations rather than individuals, the Fannie Mae Mortgage Lender Sentiment Survey is structured and conducted as an establishment survey.
• Each respondent is asked 40-75 questions.
Sample Design
• Each quarter, a random selection of approximately 3,000 senior executives among Fannie Mae’s approved lenders are invited to participate in the study.
Data Weighting
• The results of the Mortgage Lender Sentiment Survey are reported at the institutional parent-company level. If more than one individual from the same parent institution completes the survey, their responses are averaged to represent their parent institution.
Q4 2020 Mortgage Lender Sentiment Survey®
© 2020 Fannie Mae. Trademarks of Fannie Mae.21
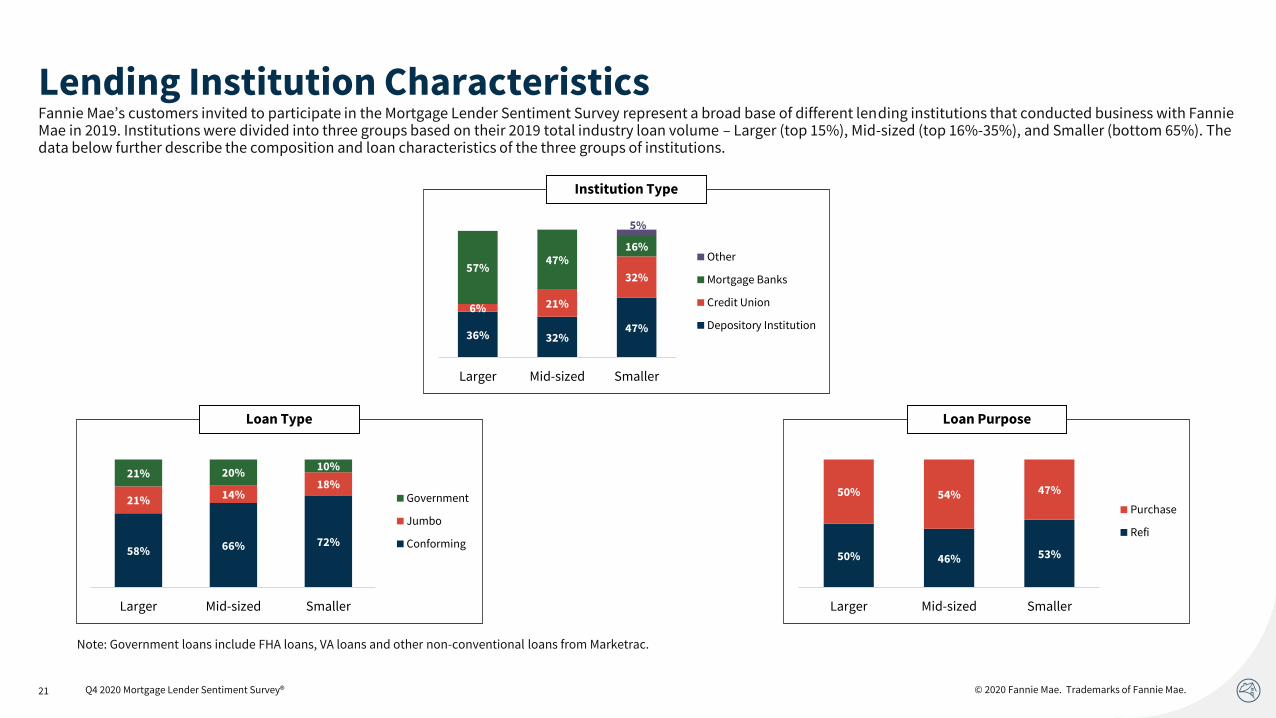
Lending Institution CharacteristicsFannie Mae’s customers invited to participate in the Mortgage Lender Sentiment Survey represent a broad base of different lending institutions that conducted business with Fannie Mae in 2019. Institutions were divided into three groups based on their 2019 total industry loan volume – Larger (top 15%), Mid-sized (top 16%-35%), and Smaller (bottom 65%). The data below further describe the composition and loan characteristics of the three groups of institutions.
Note: Government loans include FHA loans, VA loans and other non-conventional loans from Marketrac.
Q4 2020 Mortgage Lender Sentiment Survey®
36% 32%47%
6% 21%
32%57%
47%16%
5%
Larger Mid-sized Smaller
Other
Mortgage Banks
Credit Union
Depository Institution
Institution Type
58% 66% 72%
21% 14%18%
21% 20%10%
Larger Mid-sized Smaller
Government
Jumbo
Conforming
Loan Type
50% 46% 53%
50% 54% 47%
Larger Mid-sized Smaller
Purchase
Refi
Loan Purpose
© 2020 Fannie Mae. Trademarks of Fannie Mae.22
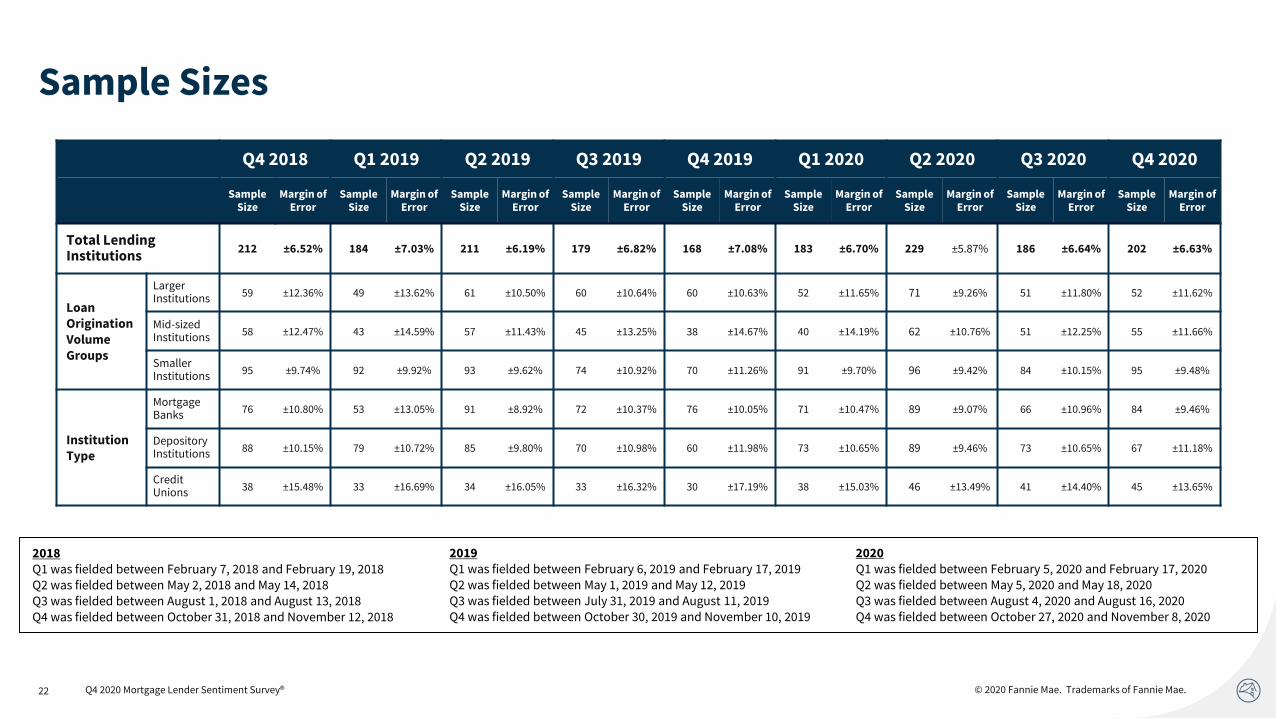
Sample Sizes
Q4 2018 Q1 2019 Q2 2019 Q3 2019 Q4 2019 Q1 2020 Q2 2020 Q3 2020 Q4 2020
Sample Size
Margin of Error
Sample Size
Margin of Error
Sample Size
Margin of Error
Sample Size
Margin of Error
Sample Size
Margin of Error
Sample Size
Margin of Error
Sample Size
Margin of Error
Sample Size
Margin of Error
Sample Size
Margin of Error
Total Lending Institutions
212 ±6.52% 184 ±7.03% 211 ±6.19% 179 ±6.82% 168 ±7.08% 183 ±6.70% 229 ±5.87% 186 ±6.64% 202 ±6.63%
Loan Origination Volume Groups
Larger Institutions 59 ±12.36% 49 ±13.62% 61 ±10.50% 60 ±10.64% 60 ±10.63% 52 ±11.65% 71 ±9.26% 51 ±11.80% 52 ±11.62%
Mid-sized Institutions 58 ±12.47% 43 ±14.59% 57 ±11.43% 45 ±13.25% 38 ±14.67% 40 ±14.19% 62 ±10.76% 51 ±12.25% 55 ±11.66%
Smaller Institutions 95 ±9.74% 92 ±9.92% 93 ±9.62% 74 ±10.92% 70 ±11.26% 91 ±9.70% 96 ±9.42% 84 ±10.15% 95 ±9.48%
Institution Type
Mortgage Banks 76 ±10.80% 53 ±13.05% 91 ±8.92% 72 ±10.37% 76 ±10.05% 71 ±10.47% 89 ±9.07% 66 ±10.96% 84 ±9.46%
Depository Institutions 88 ±10.15% 79 ±10.72% 85 ±9.80% 70 ±10.98% 60 ±11.98% 73 ±10.65% 89 ±9.46% 73 ±10.65% 67 ±11.18%
Credit Unions 38 ±15.48% 33 ±16.69% 34 ±16.05% 33 ±16.32% 30 ±17.19% 38 ±15.03% 46 ±13.49% 41 ±14.40% 45 ±13.65%
2018Q1 was fielded between February 7, 2018 and February 19, 2018Q2 was fielded between May 2, 2018 and May 14, 2018Q3 was fielded between August 1, 2018 and August 13, 2018Q4 was fielded between October 31, 2018 and November 12, 2018
2019Q1 was fielded between February 6, 2019 and February 17, 2019Q2 was fielded between May 1, 2019 and May 12, 2019Q3 was fielded between July 31, 2019 and August 11, 2019Q4 was fielded between October 30, 2019 and November 10, 2019
2020Q1 was fielded between February 5, 2020 and February 17, 2020Q2 was fielded between May 5, 2020 and May 18, 2020Q3 was fielded between August 4, 2020 and August 16, 2020Q4 was fielded between October 27, 2020 and November 8, 2020
Q4 2020 Mortgage Lender Sentiment Survey®
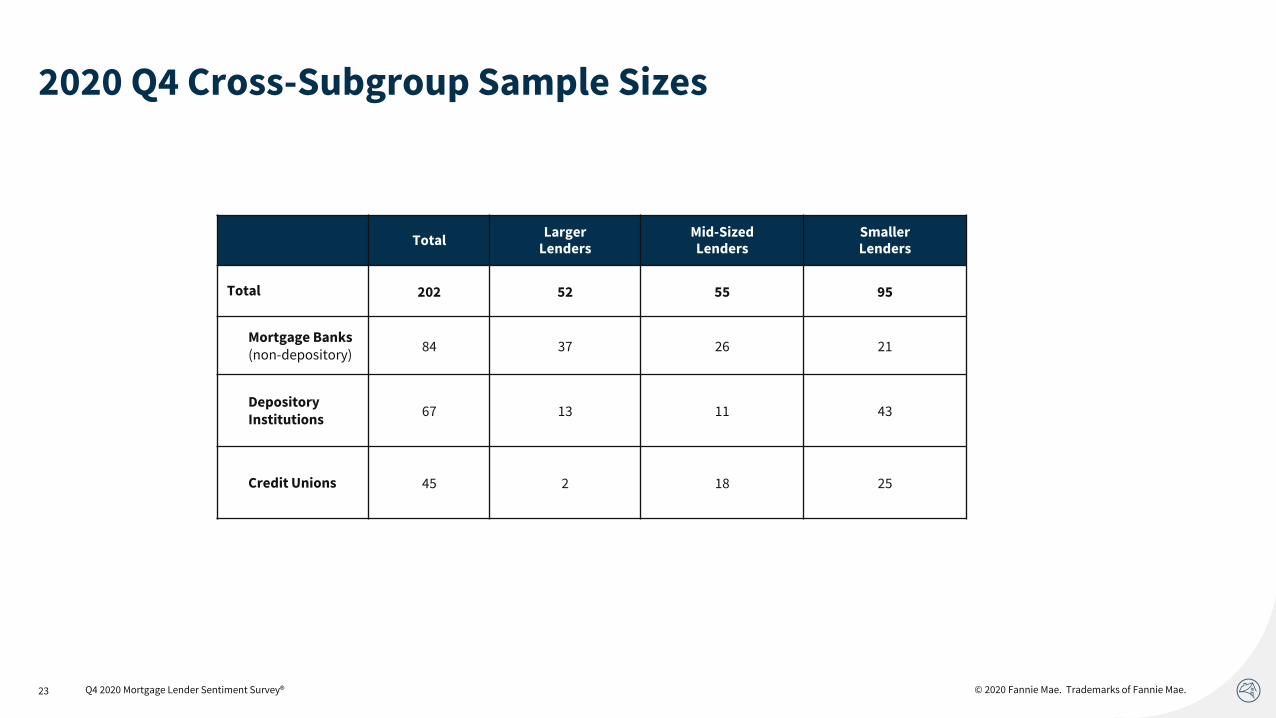
© 2020 Fannie Mae. Trademarks of Fannie Mae.23
TotalLarger
LendersMid-Sized Lenders
Smaller Lenders
Total 202 52 55 95
Mortgage Banks(non-depository)
84 37 26 21
Depository Institutions
67 13 11 43
Credit Unions 45 2 18 25
2020 Q4 Cross-Subgroup Sample Sizes
Q4 2020 Mortgage Lender Sentiment Survey®
© 2020 Fannie Mae. Trademarks of Fannie Mae.24
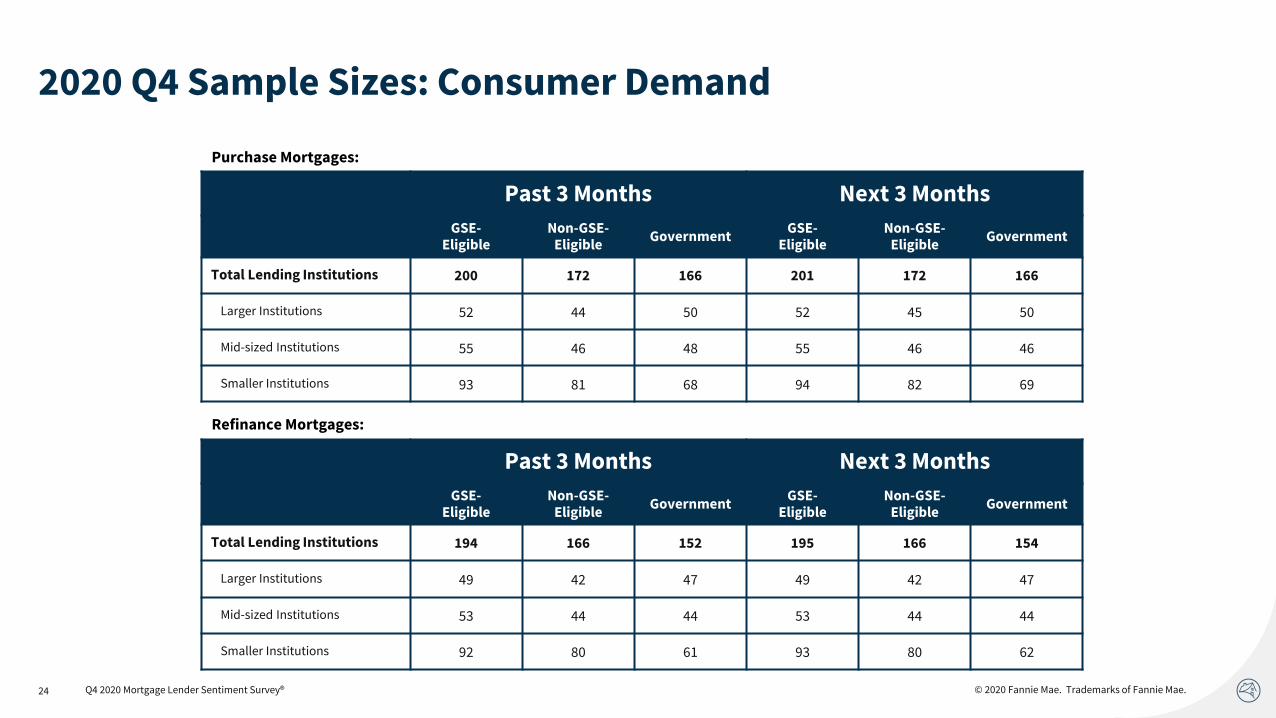
Past 3 Months Next 3 Months
GSE-Eligible
Non-GSE-Eligible
GovernmentGSE-
EligibleNon-GSE-
Eligible Government
Total Lending Institutions 200 172 166 201 172 166
Larger Institutions 52 44 50 52 45 50
Mid-sized Institutions 55 46 48 55 46 46
Smaller Institutions 93 81 68 94 82 69
Past 3 Months Next 3 Months
GSE-Eligible
Non-GSE-Eligible
GovernmentGSE-
EligibleNon-GSE-
Eligible Government
Total Lending Institutions 194 166 152 195 166 154
Larger Institutions 49 42 47 49 42 47
Mid-sized Institutions 53 44 44 53 44 44
Smaller Institutions 92 80 61 93 80 62
Purchase Mortgages:
Refinance Mortgages:
2020 Q4 Sample Sizes: Consumer Demand
Q4 2020 Mortgage Lender Sentiment Survey®
© 2020 Fannie Mae. Trademarks of Fannie Mae.25
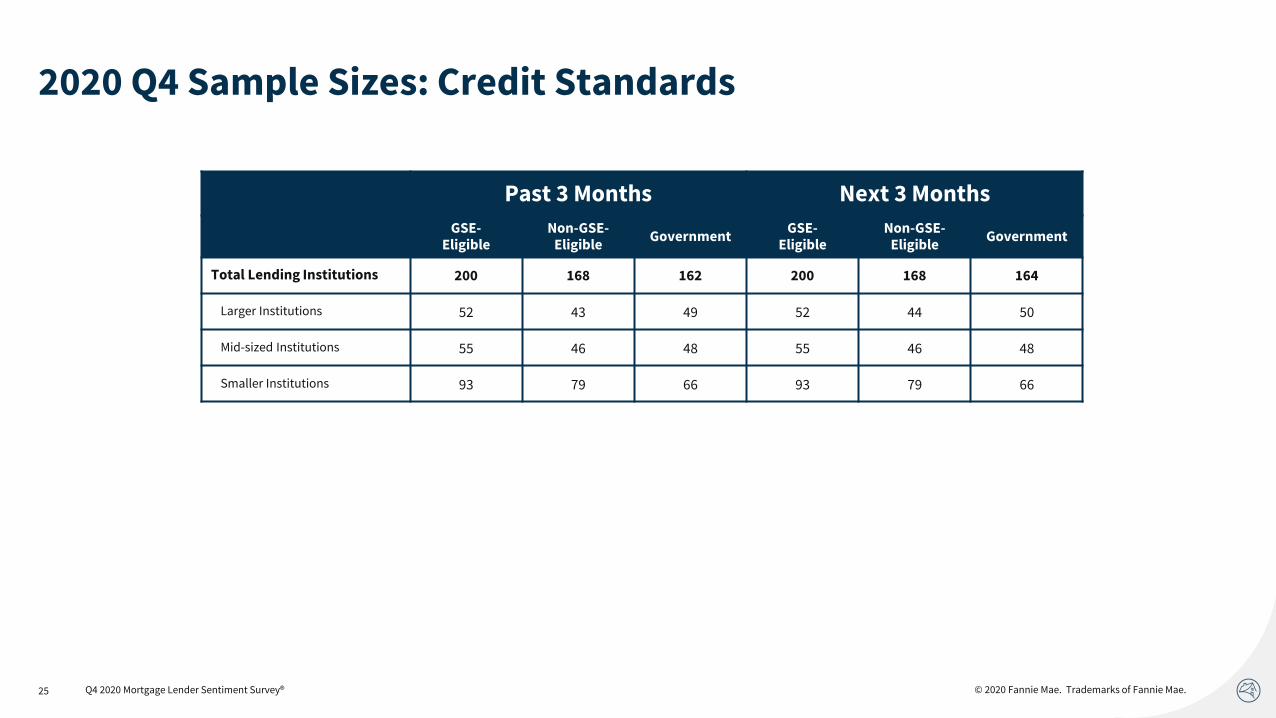
2020 Q4 Sample Sizes: Credit Standards
Past 3 Months Next 3 Months
GSE-Eligible
Non-GSE-Eligible
GovernmentGSE-
EligibleNon-GSE-
Eligible Government
Total Lending Institutions 200 168 162 200 168 164
Larger Institutions 52 43 49 52 44 50
Mid-sized Institutions 55 46 48 55 46 48
Smaller Institutions 93 79 66 93 79 66
Q4 2020 Mortgage Lender Sentiment Survey®
© 2020 Fannie Mae. Trademarks of Fannie Mae.26
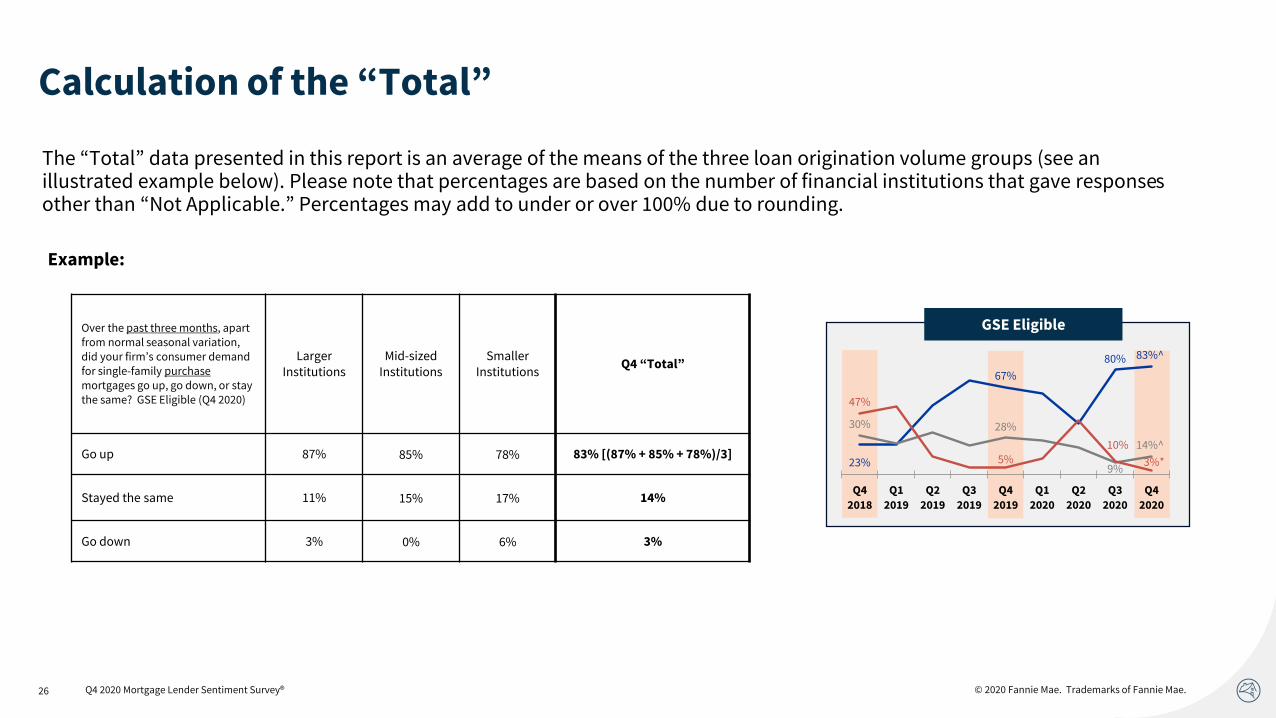
Calculation of the “Total”
The “Total” data presented in this report is an average of the means of the three loan origination volume groups (see an illustrated example below). Please note that percentages are based on the number of financial institutions that gave responses other than “Not Applicable.” Percentages may add to under or over 100% due to rounding.
Example:
Over the past three months, apart from normal seasonal variation, did your firm’s consumer demand for single-family purchasemortgages go up, go down, or stay the same? GSE Eligible (Q4 2020)
Larger Institutions
Mid-sized Institutions
Smaller Institutions
Q4 “Total”
Go up 87% 85% 78% 83% [(87% + 85% + 78%)/3]
Stayed the same 11% 15% 17% 14%
Go down 3% 0% 6% 3%
23%
67%
80% 83%^
30% 28%
9%
14%^
47%
5%10%
3%*
Q4
2018
Q1
2019
Q2
2019
Q3
2019
Q4
2019
Q1
2020
Q2
2020
Q3
2020
Q4
2020
GSE Eligible
Q4 2020 Mortgage Lender Sentiment Survey®
© 2020 Fannie Mae. Trademarks of Fannie Mae.
Appendix
Survey Methodology Details……………………………………………………………….………… 19
Economic and Housing Sentiment…………………………………………………….……………. 27
Consumer Demand (Purchase Mortgages)……………………………………………………….... 30
Consumer Demand (Refinance Mortgages)…………………………………………………..……. 43
Credit Standards………………………………………………………………………………………. 50
Profit Margin Outlook………………………………………………………………………………… 58
Survey Question Text…………………………………………………………………………………. 63
© 2020 Fannie Mae. Trademarks of Fannie Mae.28
National Housing Survey: http://www.fanniemae.com/portal/research-and-analysis/housing-survey.html
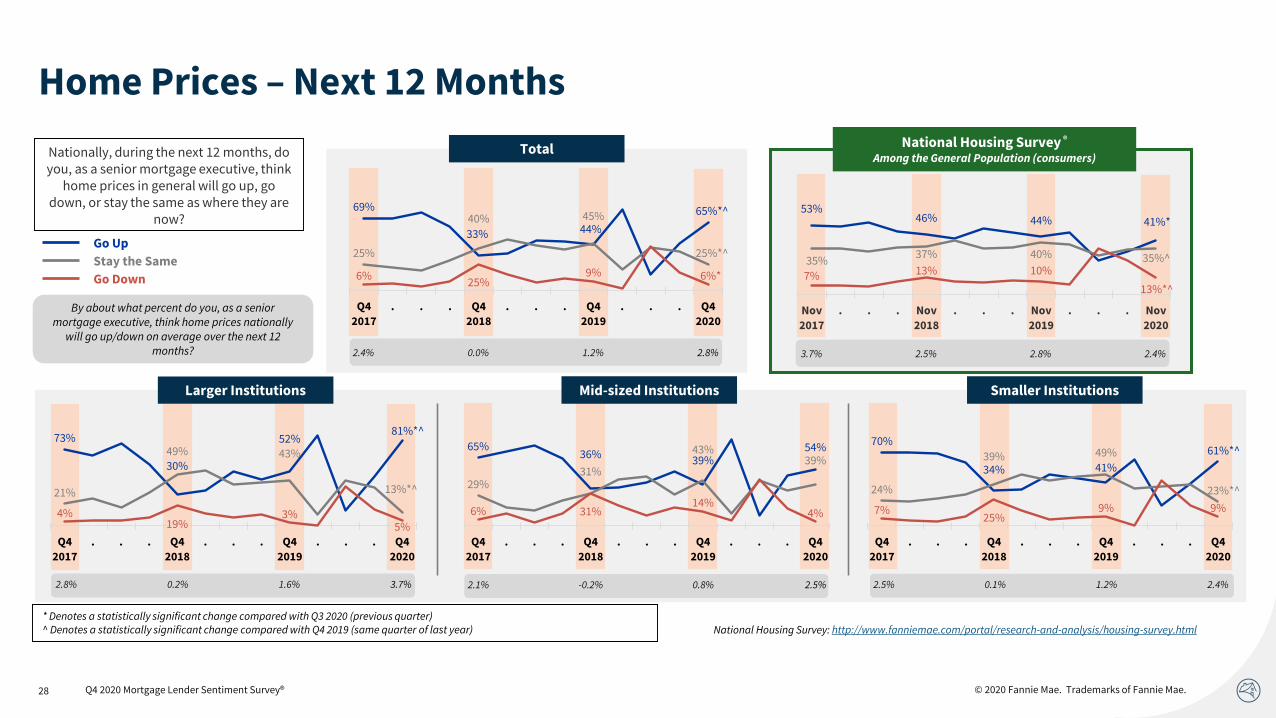
Home Prices – Next 12 Months
Total National Housing Survey ®
Among the General Population (consumers)
Go Up
Stay the Same
Go Down
Nationally, during the next 12 months, do you, as a senior mortgage executive, think
home prices in general will go up, go down, or stay the same as where they are
now?
By about what percent do you, as a senior mortgage executive, think home prices nationally
will go up/down on average over the next 12 months?
69%
33% 44%
65%*^
25%
40% 45%
25%*^
6%25%
9% 6%*
Q4
2017
. . . Q4
2018
. . . Q4
2019
. . . Q4
2020
53%46% 44% 41%*
35%37% 40% 35%^
7% 13% 10%
13%*^
Nov
2017
. . . Nov
2018
. . . Nov
2019
. . . Nov
2020
73%
30%
52%81%*^
21%
49% 43%
13%*^
4%19%
3%5%
Q4
2017
. . . Q4
2018
. . . Q4
2019
. . . Q4
2020
65%36%
39%54%
29%31%
43%39%
6% 31%14%
4%
Q4
2017
. . . Q4
2018
. . . Q4
2019
. . . Q4
2020
70%
34% 41%
61%*^
24%
39% 49%
23%*^
7%25%
9% 9%
Q4
2017
. . . Q4
2018
. . . Q4
2019
. . . Q4
2020
2.4% 0.0% 1.2% 2.8% 3.7% 2.5% 2.8% 2.4%
2.8% 0.2% 1.6% 3.7% 2.1% -0.2% 0.8% 2.5% 2.5% 0.1% 1.2% 2.4%
Larger Institutions Mid-sized Institutions Smaller Institutions
* Denotes a statistically significant change compared with Q3 2020 (previous quarter)^ Denotes a statistically significant change compared with Q4 2019 (same quarter of last year)
Q4 2020 Mortgage Lender Sentiment Survey®
© 2020 Fannie Mae. Trademarks of Fannie Mae.29 Q4 2020 Mortgage Lender Sentiment Survey®
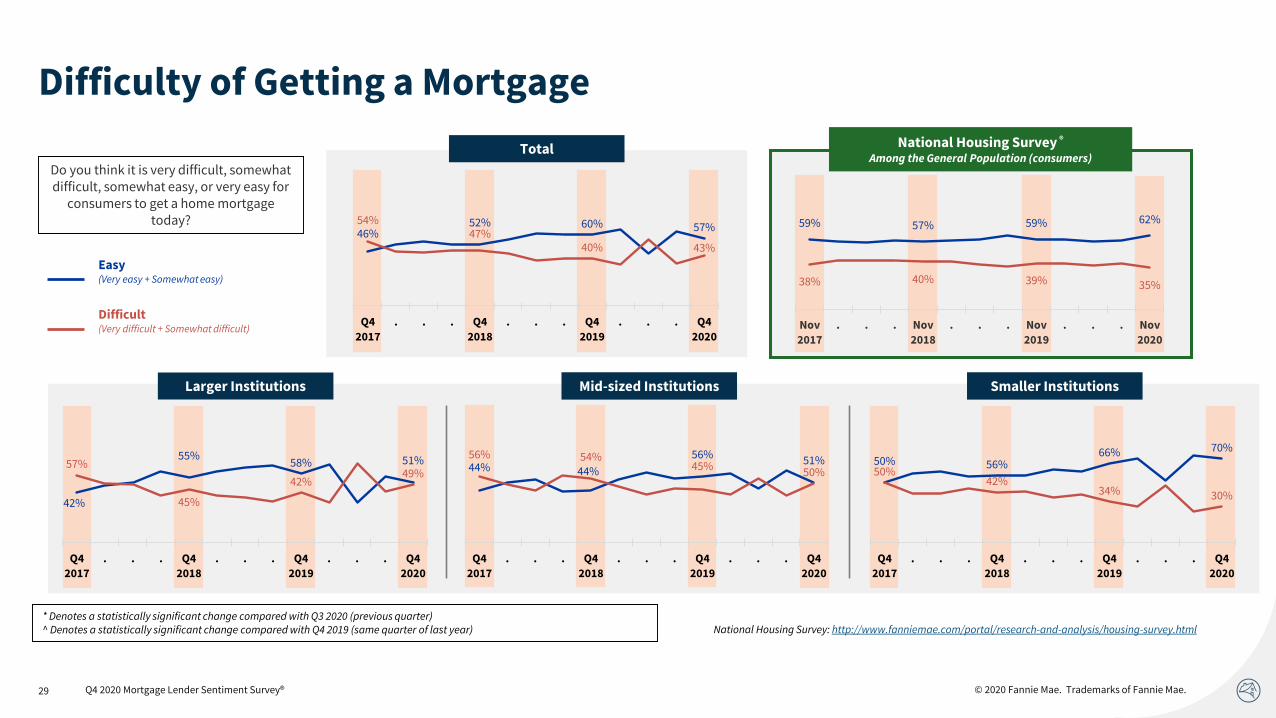
Difficulty of Getting a Mortgage
National Housing Survey: http://www.fanniemae.com/portal/research-and-analysis/housing-survey.html
Total National Housing Survey ®
Among the General Population (consumers)Do you think it is very difficult, somewhat difficult, somewhat easy, or very easy for
consumers to get a home mortgage today?
Larger Institutions Mid-sized Institutions Smaller Institutions
42%
55%58% 51%57%
45%
42%49%
Q4
2017
. . . Q4
2018
. . . Q4
2019
. . . Q4
2020
46%52% 60% 57%
54%47%
40% 43%
Q4
2017
. . . Q4
2018
. . . Q4
2019
. . . Q4
2020
59% 57% 59% 62%
38% 40% 39% 35%
Nov
2017
. . . Nov
2018
. . . Nov
2019
. . . Nov
2020
44% 44%
56% 51%56% 54%45%
50%
Q4
2017
. . . Q4
2018
. . . Q4
2019
. . . Q4
2020
50% 56%66% 70%
50%42%
34% 30%
Q4
2017
. . . Q4
2018
. . . Q4
2019
. . . Q4
2020
* Denotes a statistically significant change compared with Q3 2020 (previous quarter)^ Denotes a statistically significant change compared with Q4 2019 (same quarter of last year)
Easy (Very easy + Somewhat easy)
Difficult(Very difficult + Somewhat difficult)
© 2020 Fannie Mae. Trademarks of Fannie Mae.
Appendix
Survey Methodology Details……………………………………………………………….………… 19
Economic and Housing Sentiment…………………………………………………….……………. 27
Consumer Demand (Purchase Mortgages)……………………………………………………….... 30
Consumer Demand (Refinance Mortgages)…………………………………………………..……. 43
Credit Standards………………………………………………………………………………………. 50
Profit Margin Outlook………………………………………………………………………………… 58
Survey Question Text…………………………………………………………………………………. 63
© 2020 Fannie Mae. Trademarks of Fannie Mae.31
Purchase Mortgage Demand: GSE-Eligible (by institution size)
Q: Over the past three months, apart from normal seasonal variation, did your firm’s consumer demand for single-family purchase mortgages go up, go down, or stay the same? “Up” = Went up significantly + Went up somewhat, “Down” = Went down significantly + Went down somewhatQ: Over the next three months, apart from normal seasonal variation, do you expect your firm’s consumer demand for single-family purchase mortgages to go up, go down, or stay the same? “Up” = Go up significantly + Go up somewhat, “Down” = Go down significantly + Go down somewhat
* Denotes a statistically significant change compared with Q3 2020 (previous quarter)^ Denotes a statistically significant change compared with Q4 2019 (same quarter of last year)
Mid-sized InstitutionsLarger Institutions Smaller Institutions
Past 3 Months
Next 3 Months
46%
21%
67%87%^
26%
-21%
64%84%
20%
42%
3% 3%
Q4
2017
. . . Q4
2018
. . . Q4
2019
. . . Q4
2020
32%
25%
67%
85%^
14%
-26%
64%
85%*^18%
51%
3% 0%*
Q42017
. . . Q42018
. . . Q42019
. . . Q42020
34%
24%
68% 78%
-3%
-24%
59%72%37% 48%
9% 6%
Q42017
. . . Q42018
. . . Q42019
. . . Q42020
18%8%
33% 50%
-8%
-42%
16%
42%^
26%50%
17%
8%
Q4
2017
. . . Q4
2018
. . . Q4
2019
. . . Q4
2020
20%13%
34% 40%*
-7%-26%
22% 24%*27% 39%
12%16%
Q4
2017. . . Q4
2018. . . Q4
2019. . . Q4
2020
19%10%
31%40%*
-3%
-37%
12%
23%*22%47%
19% 17%
Q4
2017. . . Q4
2018. . . Q4
2019. . . Q4
2020
L/M/S - Denote a % is significantly higher than the annual loan origination volume group that the letter represents at the 95% confidence level Net Up + = % of lenders saying up minus % of lenders saying downThe % saying “stay the same” is not shown
Q4 2020 Mortgage Lender Sentiment Survey®
Up
Net Up +
Down

© 2020 Fannie Mae. Trademarks of Fannie Mae.32
Purchase Mortgage Demand: GSE-Eligible (by institution type)
Q: Over the past three months, apart from normal seasonal variation, did your firm’s consumer demand for single-family purchase mortgages go up, go down, or stay the same? “Up” = Went up significantly + Went up somewhat, “Down” = Went down significantly + Went down somewhatQ: Over the next three months, apart from normal seasonal variation, do you expect your firm’s consumer demand for single-family purchase mortgages to go up, go down, or stay the same? “Up” = Go up significantly + Go up somewhat, “Down” = Go down significantly + Go down somewhat
* Denotes a statistically significant change compared with Q3 2020 (previous quarter)^ Denotes a statistically significant change compared with Q4 2019 (same quarter of last year)
Depository InstitutionsMortgage Banks Credit Unions
Past 3 Months
Next 3 Months
39%
25%
70%88%^C
18%
-24%
67%84%
21%
49%
3% 4%
Q4
2017
. . . Q4
2018
. . . Q4
2019
. . . Q4
2020
27%17%
68% 81%
-8%-31%
63%
80%35% 48%
5% 1%
Q42017
. . . Q42018
. . . Q42019
. . . Q42020
54%
34%
63% 72%
38%
-12%
53%67%
16%
46%
10% 5%
Q42017
. . . Q42018
. . . Q42019
. . . Q42020
18%
10%
37%47%
-16%
-38%
23%35%*
34% 48%
14% 12%
Q4
2017
. . . Q4
2018
. . . Q4
2019
. . . Q4
2020
18%6%
25%39%
-5% -47% 4%
28%^
23%53%
21%
11%
Q4
2017. . . Q4
2018. . . Q4
2019. . . Q4
2020
24% 17%
40%
43%
12% -15%
23%
20%*12%
32%
17%
23%
Q4
2017
. . . Q4
2018
. . . Q4
2019
. . . Q4
2020
M/D/C - Denote a % is significantly higher than the institution type group that the letter represents at the 95% confidence level Net Up + = % of lenders saying up minus % of lenders saying downThe % saying “stay the same” is not shown
Q4 2020 Mortgage Lender Sentiment Survey®
Up
Net Up +
Down
© 2020 Fannie Mae. Trademarks of Fannie Mae.33
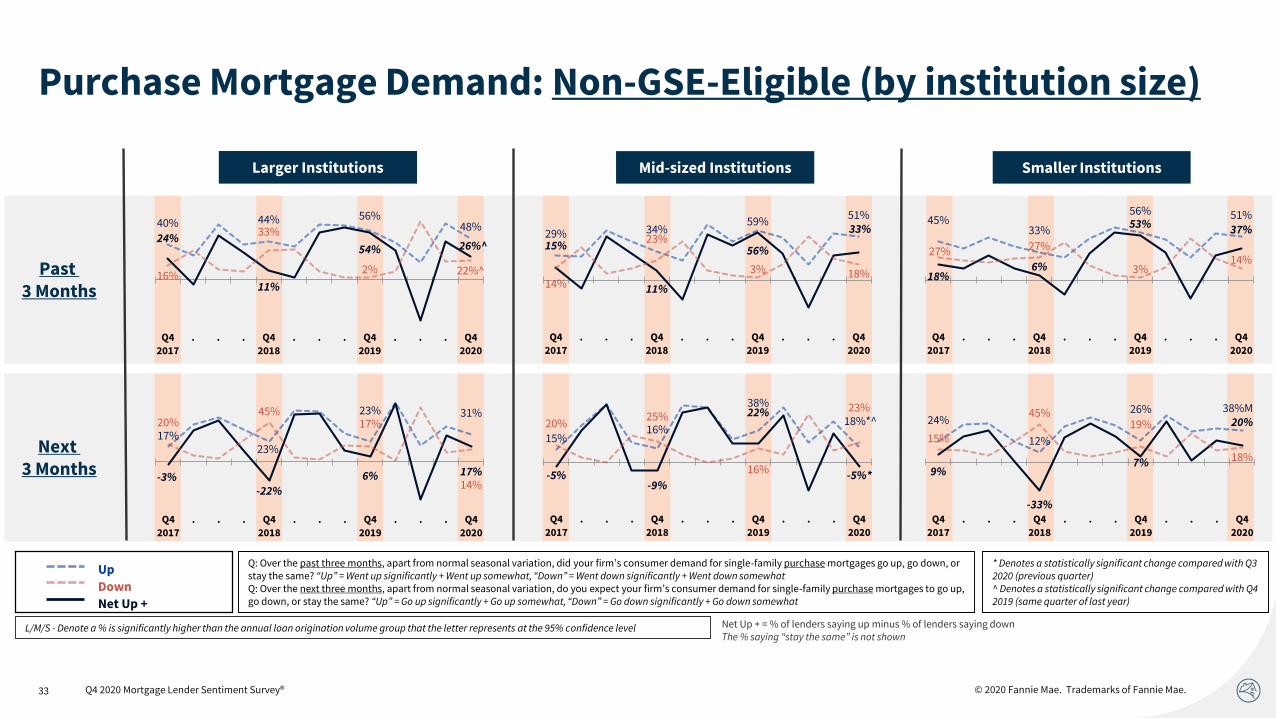
Purchase Mortgage Demand: Non-GSE-Eligible (by institution size)
Q: Over the past three months, apart from normal seasonal variation, did your firm’s consumer demand for single-family purchase mortgages go up, go down, or stay the same? “Up” = Went up significantly + Went up somewhat, “Down” = Went down significantly + Went down somewhatQ: Over the next three months, apart from normal seasonal variation, do you expect your firm’s consumer demand for single-family purchase mortgages to go up, go down, or stay the same? “Up” = Go up significantly + Go up somewhat, “Down” = Go down significantly + Go down somewhat
* Denotes a statistically significant change compared with Q3 2020 (previous quarter)^ Denotes a statistically significant change compared with Q4 2019 (same quarter of last year)
Mid-sized InstitutionsLarger Institutions Smaller Institutions
Past 3 Months
Next 3 Months
40% 44% 56%48%
24%
11%
54% 26%^
16%
33%
2% 22%^
Q4
2017
. . . Q4
2018
. . . Q4
2019
. . . Q4
2020
29% 34%59%
51%
15%
11%
56%
33%
14%
23%
3% 18%
Q42017
. . . Q42018
. . . Q42019
. . . Q42020
45%33%
56% 51%
18%6%
53% 37%
27% 27%
3%14%
Q42017
. . . Q42018
. . . Q42019
. . . Q42020
17%23%
23% 31%
-3%-22%
6% 17%
20%45%
17%
14%
Q4
2017
. . . Q4
2018
. . . Q4
2019
. . . Q4
2020
15%16%
38%
18%*^
-5%-9%
22%
-5%*
20%25%
16%
23%
Q4
2017. . . Q4
2018. . . Q4
2019. . . Q4
2020
24%
12%
26% 38%M
9%
-33%
7%
20%
15%
45%19%
18%
Q4
2017
. . . Q4
2018
. . . Q4
2019
. . . Q4
2020
L/M/S - Denote a % is significantly higher than the annual loan origination volume group that the letter represents at the 95% confidence level Net Up + = % of lenders saying up minus % of lenders saying downThe % saying “stay the same” is not shown
Q4 2020 Mortgage Lender Sentiment Survey®
Up
Net Up +
Down

© 2020 Fannie Mae. Trademarks of Fannie Mae.34
Purchase Mortgage Demand: Non-GSE-Eligible (by institution type)
Q: Over the past three months, apart from normal seasonal variation, did your firm’s consumer demand for single-family purchase mortgages go up, go down, or stay the same? “Up” = Went up significantly + Went up somewhat, “Down” = Went down significantly + Went down somewhatQ: Over the next three months, apart from normal seasonal variation, do you expect your firm’s consumer demand for single-family purchase mortgages to go up, go down, or stay the same? “Up” = Go up significantly + Go up somewhat, “Down” = Go down significantly + Go down somewhat
* Denotes a statistically significant change compared with Q3 2020 (previous quarter)^ Denotes a statistically significant change compared with Q4 2019 (same quarter of last year)
Depository InstitutionsMortgage Banks Credit Unions
Past 3 Months
Next 3 Months
32% 35%
57%45%
14% 6%
55%
15%^
18% 29%
2% 30%^D/C
Q4
2017
. . . Q4
2018
. . . Q4
2019
. . . Q4
2020
39% 32%
54% 54%
14%3%
51% 43%M
25% 29%
3%11%
Q42017
. . . Q42018
. . . Q42019
. . . Q42020
46% 44%
64% 57%
33%
19%
60%
51%M
13%
25%
4% 6%
Q42017
. . . Q42018
. . . Q42019
. . . Q42020
13%18%
33% 28%
-10% -19%
20%
7%*
23%
37%
13%
21%
Q4
2017
. . . Q4
2018
. . . Q4
2019
. . . Q4
2020
17%9% 15%
35%^
-1%
-42%
-6%
22%^18%
51%21%
13%
Q4
2017. . . Q4
2018. . . Q4
2019. . . Q4
2020
29%24%
44%30%
19%
-1%
24%
10%10%
25%
20%
20%
Q4
2017. . . Q4
2018. . . Q4
2019. . . Q4
2020
M/D/C - Denote a % is significantly higher than the institution type group that the letter represents at the 95% confidence level Net Up + = % of lenders saying up minus % of lenders saying downThe % saying “stay the same” is not shown
Q4 2020 Mortgage Lender Sentiment Survey®
Up
Net Up +
Down
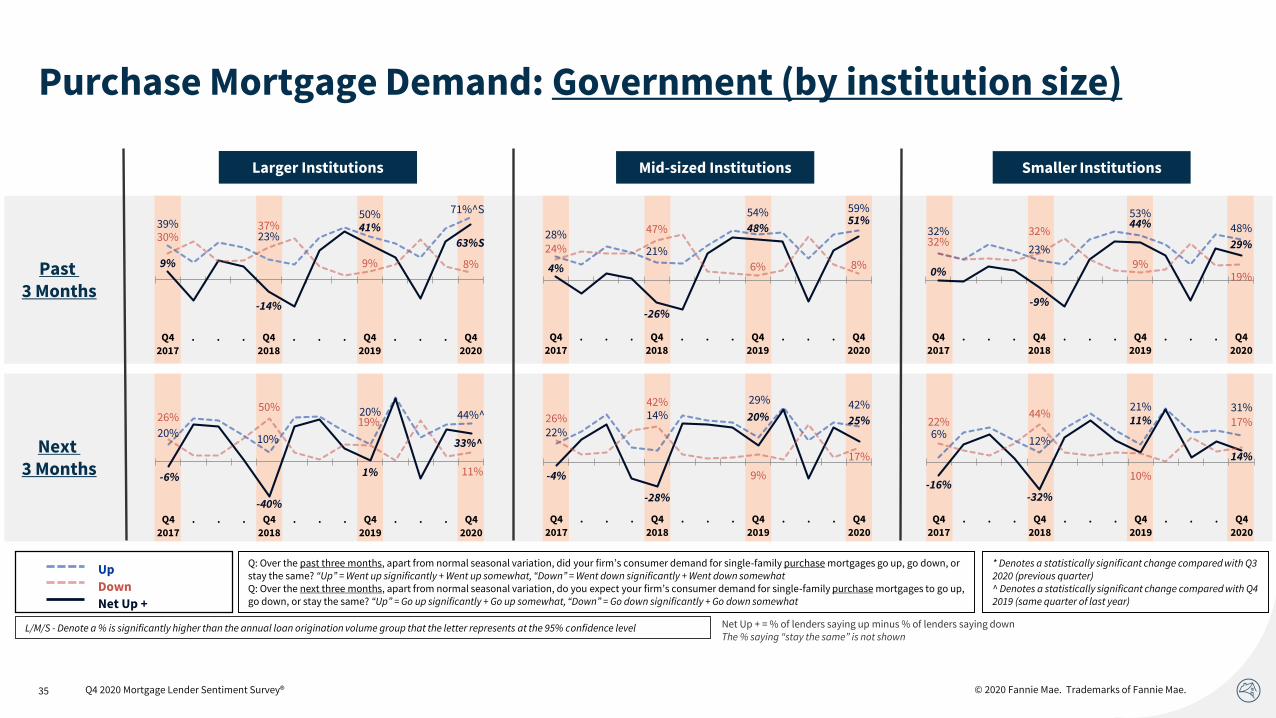
© 2020 Fannie Mae. Trademarks of Fannie Mae.35
Purchase Mortgage Demand: Government (by institution size)
Q: Over the past three months, apart from normal seasonal variation, did your firm’s consumer demand for single-family purchase mortgages go up, go down, or stay the same? “Up” = Went up significantly + Went up somewhat, “Down” = Went down significantly + Went down somewhatQ: Over the next three months, apart from normal seasonal variation, do you expect your firm’s consumer demand for single-family purchase mortgages to go up, go down, or stay the same? “Up” = Go up significantly + Go up somewhat, “Down” = Go down significantly + Go down somewhat
* Denotes a statistically significant change compared with Q3 2020 (previous quarter)^ Denotes a statistically significant change compared with Q4 2019 (same quarter of last year)
Mid-sized InstitutionsLarger Institutions Smaller Institutions
Past 3 Months
Next 3 Months
39%23%
50% 71%^S
9%
-14%
41%
63%S30%37%
9% 8%
Q4
2017
. . . Q4
2018
. . . Q4
2019
. . . Q4
2020
28%
21%
54% 59%
4%
-26%
48%51%
24%
47%
6% 8%
Q42017
. . . Q42018
. . . Q42019
. . . Q42020
32%
23%
53%48%
0%
-9%
44%
29%32%32%
9%19%
Q42017
. . . Q42018
. . . Q42019
. . . Q42020
20%10%
20% 44%^
-6%
-40%
1%
33%^
26%50%
19%
11%
Q4
2017
. . . Q4
2018
. . . Q4
2019
. . . Q4
2020
22%
14%
29% 42%
-4%
-28%
20% 25%26%
42%
9%
17%
Q4
2017. . . Q4
2018. . . Q4
2019. . . Q4
2020
6%12%
21% 31%
-16%-32%
11%
14%
22%44%
10%
17%
Q4
2017. . . Q4
2018. . . Q4
2019. . . Q4
2020
L/M/S - Denote a % is significantly higher than the annual loan origination volume group that the letter represents at the 95% confidence level Net Up + = % of lenders saying up minus % of lenders saying downThe % saying “stay the same” is not shown
Q4 2020 Mortgage Lender Sentiment Survey®
Up
Net Up +
Down
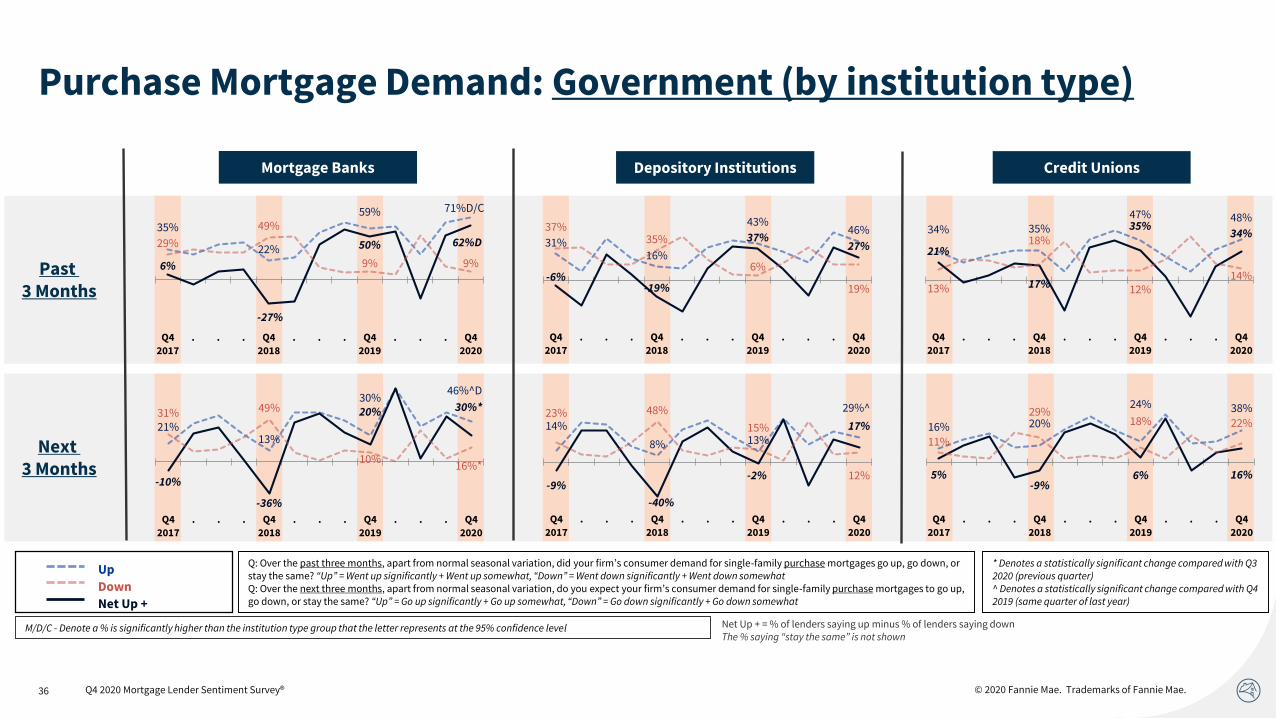
© 2020 Fannie Mae. Trademarks of Fannie Mae.36
Purchase Mortgage Demand: Government (by institution type)
Q: Over the past three months, apart from normal seasonal variation, did your firm’s consumer demand for single-family purchase mortgages go up, go down, or stay the same? “Up” = Went up significantly + Went up somewhat, “Down” = Went down significantly + Went down somewhatQ: Over the next three months, apart from normal seasonal variation, do you expect your firm’s consumer demand for single-family purchase mortgages to go up, go down, or stay the same? “Up” = Go up significantly + Go up somewhat, “Down” = Go down significantly + Go down somewhat
* Denotes a statistically significant change compared with Q3 2020 (previous quarter)^ Denotes a statistically significant change compared with Q4 2019 (same quarter of last year)
Depository InstitutionsMortgage Banks Credit Unions
Past 3 Months
Next 3 Months
35%
22%
59% 71%D/C
6%
-27%
50% 62%D29%
49%
9% 9%
Q4
2017
. . . Q4
2018
. . . Q4
2019
. . . Q4
2020
31%16%
43%46%
-6%-19%
37%27%
37%35%
6%
19%
Q42017
. . . Q42018
. . . Q42019
. . . Q42020
34% 35%47% 48%
21%
17%
35%34%
13%
18%
12%14%
Q42017
. . . Q42018
. . . Q42019
. . . Q42020
21%13%
30%46%^D
-10%
-36%
20% 30%*31% 49%
10%16%*
Q4
2017
. . . Q4
2018
. . . Q4
2019
. . . Q4
2020
14%
8% 13%
29%^
-9%
-40%
-2%
17%23% 48%
15%
12%
Q4
2017. . . Q4
2018. . . Q4
2019. . . Q4
2020
16% 20%
24% 38%
5%-9%
6% 16%
11%
29%18% 22%
Q4
2017. . . Q4
2018. . . Q4
2019. . . Q4
2020
M/D/C - Denote a % is significantly higher than the institution type group that the letter represents at the 95% confidence level Net Up + = % of lenders saying up minus % of lenders saying downThe % saying “stay the same” is not shown
Q4 2020 Mortgage Lender Sentiment Survey®
Up
Net Up +
Down
© 2020 Fannie Mae. Trademarks of Fannie Mae.37
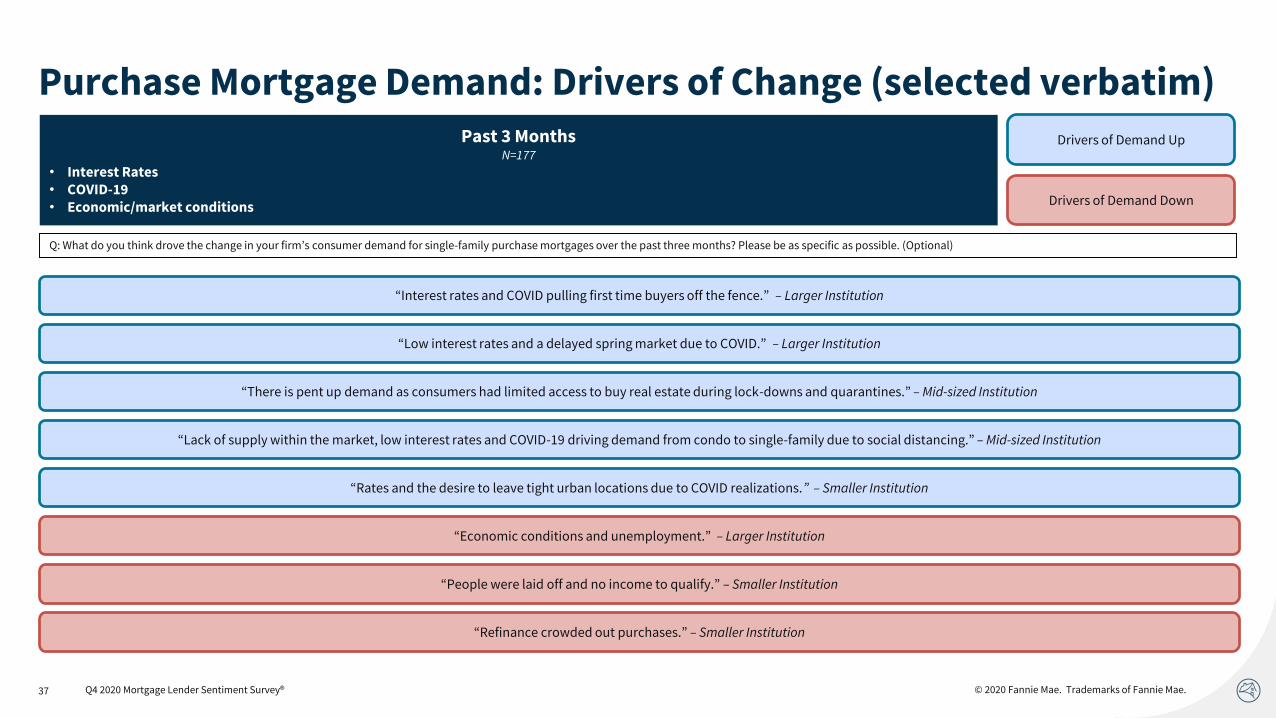
Purchase Mortgage Demand: Drivers of Change (selected verbatim)
Q: What do you think drove the change in your firm’s consumer demand for single-family purchase mortgages over the past three months? Please be as specific as possible. (Optional)
“Low interest rates and a delayed spring market due to COVID.” – Larger Institution
Past 3 MonthsN=177
• Interest Rates• COVID-19 • Economic/market conditions
“People were laid off and no income to qualify.” – Smaller Institution
“Rates and the desire to leave tight urban locations due to COVID realizations.” – Smaller Institution
“Interest rates and COVID pulling first time buyers off the fence.” – Larger Institution
“Lack of supply within the market, low interest rates and COVID-19 driving demand from condo to single-family due to social distancing.” – Mid-sized Institution
Drivers of Demand Up
Drivers of Demand Down
“There is pent up demand as consumers had limited access to buy real estate during lock-downs and quarantines.” – Mid-sized Institution
“Economic conditions and unemployment.” – Larger Institution
Q4 2020 Mortgage Lender Sentiment Survey®
“Refinance crowded out purchases.” – Smaller Institution
© 2020 Fannie Mae. Trademarks of Fannie Mae.38
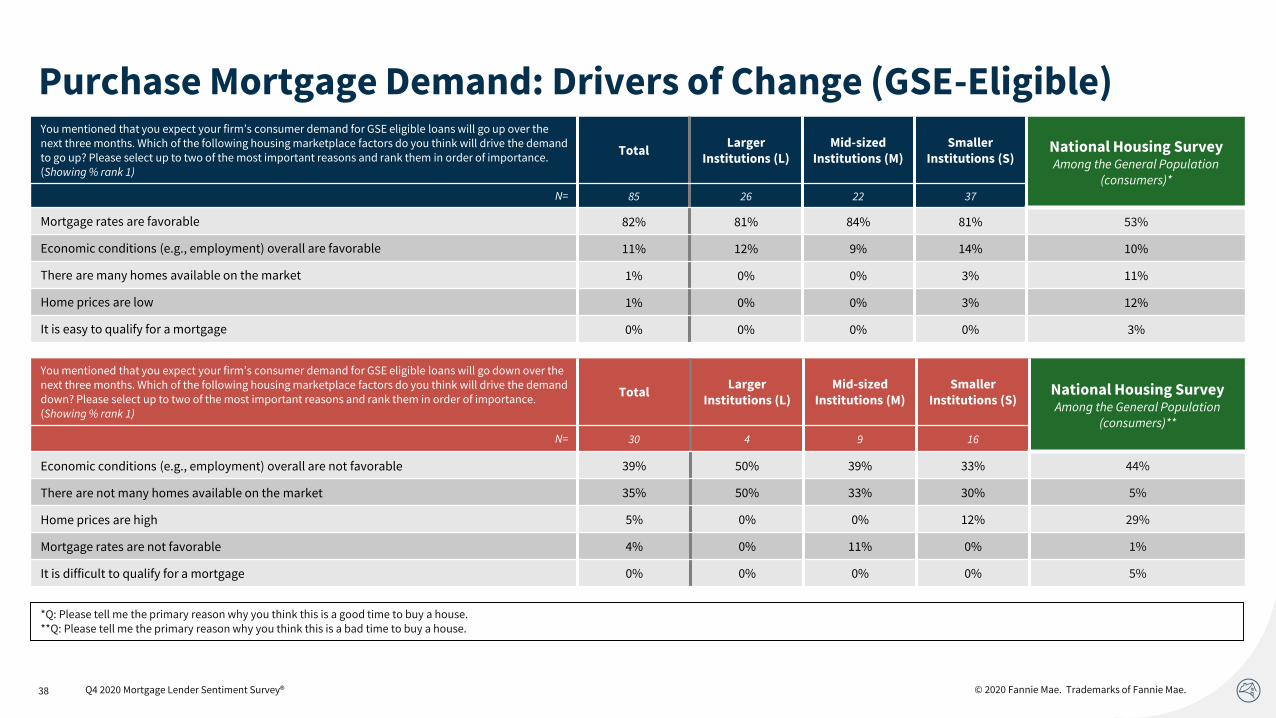
*Q: Please tell me the primary reason why you think this is a good time to buy a house.**Q: Please tell me the primary reason why you think this is a bad time to buy a house.
Purchase Mortgage Demand: Drivers of Change (GSE-Eligible)You mentioned that you expect your firm’s consumer demand for GSE eligible loans will go up over the next three months. Which of the following housing marketplace factors do you think will drive the demand to go up? Please select up to two of the most important reasons and rank them in order of importance. (Showing % rank 1)
TotalLarger
Institutions (L)Mid-sized
Institutions (M)Smaller
Institutions (S)National Housing SurveyAmong the General Population
(consumers)*N= 85 26 22 37
Mortgage rates are favorable 82% 81% 84% 81% 53%
Economic conditions (e.g., employment) overall are favorable 11% 12% 9% 14% 10%
There are many homes available on the market 1% 0% 0% 3% 11%
Home prices are low 1% 0% 0% 3% 12%
It is easy to qualify for a mortgage 0% 0% 0% 0% 3%
You mentioned that you expect your firm’s consumer demand for GSE eligible loans will go down over the next three months. Which of the following housing marketplace factors do you think will drive the demand down? Please select up to two of the most important reasons and rank them in order of importance. (Showing % rank 1)
TotalLarger
Institutions (L)Mid-sized
Institutions (M)Smaller
Institutions (S)National Housing SurveyAmong the General Population
(consumers)**N= 30 4 9 16
Economic conditions (e.g., employment) overall are not favorable 39% 50% 39% 33% 44%
There are not many homes available on the market 35% 50% 33% 30% 5%
Home prices are high 5% 0% 0% 12% 29%
Mortgage rates are not favorable 4% 0% 11% 0% 1%
It is difficult to qualify for a mortgage 0% 0% 0% 0% 5%
Q4 2020 Mortgage Lender Sentiment Survey®
© 2020 Fannie Mae. Trademarks of Fannie Mae.39
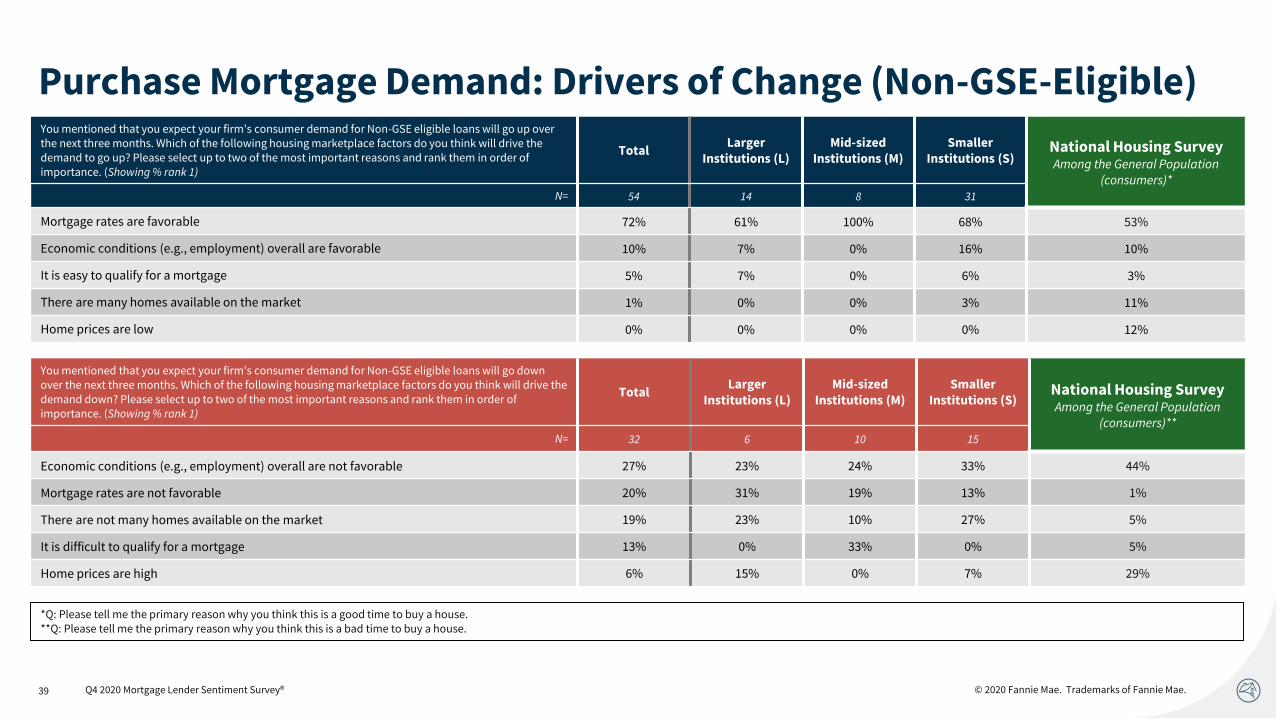
*Q: Please tell me the primary reason why you think this is a good time to buy a house.**Q: Please tell me the primary reason why you think this is a bad time to buy a house.
Purchase Mortgage Demand: Drivers of Change (Non-GSE-Eligible)You mentioned that you expect your firm’s consumer demand for Non-GSE eligible loans will go up over the next three months. Which of the following housing marketplace factors do you think will drive the demand to go up? Please select up to two of the most important reasons and rank them in order of importance. (Showing % rank 1)
TotalLarger
Institutions (L)Mid-sized
Institutions (M)Smaller
Institutions (S)National Housing SurveyAmong the General Population
(consumers)*N= 54 14 8 31
Mortgage rates are favorable 72% 61% 100% 68% 53%
Economic conditions (e.g., employment) overall are favorable 10% 7% 0% 16% 10%
It is easy to qualify for a mortgage 5% 7% 0% 6% 3%
There are many homes available on the market 1% 0% 0% 3% 11%
Home prices are low 0% 0% 0% 0% 12%
You mentioned that you expect your firm’s consumer demand for Non-GSE eligible loans will go down over the next three months. Which of the following housing marketplace factors do you think will drive the demand down? Please select up to two of the most important reasons and rank them in order of importance. (Showing % rank 1)
TotalLarger
Institutions (L)Mid-sized
Institutions (M)Smaller
Institutions (S)National Housing SurveyAmong the General Population
(consumers)**N= 32 6 10 15
Economic conditions (e.g., employment) overall are not favorable 27% 23% 24% 33% 44%
Mortgage rates are not favorable 20% 31% 19% 13% 1%
There are not many homes available on the market 19% 23% 10% 27% 5%
It is difficult to qualify for a mortgage 13% 0% 33% 0% 5%
Home prices are high 6% 15% 0% 7% 29%
Q4 2020 Mortgage Lender Sentiment Survey®
© 2020 Fannie Mae. Trademarks of Fannie Mae.40
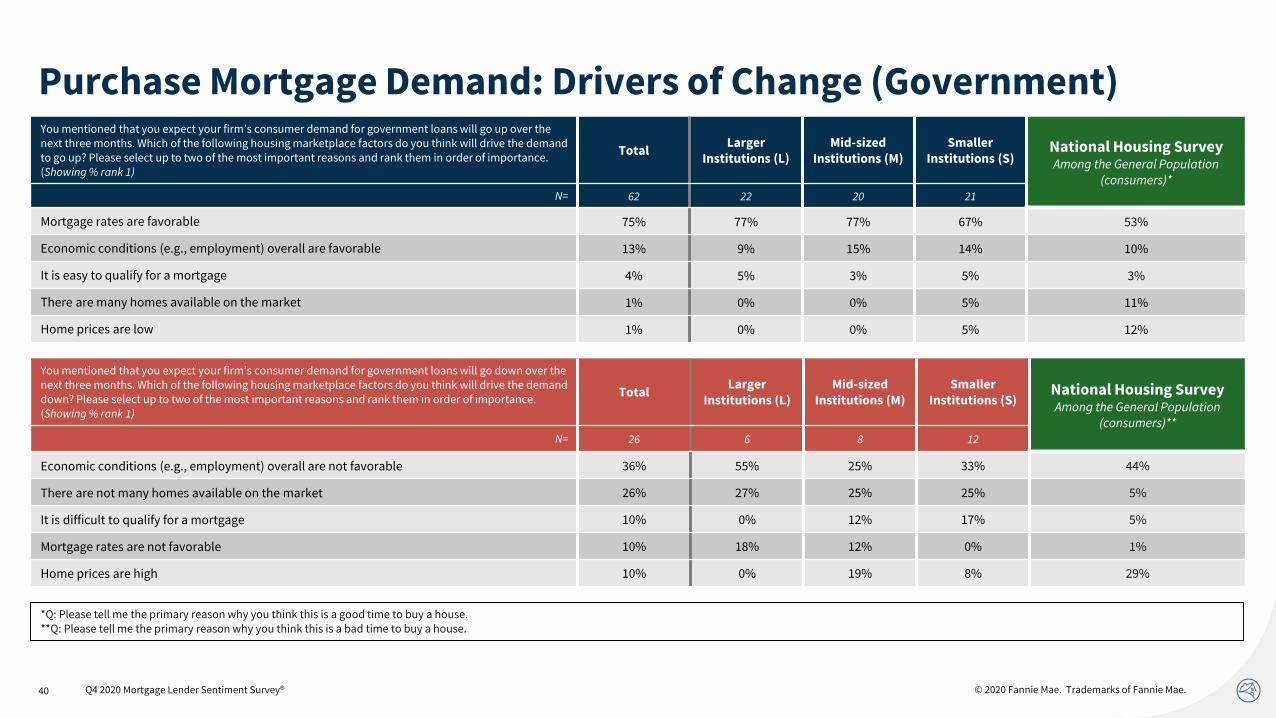
*Q: Please tell me the primary reason why you think this is a good time to buy a house.**Q: Please tell me the primary reason why you think this is a bad time to buy a house.
Purchase Mortgage Demand: Drivers of Change (Government)You mentioned that you expect your firm’s consumer demand for government loans will go up over the next three months. Which of the following housing marketplace factors do you think will drive the demand to go up? Please select up to two of the most important reasons and rank them in order of importance. (Showing % rank 1)
TotalLarger
Institutions (L)Mid-sized
Institutions (M)Smaller
Institutions (S)National Housing SurveyAmong the General Population
(consumers)*N= 62 22 20 21
Mortgage rates are favorable 75% 77% 77% 67% 53%
Economic conditions (e.g., employment) overall are favorable 13% 9% 15% 14% 10%
It is easy to qualify for a mortgage 4% 5% 3% 5% 3%
There are many homes available on the market 1% 0% 0% 5% 11%
Home prices are low 1% 0% 0% 5% 12%
You mentioned that you expect your firm’s consumer demand for government loans will go down over the next three months. Which of the following housing marketplace factors do you think will drive the demand down? Please select up to two of the most important reasons and rank them in order of importance. (Showing % rank 1)
TotalLarger
Institutions (L)Mid-sized
Institutions (M)Smaller
Institutions (S)National Housing SurveyAmong the General Population
(consumers)**N= 26 6 8 12
Economic conditions (e.g., employment) overall are not favorable 36% 55% 25% 33% 44%
There are not many homes available on the market 26% 27% 25% 25% 5%
It is difficult to qualify for a mortgage 10% 0% 12% 17% 5%
Mortgage rates are not favorable 10% 18% 12% 0% 1%
Home prices are high 10% 0% 19% 8% 29%
Q4 2020 Mortgage Lender Sentiment Survey®
© 2020 Fannie Mae. Trademarks of Fannie Mae.41
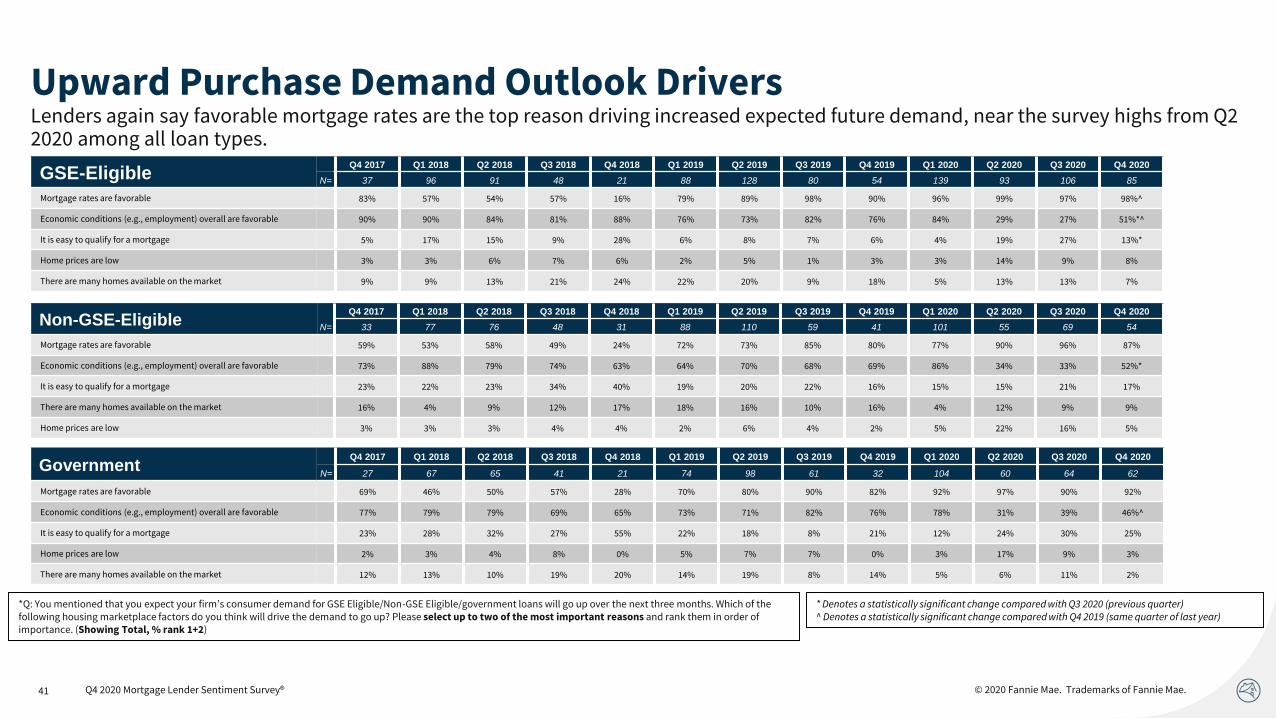
Upward Purchase Demand Outlook DriversLenders again say favorable mortgage rates are the top reason driving increased expected future demand, near the survey highs from Q2 2020 among all loan types.
*Q: You mentioned that you expect your firm’s consumer demand for GSE Eligible/Non-GSE Eligible/government loans will go up over the next three months. Which of the following housing marketplace factors do you think will drive the demand to go up? Please select up to two of the most important reasons and rank them in order of importance. (Showing Total, % rank 1+2)
* Denotes a statistically significant change compared with Q3 2020 (previous quarter)^ Denotes a statistically significant change compared with Q4 2019 (same quarter of last year)
Q4 2020 Mortgage Lender Sentiment Survey®
GovernmentQ4 2017 Q1 2018 Q2 2018 Q3 2018 Q4 2018 Q1 2019 Q2 2019 Q3 2019 Q4 2019 Q1 2020 Q2 2020 Q3 2020 Q4 2020
N= 27 67 65 41 21 74 98 61 32 104 60 64 62
Mortgage rates are favorable 69% 46% 50% 57% 28% 70% 80% 90% 82% 92% 97% 90% 92%
Economic conditions (e.g., employment) overall are favorable 77% 79% 79% 69% 65% 73% 71% 82% 76% 78% 31% 39% 46%^
It is easy to qualify for a mortgage 23% 28% 32% 27% 55% 22% 18% 8% 21% 12% 24% 30% 25%
Home prices are low 2% 3% 4% 8% 0% 5% 7% 7% 0% 3% 17% 9% 3%
There are many homes available on the market 12% 13% 10% 19% 20% 14% 19% 8% 14% 5% 6% 11% 2%
Non-GSE-EligibleQ4 2017 Q1 2018 Q2 2018 Q3 2018 Q4 2018 Q1 2019 Q2 2019 Q3 2019 Q4 2019 Q1 2020 Q2 2020 Q3 2020 Q4 2020
N= 33 77 76 48 31 88 110 59 41 101 55 69 54
Mortgage rates are favorable 59% 53% 58% 49% 24% 72% 73% 85% 80% 77% 90% 96% 87%
Economic conditions (e.g., employment) overall are favorable 73% 88% 79% 74% 63% 64% 70% 68% 69% 86% 34% 33% 52%*
It is easy to qualify for a mortgage 23% 22% 23% 34% 40% 19% 20% 22% 16% 15% 15% 21% 17%
There are many homes available on the market 16% 4% 9% 12% 17% 18% 16% 10% 16% 4% 12% 9% 9%
Home prices are low 3% 3% 3% 4% 4% 2% 6% 4% 2% 5% 22% 16% 5%
GSE-EligibleQ4 2017 Q1 2018 Q2 2018 Q3 2018 Q4 2018 Q1 2019 Q2 2019 Q3 2019 Q4 2019 Q1 2020 Q2 2020 Q3 2020 Q4 2020
N= 37 96 91 48 21 88 128 80 54 139 93 106 85
Mortgage rates are favorable 83% 57% 54% 57% 16% 79% 89% 98% 90% 96% 99% 97% 98%^
Economic conditions (e.g., employment) overall are favorable 90% 90% 84% 81% 88% 76% 73% 82% 76% 84% 29% 27% 51%*^
It is easy to qualify for a mortgage 5% 17% 15% 9% 28% 6% 8% 7% 6% 4% 19% 27% 13%*
Home prices are low 3% 3% 6% 7% 6% 2% 5% 1% 3% 3% 14% 9% 8%
There are many homes available on the market 9% 9% 13% 21% 24% 22% 20% 9% 18% 5% 13% 13% 7%
© 2020 Fannie Mae. Trademarks of Fannie Mae.
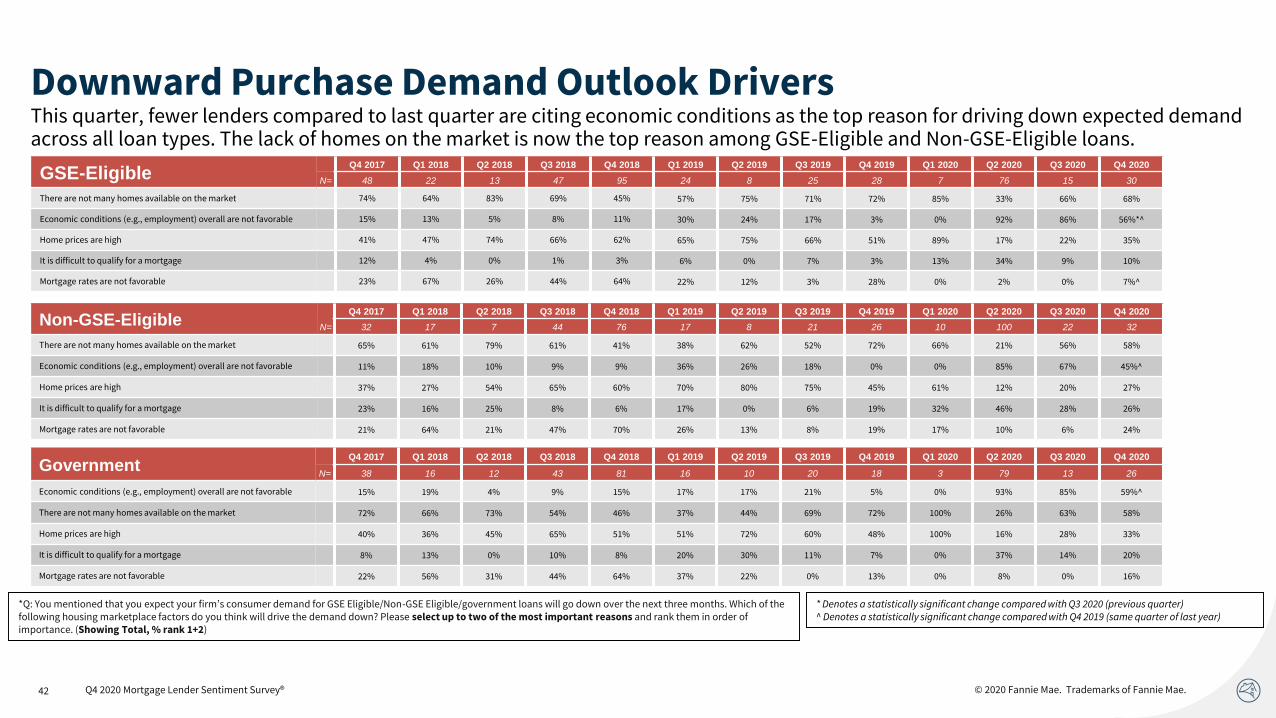
Downward Purchase Demand Outlook DriversThis quarter, fewer lenders compared to last quarter are citing economic conditions as the top reason for driving down expected demand across all loan types. The lack of homes on the market is now the top reason among GSE-Eligible and Non-GSE-Eligible loans.
42
GovernmentQ4 2017 Q1 2018 Q2 2018 Q3 2018 Q4 2018 Q1 2019 Q2 2019 Q3 2019 Q4 2019 Q1 2020 Q2 2020 Q3 2020 Q4 2020
N= 38 16 12 43 81 16 10 20 18 3 79 13 26
Economic conditions (e.g., employment) overall are not favorable 15% 19% 4% 9% 15% 17% 17% 21% 5% 0% 93% 85% 59%^
There are not many homes available on the market 72% 66% 73% 54% 46% 37% 44% 69% 72% 100% 26% 63% 58%
Home prices are high 40% 36% 45% 65% 51% 51% 72% 60% 48% 100% 16% 28% 33%
It is difficult to qualify for a mortgage 8% 13% 0% 10% 8% 20% 30% 11% 7% 0% 37% 14% 20%
Mortgage rates are not favorable 22% 56% 31% 44% 64% 37% 22% 0% 13% 0% 8% 0% 16%
Non-GSE-EligibleQ4 2017 Q1 2018 Q2 2018 Q3 2018 Q4 2018 Q1 2019 Q2 2019 Q3 2019 Q4 2019 Q1 2020 Q2 2020 Q3 2020 Q4 2020
N= 32 17 7 44 76 17 8 21 26 10 100 22 32
There are not many homes available on the market 65% 61% 79% 61% 41% 38% 62% 52% 72% 66% 21% 56% 58%
Economic conditions (e.g., employment) overall are not favorable 11% 18% 10% 9% 9% 36% 26% 18% 0% 0% 85% 67% 45%^
Home prices are high 37% 27% 54% 65% 60% 70% 80% 75% 45% 61% 12% 20% 27%
It is difficult to qualify for a mortgage 23% 16% 25% 8% 6% 17% 0% 6% 19% 32% 46% 28% 26%
Mortgage rates are not favorable 21% 64% 21% 47% 70% 26% 13% 8% 19% 17% 10% 6% 24%
*Q: You mentioned that you expect your firm’s consumer demand for GSE Eligible/Non-GSE Eligible/government loans will go down over the next three months. Which of the following housing marketplace factors do you think will drive the demand down? Please select up to two of the most important reasons and rank them in order of importance. (Showing Total, % rank 1+2)
GSE-EligibleQ4 2017 Q1 2018 Q2 2018 Q3 2018 Q4 2018 Q1 2019 Q2 2019 Q3 2019 Q4 2019 Q1 2020 Q2 2020 Q3 2020 Q4 2020
N= 48 22 13 47 95 24 8 25 28 7 76 15 30
There are not many homes available on the market 74% 64% 83% 69% 45% 57% 75% 71% 72% 85% 33% 66% 68%
Economic conditions (e.g., employment) overall are not favorable 15% 13% 5% 8% 11% 30% 24% 17% 3% 0% 92% 86% 56%*^
Home prices are high 41% 47% 74% 66% 62% 65% 75% 66% 51% 89% 17% 22% 35%
It is difficult to qualify for a mortgage 12% 4% 0% 1% 3% 6% 0% 7% 3% 13% 34% 9% 10%
Mortgage rates are not favorable 23% 67% 26% 44% 64% 22% 12% 3% 28% 0% 2% 0% 7%^
* Denotes a statistically significant change compared with Q3 2020 (previous quarter)^ Denotes a statistically significant change compared with Q4 2019 (same quarter of last year)
Q4 2020 Mortgage Lender Sentiment Survey®
© 2020 Fannie Mae. Trademarks of Fannie Mae.
Appendix
Survey Methodology Details……………………………………………………………….………… 19
Economic and Housing Sentiment…………………………………………………….……………. 27
Consumer Demand (Purchase Mortgages)……………………………………………………….... 30
Consumer Demand (Refinance Mortgages)…………………………………………………..……. 43
Credit Standards………………………………………………………………………………………. 50
Profit Margin Outlook………………………………………………………………………………… 58
Survey Question Text…………………………………………………………………………………. 63
© 2020 Fannie Mae. Trademarks of Fannie Mae.44
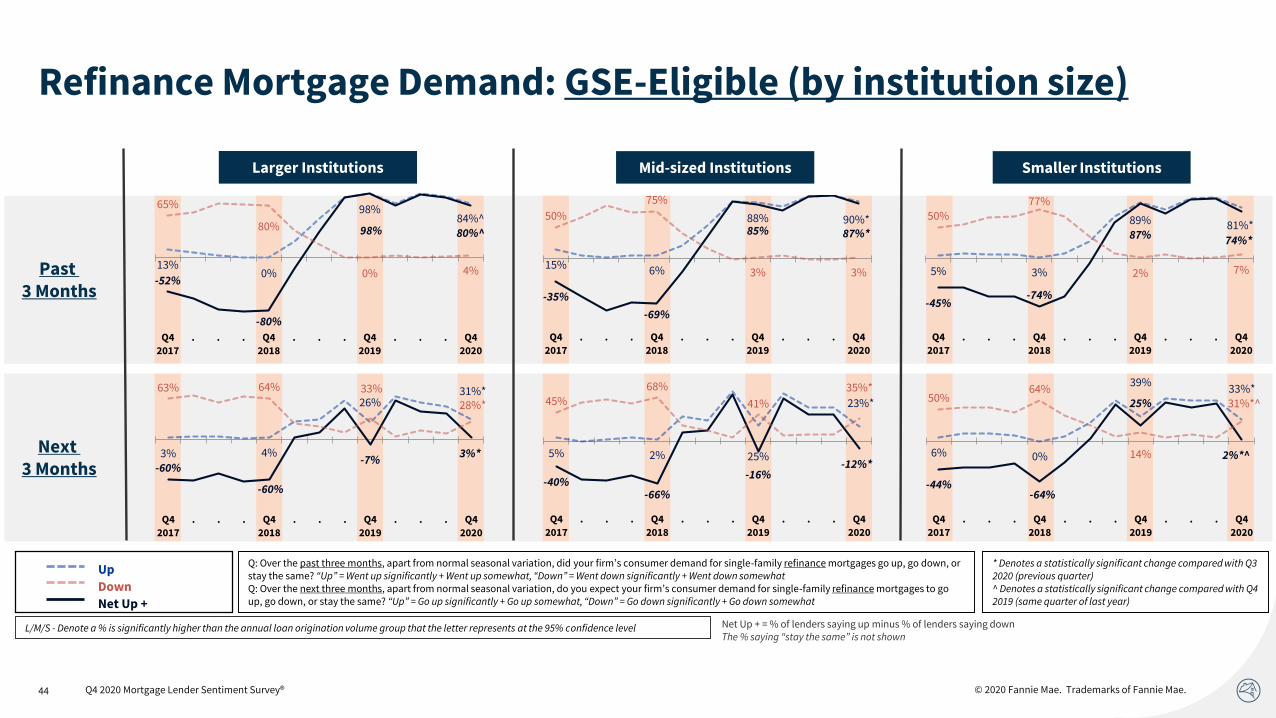
Refinance Mortgage Demand: GSE-Eligible (by institution size)
Q: Over the past three months, apart from normal seasonal variation, did your firm’s consumer demand for single-family refinance mortgages go up, go down, or stay the same? “Up” = Went up significantly + Went up somewhat, “Down” = Went down significantly + Went down somewhatQ: Over the next three months, apart from normal seasonal variation, do you expect your firm’s consumer demand for single-family refinance mortgages to go up, go down, or stay the same? “Up” = Go up significantly + Go up somewhat, “Down” = Go down significantly + Go down somewhat
* Denotes a statistically significant change compared with Q3 2020 (previous quarter)^ Denotes a statistically significant change compared with Q4 2019 (same quarter of last year)
Mid-sized InstitutionsLarger Institutions Smaller Institutions
Past 3 Months
Next 3 Months
13%0%
98%84%^
-52%
-80%
98% 80%^
65%
80%
0% 4%
Q4
2017
. . . Q4
2018
. . . Q4
2019
. . . Q4
2020
15% 6%
88% 90%*
-35%
-69%
85% 87%*
50%
75%
3% 3%
Q42017
. . . Q42018
. . . Q42019
. . . Q42020
5% 3%
89% 81%*
-45%-74%
87% 74%*
50%77%
2% 7%
Q42017
. . . Q42018
. . . Q42019
. . . Q42020
3% 4%
26%31%*
-60%
-60%
-7%3%*
63% 64% 33%
28%*
Q4
2017
. . . Q4
2018
. . . Q4
2019
. . . Q4
2020
5% 2% 25%
23%*
-40%-66%
-16%-12%*
45%68%
41%
35%*
Q4
2017. . . Q4
2018. . . Q4
2019. . . Q4
2020
6% 0%
39%33%*
-44%-64%
25%
2%*^
50%64%
14%
31%*^
Q4
2017. . . Q4
2018. . . Q4
2019. . . Q4
2020
L/M/S - Denote a % is significantly higher than the annual loan origination volume group that the letter represents at the 95% confidence level Net Up + = % of lenders saying up minus % of lenders saying downThe % saying “stay the same” is not shown
Q4 2020 Mortgage Lender Sentiment Survey®
Up
Net Up +
Down
© 2020 Fannie Mae. Trademarks of Fannie Mae.45
Refinance Mortgage Demand: GSE-Eligible (by institution type)
Q: Over the past three months, apart from normal seasonal variation, did your firm’s consumer demand for single-family refinance mortgages go up, go down, or stay the same? “Up” = Went up significantly + Went up somewhat, “Down” = Went down significantly + Went down somewhatQ: Over the next three months, apart from normal seasonal variation, do you expect your firm’s consumer demand for single-family refinance mortgages to go up, go down, or stay the same? “Up” = Go up significantly + Go up somewhat, “Down” = Go down significantly + Go down somewhat
* Denotes a statistically significant change compared with Q3 2020 (previous quarter)^ Denotes a statistically significant change compared with Q4 2019 (same quarter of last year)
Depository InstitutionsMortgage Banks Credit Unions
Past 3 Months
Next 3 Months
14%3%
88% 90%
-46%
-71%
86% 85%
60%74%
2% 5%
Q4
2017
. . . Q4
2018
. . . Q4
2019
. . . Q4
2020
7% 5%
94% 80%*^
-51%
-76%
92% 75%*^
58%81%
2% 5%
Q42017
. . . Q42018
. . . Q42019
. . . Q42020
14%0%
100%80%^
-29%
-75%
100%73%^
43%
75%
0% 7%
Q42017
. . . Q42018
. . . Q42019
. . . Q42020
2% 3%
23% 31%*
-58%
-63%
-5% -3%*
60% 66% 28% 34%*
Q4
2017
. . . Q4
2018
. . . Q4
2019
. . . Q4
2020
5% 1%
33% 31%*
-47%
-62%
6%3%*
52%63%
27% 28%*
Q4
2017. . . Q4
2018. . . Q4
2019. . . Q4
2020
8% 0%
46%
26%*
-37%
-70%
23%-6%*
45%
70%
23%
32%*
Q4
2017. . . Q4
2018. . . Q4
2019. . . Q4
2020
M/D/C - Denote a % is significantly higher than the institution type group that the letter represents at the 95% confidence level Net Up + = % of lenders saying up minus % of lenders saying downThe % saying “stay the same” is not shown
Q4 2020 Mortgage Lender Sentiment Survey®
Up
Net Up +
Down

© 2020 Fannie Mae. Trademarks of Fannie Mae.46
Refinance Mortgage Demand: Non-GSE-Eligible (by institution size)
Q: Over the past three months, apart from normal seasonal variation, did your firm’s consumer demand for single-family refinance mortgages go up, go down, or stay the same? “Up” = Went up significantly + Went up somewhat, “Down” = Went down significantly + Went down somewhatQ: Over the next three months, apart from normal seasonal variation, do you expect your firm’s consumer demand for single-family refinance mortgages to go up, go down, or stay the same? “Up” = Go up significantly + Go up somewhat, “Down” = Go down significantly + Go down somewhat
* Denotes a statistically significant change compared with Q3 2020 (previous quarter)^ Denotes a statistically significant change compared with Q4 2019 (same quarter of last year)
Mid-sized InstitutionsLarger Institutions Smaller Institutions
Past 3 Months
Next 3 Months
7% 4%86%
56%^
-47%
-70%
86%
42%^
54%74%
0%
14%^
Q4
2017
. . . Q4
2018
. . . Q4
2019
. . . Q4
2020
6% 4%
67% 59%*
-39%
-60%
61% 42%
45%64%
6%
17%
Q42017
. . . Q42018
. . . Q42019
. . . Q42020
4% 4%
60% 60%
-43%
-70%
57% 49%47%
74%
3% 11%
Q42017
. . . Q42018
. . . Q42019
. . . Q42020
3% 4%
21% 18%*
-53%
-62%
-16% -11%*
56%66%
37% 29%
Q4
2017
. . . Q4
2018
. . . Q4
2019
. . . Q4
2020
8% 3%
22% 12%*
-32%
-60%
-16% -24%*
40%63% 38% 36%*
Q4
2017. . . Q4
2018. . . Q4
2019. . . Q4
2020
5% 0%
32%
25%*
-35%
-67%
18%
-3%*
40%
67%
14%
28%*
Q4
2017. . . Q4
2018. . . Q4
2019. . . Q4
2020
L/M/S - Denote a % is significantly higher than the annual loan origination volume group that the letter represents at the 95% confidence level Net Up + = % of lenders saying up minus % of lenders saying downThe % saying “stay the same” is not shown
Q4 2020 Mortgage Lender Sentiment Survey®
Up
Net Up +
Down
© 2020 Fannie Mae. Trademarks of Fannie Mae.47
Refinance Mortgage Demand: Non-GSE-Eligible (by institution type)
Q: Over the past three months, apart from normal seasonal variation, did your firm’s consumer demand for single-family refinance mortgages go up, go down, or stay the same? “Up” = Went up significantly + Went up somewhat, “Down” = Went down significantly + Went down somewhatQ: Over the next three months, apart from normal seasonal variation, do you expect your firm’s consumer demand for single-family refinance mortgages to go up, go down, or stay the same? “Up” = Go up significantly + Go up somewhat, “Down” = Go down significantly + Go down somewhat
* Denotes a statistically significant change compared with Q3 2020 (previous quarter)^ Denotes a statistically significant change compared with Q4 2019 (same quarter of last year)
Depository InstitutionsMortgage Banks Credit Unions
Past 3 Months
Next 3 Months
7% 3%
65% 48%
-46%
-61%
61% 27%^
53%64%
4%
21%^
Q4
2017
. . . Q4
2018
. . . Q4
2019
. . . Q4
2020
4% 7%
69% 61%
-49%
-69%
66% 52%
53%76%
3% 9%
Q42017
. . . Q42018
. . . Q42019
. . . Q42020
9% 0%
92%
73%M
-30%
-69%
92% 64%^M39%
69%
0% 9%
Q42017
. . . Q42018
. . . Q42019
. . . Q42020
3% 6%19% 21%
-51%
-57%
-14% -9%*
54% 63%33% 30%
Q4
2017
. . . Q4
2018
. . . Q4
2019
. . . Q4
2020
4% 0%
25% 21%*
-39%
-63%
-1% -10%*
43%63%
26% 31%*
Q4
2017. . . Q4
2018. . . Q4
2019. . . Q4
2020
11%0%
44%18%*^
-30%
-72%
24%
-14%*
41%
72%
20%
32%*
Q4
2017. . . Q4
2018. . . Q4
2019. . . Q4
2020
M/D/C - Denote a % is significantly higher than the institution type group that the letter represents at the 95% confidence level Net Up + = % of lenders saying up minus % of lenders saying downThe % saying “stay the same” is not shown
Q4 2020 Mortgage Lender Sentiment Survey®
Up
Net Up +
Down

© 2020 Fannie Mae. Trademarks of Fannie Mae.48
Refinance Mortgage Demand: Government (by institution size)
Q: Over the past three months, apart from normal seasonal variation, did your firm’s consumer demand for single-family refinance mortgages go up, go down, or stay the same? “Up” = Went up significantly + Went up somewhat, “Down” = Went down significantly + Went down somewhatQ: Over the next three months, apart from normal seasonal variation, do you expect your firm’s consumer demand for single-family refinance mortgages to go up, go down, or stay the same? “Up” = Go up significantly + Go up somewhat, “Down” = Go down significantly + Go down somewhat
* Denotes a statistically significant change compared with Q3 2020 (previous quarter)^ Denotes a statistically significant change compared with Q4 2019 (same quarter of last year)
Mid-sized InstitutionsLarger Institutions Smaller Institutions
Past 3 Months
Next 3 Months
8% 4%
85%67%^
-54%
-74%
84% 60%^
62%78%
1% 7%
Q4
2017
. . . Q4
2018
. . . Q4
2019
. . . Q4
2020
4% 6%
74% 69%
-51%
-65%
68% 58%
55%71%
6% 11%
Q42017
. . . Q42018
. . . Q42019
. . . Q42020
4% 0%
61% 54%
-50%
-75%
56% 44%54%75%
5% 10%
Q42017
. . . Q42018
. . . Q42019
. . . Q42020
3% 5%18%
27%
-59%
-59%
-26%
1%
62% 64%44%
26%
Q4
2017
. . . Q4
2018
. . . Q4
2019
. . . Q4
2020
4% 2%
21%25%
-42%
-60%
-14% -3%*
46%62%
35% 28%
Q4
2017. . . Q4
2018. . . Q4
2019. . . Q4
2020
3% 0%
18% 22%
-53%
-64%
8%0%*
56% 64%
10% 22%*
Q4
2017. . . Q4
2018. . . Q4
2019. . . Q4
2020
L/M/S - Denote a % is significantly higher than the annual loan origination volume group that the letter represents at the 95% confidence level Net Up + = % of lenders saying up minus % of lenders saying downThe % saying “stay the same” is not shown
Q4 2020 Mortgage Lender Sentiment Survey®
Up
Net Up +
Down

© 2020 Fannie Mae. Trademarks of Fannie Mae.49
Refinance Mortgage Demand: Government (by institution type)
Q: Over the past three months, apart from normal seasonal variation, did your firm’s consumer demand for single-family refinance mortgages go up, go down, or stay the same? “Up” = Went up significantly + Went up somewhat, “Down” = Went down significantly + Went down somewhatQ: Over the next three months, apart from normal seasonal variation, do you expect your firm’s consumer demand for single-family refinance mortgages to go up, go down, or stay the same? “Up” = Go up significantly + Go up somewhat, “Down” = Go down significantly + Go down somewhat
* Denotes a statistically significant change compared with Q3 2020 (previous quarter)^ Denotes a statistically significant change compared with Q4 2019 (same quarter of last year)
Depository InstitutionsMortgage Banks Credit Unions
Past 3 Months
Next 3 Months
5% 4%
82%75%*D/C
-57%
-70%
77% 67%*
62% 74%
5%
8%
Q4
2017
. . . Q4
2018
. . . Q4
2019
. . . Q4
2020
6% 3%
65% 50%*
-51%
-72%
61%41%
57%75%
4% 9%
Q42017
. . . Q42018
. . . Q42019
. . . Q42020
8% 0%
65% 50%
-37%
-74%
65%38%45%
74%
0%12%
Q42017
. . . Q42018
. . . Q42019
. . . Q42020
4% 4%16%
29%*
-56%
-60%
-18%
4%*
60% 64%34%
25%*
Q4
2017
. . . Q4
2018
. . . Q4
2019
. . . Q4
2020
2% 1%20% 19%
-52%
-60%
-8% -3%*
54% 61%28% 22%
Q42017
. . . Q42018
. . . Q42019
. . . Q42020
5% 0%
29%24%
-40%
-68%
11%-9%
45%68%
18%33%
Q4
2017. . . Q4
2018. . . Q4
2019. . . Q4
2020
M/D/C - Denote a % is significantly higher than the institution type group that the letter represents at the 95% confidence level Net Up + = % of lenders saying up minus % of lenders saying downThe % saying “stay the same” is not shown
Q4 2020 Mortgage Lender Sentiment Survey®
Up
Net Up +
Down
© 2020 Fannie Mae. Trademarks of Fannie Mae.
Appendix
Survey Methodology Details……………………………………………………………….………… 19
Economic and Housing Sentiment…………………………………………………….……………. 27
Consumer Demand (Purchase Mortgages)……………………………………………………….... 30
Consumer Demand (Refinance Mortgages)…………………………………………………..……. 43
Credit Standards………………………………………………………………………………………. 50
Profit Margin Outlook………………………………………………………………………………… 58
Survey Question Text…………………………………………………………………………………. 63

© 2020 Fannie Mae. Trademarks of Fannie Mae.51
Credit Standards: GSE-Eligible (by institution size)
Q: Over the past three months, how did your firm’s credit standards for approving consumer applications for mortgage loans change (across both purchase mortgages and refinance mortgages)? “Ease” = Eased considerably + Eased somewhat, “Tighten” = Tightened somewhat + Tightened considerablyQ: Over the next three months, how do you expect your firm’s credit standards for approving applications from individuals for mortgage loans to change (across purchase mortgages and refinance mortgages)? “Ease” = Ease considerably + Ease somewhat, “Tighten” = Tighten somewhat + Tighten considerably
* Denotes a statistically significant change compared with Q3 2020 (previous quarter)^ Denotes a statistically significant change compared with Q4 2019 (same quarter of last year)
Mid-sized InstitutionsLarger Institutions Smaller Institutions
Past 3 Months
Next 3 Months
28%
15%
1%
16%^S28%
13%
-5%-4%*
0% 2%
6%
20%*
Q4
2017
. . . Q4
2018
. . . Q4
2019
. . . Q4
2020
29%
12% 11% 6%29%
10% 8%
-18%^0%
2% 3%
24%^
Q42017
. . . Q42018
. . . Q42019
. . . Q42020
18%
6% 9%
4%
17%
4%3%
-18%^
1%2%
6%
22%^
Q42017
. . . Q42018
. . . Q42019
. . . Q42020
13% 12%
2%
12%
12% 10%
-4%
12%^S1%
2%
6%
0%
Q4
2017
. . . Q4
2018
. . . Q4
2019
. . . Q4
2020
9% 12% 5% 6%
9% 9% 5%
0%0% 3% 0%
6%
Q4
2017. . . Q4
2018. . . Q4
2019. . . Q4
2020
4% 6%
1% 3%3% 3%
-5% -1%1% 3%
6% 4%
Q42017
. . . Q42018
. . . Q42019
. . . Q42020
L/M/S - Denote a % is significantly higher than the annual loan origination volume group that the letter represents at the 95% confidence level Net Ease + = % of lenders saying up minus % of lenders saying downThe % saying “stay the same” is not shown
Q4 2020 Mortgage Lender Sentiment Survey®
Ease
Net Ease +
Tighten

© 2020 Fannie Mae. Trademarks of Fannie Mae.52
Credit Standards: GSE-Eligible (by institution type)
Q: Over the past three months, how did your firm’s credit standards for approving consumer applications for mortgage loans change (across both purchase mortgages and refinance mortgages)? “Ease” = Eased considerably + Eased somewhat, “Tighten” = Tightened somewhat + Tightened considerablyQ: Over the next three months, how do you expect your firm’s credit standards for approving applications from individuals for mortgage loans to change (across purchase mortgages and refinance mortgages)? “Ease” = Ease considerably + Ease somewhat, “Tighten” = Tighten somewhat + Tighten considerably
* Denotes a statistically significant change compared with Q3 2020 (previous quarter)^ Denotes a statistically significant change compared with Q4 2019 (same quarter of last year)
Depository InstitutionsMortgage Banks Credit Unions
Past 3 Months
Next 3 Months
33%11%
3% 11%33%
9%
-3% -16%0%
2%
6%
27%*^
Q4
2017
. . . Q4
2018
. . . Q4
2019
. . . Q4
2020
19%8% 7%
9%
18%7%
1% -9%*1%
1%
6%
18%
Q42017
. . . Q42018
. . . Q42019
. . . Q42020
16%5% 13%
2%
16%4% 10%
-15%*^0%
1% 3%
17%*
Q42017
. . . Q42018
. . . Q42019
. . . Q42020
11% 14%
3%
8%
11% 13%
-2% 3%0% 1%
5%
5%
Q4
2017
. . . Q4
2018
. . . Q4
2019
. . . Q4
2020
9% 5%
2%
9%
6%
2% -3%9%*^C
3%3%
5%
0%*
Q4
2017. . . Q4
2018. . . Q4
2019. . . Q4
2020
3% 8% 3%
0%3% 4% 3%
-5%0% 4% 0%
5%
Q42017
. . . Q42018
. . . Q42019
. . . Q42020
M/D/C - Denote a % is significantly higher than the institution type group that the letter represents at the 95% confidence level Net Ease + = % of lenders saying up minus % of lenders saying downThe % saying “stay the same” is not shown
Q4 2020 Mortgage Lender Sentiment Survey®
Ease
Net Ease +
Tighten
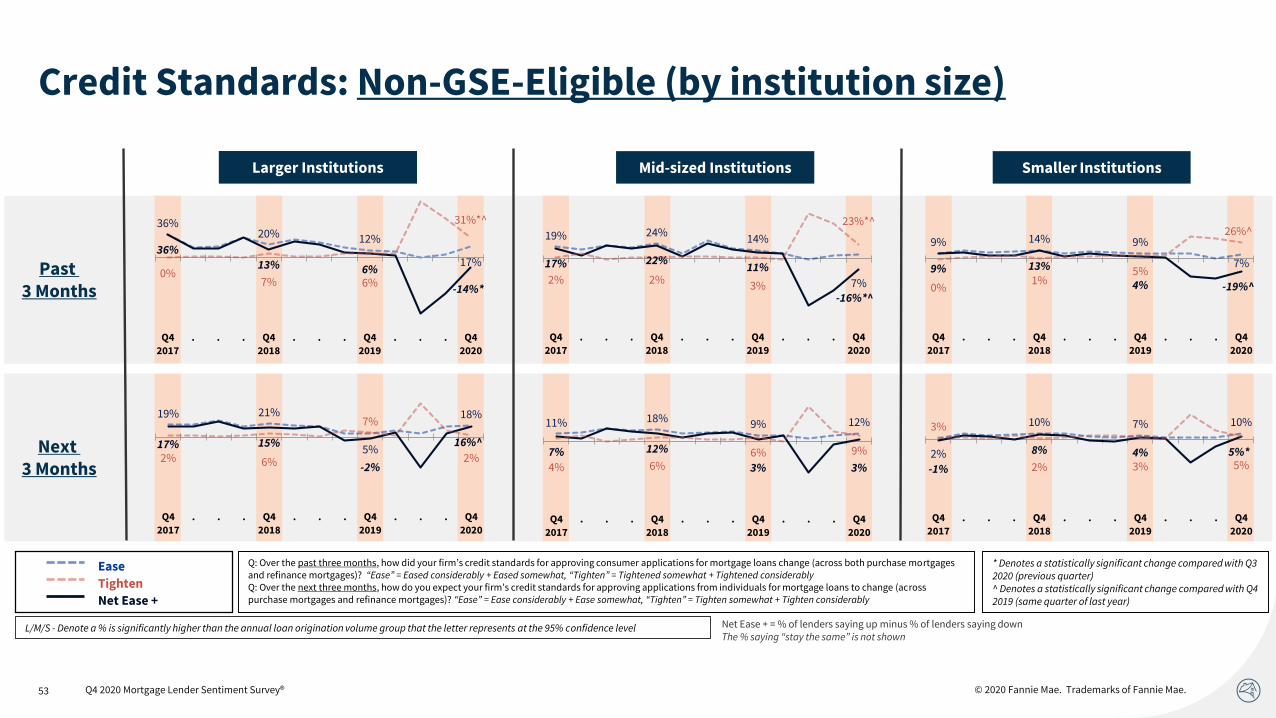
© 2020 Fannie Mae. Trademarks of Fannie Mae.53
Credit Standards: Non-GSE-Eligible (by institution size)
Q: Over the past three months, how did your firm’s credit standards for approving consumer applications for mortgage loans change (across both purchase mortgages and refinance mortgages)? “Ease” = Eased considerably + Eased somewhat, “Tighten” = Tightened somewhat + Tightened considerablyQ: Over the next three months, how do you expect your firm’s credit standards for approving applications from individuals for mortgage loans to change (across purchase mortgages and refinance mortgages)? “Ease” = Ease considerably + Ease somewhat, “Tighten” = Tighten somewhat + Tighten considerably
* Denotes a statistically significant change compared with Q3 2020 (previous quarter)^ Denotes a statistically significant change compared with Q4 2019 (same quarter of last year)
Mid-sized InstitutionsLarger Institutions Smaller Institutions
Past 3 Months
Next 3 Months
36%20% 12%
17%36%
13% 6%
-14%*
0%7% 6%
31%*^
Q4
2017
. . . Q4
2018
. . . Q4
2019
. . . Q4
2020
19% 24%14%
7%
17% 22%11%
-16%*^
2% 2%3%
23%*^
Q42017
. . . Q42018
. . . Q42019
. . . Q42020
9% 14% 9%
7%9% 13%
4% -19%^0%1%
5%
26%^
Q42017
. . . Q42018
. . . Q42019
. . . Q42020
19% 21%
5%
18%
17% 15%
-2%
16%^
2% 6%
7%
2%
Q42017
. . . Q42018
. . . Q42019
. . . Q42020
11% 18% 9% 12%
7% 12%
3% 3%4% 6%6% 9%
Q4
2017. . . Q4
2018. . . Q4
2019. . . Q4
2020
2%
10% 7% 10%
-1%
8% 4% 5%*
3%
2% 3% 5%
Q42017
. . . Q42018
. . . Q42019
. . . Q42020
L/M/S - Denote a % is significantly higher than the annual loan origination volume group that the letter represents at the 95% confidence level Net Ease + = % of lenders saying up minus % of lenders saying downThe % saying “stay the same” is not shown
Q4 2020 Mortgage Lender Sentiment Survey®
Ease
Net Ease +
Tighten
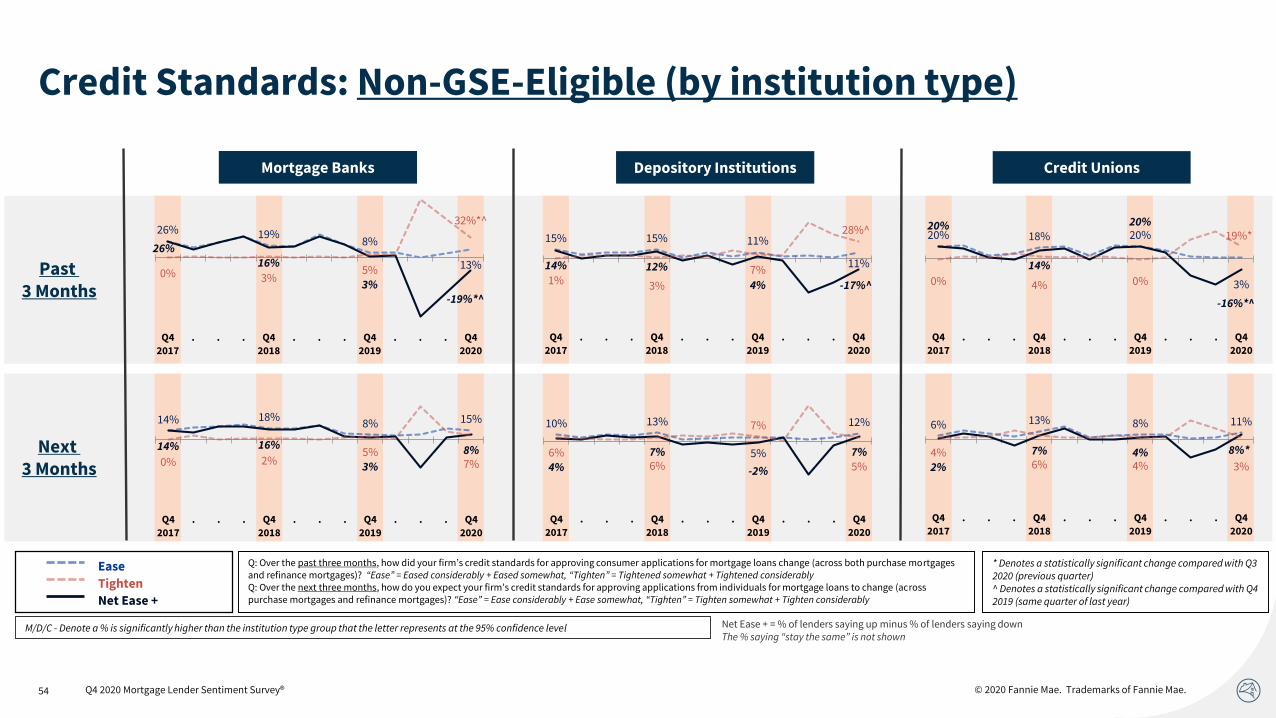
© 2020 Fannie Mae. Trademarks of Fannie Mae.54
Credit Standards: Non-GSE-Eligible (by institution type)
Q: Over the past three months, how did your firm’s credit standards for approving consumer applications for mortgage loans change (across both purchase mortgages and refinance mortgages)? “Ease” = Eased considerably + Eased somewhat, “Tighten” = Tightened somewhat + Tightened considerablyQ: Over the next three months, how do you expect your firm’s credit standards for approving applications from individuals for mortgage loans to change (across purchase mortgages and refinance mortgages)? “Ease” = Ease considerably + Ease somewhat, “Tighten” = Tighten somewhat + Tighten considerably
* Denotes a statistically significant change compared with Q3 2020 (previous quarter)^ Denotes a statistically significant change compared with Q4 2019 (same quarter of last year)
Depository InstitutionsMortgage Banks Credit Unions
Past 3 Months
Next 3 Months
26% 19%8%
13%
26%16%
3%-19%*^
0% 3%5%
32%*^
Q4
2017
. . . Q4
2018
. . . Q4
2019
. . . Q4
2020
15% 15% 11%
11%14% 12%
4% -17%^1% 3%
7%
28%^
Q42017
. . . Q42018
. . . Q42019
. . . Q42020
20% 18% 20%
3%
20%
14%
20%
-16%*^
0% 4% 0%
19%*
Q42017
. . . Q42018
. . . Q42019
. . . Q42020
14% 18%8% 15%
14% 16%
3%
8%0% 2%
5%7%
Q4
2017
. . . Q4
2018
. . . Q4
2019
. . . Q4
2020
10% 13%
5%
12%
4%
7%
-2%
7%6%6%
7%
5%
Q4
2017. . . Q4
2018. . . Q4
2019. . . Q4
2020
6% 13% 8% 11%
2%
7% 4% 8%*4%6% 4% 3%
Q42017
. . . Q42018
. . . Q42019
. . . Q42020
M/D/C - Denote a % is significantly higher than the institution type group that the letter represents at the 95% confidence level Net Ease + = % of lenders saying up minus % of lenders saying downThe % saying “stay the same” is not shown
Q4 2020 Mortgage Lender Sentiment Survey®
Ease
Net Ease +
Tighten
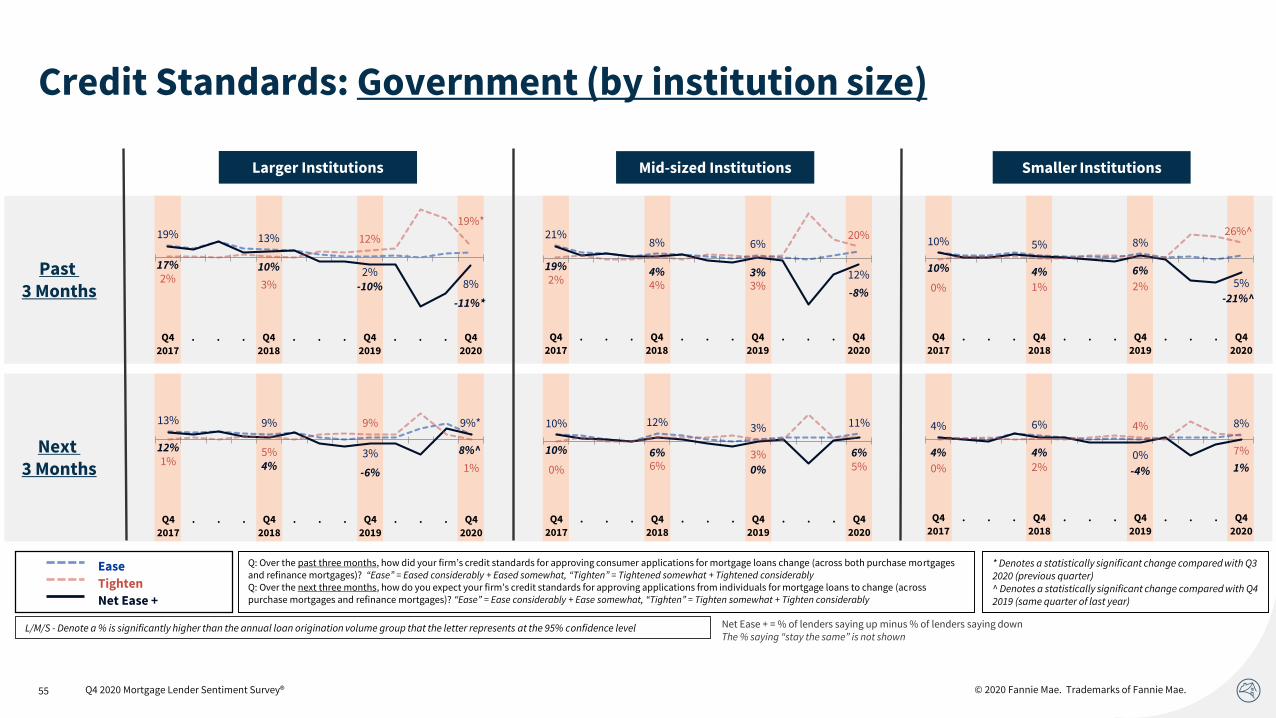
© 2020 Fannie Mae. Trademarks of Fannie Mae.55
Credit Standards: Government (by institution size)
Q: Over the past three months, how did your firm’s credit standards for approving consumer applications for mortgage loans change (across both purchase mortgages and refinance mortgages)? “Ease” = Eased considerably + Eased somewhat, “Tighten” = Tightened somewhat + Tightened considerablyQ: Over the next three months, how do you expect your firm’s credit standards for approving applications from individuals for mortgage loans to change (across purchase mortgages and refinance mortgages)? “Ease” = Ease considerably + Ease somewhat, “Tighten” = Tighten somewhat + Tighten considerably
* Denotes a statistically significant change compared with Q3 2020 (previous quarter)^ Denotes a statistically significant change compared with Q4 2019 (same quarter of last year)
Mid-sized InstitutionsLarger Institutions Smaller Institutions
Past 3 Months
Next 3 Months
19% 13%
2%8%
17% 10%
-10%
-11%*
2%3%
12%
19%*
Q4
2017
. . . Q4
2018
. . . Q4
2019
. . . Q4
2020
21%8% 6%
12%19% 4% 3%
-8%2% 4% 3%
20%
Q42017
. . . Q42018
. . . Q42019
. . . Q42020
10% 5% 8%
5%
10% 4% 6%
-21%^0% 1% 2%
26%^
Q42017
. . . Q42018
. . . Q42019
. . . Q42020
13% 9%
3%
9%*
12%
4%-6%
8%^1%
5%
9%
1%
Q4
2017
. . . Q4
2018
. . . Q4
2019
. . . Q4
2020
10% 12% 3% 11%
10% 6%
0%
6%
0% 6%3%
5%
Q4
2017. . . Q4
2018. . . Q4
2019. . . Q4
2020
4% 6%
0%
8%
4% 4%
-4% 1%0% 2%
4%
7%
Q42017
. . . Q42018
. . . Q42019
. . . Q42020
L/M/S - Denote a % is significantly higher than the annual loan origination volume group that the letter represents at the 95% confidence level Net Ease + = % of lenders saying up minus % of lenders saying downThe % saying “stay the same” is not shown
Q4 2020 Mortgage Lender Sentiment Survey®
Ease
Net Ease +
Tighten

© 2020 Fannie Mae. Trademarks of Fannie Mae.56
Credit Standards: Government (by institution type)
Q: Over the past three months, how did your firm’s credit standards for approving consumer applications for mortgage loans change (across both purchase mortgages and refinance mortgages)? “Ease” = Eased considerably + Eased somewhat, “Tighten” = Tightened somewhat + Tightened considerablyQ: Over the next three months, how do you expect your firm’s credit standards for approving applications from individuals for mortgage loans to change (across purchase mortgages and refinance mortgages)? “Ease” = Ease considerably + Ease somewhat, “Tighten” = Tighten somewhat + Tighten considerably
* Denotes a statistically significant change compared with Q3 2020 (previous quarter)^ Denotes a statistically significant change compared with Q4 2019 (same quarter of last year)
Depository InstitutionsMortgage Banks Credit Unions
Past 3 Months
Next 3 Months
24%11%
5% 11%21%7%
-2% -17%^3%
4%
7%
28%*^
Q4
2017
. . . Q4
2018
. . . Q4
2019
. . . Q4
2020
16%5%
2%5%
16%5%
-5%-14%*
0%0%
7%19%*
Q42017
. . . Q42018
. . . Q42019
. . . Q42020
0%
2%12%
5%
-3% 0%
12%
-4%
3%
2%0%
9%
Q42017
. . . Q42018
. . . Q42019
. . . Q42020
12% 13%
3%
11%
12% 10%
-2%
6%0% 3%
5%
5%
Q4
2017
. . . Q4
2018
. . . Q4
2019
. . . Q4
2020
9% 5%
1%
9%
7%
1% -5%
9%^C
2%4%
6%
0%*
Q4
2017. . . Q4
2018. . . Q4
2019. . . Q4
2020
8%
4%
0%
0%8%
-5%
0%
-5%0%
9%
0%
5%
Q42017
. . . Q42018
. . . Q42019
. . . Q42020
M/D/C - Denote a % is significantly higher than the institution type group that the letter represents at the 95% confidence level Net Ease + = % of lenders saying up minus % of lenders saying downThe % saying “stay the same” is not shown
Q4 2020 Mortgage Lender Sentiment Survey®
Ease
Net Ease +
Tighten
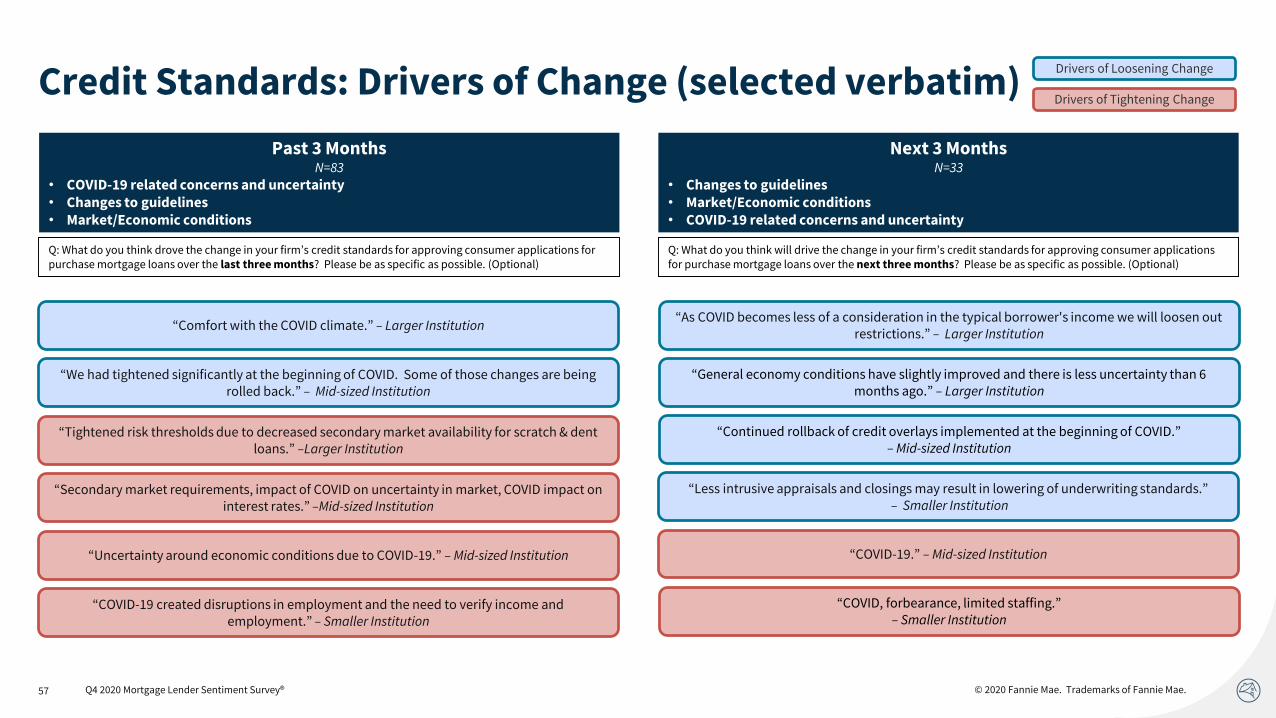
© 2020 Fannie Mae. Trademarks of Fannie Mae.57
Credit Standards: Drivers of Change (selected verbatim)
Q: What do you think drove the change in your firm’s credit standards for approving consumer applications for purchase mortgage loans over the last three months? Please be as specific as possible. (Optional)
“Uncertainty around economic conditions due to COVID-19.” – Mid-sized Institution
Past 3 MonthsN=83
• COVID-19 related concerns and uncertainty• Changes to guidelines• Market/Economic conditions
Q: What do you think will drive the change in your firm’s credit standards for approving consumer applications for purchase mortgage loans over the next three months? Please be as specific as possible. (Optional)
“We had tightened significantly at the beginning of COVID. Some of those changes are being rolled back.” – Mid-sized Institution
Next 3 MonthsN=33
• Changes to guidelines• Market/Economic conditions• COVID-19 related concerns and uncertainty
“Comfort with the COVID climate.” – Larger Institution
Drivers of Loosening Change
Drivers of Tightening Change
“Secondary market requirements, impact of COVID on uncertainty in market, COVID impact on interest rates.” –Mid-sized Institution
“COVID-19 created disruptions in employment and the need to verify income and employment.” – Smaller Institution
“Tightened risk thresholds due to decreased secondary market availability for scratch & dent loans.” –Larger Institution
Q4 2020 Mortgage Lender Sentiment Survey®
“COVID-19.” – Mid-sized Institution
“As COVID becomes less of a consideration in the typical borrower's income we will loosen out restrictions.” – Larger Institution
“General economy conditions have slightly improved and there is less uncertainty than 6 months ago.” – Larger Institution
“Continued rollback of credit overlays implemented at the beginning of COVID.” – Mid-sized Institution
“COVID, forbearance, limited staffing.”– Smaller Institution
“Less intrusive appraisals and closings may result in lowering of underwriting standards.”– Smaller Institution
© 2020 Fannie Mae. Trademarks of Fannie Mae.
Appendix
Survey Methodology Details……………………………………………………………….………… 19
Economic and Housing Sentiment…………………………………………………….……………. 27
Consumer Demand (Purchase Mortgages)……………………………………………………….... 30
Consumer Demand (Refinance Mortgages)…………………………………………………..……. 43
Credit Standards………………………………………………………………………………………. 50
Profit Margin Outlook………………………………………………………………………………… 58
Survey Question Text…………………………………………………………………………………. 63
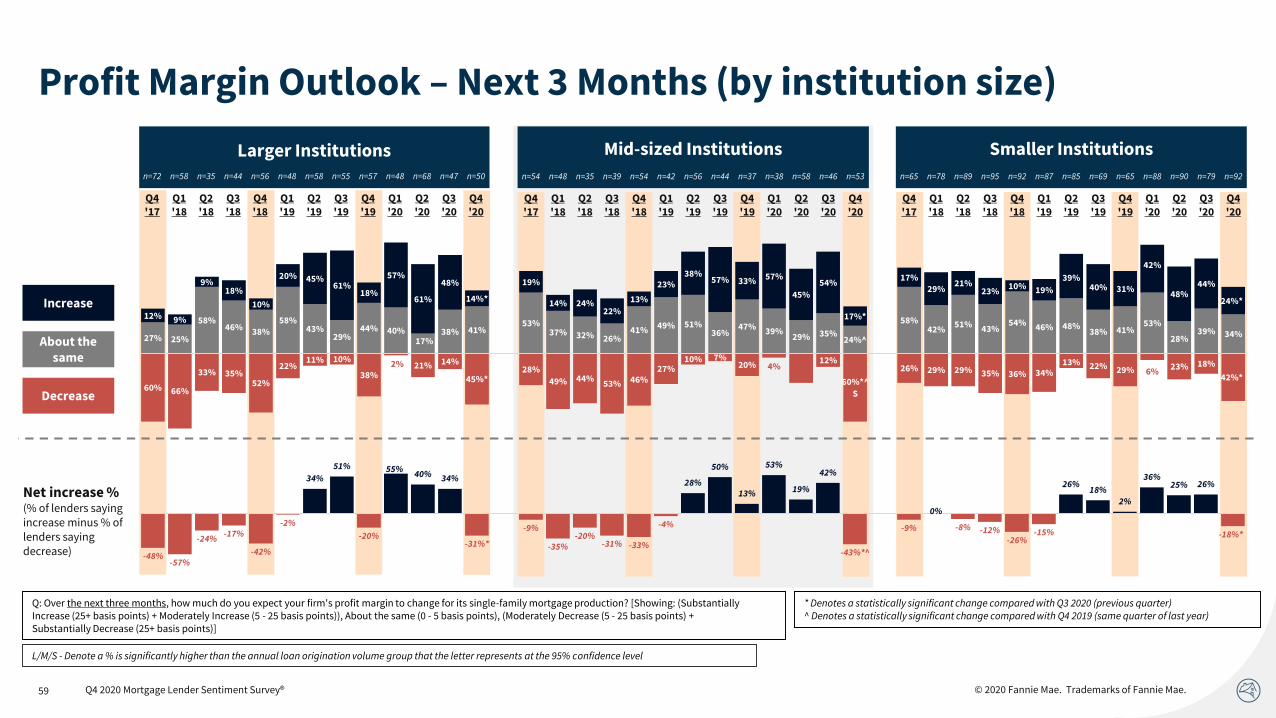
© 2020 Fannie Mae. Trademarks of Fannie Mae.59
Profit Margin Outlook – Next 3 Months (by institution size)
Q: Over the next three months, how much do you expect your firm's profit margin to change for its single-family mortgage production? [Showing: (SubstantiallyIncrease (25+ basis points) + Moderately Increase (5 - 25 basis points)), About the same (0 - 5 basis points), (Moderately Decrease (5 - 25 basis points) + Substantially Decrease (25+ basis points)]
* Denotes a statistically significant change compared with Q3 2020 (previous quarter)^ Denotes a statistically significant change compared with Q4 2019 (same quarter of last year)
Larger Institutions
Increase
About the same
Decrease
Mid-sized Institutions Smaller Institutions
Net increase %(% of lenders saying increase minus % of lenders saying decrease)
L/M/S - Denote a % is significantly higher than the annual loan origination volume group that the letter represents at the 95% confidence level
n=72 n=58 n=35 n=44 n=56 n=48 n=58 n=55 n=57 n=48 n=68 n=47 n=50
Q4'17
Q1'18
Q2'18
Q3'18
Q4'18
Q1'19
Q2'19
Q3'19
Q4'19
Q1'20
Q2'20
Q3'20
Q4'20
27% 25%
58%46% 38%
58%43%
29%44% 40%
17%38% 41%
53%37% 32% 26%
41% 49% 51%36%
47% 39%29% 35%
24%^
58%42%
51% 43%54% 46% 48%
38% 41%53%
28%39% 34%
12% 9%
9%18%
10%
20% 45%61%
18%
57%
61%
48%
14%*
19%
14% 24%22%
13%
23%38%
57% 33% 57%
45%
54%
17%*
17%29%
21%23%
10% 19%
39%40% 31%
42%
48%44%
24%*
60% 66%
33% 35%52%
22%11% 10%
38%2% 21% 14%
45%*28%
49% 44%53% 46%
27%10% 7%
20% 4% 26%12%
60%*^
S
26% 29% 29% 35% 36% 34%13% 22% 29% 6%
23% 18%
42%*
n=54 n=48 n=35 n=39 n=54 n=42 n=56 n=44 n=37 n=38 n=58 n=46 n=53
Q4'17
Q1'18
Q2'18
Q3'18
Q4'18
Q1'19
Q2'19
Q3'19
Q4'19
Q1'20
Q2'20
Q3'20
Q4'20
n=65 n=78 n=89 n=95 n=92 n=87 n=85 n=69 n=65 n=88 n=90 n=79 n=92
Q4'17
Q1'18
Q2'18
Q3'18
Q4'18
Q1'19
Q2'19
Q3'19
Q4'19
Q1'20
Q2'20
Q3'20
Q4'20
-48%-57%
-24%-17%
-42%
-2%
34%
51%
-20%
55%40% 34%
-31%*
-9%
-35%-20%
-31% -33%
-4%
28%
50%
13%
53%
19%
42%
-43%*^
-9%
0%
-8% -12%-26%
-15%
26%18%
2%
36%25% 26%
-18%*
Q4 2020 Mortgage Lender Sentiment Survey®
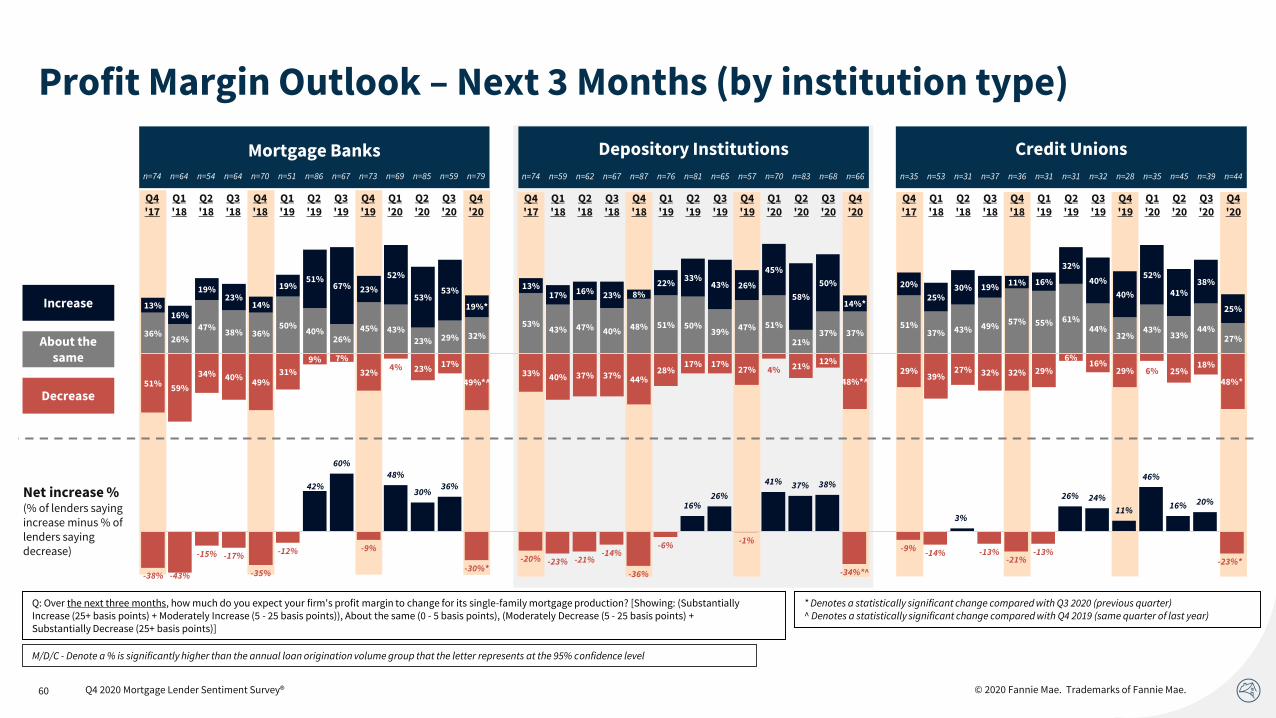
© 2020 Fannie Mae. Trademarks of Fannie Mae.60
Profit Margin Outlook – Next 3 Months (by institution type)
Q: Over the next three months, how much do you expect your firm's profit margin to change for its single-family mortgage production? [Showing: (SubstantiallyIncrease (25+ basis points) + Moderately Increase (5 - 25 basis points)), About the same (0 - 5 basis points), (Moderately Decrease (5 - 25 basis points) + Substantially Decrease (25+ basis points)]
Mortgage Banks
Increase
About the same
Decrease
Depository Institutions Credit Unions
Net increase %(% of lenders saying increase minus % of lenders saying decrease)
M/D/C - Denote a % is significantly higher than the annual loan origination volume group that the letter represents at the 95% confidence level
n=74 n=64 n=54 n=64 n=70 n=51 n=86 n=67 n=73 n=69 n=85 n=59 n=79
Q4'17
Q1'18
Q2'18
Q3'18
Q4'18
Q1'19
Q2'19
Q3'19
Q4'19
Q1'20
Q2'20
Q3'20
Q4'20
n=74 n=59 n=62 n=67 n=87 n=76 n=81 n=65 n=57 n=70 n=83 n=68 n=66
Q4'17
Q1'18
Q2'18
Q3'18
Q4'18
Q1'19
Q2'19
Q3'19
Q4'19
Q1'20
Q2'20
Q3'20
Q4'20
n=35 n=53 n=31 n=37 n=36 n=31 n=31 n=32 n=28 n=35 n=45 n=39 n=44
Q4'17
Q1'18
Q2'18
Q3'18
Q4'18
Q1'19
Q2'19
Q3'19
Q4'19
Q1'20
Q2'20
Q3'20
Q4'20
36%26%
47%38% 36%
50%40%
26%45% 43%
23% 29% 32%
53%43% 47% 40% 48% 51% 50%
39% 47% 51%
21%37% 37%
51%37% 43% 49% 57% 55% 61%
44%32%
43%33%
44%27%
13%16%
19%23%
14%
19%51%
67% 23%
52%
53%53%
19%*
13%17% 16% 23% 8%
22%33%
43% 26%
45%
58%
50%
14%*
20%
25%30% 19% 11% 16%
32%
40%
40%
52%
41%38%
25%
51% 59%
34% 40%49%
31%
9% 7%
32%4% 23%
17%
49%*^33% 40% 37% 37% 44%
28%17% 17%
27% 4% 21%12%
48%*^29%
39%27% 32% 32% 29%
6%16%
29% 6% 25%18%
48%*
-38% -43%
-15% -17%
-35%
-12%
42%
60%
-9%
48%
30%36%
-30%*-20% -23% -21%
-14%
-36%
-6%
16%26%
-1%
41% 37% 38%
-34%*^
-9%-14%
3%
-13%-21%
-13%
26% 24%
11%
46%
16% 20%
-23%*
* Denotes a statistically significant change compared with Q3 2020 (previous quarter)^ Denotes a statistically significant change compared with Q4 2019 (same quarter of last year)
Q4 2020 Mortgage Lender Sentiment Survey®
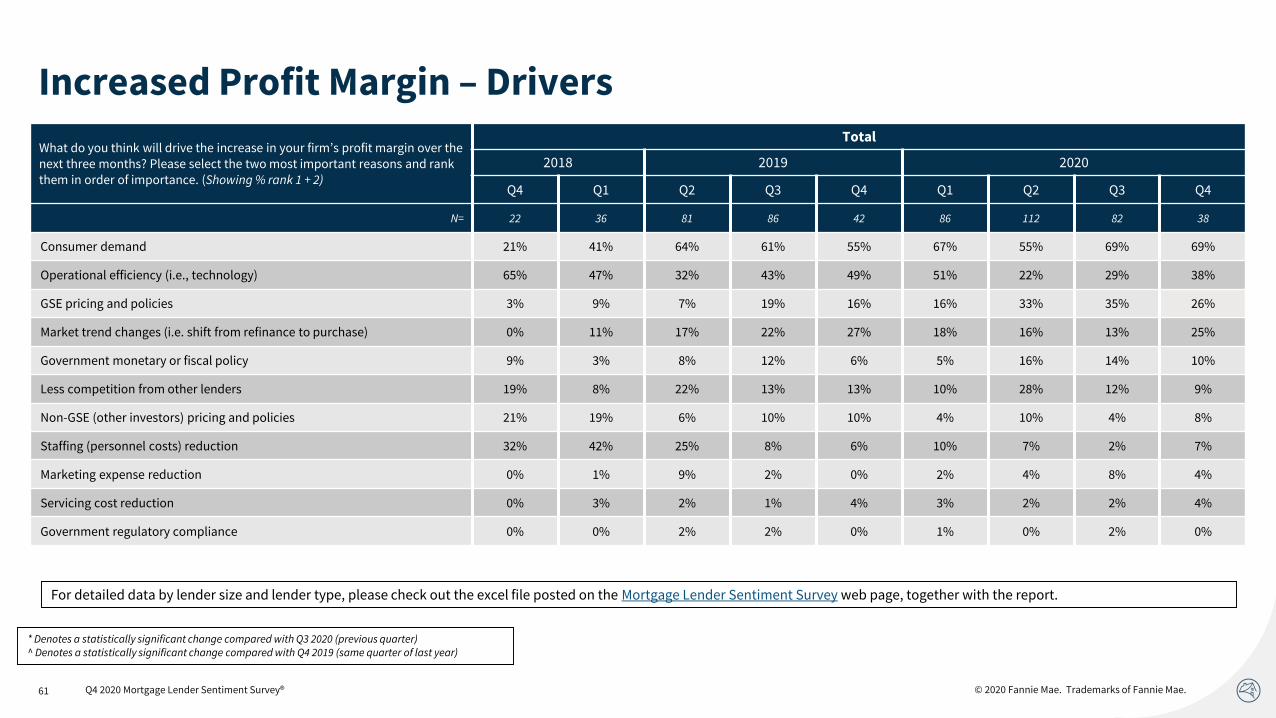
© 2020 Fannie Mae. Trademarks of Fannie Mae.61
Increased Profit Margin – Drivers
* Denotes a statistically significant change compared with Q3 2020 (previous quarter)^ Denotes a statistically significant change compared with Q4 2019 (same quarter of last year)
For detailed data by lender size and lender type, please check out the excel file posted on the Mortgage Lender Sentiment Survey web page, together with the report.
Q4 2020 Mortgage Lender Sentiment Survey®
What do you think will drive the increase in your firm’s profit margin over the next three months? Please select the two most important reasons and rank them in order of importance. (Showing % rank 1 + 2)
Total
2018 2019 2020
Q4 Q1 Q2 Q3 Q4 Q1 Q2 Q3 Q4
N= 22 36 81 86 42 86 112 82 38
Consumer demand 21% 41% 64% 61% 55% 67% 55% 69% 69%
Operational efficiency (i.e., technology) 65% 47% 32% 43% 49% 51% 22% 29% 38%
GSE pricing and policies 3% 9% 7% 19% 16% 16% 33% 35% 26%
Market trend changes (i.e. shift from refinance to purchase) 0% 11% 17% 22% 27% 18% 16% 13% 25%
Government monetary or fiscal policy 9% 3% 8% 12% 6% 5% 16% 14% 10%
Less competition from other lenders 19% 8% 22% 13% 13% 10% 28% 12% 9%
Non-GSE (other investors) pricing and policies 21% 19% 6% 10% 10% 4% 10% 4% 8%
Staffing (personnel costs) reduction 32% 42% 25% 8% 6% 10% 7% 2% 7%
Marketing expense reduction 0% 1% 9% 2% 0% 2% 4% 8% 4%
Servicing cost reduction 0% 3% 2% 1% 4% 3% 2% 2% 4%
Government regulatory compliance 0% 0% 2% 2% 0% 1% 0% 2% 0%
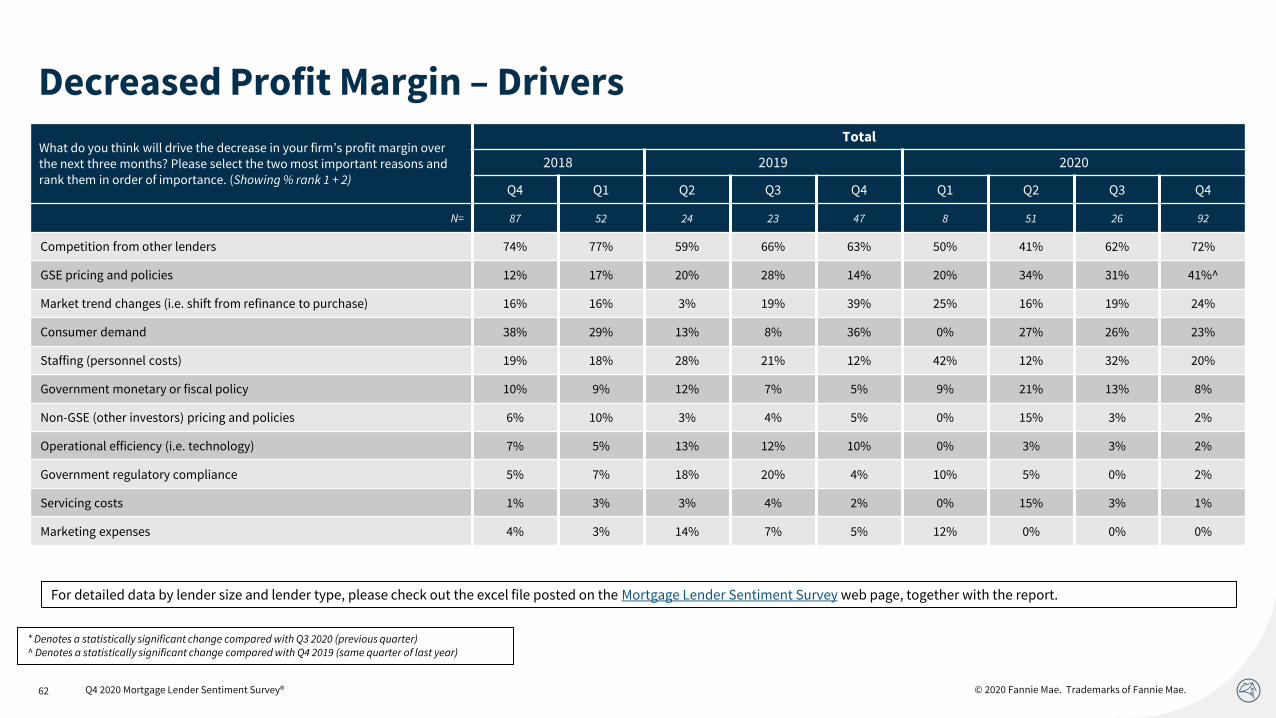
© 2020 Fannie Mae. Trademarks of Fannie Mae.62
Decreased Profit Margin – Drivers
What do you think will drive the decrease in your firm’s profit margin over the next three months? Please select the two most important reasons and rank them in order of importance. (Showing % rank 1 + 2)
Total
2018 2019 2020
Q4 Q1 Q2 Q3 Q4 Q1 Q2 Q3 Q4
N= 87 52 24 23 47 8 51 26 92
Competition from other lenders 74% 77% 59% 66% 63% 50% 41% 62% 72%
GSE pricing and policies 12% 17% 20% 28% 14% 20% 34% 31% 41%^
Market trend changes (i.e. shift from refinance to purchase) 16% 16% 3% 19% 39% 25% 16% 19% 24%
Consumer demand 38% 29% 13% 8% 36% 0% 27% 26% 23%
Staffing (personnel costs) 19% 18% 28% 21% 12% 42% 12% 32% 20%
Government monetary or fiscal policy 10% 9% 12% 7% 5% 9% 21% 13% 8%
Non-GSE (other investors) pricing and policies 6% 10% 3% 4% 5% 0% 15% 3% 2%
Operational efficiency (i.e. technology) 7% 5% 13% 12% 10% 0% 3% 3% 2%
Government regulatory compliance 5% 7% 18% 20% 4% 10% 5% 0% 2%
Servicing costs 1% 3% 3% 4% 2% 0% 15% 3% 1%
Marketing expenses 4% 3% 14% 7% 5% 12% 0% 0% 0%
* Denotes a statistically significant change compared with Q3 2020 (previous quarter)^ Denotes a statistically significant change compared with Q4 2019 (same quarter of last year)
For detailed data by lender size and lender type, please check out the excel file posted on the Mortgage Lender Sentiment Survey web page, together with the report.
Q4 2020 Mortgage Lender Sentiment Survey®
© 2020 Fannie Mae. Trademarks of Fannie Mae.
Appendix
Survey Methodology Details……………………………………………………………….………… 19
Economic and Housing Sentiment…………………………………………………….……………. 27
Consumer Demand (Purchase Mortgages)……………………………………………………….... 30
Consumer Demand (Refinance Mortgages)…………………………………………………..……. 43
Credit Standards………………………………………………………………………………………. 50
Profit Margin Outlook………………………………………………………………………………… 58
Survey Question Text…………………………………………………………………………………. 63
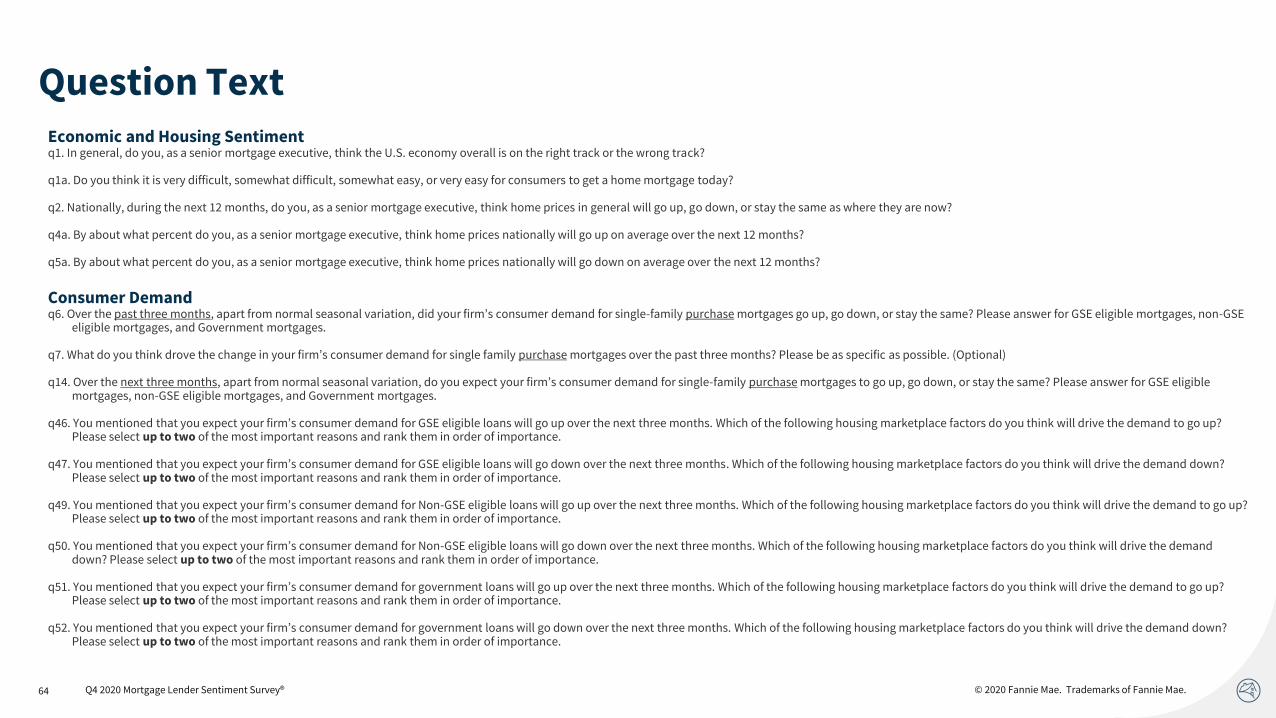
© 2020 Fannie Mae. Trademarks of Fannie Mae.64
Question TextEconomic and Housing Sentimentq1. In general, do you, as a senior mortgage executive, think the U.S. economy overall is on the right track or the wrong track?
q1a. Do you think it is very difficult, somewhat difficult, somewhat easy, or very easy for consumers to get a home mortgage today?
q2. Nationally, during the next 12 months, do you, as a senior mortgage executive, think home prices in general will go up, go down, or stay the same as where they are now?
q4a. By about what percent do you, as a senior mortgage executive, think home prices nationally will go up on average over the next 12 months?
q5a. By about what percent do you, as a senior mortgage executive, think home prices nationally will go down on average over the next 12 months?
Consumer Demandq6. Over the past three months, apart from normal seasonal variation, did your firm’s consumer demand for single-family purchase mortgages go up, go down, or stay the same? Please answer for GSE eligible mortgages, non-GSE
eligible mortgages, and Government mortgages.
q7. What do you think drove the change in your firm’s consumer demand for single family purchase mortgages over the past three months? Please be as specific as possible. (Optional)
q14. Over the next three months, apart from normal seasonal variation, do you expect your firm’s consumer demand for single-family purchase mortgages to go up, go down, or stay the same? Please answer for GSE eligible mortgages, non-GSE eligible mortgages, and Government mortgages.
q46. You mentioned that you expect your firm’s consumer demand for GSE eligible loans will go up over the next three months. Which of the following housing marketplace factors do you think will drive the demand to go up? Please select up to two of the most important reasons and rank them in order of importance.
q47. You mentioned that you expect your firm’s consumer demand for GSE eligible loans will go down over the next three months. Which of the following housing marketplace factors do you think will drive the demand down? Please select up to two of the most important reasons and rank them in order of importance.
q49. You mentioned that you expect your firm’s consumer demand for Non-GSE eligible loans will go up over the next three months. Which of the following housing marketplace factors do you think will drive the demand to go up? Please select up to two of the most important reasons and rank them in order of importance.
q50. You mentioned that you expect your firm’s consumer demand for Non-GSE eligible loans will go down over the next three months. Which of the following housing marketplace factors do you think will drive the demand down? Please select up to two of the most important reasons and rank them in order of importance.
q51. You mentioned that you expect your firm’s consumer demand for government loans will go up over the next three months. Which of the following housing marketplace factors do you think will drive the demand to go up? Please select up to two of the most important reasons and rank them in order of importance.
q52. You mentioned that you expect your firm’s consumer demand for government loans will go down over the next three months. Which of the following housing marketplace factors do you think will drive the demand down? Please select up to two of the most important reasons and rank them in order of importance.
Q4 2020 Mortgage Lender Sentiment Survey®
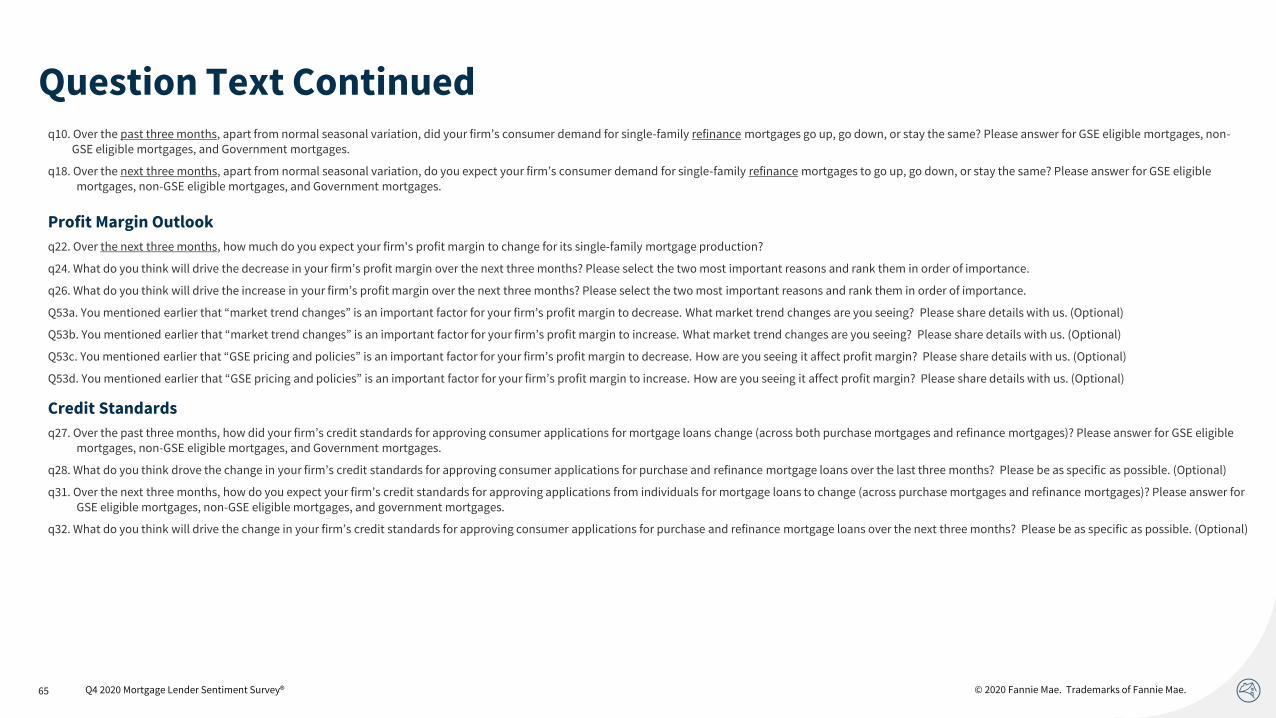
© 2020 Fannie Mae. Trademarks of Fannie Mae.65
Question Text Continuedq10. Over the past three months, apart from normal seasonal variation, did your firm’s consumer demand for single-family refinance mortgages go up, go down, or stay the same? Please answer for GSE eligible mortgages, non-
GSE eligible mortgages, and Government mortgages.
q18. Over the next three months, apart from normal seasonal variation, do you expect your firm’s consumer demand for single-family refinance mortgages to go up, go down, or stay the same? Please answer for GSE eligible mortgages, non-GSE eligible mortgages, and Government mortgages.
Profit Margin Outlook
q22. Over the next three months, how much do you expect your firm's profit margin to change for its single-family mortgage production?
q24. What do you think will drive the decrease in your firm’s profit margin over the next three months? Please select the two most important reasons and rank them in order of importance.
q26. What do you think will drive the increase in your firm’s profit margin over the next three months? Please select the two most important reasons and rank them in order of importance.
Q53a. You mentioned earlier that “market trend changes” is an important factor for your firm’s profit margin to decrease. What market trend changes are you seeing? Please share details with us. (Optional)
Q53b. You mentioned earlier that “market trend changes” is an important factor for your firm’s profit margin to increase. What market trend changes are you seeing? Please share details with us. (Optional)
Q53c. You mentioned earlier that “GSE pricing and policies” is an important factor for your firm’s profit margin to decrease. How are you seeing it affect profit margin? Please share details with us. (Optional)
Q53d. You mentioned earlier that “GSE pricing and policies” is an important factor for your firm’s profit margin to increase. How are you seeing it affect profit margin? Please share details with us. (Optional)
Credit Standards
q27. Over the past three months, how did your firm’s credit standards for approving consumer applications for mortgage loans change (across both purchase mortgages and refinance mortgages)? Please answer for GSE eligible mortgages, non-GSE eligible mortgages, and Government mortgages.
q28. What do you think drove the change in your firm’s credit standards for approving consumer applications for purchase and refinance mortgage loans over the last three months? Please be as specific as possible. (Optional)
q31. Over the next three months, how do you expect your firm’s credit standards for approving applications from individuals for mortgage loans to change (across purchase mortgages and refinance mortgages)? Please answer for GSE eligible mortgages, non-GSE eligible mortgages, and government mortgages.
q32. What do you think will drive the change in your firm’s credit standards for approving consumer applications for purchase and refinance mortgage loans over the next three months? Please be as specific as possible. (Optional)
Q4 2020 Mortgage Lender Sentiment Survey®