Funding mechanisms for the prevention and … mechanisms for the prevention and treatment of ......
46
Funding mechanisms for the prevenon and treatment of alcohol and substance use disorders Discussion paper developed for the WHO Forum on Alcohol, Drugs and Addicve Behaviours, 26-28 June 2017 Wrien by Eva Jané Llopis, Director, Health, SDGs and Social Innovaon. ESADE Business School, Ramon Llull University, Spain WHO Forum on alcohol, drugs and addictive behaviours Enhancing public health actions through partnerships and collaboration 26-28 June 2017, WHO headquarters Geneva, Switzerland
Transcript of Funding mechanisms for the prevention and … mechanisms for the prevention and treatment of ......

Funding mechanisms for the prevention and treatment of alcohol
and substance use disorders
Discussion paper
developed for the WHO Forum on Alcohol, Drugs and Addictive Behaviours,
26-28 June 2017
Written by Eva Jané Llopis, Director, Health, SDGs and Social Innovation. ESADE Business School, Ramon Llull University, Spain
WHO Forum on alcohol, drugs and addictive behaviours
Enhancing public health actions through partnerships and collaboration
26-28 June 2017, WHO headquarters Geneva, Switzerland

Funding mechanisms for the prevention and treatment of alcohol and substance use disorders
Discussion Paper1
developed for the WHO Forum on alcohol, drugs and addictive behaviours, 26-28 June 2017
Written by Eva Jané Llopis, Director, Health, SDGs and Social
Innovation. ESADE Business School, Ramon Llull University, Spain
This discussion paper contains the views of the named author and does not necessarily represent the decisions or the policies of the World Health
Organization
June 2017
1 Commissioned by WHO Management of Substance Abuse at the Department of Mental Health and Substance Abuse

2 | P a g e

TABLE OF CONTENTS I. SUBSTANCE USE DISORDERS: BURDEN, TREATMENT GAP AND ADDRESSING SUSTAINABLE
DEVELOPMENT GOALS OF THE 2030 AGENDA I.1. Global burden of Substance Use Disorders (SUD) I.2. Achieving the 2030 target 3.5 and improving treatment coverage I.3. Addressing SDG target 3.5: Strengthen Prevention and Treatment of Substance Abuse
II. INNOVATIVE FUNDING MECHANISMS FOR THE PREVENTION AND TREATMENT OF
SUBSTANCE USE DISORDERS II.1. Funding mechanisms directly related to alcoholic beverages II.2. Funding mechanisms related to other psychoactive substances and addictive
behaviours II.3. Funding mechanisms used to finance health that could be applied to financing
prevention and treatment of alcohol and drug use disorders II.4. Funding mechanisms not related to health issues at hand but that have been used to
raise resources for health III. PROS AND CONS OF DIFFERENT APPROACHES TO REVENUE GENERATION FOR THE
PREVENTION AND TREATMENT OF SUBSTANCE USE DISORDERS III.1. General benefits and arguments for revenue generation measures for the prevention and treatment of alcohol and drug use disorders III.2. General cons and potential problem areas in revenue generation measures for the prevention and treatment of alcohol and drug use disorders
IV. ROADMAP TO EXPLORE THE DEVELOPMENT OF NEW FUNDING MECHANISMS FOR THE
PREVENTION AND TREATMENT OF SUBSTANCE USE DISORDERS IV.1. General technical ‘watch-outs’ when applying new measures for revenue generation for the prevention and treatment of alcohol and drug use disorders IV.2. Specific ‘watch-outs’ when administering fiscal measures to alcoholic beverages
V. FROM AVAILABLE OPTIONS TO FINAL CONCLUSIONS VI. REFERENCE LIST


I. SUBSTANCE USE DISORDERS: BURDEN, TREATMENT GAP AND ADDRESSING SUSTAINABLE DEVELOPMENT GOALS OF THE 2030 AGENDA
I.1. GLOBAL BURDEN OF SUBSTANCE USE DISORDERS (SUD) The global burden of substance use and substance use disorders has been summarized in the World Health Statistics 2016 report on monitoring health for the Sustainable Development Goals (SDGs) (World Health Organization 2016a), and in the World Drug Report 2016 (UNODC 2016). Psychoactive substances are intoxicants that affect a wide range of structures and processes in the central nervous system. By interacting with personality characteristics, associated behaviours, and sociocultural expectations, they are a major cause of harm to the health, well-being and economies of individuals, families and societies. They are neurotoxic to brain development, and are dependence-producing, through their reinforcing properties and neuro-adaptation in the brain. Alcohol and alcohol use disorder Globally, it is estimated that there were 95 million cases of alcohol use disorder (AUD) in 2010 (Whiteford et al. 2015). In 2012, 3.3 million deaths (5.9% of all deaths worldwide) were attributable to the use of alcohol (World Health Organization 2016). Worldwide in 2016, alcohol consumption was projected to be 6.4 litres of pure alcohol per person aged 15 years or older. In 2010, 38% of the world population aged 15 years or older had drunk alcohol in the past 12 months, with 16% of drinkers engaged in heavy episodic drinking (defined as drinking at least 60 grams or more of pure alcohol on at least one occasion in the past 30 days). There is considerable global variation in the use of alcohol. Consumption is increasing in the WHO Western Pacific Region and in the WHO South-East Asia Region, while remaining stable or slightly decreasing in other WHO regions. Alcohol is a cause of a wide range of diseases and injuries, exacerbated by occasions of heavy drinking (Rehm et al. 2017), resulting in it ranking as the ninth leading global risk-factor for morbidity and premature death (GBD 2015 Risk Factors Collaborators 2016). There are more than 40 ICD-10 three-digit disease categories that are fully attributable to alcohol, including neuro-psychiatric disorders, intoxication and dependence, gastrointestinal diseases, poisoning, and foetal alcohol syndrome, as part of foetal alcohol spectrum disorders. Most partially attributable disease categories showed monotonic relationships with volume of alcohol use: the more alcohol consumed, the higher the risk of disease or death. Exceptions are ischaemic heart disease and diabetes, with curvilinear relationships. The distribution of alcohol-attributable deaths by disease or injury cause is shown in Figure 1. Tackling the multiple individual and societal level harms caused by alcohol is a global economic and public health priority, and essential for achieving global targets of reducing deaths from non-communicable diseases by 25% between 2010 and 2025 (Kontis et al. 2014), more so as risk of exposure to the harmful use of alcohol increases with increasing socio-economic status in low and middle-income countries (GBD 2015 Risk Factors Collaborators 2016). The adverse impacts from alcohol are aggravated by lower socio-economic status (Allen et al. 2017). The harms done by people’s drinking to others involve both socioeconomic consequences and substantial health problems, such as alcohol-related injuries, mental health impacts and foetal alcohol spectrum disorders (WHO, 2014). As reported in the global status report on alcohol, a survey specific to harms to others in New Zealand found the prevalence of such harms to be higher than the prevalence of harms from one’s own drinking (18% versus 12%), particularly among women and young people (Connor & Casswell, 2012). The same research group found that the greater the exposure to heavy
1 | P a g e

drinkers, the lower people’s scores on measures of personal well-being and health status (in WHO 2014).
Figure 1 Distribution of alcohol-attributable deaths by disease or injury cause, 2012. Source: World Health Organization, 2014
Impacts also extend beyond the individual drinker, with considerable costs borne by families, communities, health systems, and the wider economy (Rehm et al. 2009). Alcohol-attributable cost per head in studied high-income countries ranged from I$358 in Scotland to I$837 in the USA (Rehm et al. 2009). In Thailand, the cost per head was I$122. In terms of a weighted average for high-income countries, the greatest contributor to total alcohol-attributable costs was the cost of productivity loss, which accounted for 72% of the overall cost, followed by direct health-care costs (13%), other direct costs (12%), and direct law-enforcement costs (3%) (Rehm et al. 2009). The hierarchy of costs was similar for middle-income countries except that the weighted average for other direct costs was the second largest share (16%), followed by health-care costs (6%). In high income countries, about three fifths of all social costs attributable to alcohol are due to AUD (Mohapatra et al. 2010). A large proportion of the costs due to alcohol and AUD are avertable (Anderson et al. 2009). Box 1. Costs of excessive drinking in USA 2010 (Source: Sacks et al., 2015) Excessive drinking cost the U.S. $249.0 billion in 2010, or about $2.05 per drink. Government paid for $100.7 billion (40.4%) of these costs. Binge drinking accounted for $191.1 billion (76.7%) of costs; underage drinking $24.3 billion (9.7%) of costs; and drinking while pregnant $5.5 billion (2.2%) of costs. The median cost per state was $3.5 billion. Binge drinking was responsible for more than 70% of these costs in all states, and more than 40% of the binge drinking–related costs were paid by government. Drug use disorders Globally, it is estimated that 1 in 20 adults, or a quarter of a billion people between the ages of 15 and 64 years, used at least one illicit drug in 2014 (UNODC 2016). Worldwide, more than 29 million
2 | P a g e

people who use drugs are estimated to suffer from drug use disorders. Of these, it is estimated that 12 million are people who inject drugs, of whom 14% are living with HIV. According to WHO’s latest estimates for 2015, psychoactive drug use is responsible for more than 450,000 deaths per year. The drug-attributable disease burden accounts for about 1.5% of the global burden of disease. Overdose deaths contribute to a large proportion of all drug-related deaths, which are attributable in most cases to opioids. The time period shortly after release from prison is associated with a substantially increased risk of death from drug-related causes (primarily as a result of drug overdoses), with a mortality rate much higher than from all causes among the general population. In addition, substantial numbers of deaths are caused by the more indirect effects of intoxication that result in accidental injuries and violence, cardiovascular disease, liver disease, and a range of mental disorders (Charlson 2015). Suicide is an important outcome, particularly for opioid users. The injection of drugs carries a high risk of blood-borne bacterial and viral infections, notably, human immunodeficiency virus and acquired immune deficiency syndrome (HIV/AIDS), hepatitis B, and hepatitis C. Injecting drug use accounts for an estimated 30% of new HIV infections outside sub-Saharan Africa and contributes significantly to the epidemics of hepatitis B and hepatitis C in all regions of the world. Sustainable development goals (SDGs) The 17 Sustainable Development Goals (SDGs) of the 2030 Agenda integrate all three dimensions of sustainable development (economic, social and environmental) recognizing that eradicating poverty and inequality, creating inclusive economic growth and preserving the planet are inextricably linked. Health is centrally positioned within the 2030 Agenda, with one comprehensive goal (SDG 3) and its 13 targets covering all major health priorities, with links to targets in other goals. With respect to substance use and substance use disorders, Target 3.5 is to “strengthen the prevention and treatment of substance abuse, including narcotic drug abuse and harmful use of alcohol”. Two indicators are chosen:
Indicator 3.5.1: Coverage of treatment interventions (pharmacological, psychosocial and rehabilitation and aftercare services) for substance-use disorders; and,
Indicator 3.5.2: Harmful use of alcohol, defined according to the national context as alcohol per capita consumption (aged 15 years and older) within a calendar year in litres of pure alcohol The achievement of Target 3.5 clearly impacts on the achievement of other health-related targets, including:
3 | P a g e
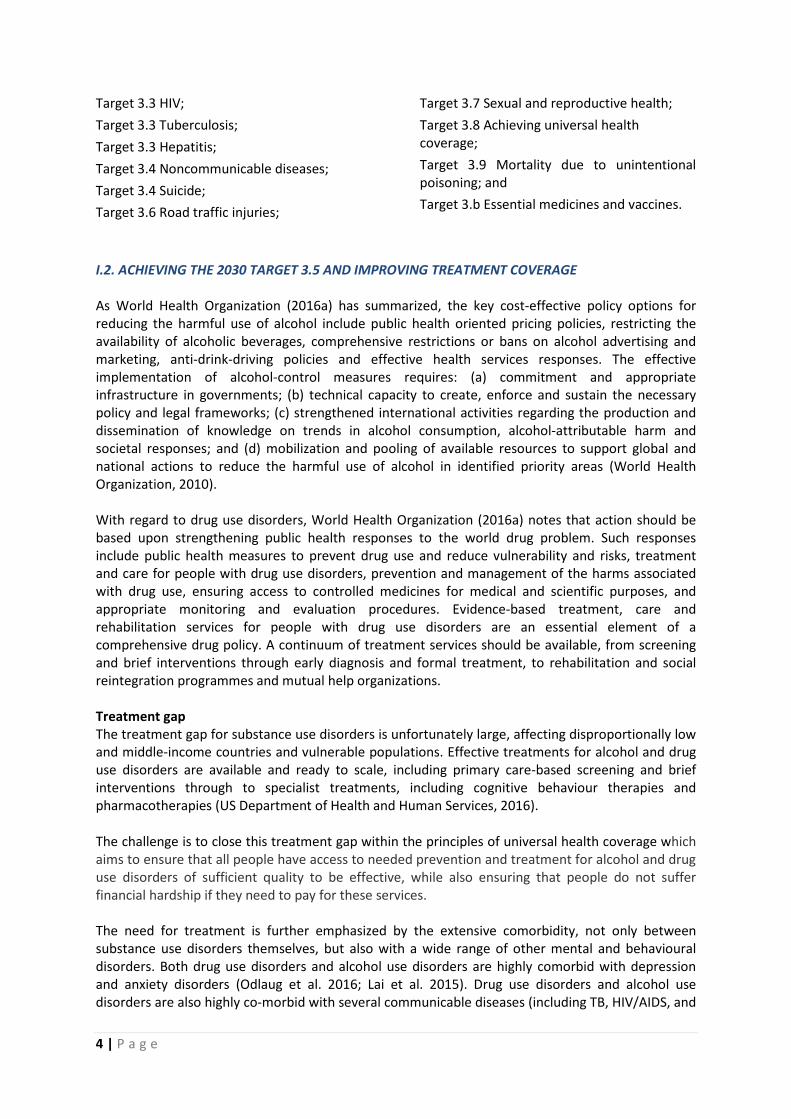
Target 3.3 HIV; Target 3.3 Tuberculosis; Target 3.3 Hepatitis; Target 3.4 Noncommunicable diseases; Target 3.4 Suicide; Target 3.6 Road traffic injuries;
Target 3.7 Sexual and reproductive health; Target 3.8 Achieving universal health coverage; Target 3.9 Mortality due to unintentional poisoning; and Target 3.b Essential medicines and vaccines.
I.2. ACHIEVING THE 2030 TARGET 3.5 AND IMPROVING TREATMENT COVERAGE As World Health Organization (2016a) has summarized, the key cost-effective policy options for reducing the harmful use of alcohol include public health oriented pricing policies, restricting the availability of alcoholic beverages, comprehensive restrictions or bans on alcohol advertising and marketing, anti-drink-driving policies and effective health services responses. The effective implementation of alcohol-control measures requires: (a) commitment and appropriate infrastructure in governments; (b) technical capacity to create, enforce and sustain the necessary policy and legal frameworks; (c) strengthened international activities regarding the production and dissemination of knowledge on trends in alcohol consumption, alcohol-attributable harm and societal responses; and (d) mobilization and pooling of available resources to support global and national actions to reduce the harmful use of alcohol in identified priority areas (World Health Organization, 2010). With regard to drug use disorders, World Health Organization (2016a) notes that action should be based upon strengthening public health responses to the world drug problem. Such responses include public health measures to prevent drug use and reduce vulnerability and risks, treatment and care for people with drug use disorders, prevention and management of the harms associated with drug use, ensuring access to controlled medicines for medical and scientific purposes, and appropriate monitoring and evaluation procedures. Evidence-based treatment, care and rehabilitation services for people with drug use disorders are an essential element of a comprehensive drug policy. A continuum of treatment services should be available, from screening and brief interventions through early diagnosis and formal treatment, to rehabilitation and social reintegration programmes and mutual help organizations. Treatment gap The treatment gap for substance use disorders is unfortunately large, affecting disproportionally low and middle-income countries and vulnerable populations. Effective treatments for alcohol and drug use disorders are available and ready to scale, including primary care-based screening and brief interventions through to specialist treatments, including cognitive behaviour therapies and pharmacotherapies (US Department of Health and Human Services, 2016). The challenge is to close this treatment gap within the principles of universal health coverage which aims to ensure that all people have access to needed prevention and treatment for alcohol and drug use disorders of sufficient quality to be effective, while also ensuring that people do not suffer financial hardship if they need to pay for these services. The need for treatment is further emphasized by the extensive comorbidity, not only between substance use disorders themselves, but also with a wide range of other mental and behavioural disorders. Both drug use disorders and alcohol use disorders are highly comorbid with depression and anxiety disorders (Odlaug et al. 2016; Lai et al. 2015). Drug use disorders and alcohol use disorders are also highly co-morbid with several communicable diseases (including TB, HIV/AIDS, and
4 | P a g e

hepatitis) and many non-communicable diseases (including cancers, cardiovascular diseases and gastrointestinal diseases). Treatment coverage for substance dependence has been recently assessed by World Health Organization national focal points, Figure 2.
Figure 2 Treatment coverage for substance dependence based on assessment by national focal points. Source: World Health Organization 2016.
For alcohol use disorders, despite the fact that is one of the most important modifiable causes of premature morbidity and mortality, worldwide, it has been estimated that as many as four out of five individuals with AUD fail to receive the offer of appropriate advice or treatment (World Health Organization 2008). A review for WHO’s Mental Health Gap Action Programme, Scaling Up Care for Mental, Neurological, and Substance Use Disorders found treatment gaps for AUD in high-income countries that ranged from just under 50% in Israel to as high as 96% in the UK; in low- and middle-income countries, the gap ranged from a little over 50% in Brazil to 94% in Mexico (Kohn et al. 2004). Of course, these gaps are difficult to measure, and sustained periods of not drinking without treatment, for example, are not uncommon in people with alcohol use disorders. Nevertheless, the comorbidity with a wide range of mental and behavioural disorders and other treatable conditions, such as hypertension, alone, argues for the need for brief interventions and treatment, in addition to an ethical obligation to provide brief interventions and treatment. The Organisation for Economic Co-operation and Development (OECD) has estimated that were the proportion of eligible heavy drinking patients receiving primary health care-based screening and advice to increase to 30% of eligible patients, the prevalence of harmful use of alcohol could decrease by as much as 10-15% across OECD member countries studied, with reductions in the annual incidence of AUD of 5-14% (OECD, 2015). In addition, were the proportion of patients with AUD receiving cognitive behavioural and pharmacological treatments doubled, the annual incidence of AUD would reduce by between 1% and 4% across OECD member countries studied. Other studies in the European Union have found that were two-fifths of people with AUD treated with pharmacotherapy, 13.3% of all male and 9.3% of all female alcohol attributable deaths could be averted over the course of one year (Rehm et al. 2013). Resource constraints Large scale implementation of advice and treatment programmes are expensive because of staff and drug costs. Adjusting for purchasing power parity (PPP), the costs of implementing the above OECD
5 | P a g e

modelled brief intervention and treatment programmes for heavy drinking and alcohol use disorders ranged from between 5 and 9 USD PPP per capita for the primary health care-based screening and brief intervention programmes and from between 5 and 12 USD PPP per capita for the treatment of AUD programmes that include a combination of pharmacotherapy and psychosocial interventions (OECD 2015). This is an up-front cost that is needed for the return on investment, which can be substantial in terms of reductions in health care expenditures, which for primary health care-based brief intervention programmes in the OECD model can range from over two-thirds of the intervention costs to one and one-third (i.e., cost saving by a large margin). Such programmes would also free large numbers of working age people per year from alcohol-related diseases. Globally, there is evidence that opioid maintenance therapy (opioid-substitution therapy), needle-syringe programs, and antiretroviral therapy together are effective and cost-effective in reducing drug dependence, reducing sharing of injecting equipment, improving quality of life, and averting HIV infections (Wilson et al. 2015). Costs per HIV infection averted range from $100 to $1000 across different regions of the world. However, the coverage of such treatment and harm reduction programs is currently low or very low across almost all regions of the world. Although the overall costs of scaling up such programs can be high, they have the potential to provide significant returns on investment for governments, with societal benefits exceeding treatment costs. Causes of the treatment gap There are several causes for the treatment gap, including lack of universal access to health care, lack of availability of treatment, lack of political will, stigma, and lack of clinical skills amongst health care providers. Many of these causes are driven by lack of financial resources. The rest of this paper proposes a way to overcome the shortfall of resources by outlining different potential financing mechanisms, with varying levels of evidence. I.3. ADDRESSING SDG Target 3.5 “Strengthen Prevention and Treatment of Substance Abuse” The financing paradox of SDG 3: increased health priorities and scarcity of funding sources There is a growing problem of accountability of governments to deliver on the SDGs as a whole, including the new health targets that are recognized priorities to be addressed. For this reason, innovative financing mechanisms for addressing the SDGs as a whole have been called for. Different options and levels of investment and possible financing sources for addressing SDG 3 health targets have been proposed. The debate oscillates between the need for re-prioritizing to address new health problems like NCDs, to pooling resources to improve health systems and particularly primary health care that allows for the provision of universal health coverage (UHC) especially for low-income most vulnerable populations. Recent modelling studies have advocated a move away from previous vertical approaches to costing, towards more integrated, horizontal approaches to plan effectively for scaled-up investment and system development (Stenberg & Chisholm, 2012), and to increase efficiency in funding and implementation (WHO OneHealth tool). Some earmarking efforts have focused in increasing capacity at country level for health systems, primary health care, or creating programmes of access to care. Despite such discussions, however, health budgets in most countries lack new revenues to deliver on the multiple new health targets added to SDG 3. This leads to the paradoxical situation of fighting for resources, increased verticalization of health programmes (with increased inefficiencies), and a continued status quo of funding previous existing priorities (McIntyre, 2015).
6 | P a g e
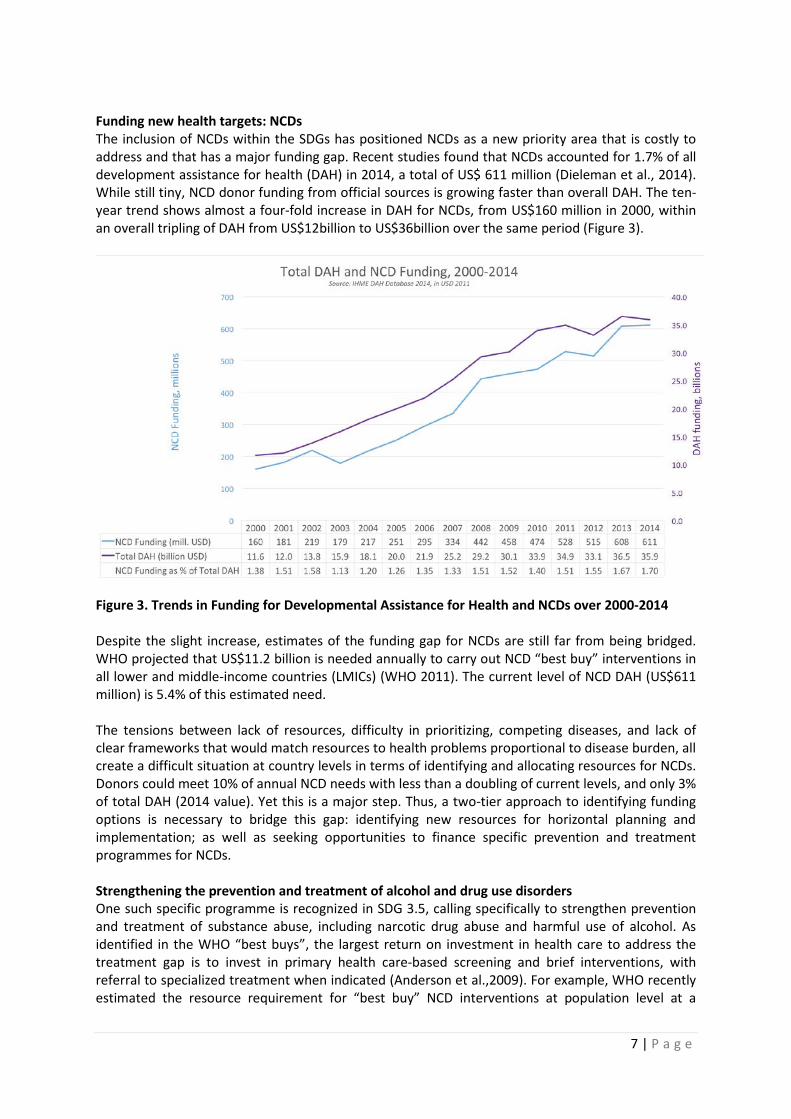
Funding new health targets: NCDs The inclusion of NCDs within the SDGs has positioned NCDs as a new priority area that is costly to address and that has a major funding gap. Recent studies found that NCDs accounted for 1.7% of all development assistance for health (DAH) in 2014, a total of US$ 611 million (Dieleman et al., 2014). While still tiny, NCD donor funding from official sources is growing faster than overall DAH. The ten-year trend shows almost a four-fold increase in DAH for NCDs, from US$160 million in 2000, within an overall tripling of DAH from US$12billion to US$36billion over the same period (Figure 3).
Figure 3. Trends in Funding for Developmental Assistance for Health and NCDs over 2000-2014 Despite the slight increase, estimates of the funding gap for NCDs are still far from being bridged. WHO projected that US$11.2 billion is needed annually to carry out NCD “best buy” interventions in all lower and middle-income countries (LMICs) (WHO 2011). The current level of NCD DAH (US$611 million) is 5.4% of this estimated need. The tensions between lack of resources, difficulty in prioritizing, competing diseases, and lack of clear frameworks that would match resources to health problems proportional to disease burden, all create a difficult situation at country levels in terms of identifying and allocating resources for NCDs. Donors could meet 10% of annual NCD needs with less than a doubling of current levels, and only 3% of total DAH (2014 value). Yet this is a major step. Thus, a two-tier approach to identifying funding options is necessary to bridge this gap: identifying new resources for horizontal planning and implementation; as well as seeking opportunities to finance specific prevention and treatment programmes for NCDs. Strengthening the prevention and treatment of alcohol and drug use disorders One such specific programme is recognized in SDG 3.5, calling specifically to strengthen prevention and treatment of substance abuse, including narcotic drug abuse and harmful use of alcohol. As identified in the WHO “best buys”, the largest return on investment in health care to address the treatment gap is to invest in primary health care-based screening and brief interventions, with referral to specialized treatment when indicated (Anderson et al.,2009). For example, WHO recently estimated the resource requirement for “best buy” NCD interventions at population level at a
7 | P a g e

median cost of less than 0.20US$ per person a year in low-income countries. Individually based preventive interventions at primary care level, very effective in preventing and managing AUD, would cost less than 1US$ per person in low-income countries, 1.5US$ in middle income countries and 2.5US$ per person in high income countries (WHO 2011). Potential sources of income specifically to address SUD have been suggested, with differing levels of evidence. A strong rationale in this paper is that deriving resources from alcoholic beverages that cause harm to health, is a publicly acceptable approach for communities. The revenue raised could be addressed to cover the prevention and treatment of alcohol and drug use disorders as a whole. While recognizing that integration in the resource mobilization for NCDs and a balanced investment approach would be best, this paper provides some arguments for those country situations where resource allocation is vertical and independently considered. Given difficulties in prioritization, the next sections in the paper analyse potential funding options to raise extra resources specifically for the prevention and treatment of alcohol and drug use disorders. II. INNOVATIVE FUNDING MECHANISMS FOR THE PREVENTION AND TREATMENT OF SUBSTANCE
USE DISORDERS Given the pressing need for increasing resources to deliver on the SDGs as a whole, initiatives mixing evidence based approaches with other more “out of the box” ideas are emerging across countries. The next sections present some of these potential funding sources to finance SDG 3.5 under the following 4 categories:
- Mechanisms directly related to alcohol beverages - Mechanisms related to other psychoactive substances and addictive behaviours - Mechanisms designed and used to finance health that could be applied to financing
prevention and treatment of alcohol and drug use disorders - Mechanisms not related to health issues at hand but that have been used to raise resources
for health or other issues and could be adopted and applied to financing prevention and treatment of alcohol and drug use disorders
II.1. FUNDING MECHANISMS DIRECTLY RELATED TO ALCOHOLIC BEVERAGES Taxes on alcohol are widespread and are used primarily to raise revenue. Governments typically impose taxes at the producer, wholesale, and retail levels that are levied as a percentage of the sale price or are based on a flat amount per gram of alcohol. Harmful alcohol consumption is controlled through prohibition, government monopolization of sales, "dry" days, restrictions on hours when sales are legal, restrictions on age and locations for sales and consumption, laws against drinking and driving, limits to alcohol content, laws against the sale of certain types of alcohol, and licensing (Anderson et al. 2009). There are examples of countries that have used revenue from taxes on alcoholic beverages to fund broader health promotion initiatives, health cover of vulnerable populations, and/or ensuring prevention and treatment for alcohol and substance use disorders. Taxation to fund health promotion in general Excise taxes on alcohol have been a significant revenue source in many countries, and recent experiences, such as the case of Philippines (Box 2) have explicitly earmarked alcohol and tobacco taxes to finance public health expenditures, among others. Increasing taxes through surcharges on products that can be harmful to health so they can be earmarked for public health purposes, has shown to make the introduction of such surcharges more politically acceptable and to provide the
8 | P a g e
revenue to finance increases in health costs. On the other hand, it has been noted that earmarking can raise difficult issues with respect to budgetary rigidity and political accountability (Bird, 2015), which should be addressed (see sections III and IV).
The evidence base and existing experience across countries indicates that a small surcharge tax on alcoholic beverages seems to be a reasonably potential way forward to cover prevention and treatment costs of alcohol and substance use disorders. Increases in tax are often seen as a potential win-win strategy, especially for products that are harmful to health. Examples from the tobacco field have shown successes of such taxes. In low income countries, tax increases that double the price of cigarettes are associated with up to 80% reductions in smoking rates (Chaloupka et al., 2012). Recent estimates have suggested that raising tobacco tax by 50% in China, would prevent 20 million premature deaths and generate an extra US$20 billion tax revenue annually (WHO, 2014). An analysis of 42 low, middle and high-income countries found that the potential of generating revenue by increasing existing excise duties on alcohol products could be even greater than for tobacco, given that excise taxes on alcohol tend to be lower than for tobacco in most countries. A 40% excise tax increase of the total retail prices would increase tax revenue in these countries by US$ 34 billion (Stenberg et al, 2010). There are ample examples where specific extra surcharges have been introduced to alcoholic beverages, as well as to tobacco, where revenues have been earmarked for public health ends. For example, The Philippines introduced a Sin Tax that provided health coverage to vulnerable populations, becoming one of the leading case studies of successful taxation with strong overall health benefits (Box 2). This is a kind of measure that moves away from the verticalization of health programmes into more integration and efficiency mechanisms. Earmarked surcharge to fund alcohol use disorders specifically Other countries have introduced specific surcharges to alcoholic beverages specifically earmarked to fund alcohol prevention and treatment efforts. Thailand, for example, used earmarked resources of a newly introduced tax to create their public health foundation (Box 3), which in turn dedicates part
Box 2. ‘Sin Tax’ for Health Coverage in the Philippines (sources: Kaiser et al., 2016) - ‘Sin tax’ reform bill in 2012 increased taxes on tobacco and alcohol
Overcoming Roadblocks: - Before speaking publicly about sin tax reform, Secretaries of Finance, Budget and
Management and Health had several meetings to align their messaging, inviting point persons from other government agencies and civil society to share updates and concerns and to coordinate actions in support of the reform, emphasizing the value of a “whole of government approach,” noting that, “If you’re not united, powerful opposing lobbies will capitalize on that.”
- Still strong lobbying from tobacco industry hindered advancement to pass the bill. A massive civil society campaign helped influence legislature and the public, helping pass the law
Revenues are earmarked: - 15% for programmes to help tobacco farmers and workers find alternative livelihoods - 85% to fund universal health care, upgrade medical facilities and train health care staff
Outcomes: In 2 years, the Department of Health budget increased from US$ 1.25 billion to nearly US$ 2 billion In 4 years, Health care coverage increased from 74% to 82% of the population
9 | P a g e

of its income to support specifically education and treatment for alcohol and other substance use disorders.
There is strong evidence that alcohol consumption is responsive to price, with the impact of an alcohol tax increase proportional to the size of the increase (Taskforce on Community of Preventive Services, 2010). Public support for such increases has been shown to increase substantially when the increased revenues are specifically directed to programmes that prevent and treat alcohol-related harm. A study modelling the potential benefit of an increase in excise tax for alcohol in Texas (Figure 4) compared the total cost of excessive alcohol consumption, $19 billion, and the share of the cost that the government pays, $7.7 billion, to the total alcohol revenue collected for all alcohol imposed taxes, $977 million, and the total alcohol excise tax revenue, $208 million. Whilst production and consumption of alcohol generates tax revenue, at current rates, the revenue is dwarfed by the costs caused by harmful alcohol use (Diaz et al., 2015).
Figure 4. The Cost of Excessive Alcohol Consumption and Total Alcohol Tax Collections in Texas 2013
In summary, excise taxes on alcohol have been a significant revenue source in many countries, and recent experiences, such as the case of the Philippines (Box 2) of Thailand (Box 3) or have explicitly earmarked alcohol and tobacco taxes to finance public health expenditures, among others. Increasing taxes in products that can be harmful to health so they can be earmarked for public
Box 3. Earmarked surcharge tax in Thailand to finance health promotion (source: McIntyre 2015; Adulyanon et al., 2012) In Thailand an additional 2% surcharge tax was administered to alcohol and tobacco products, in order to earmark the revenue to fund health promotion. Thai Health was created for this purpose and coordinates the implementation of US$100 million worth of multi-sectoral health promotion programmes, including promoting physical activity and healthy diets, as well as tobacco and alcohol control and traffic and injury management. Success factors for the initiative have been the relentless political support for the initiative and the involvement of active civil society organizations. The Thai Health approach has been identified an interesting way to ensure earmarking for a more integrated approach to NCDs, rather than emphasising verticalization, proposing a comprehensive multistakholder approach to different health promotion programmes, targeting specific problems, and enhancing primary health care. Such an approach is especially relevant given the recent multiple SDG 3 health and NCD targets.
10 | P a g e

health purposes, have shown to make the introduction of such surcharges more politically acceptable and provide the revenue to finance increase in health costs. Minimum price Minimum pricing is a direct price control set by government aimed at preventing the sale of alcohol below a certain price. Unlike tax increases, where the price increase may not necessarily be passed through to the point-of-sale, this policy ensures that a minimum price is paid by the consumer. In principle, this applies to all alcohol. However, it typically affects the higher-strength, cheaper products on the market. These products are typically for sale in the off-trade. Minimum price can be based on volume or on alcohol content. For example, the Canadian province of British Columbia has implemented a policy affecting the minimum price per gram of alcohol, while the province of Saskatchewan has applied a minimum price adjusted for alcohol content, both with large public health gains (Box 4).
While not generating much extra revenue for governments, minimum prices provide some small increases in VAT while being a very effective measure to avoid harm (Box 5). Following some of these modelling studies, it has been suggested that an optimal approach is the combination of a taxation with minimum unit pricing (Meier et al., 2016).
Implementation of minimum pricing in Europe however has met some roadblocks, as evidenced by the case example in Scotland (Box 6), which were subsequently overcome. Box 6. Scotland setting the first steps towards minimum price in the UK (Source: Public Health England, 2016) In 2012, the Scottish Parliament legislated to implement a 50 pence minimum unit price which was met by a legal challenge from the Scotch Whisky Association (SWA) on the grounds of a potential
Box 4. Health impact of minimum price in Canada (sources: Stockwell et al., 2012, 2013; Zhao et al., 2013) In the Canadian province of Saskatchewan, a 10% increase in minimum prices of alcohol reduced consumption of all beverages by 8.43%: -10.06% for beer (-22% for high strength beer >6.5% ABV), -5.87% for spirits and -4.58% for wine. Reductions were greatest in off-trade sales, such as off-licences, compared to on-trade sales, such as bars, largely due to more significant price increases in this setting. The neighbouring province of Alberta, where no minimum pricing policy was implemented, showed no change in per capita alcohol consumption over the same time period. A 10% increase in average minimum price for all alcoholic beverages in British Columbia was associated with a 32% reduction in wholly alcohol-related deaths, an 9% reduction in acute alcohol-related hospital admissions and a 9% reduction in chronic alcohol-related hospital admissions two to three years after the policy was implemented.
Box 5. Modelling different taxation and price policies on alcohol (Source: Meier et al, 2016) Taking England as a setting, an econometric modelling study equalised four taxing strategies on top of the current tax, to get the same 4.3% population wide reduction in alcohol related mortality:
- Current tax increase: a 13.4% all product duty increase - A value-based tax: a 4.0% ad valorem tax based on product price - A strength-based tax: a volumetric tax of £0.22 per UK alcohol unit (=8g ethanol) - Minimum unit pricing: a minimum price threshold of £0.50 per unit below which alcohol
cannot be sold. Pricing strategies differ as to how effects are distributed across the population. Impacts of price changes on moderate drinkers were small regardless of income or socio-economic groups. Volumetric taxation and minimum unit pricing outperformed increasing current tax or adding an ad valorem tax in terms of leading to larger reductions in health inequalities, largest impact on harmful drinking and minimal effects on those drinking in moderation.
11 | P a g e

breach of EU free trade regulations. The Scottish Courts considered whether implementing minimum unit price would restrict trade and if so, whether it could be justified on the grounds of health protection, in line with Article 36 of the EU Treaty. In May 2013, they ruled in favour of the legislation, however, following an SWA-led appeal, the case was referred to the European Court of Justice (ECJ) in April 2014. In December 2015, the ECJ declared that MUP would impede the free movement of goods within the EU. The case has been returned to the Scottish Courts to provide a final ruling, with the onus on the Scottish government to show that minimum pricing is more effective than fiscal alternatives (ECJ 2015). Plans for setting a minimum unit price were published by the Welsh government in July 2015 and the Northern Ireland Health Minister in December 2014. In addition, the Public Health Alcohol Bill published by the Republic of Ireland will introduce MUP at €1 per unit. Surcharge tax on retailer discounts and promotions There is evidence of a shift from on-premise to off-premise consumption across the world. Studies in Europe have identified that such a shift is persistent across types of alcoholic beverage (Box 7). Several reasons have been attributed to the shift, with price discounts and promotions and the impact of the economic crises being leading causes (Rabinovich et al., 2012). The problem with discounts and promotions is that any tax in place in the given country is not passed through to the consumer, leading to increased consumption. Competition between retailers may encourage marketing approaches, for example, discounting, that evidence indicates contribute to alcohol-related harms. Using alcohol discounts as a loss leading and promotion measures have been implemented by major retailers and supermarket chains as mechanisms to entice new consumers, or to entice existing consumers to increase their shopping basket, being covert loss-leading cross-promotional strategies designed to encourage the purchasing of non-discounted items (Wardle 2015). It is still cost-effective for the retailer to cover the extra tax on alcoholic beverages discounted and the loss in bundling to ensure dominance in the alcohol marketing sector; measures considered unethical to public health. Findings from an Australian study on loss-leading and bundling discounts suggest that the level of discounting and loss leading in alcohol may be as prevalent as it has been in the fuel sector, which has been deemed as unacceptable and uncompetitive behaviour by the Australian competition regulator (in Wardle 2015). Some countries have implemented discount bans showing promising results in tobacco (Golden et al., 2016). A strong case has also been made for alcohol, for example in Australia where supermarket catalogues' emphasis on low prices/high volumes of alcohol reflects that retailers are taking advantage of limited restrictions on off-premise sales and promotion, which allow them to approach market competition in ways that may increase alcohol-related harms in consumers. Regulation of alcohol marketing should address retailer catalogue promotions (Jonhston et al., 2016). A suggested measure would be to implement a surcharge tax on retailer-implemented discounts and promotions of alcoholic beverages. While there is no evidence of this measure having been implemented, it follows that implementing a taxing system at retailer level could raise revenue that could be earmarked to address the prevention and treatment of alcohol and substance use disorders. Such a tax could be set as a fixed rate or be proportional to the difference between the discounted products in relation to an established minimum price for alcohol. While more difficult to implement, this measure would combine the evidence based minimum-price strategy with a mechanism that would generate revenue from existing increased consumption because of retail discounts.
12 | P a g e
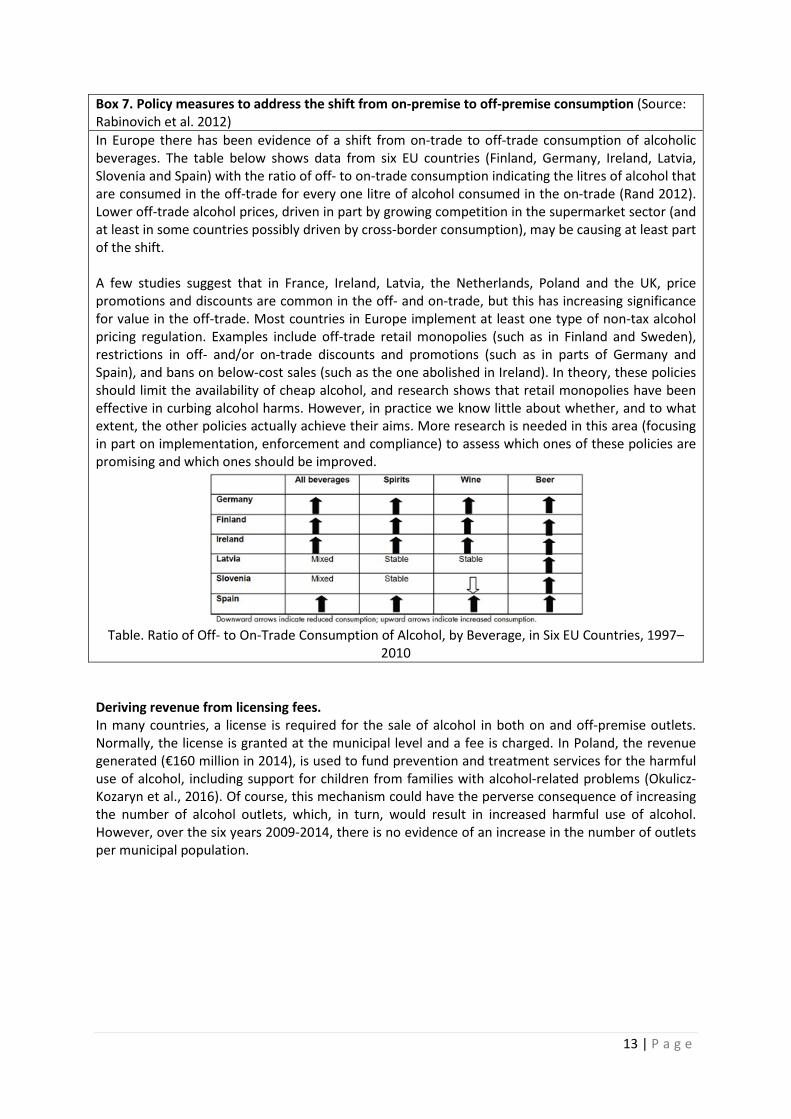
Box 7. Policy measures to address the shift from on-premise to off-premise consumption (Source: Rabinovich et al. 2012) In Europe there has been evidence of a shift from on-trade to off-trade consumption of alcoholic beverages. The table below shows data from six EU countries (Finland, Germany, Ireland, Latvia, Slovenia and Spain) with the ratio of off- to on-trade consumption indicating the litres of alcohol that are consumed in the off-trade for every one litre of alcohol consumed in the on-trade (Rand 2012). Lower off-trade alcohol prices, driven in part by growing competition in the supermarket sector (and at least in some countries possibly driven by cross-border consumption), may be causing at least part of the shift. A few studies suggest that in France, Ireland, Latvia, the Netherlands, Poland and the UK, price promotions and discounts are common in the off- and on-trade, but this has increasing significance for value in the off-trade. Most countries in Europe implement at least one type of non-tax alcohol pricing regulation. Examples include off-trade retail monopolies (such as in Finland and Sweden), restrictions in off- and/or on-trade discounts and promotions (such as in parts of Germany and Spain), and bans on below-cost sales (such as the one abolished in Ireland). In theory, these policies should limit the availability of cheap alcohol, and research shows that retail monopolies have been effective in curbing alcohol harms. However, in practice we know little about whether, and to what extent, the other policies actually achieve their aims. More research is needed in this area (focusing in part on implementation, enforcement and compliance) to assess which ones of these policies are promising and which ones should be improved.
Table. Ratio of Off- to On-Trade Consumption of Alcohol, by Beverage, in Six EU Countries, 1997–
2010 Deriving revenue from licensing fees. In many countries, a license is required for the sale of alcohol in both on and off-premise outlets. Normally, the license is granted at the municipal level and a fee is charged. In Poland, the revenue generated (€160 million in 2014), is used to fund prevention and treatment services for the harmful use of alcohol, including support for children from families with alcohol-related problems (Okulicz-Kozaryn et al., 2016). Of course, this mechanism could have the perverse consequence of increasing the number of alcohol outlets, which, in turn, would result in increased harmful use of alcohol. However, over the six years 2009-2014, there is no evidence of an increase in the number of outlets per municipal population.
13 | P a g e
Producer Subsidies to stimulate product reformulation/reduce alcohol volume Governments use producer subsidies to encourage production that improves health by lowering manufacturers' costs in situations in which the private market supply is inadequate to meet social needs. Examples include medical supplies, vaccines, food additives, and medical research. For example, in food fortification, governments sometimes subsidize the fortification of staple foods through the addition of selected micronutrients as a way of achieving broadly based nutrition improvements. Challenges involve maintaining a relationship between the public sector, which initiates and funds the program, and the private sector, which implements the fortification. Incentives for private providers are often needed in the form of tax exemptions, import preferences, subsidies for start-up costs, quality control, and training. Illegal markets selling non-fortified products at a lower price often arise in response (Nugent & Knaul 2006). Following this principle, some application of the subsidies approach could be developed for the reduction of alcohol volume in alcoholic beverages. While this would not generate revenue, it would decrease harm overtime. This could be coupled with the application and earmarking of differential taxation schemes, including extra surcharges for producers not reformulating. “Harm offsetting” (like carbon offsetting) by investing in treatment As for the environment or biodiversity, an approach, not without controversy, is offsetting (e.g. biodiversity or carbon emissions offsetting). Offsetting mechanisms work on the assumption of recognized accountability for a given product or consequence of production in producing harm. While, as with biodiversity, this is to be carefully considered to avoid the risk of becoming a license to “trash” if public regulation and monitoring is not rigorously enforced, working with the private sector across the value chain to introduce an “offsetting charge or contribution” could provide a new means of revenue that could be specifically targeted to addressing the problems created. The offsetting contribution could be proportional to the vested interest and profit margin across the value chain, or be a fixed amount. Revenue from state-owned retail monopolies, where they exist Despite current globalization and the strength of free markets and liberal trade agreements, there are countries in which state-owned retail monopolies exist. An argument is made for these to remain and be supported through government legislation. As a non-profit enterprise, retail monopolies provide a win-win situation with reduced availability, accessibility and opening hours, that result in reduced consumption, while raising revenue, given their non-for-profit nature (Room 1993). Arguments should be made for revenue generated in such retail monopolies to be earmarked for treatment of alcohol and substance use disorders. State-owned retail monopolies provide a serviceable and hospitable base for public health-oriented educational programs and health promotion campaigns (Ekström et al., 2011). Profit levy across alcohol beverages value chain In sustainable development revenue generation, a strong argument is made as to how governments need to improve the profitability of sustainable businesses relative to unsustainable ones. Policies should be designed so that corporate externalities are integrated into company accounts via, for example, increased use of fiscal measures, standards and market mechanisms. One of the primary failures of markets in relation to sustainable development is their inability to reflect the costs associated with unsustainable behaviours in Profit & Loss statements and Balance Sheets. This, in turn, is a result of the failure of global governments to properly internalise environmental and social costs into companies’ accounts. This could lead to an argument where specific regulation would dictate that a proportion of the profits across all actors included in the value chain from manufacturing to retail outlets is raised to address SDG 3.5.
14 | P a g e

Promoting accountability by taxing alcohol advertising Measures to restrict or ban alcohol advertising have long been discussed as ways to reduce exposure to the risk posed by alcohol at the individual and general population level. There is ample evidence that links advertising to increased consumption, and modelling studies have confirmed the impact of advertising regulations (OECD 2015) and advertising bans (Anderson et al. 2009) in reducing alcohol consumption and alcohol-related harm. Given the ample evidence linking advertising with consumption, an additional measure would be to add a tax on alcohol advertising. Given the very limited existing bans on all alcohol advertisements, this would allow countries to generate revenues that could be earmarked for prevention (via counter-advertising) and treatment of alcohol and substance use disorders. Ear-marking fines for non-compliance with alcohol regulations All countries have a suite of alcohol regulations to prevent the harmful use of alcohol. These include regulations on the roles of producer and retail companies that cover the price, availability and commercial communications of alcohol, as well as regulations on drinking environments and alcohol products (Anderson et al. 2009). Fines are often, and can be implemented for non-compliance of these regulations. A proportion of the monies received through the fines could be earmarked towards the costs of the prevention and treatment of alcohol and substance use disorders. II.2. FUNDING MECHANISMS RELATED TO OTHER PSYCHOACTIVE SUBSTANCES AND ADDICTIVE BEHAVIOURS Earmarking drug-related fines Fines and assets collected as part of drug-related offences can be used for the prevention and treatment of alcohol and substance use disorders. One example of where this is implemented is Egypt, for which the work of the National Council for the Prevention and Treatment of Addiction is partially funded through revenue collected from drug-related offences (Article 3 of the Presidential Decree No 46, 1991 to create a fund for the prevention and treatment of addiction and substance use disorders). Taxation of other legally traded psychoactive substances A series of States in the USA and other countries have chosen the legalization of cannabis or marijuana as a potential way to address a public health issue and to raise revenue at the same time. When considered as a tax revenue mechanism, legalization has proved to be cost effective, yet its controversial nature makes it a difficult decision. Box 8 identifies some watch-outs and myths that can be helpful when considering applying such measures.
15 | P a g e
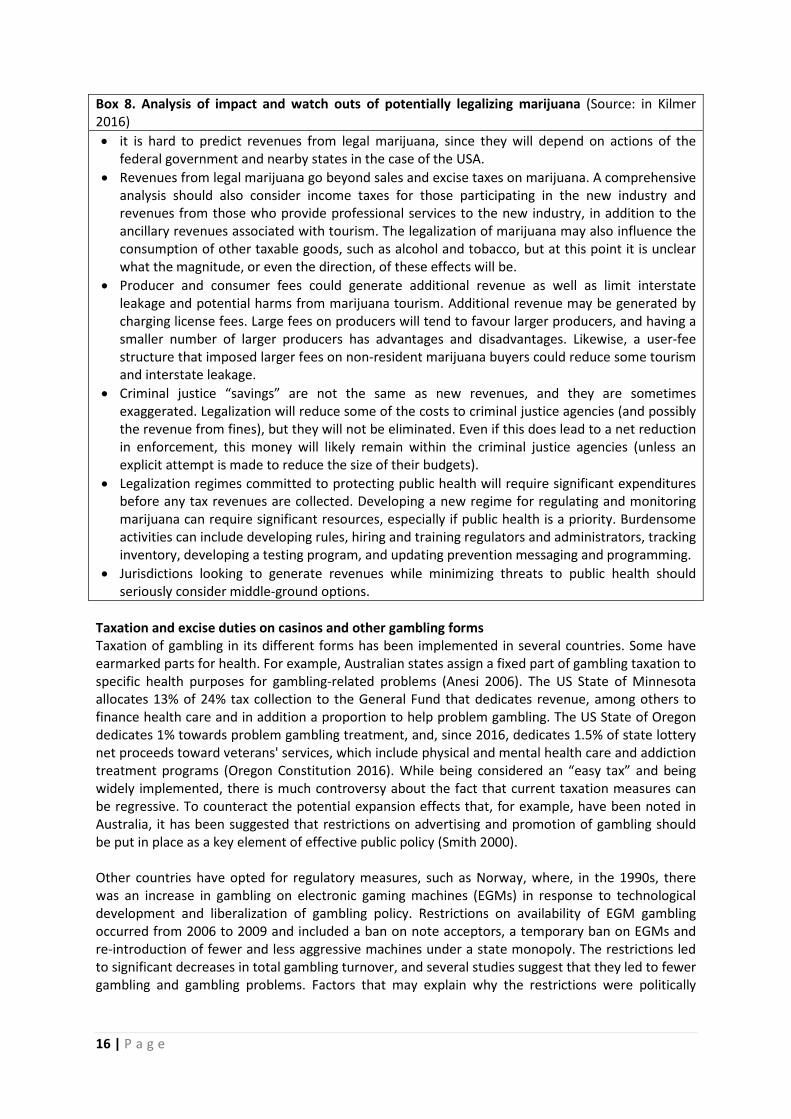
Box 8. Analysis of impact and watch outs of potentially legalizing marijuana (Source: in Kilmer 2016) • it is hard to predict revenues from legal marijuana, since they will depend on actions of the
federal government and nearby states in the case of the USA. • Revenues from legal marijuana go beyond sales and excise taxes on marijuana. A comprehensive
analysis should also consider income taxes for those participating in the new industry and revenues from those who provide professional services to the new industry, in addition to the ancillary revenues associated with tourism. The legalization of marijuana may also influence the consumption of other taxable goods, such as alcohol and tobacco, but at this point it is unclear what the magnitude, or even the direction, of these effects will be.
• Producer and consumer fees could generate additional revenue as well as limit interstate leakage and potential harms from marijuana tourism. Additional revenue may be generated by charging license fees. Large fees on producers will tend to favour larger producers, and having a smaller number of larger producers has advantages and disadvantages. Likewise, a user-fee structure that imposed larger fees on non-resident marijuana buyers could reduce some tourism and interstate leakage.
• Criminal justice “savings” are not the same as new revenues, and they are sometimes exaggerated. Legalization will reduce some of the costs to criminal justice agencies (and possibly the revenue from fines), but they will not be eliminated. Even if this does lead to a net reduction in enforcement, this money will likely remain within the criminal justice agencies (unless an explicit attempt is made to reduce the size of their budgets).
• Legalization regimes committed to protecting public health will require significant expenditures before any tax revenues are collected. Developing a new regime for regulating and monitoring marijuana can require significant resources, especially if public health is a priority. Burdensome activities can include developing rules, hiring and training regulators and administrators, tracking inventory, developing a testing program, and updating prevention messaging and programming.
• Jurisdictions looking to generate revenues while minimizing threats to public health should seriously consider middle-ground options.
Taxation and excise duties on casinos and other gambling forms Taxation of gambling in its different forms has been implemented in several countries. Some have earmarked parts for health. For example, Australian states assign a fixed part of gambling taxation to specific health purposes for gambling-related problems (Anesi 2006). The US State of Minnesota allocates 13% of 24% tax collection to the General Fund that dedicates revenue, among others to finance health care and in addition a proportion to help problem gambling. The US State of Oregon dedicates 1% towards problem gambling treatment, and, since 2016, dedicates 1.5% of state lottery net proceeds toward veterans' services, which include physical and mental health care and addiction treatment programs (Oregon Constitution 2016). While being considered an “easy tax” and being widely implemented, there is much controversy about the fact that current taxation measures can be regressive. To counteract the potential expansion effects that, for example, have been noted in Australia, it has been suggested that restrictions on advertising and promotion of gambling should be put in place as a key element of effective public policy (Smith 2000). Other countries have opted for regulatory measures, such as Norway, where, in the 1990s, there was an increase in gambling on electronic gaming machines (EGMs) in response to technological development and liberalization of gambling policy. Restrictions on availability of EGM gambling occurred from 2006 to 2009 and included a ban on note acceptors, a temporary ban on EGMs and re-introduction of fewer and less aggressive machines under a state monopoly. The restrictions led to significant decreases in total gambling turnover, and several studies suggest that they led to fewer gambling and gambling problems. Factors that may explain why the restrictions were politically
16 | P a g e

feasible include media coverage of gambling concerns and economic compensation for revenue losses under the monopoly (Rossow & Bang Hansen 2016). Mainstreaming all financial resources into a pooled system to increase efficiencies While this measure has not been implemented per se, the fight for resources and verticalization of programmes is not only across diseases. There are large inefficiencies within a given disease area in terms of how the available resources are utilized. At country level, there are numerous organizations, health facilities, even research and non-governmental organizations where much work is replicated, and resources inefficiently distributed. While very controversial and difficult to operationalise, a pooling mechanism at country level or a major partnership where all resources were pooled and operationalized to maximize efficiency would create a joint effort to address alcohol and substance use disorders, and a unique partnership as called for within the SDGs frameworks. II.3. FUNDING MECHANISMS USED TO FINANCE HEALTH THAT COULD BE APPLIED TO FINANCING PREVENTION AND TREATMENT OF ALCOHOL AND SUBSTANCE USE DISORDERS There are interesting examples of funding mechanisms have been put in place for other health issues that could be adapted or expanded to include addressing alcohol and substance use disorders. This section outlines three such broader strategies for potential adaptation. Subsidizing health care This is illustrated in Box 9. Box 9. Subsidizing the production and provision of health care in Mexico (source: in Nugent & Knaul, 2006) One example of subsidizing the production and provision of health care is the Mexican program originally called PROGRESA and also known as “Oportunidades”. This program is also an example of how income transfers for other goods can affect health and how cross-subsidies can be used to strengthen the incentive effects of a fiscal policy to promote healthy behavior. The government launched the program in 1997 to provide subsidized health, nutrition, and education to poor families. By mid 2004, it was serving the majority of those living below the poverty line. “Oportunidades” combines a cash transfer equivalent to 20 to 30 percent of families' incomes that includes incentives for positive behaviors in relation to health, nutrition, and schooling with subsidized basic health interventions. The program is largely financed from federal budgets. “Oportunidades” is successful both in terms of targeting the poorest households and in terms of achieving measurable gains in health, health care use, nutritional status and growth, school attendance, and school achievement. The program's success is attributable to many factors, including a rigorous longitudinal evaluation process; an integrated package of services; and the presence of financial stimuli tied to school attendance, visits to health clinics, and participation in health education initiatives. Health Promotion at the Workplace The role of business as an employer, as, for example, the role of the public sector as the world’s largest employer, has often been called for to address health through schemes or workplace health promotion offerings. In the beginning of 2000, a growing area for workplace health promotion was HIV/AIDS, and it was suggested that the failure on the part of most firms to act, even if they correctly perceived the business, human, and social challenges of HIV/AIDS, was attributable to a lack of incentives (Bloom et al. 2004). Significant externalities (benefits to society and firms) are likely to result from promoting greater action by firms. Some private firms began providing HIV/AIDS
17 | P a g e
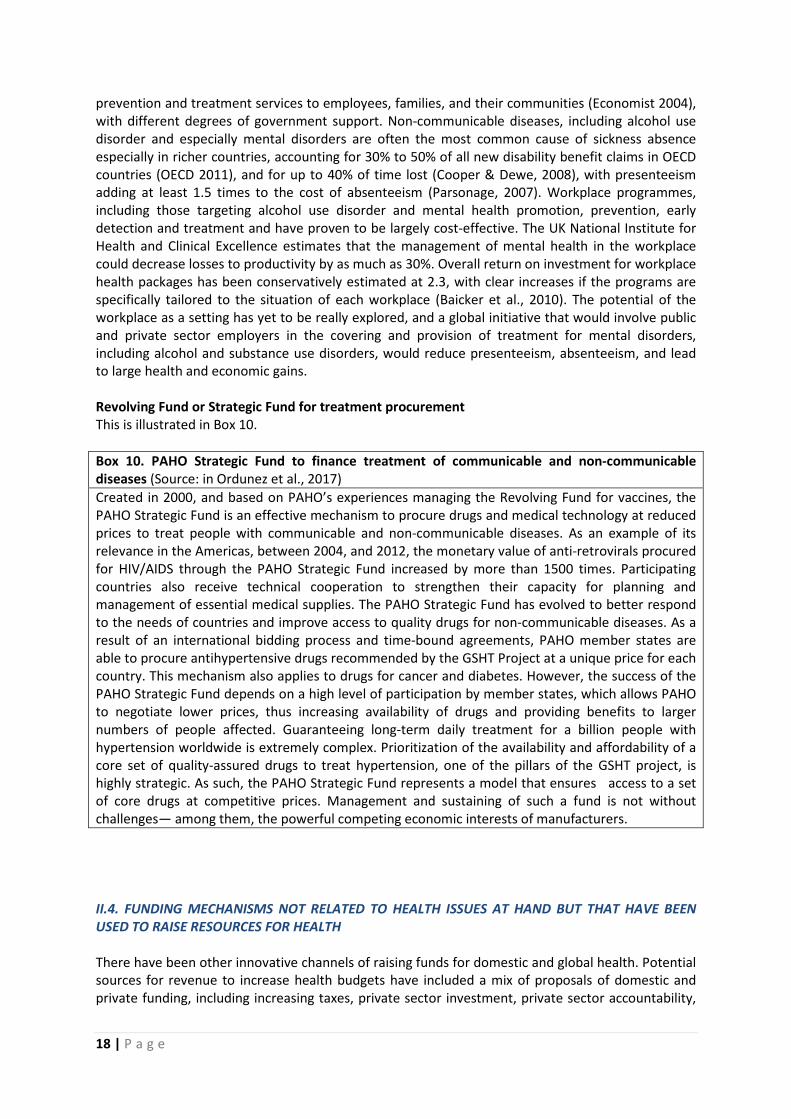
prevention and treatment services to employees, families, and their communities (Economist 2004), with different degrees of government support. Non-communicable diseases, including alcohol use disorder and especially mental disorders are often the most common cause of sickness absence especially in richer countries, accounting for 30% to 50% of all new disability benefit claims in OECD countries (OECD 2011), and for up to 40% of time lost (Cooper & Dewe, 2008), with presenteeism adding at least 1.5 times to the cost of absenteeism (Parsonage, 2007). Workplace programmes, including those targeting alcohol use disorder and mental health promotion, prevention, early detection and treatment and have proven to be largely cost-effective. The UK National Institute for Health and Clinical Excellence estimates that the management of mental health in the workplace could decrease losses to productivity by as much as 30%. Overall return on investment for workplace health packages has been conservatively estimated at 2.3, with clear increases if the programs are specifically tailored to the situation of each workplace (Baicker et al., 2010). The potential of the workplace as a setting has yet to be really explored, and a global initiative that would involve public and private sector employers in the covering and provision of treatment for mental disorders, including alcohol and substance use disorders, would reduce presenteeism, absenteeism, and lead to large health and economic gains. Revolving Fund or Strategic Fund for treatment procurement This is illustrated in Box 10. Box 10. PAHO Strategic Fund to finance treatment of communicable and non-communicable diseases (Source: in Ordunez et al., 2017) Created in 2000, and based on PAHO’s experiences managing the Revolving Fund for vaccines, the PAHO Strategic Fund is an effective mechanism to procure drugs and medical technology at reduced prices to treat people with communicable and non-communicable diseases. As an example of its relevance in the Americas, between 2004, and 2012, the monetary value of anti-retrovirals procured for HIV/AIDS through the PAHO Strategic Fund increased by more than 1500 times. Participating countries also receive technical cooperation to strengthen their capacity for planning and management of essential medical supplies. The PAHO Strategic Fund has evolved to better respond to the needs of countries and improve access to quality drugs for non-communicable diseases. As a result of an international bidding process and time-bound agreements, PAHO member states are able to procure antihypertensive drugs recommended by the GSHT Project at a unique price for each country. This mechanism also applies to drugs for cancer and diabetes. However, the success of the PAHO Strategic Fund depends on a high level of participation by member states, which allows PAHO to negotiate lower prices, thus increasing availability of drugs and providing benefits to larger numbers of people affected. Guaranteeing long-term daily treatment for a billion people with hypertension worldwide is extremely complex. Prioritization of the availability and affordability of a core set of quality-assured drugs to treat hypertension, one of the pillars of the GSHT project, is highly strategic. As such, the PAHO Strategic Fund represents a model that ensures access to a set of core drugs at competitive prices. Management and sustaining of such a fund is not without challenges— among them, the powerful competing economic interests of manufacturers. II.4. FUNDING MECHANISMS NOT RELATED TO HEALTH ISSUES AT HAND BUT THAT HAVE BEEN USED TO RAISE RESOURCES FOR HEALTH There have been other innovative channels of raising funds for domestic and global health. Potential sources for revenue to increase health budgets have included a mix of proposals of domestic and private funding, including increasing taxes, private sector investment, private sector accountability,
18 | P a g e

and creation of national insurance mechanisms for the most vulnerable (Box 2, above). In some countries, innovative funding mechanisms, partly introducing and earmarking new taxes, have provided funding options which are allocated to the most pressing priorities (Box 11). The argument could be made for a proportion of such revenues to be dedicated to prevention and treatment of alcohol and substance use disorders. Tax surcharge mobile operators As with the case of Gabon (Box 12), several countries have applied a 10% tax surcharge to mobile operators and have levied 1.5 percent on the post-tax profits of companies that handle remittances to be directed towards health care of low-income groups.
Private sector funding through CSR For private sector financing for meeting the SDGs, the issue is how best we can assess the private sector’s contribution not just to growth and job creation, tax contribution, foreign exchange earnings, skill creation, technology transfer, but also to social and environmental targets and to spill-overs to ancillary investments. Many private companies have Corporate Social Responsibility (CSR) programmes, which they consider take care of their social responsibility, by building schools, health centres, or other programmes that help local communities. India, for example, has a CSR law that requires 2% of profits to be invested in CSR. But given the scale of transformation needed in production systems, this issue goes well beyond having good CSR programmes. One of the ways in which this could be encouraged is to use the World Bank’s IEG methodology for private sector projects: projects are rated not only on financial return – but also on social and environmental contribution and towards broader private sector development. Plane tickets levy Since 2006, UNITAID has been raising funds through the 'air ticket levy' (ATL). In the past five years, more than 50 percent of its funds have been raised through this channel. Nine countries have implemented the ATL: Cameroon, Chile, Congo, France, Madagascar, Mali, Mauritius, Niger, and the
Box 11. Appropriate allocation of public funds for health through targeted budget transfers in Gabon (Source: in World Health Organization 2016b) Gabon introduced a non-contributory, fully subsidized programme for the “economically vulnerable” called the “Gabonais Economiquement Faibles” - GEF in 2007. Based on direct means-testing of individual income, the GEF scheme’s target population is people with annual income below FCFA 80,000 (US$152), and it covers dependents, as well as students, pupils and refugees. Under the umbrella of the CNAMGS (the recently created national health insurance fund), the scheme is funded by newly introduced ear-marked taxes and general revenues. Ear-marked funds, originating from taxes on mobile phone company turnovers and on individual money transfers, cover more than two-thirds of the GEF fund expenditure. The scheme has so far enrolled 90% of its target population and provides coverage of a standard benefit package of health services with no co-payments. The benefit package is comprehensive and covers outpatient, ambulatory, and inpatient services, as well as medicines. It is thus similar to the one offered to formal sector workers. Informal sector workers have yet to be enrolled in a separate scheme, but are still expected to be under the CNAMGS umbrella. The ear-marked revenues used to fund GEF were recently found to be insufficient to cover the scheme’s increasing expenditure which has been driven by increased enrolment and demand for health services, and led to the fund reporting a budget deficit in 2015. The GEF case is an example of the need for general revenues to support such schemes even when ear-marked sources, such as indirect taxes or social contributions are helping bridge resource gaps. It also underlines the importance of strategic purchasing to better manage demand and expenditure, especially in fee-for-service environments, as exists, for example, in Gabon.
19 | P a g e

Republic of Korea. Norway allocates part of its tax on carbon dioxide emissions (UNITAID). The funds have remained stable despite global economic turbulence; this proves the robustness of this source. In India, it has been recently argued to apply the Air Ticket Levy as an additional domestic source of financing, so that the funds could remain within national boundaries and go directly into a pool set up by the government. Like the UNITAID airline levy, which ranges from US$1 for economy class tickets to approximately US$40 for business and first-class travel, the domestic airline levy could also be differentiated based on type of travel or distance travelled. The levy would be a simple addition to an existing airport tax, and can be nominal enough not to affect demand (Gupta & Chowdhury 2015). Extractive industry micro-levy to fight malnutrition In September 2014, UNITAID announced the launch of its newest innovative financing initiative; UNITLIFE, a levy on extractive natural resources, particularly oil, but also gold, bauxite and uranium, initially in Africa. Denis Sassou Ngeusso, the President of the Republic of Congo at its launch, announced that Congo was going to give 10 cents for every barrel of oil in his country. If eight African countries would agree to the tax, the oil levy was expected to raise $100-$200 million per year. This new revenue is dedicated to innovations in the fight against chronic malnutrition, which leads to an irreversible damage in children, affecting their growth and brain development and is an important risk factor for death among children in Africa. The secretariat for Unitlife is being set up at UNICEF. While Foetal Alcohol Spectrum Disorder (FASD) is most prevalent in USA and Europe, it has been found for example in some populations in South Africa, to a prevalence rate as high as 17% to 23% (May 2016). Being such a critical problem for child’s development, an argument could be made for a proportion of the raised funds to support, where needed, the prevention and management of Foetal Alcohol Spectrum Disorder. Tax on financial transactions In the last years, the EU countries have tried to push for more action regarding innovative financing mechanisms, as demonstrated by the discussions on a Financial Transaction Tax. The idea of a tax on financial transactions and capital dates as far back as 1972, but gained new support after the 2008 financial crisis. Its supporters point to its enormous potential. Depending on definition, a transaction tax of one half of a basis point (0.005 per cent) on all trading in main currencies would yield USD 40 billion per year (Matheson, 2011). As of June 2017, the Financial Transaction tax at the EU level remains under discussion, with no firm decisions for implementation made. While this is a very difficult measure to implement, in those countries where discussions might be in progress, some arguments, for example, linked to the social costs due to alcohol, could be made for a proportion to be dedicated to investing in health. Pooled financing mechanisms for NCDs Particularly at the time of the UN High Level Meeting for NCDs, several discussions debated whether a similar pooled financing mechanism as there is for vaccines (GAVI) or infectious diseases (Global Fund) would be appropriate for NCDs. Pooled financing mechanisms have demonstrated to be effective in fighting, for example, infectious diseases (Box 12). Box 12. Success factors in pooled financing mechanisms (Source: in Schmidt-Traub & Sachs, 2015) Success in the health sector, and lack of progress in other SDG areas, demonstrate the central role of pooled financing mechanisms in financing, organization, knowledge transfer, and advocacy. Pooled mechanisms like Gavi and the Global Fund to Fight AIDS, Tuberculosis and Malaria (GFATM) help to promote: (i) effective country-led programs and national ownership; (ii) technical integrity, rapid
20 | P a g e
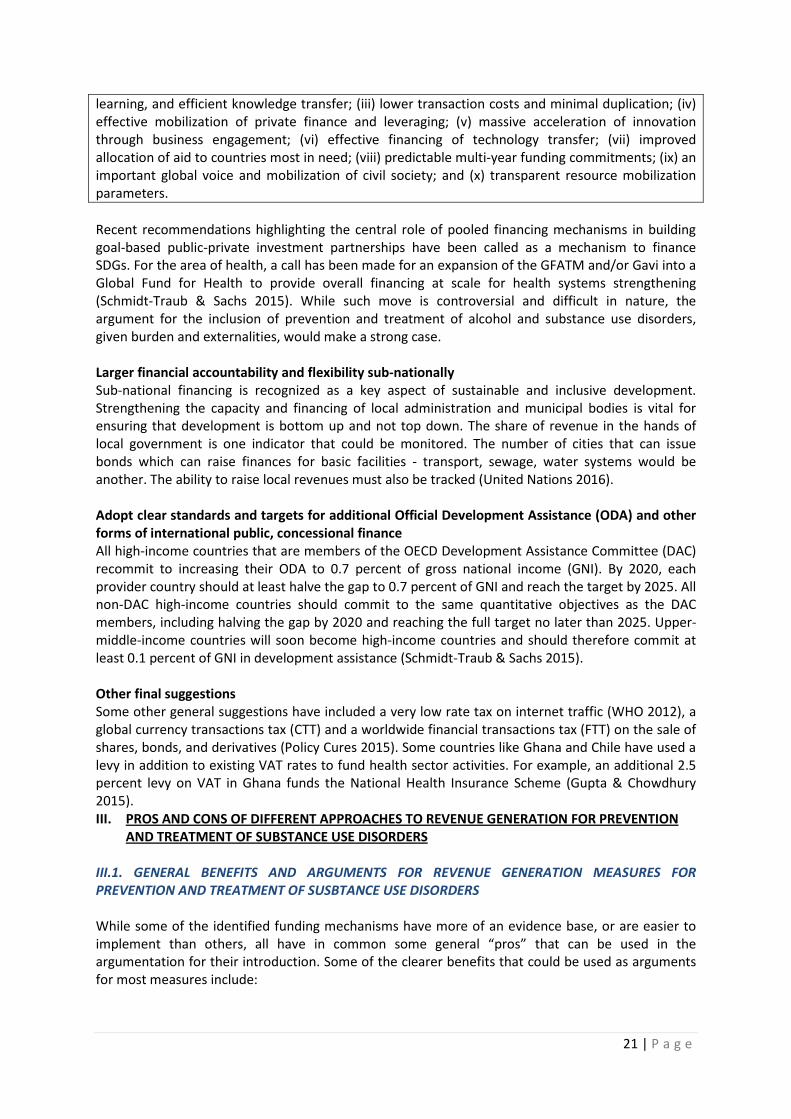
learning, and efficient knowledge transfer; (iii) lower transaction costs and minimal duplication; (iv) effective mobilization of private finance and leveraging; (v) massive acceleration of innovation through business engagement; (vi) effective financing of technology transfer; (vii) improved allocation of aid to countries most in need; (viii) predictable multi-year funding commitments; (ix) an important global voice and mobilization of civil society; and (x) transparent resource mobilization parameters. Recent recommendations highlighting the central role of pooled financing mechanisms in building goal-based public-private investment partnerships have been called as a mechanism to finance SDGs. For the area of health, a call has been made for an expansion of the GFATM and/or Gavi into a Global Fund for Health to provide overall financing at scale for health systems strengthening (Schmidt-Traub & Sachs 2015). While such move is controversial and difficult in nature, the argument for the inclusion of prevention and treatment of alcohol and substance use disorders, given burden and externalities, would make a strong case. Larger financial accountability and flexibility sub-nationally Sub-national financing is recognized as a key aspect of sustainable and inclusive development. Strengthening the capacity and financing of local administration and municipal bodies is vital for ensuring that development is bottom up and not top down. The share of revenue in the hands of local government is one indicator that could be monitored. The number of cities that can issue bonds which can raise finances for basic facilities - transport, sewage, water systems would be another. The ability to raise local revenues must also be tracked (United Nations 2016). Adopt clear standards and targets for additional Official Development Assistance (ODA) and other forms of international public, concessional finance All high-income countries that are members of the OECD Development Assistance Committee (DAC) recommit to increasing their ODA to 0.7 percent of gross national income (GNI). By 2020, each provider country should at least halve the gap to 0.7 percent of GNI and reach the target by 2025. All non-DAC high-income countries should commit to the same quantitative objectives as the DAC members, including halving the gap by 2020 and reaching the full target no later than 2025. Upper-middle-income countries will soon become high-income countries and should therefore commit at least 0.1 percent of GNI in development assistance (Schmidt-Traub & Sachs 2015). Other final suggestions Some other general suggestions have included a very low rate tax on internet traffic (WHO 2012), a global currency transactions tax (CTT) and a worldwide financial transactions tax (FTT) on the sale of shares, bonds, and derivatives (Policy Cures 2015). Some countries like Ghana and Chile have used a levy in addition to existing VAT rates to fund health sector activities. For example, an additional 2.5 percent levy on VAT in Ghana funds the National Health Insurance Scheme (Gupta & Chowdhury 2015). III. PROS AND CONS OF DIFFERENT APPROACHES TO REVENUE GENERATION FOR PREVENTION
AND TREATMENT OF SUBSTANCE USE DISORDERS III.1. GENERAL BENEFITS AND ARGUMENTS FOR REVENUE GENERATION MEASURES FOR PREVENTION AND TREATMENT OF SUSBTANCE USE DISORDERS While some of the identified funding mechanisms have more of an evidence base, or are easier to implement than others, all have in common some general “pros” that can be used in the argumentation for their introduction. Some of the clearer benefits that could be used as arguments for most measures include:
21 | P a g e
1. Finance closing the treatment that currently lacks resources In face of the lack of resources and further prioritization of alcohol problems within current resource allocation, the development of new funding mechanisms, like fiscal measures on alcoholic beverages that cause the harm, have a minimum implementation cost, are highly cost effective, and might, in addition provide the necessary resources to address the problem and balance the bank in terms of extra healthcare costs raised.
2. Development and implementation of specialized programmes for treating alcohol and drug use disorders Whilst primary health care-delivered brief interventions are effective and cost effective in managing many cases of alcohol and drug use disorders, there are and always will be a high proportion of cases that require specialist treatment. In health care, it is becoming increasingly difficult for health professionals to deal with specialist treatments across different fields of health care to the same level of competence. Addiction medicine is no exception to this, and is developing rapidly. Financing mechanisms can, and need to, ensure that all health systems provide specialized services for the treatment of alcohol and drug use disorders.
3. Support low-income populations making it more politically acceptable Increased expenditure on public health especially for low-income persons, through the extra revenue raise by fiscal or regulatory measures, is beneficial particularly in low income countries and for low-income vulnerable populations in terms of both equity and increasing productivity. In the case of fiscal policies, the presumed progressivity of expanding health spending compensates at least to some extent for the regressive potential of taxes, thus being beneficial to low income populations, and making tax reform a more politically acceptable measure.
4. Balance and offset the costs and externalities of harmful alcohol use
Harmful alcohol use costs high, middle and low-income countries in the order of 2.1% to 2.5% of GDP (Rehm et al., 2009). The majority of the cost is carried by governments. For example, harmful alcohol use cost the United States $249 billion in 2010, or approximately $2.05 per drink. About $2 of every $5 were paid by government (Sacks et al 2015). Currently taxes on alcoholic beverages do not cover the costs of the harm done by alcohol (see figure 2). For example, in the United States in 2006, combined federal and state taxes on alcoholic beverages were approximately $0.12 per drink while the median cost to state governments (including health care expenditures, criminal justice system costs, etc.) was $0.78 per drink (Sacks, Roeber Bouchery et al., 2013). Any revenue generation through different measures could help bridge the current gap in offsetting the costs produced by the harmful use of alcohol.
5. Revenue generating schemes are politically more acceptable when linked to solving a
problem caused by the intervened product (for any measure directly related to alcoholic beverages, drugs or gambling) Specifically dedicating the raised resources through taxation or restrictive legislation for the problems caused by products/services causing harm and externalities will enhance public support to finance incremental expenditure programmes, which the public might not otherwise support in the absence of the linkage (Shome 1995). In countries where over-prescription of opioid pain relievers has led to an escalation of opioid deaths (U.S. Department of Health and Human Services 2016), a surcharge tax on opioids could be considered to raise funds to cover treatment costs for prescription opioid use disorder. The benefit principle legislation mandating such “earmarking” could contain a clause requiring the review, after a
22 | P a g e

period of implementation, of the public health / treatment programmes that will be developed.
6. Decreases alcohol consumption, increasing the health or the population, decreasing violence and other negative consequences of the harmful use of alcohol In the case of fiscal or regulatory measures for alcohol, evidence shows they are the most effective and cost-effective measures for decreasing alcohol harm and increasing population health. They will have impact on associated harms, reducing violence, traffic accidents, work related harms, children born with foetal alcohol syndrome, and harms to people other than the drinker.
III.2. GENERAL CONS AND POTENTIAL PROBLEM AREAS IN REVENUE GENERATION MEASURES FOR THE PREVENTION AND TREATMENT OF SUBSTANCE USE DISORDERS
1. Might lead to consumers shifting to illicit products, substitution, encouraging illegal production Especially in low and middle-income countries, it has been argued that increasing alcohol taxes could create a large deadweight loss of taxation, as drinkers might decide to buy illicit alcohol as a substitute to alcohol products with increased alcohol tax. The “effect of alcohol tax increases may be undercut by increases in illegal production, tax evasion and illegal trading” (WHO 2010). This may, in the long run, create a substantial loss to society greater than would have occurred in the absence of the tax increase. For example, higher taxes may encourage alcohol consumers to smuggle in alcohol or to substitute alcoholic beverages with higher taxes with potentially harmful alternatives that are produced illegally. In Africa, for example, high cross-price elasticities indicate that consumers are quick to substitute high priced beer with locally produced alternatives (Babor et al., 2010). In the long term, the sales of informally produced alcohol should be regulated and brought it into the taxation system
2. Over-powerful lobbying poses much opposition, making it politically difficult to go through The powerful effects of lobbying against proposed tax reforms for products at the roots of
causing NCDs (e.g., tobacco, alcohol, unhealthy food & beverages) are known to be a disruptive force in any discussions on introducing new taxes. Evidence of their lobbying successes is available (e.g., Zatonski et al 2016), but strong civil society mobilization has been known to help overcome their influence and be instrumental in passing tax reform, as evidenced by the case study of the Philippines (Box 2).
3. Weakening existing horizontal programmes Earmarking specifically for treatment of alcohol and drug use disorders might encourage
isolation and lack of efficiency, treating risk factors for NCDs separately, in health systems already ill-equipped to address NCDs and to provide universal health coverage. It might recall previous approaches in competition for resources to fight infectious diseases, which led to replication and inefficiencies. The counter-argument is that as NCDs might not be a priority in already scant budgets within ministries of health, increasing the proportion of tax earmarked for preventive approaches through the benefit principle might assure that at least closing the treatment gap of alcohol and drug use disorders is supported. This is particularly the case when overall resourcing does not increase, and historical budgeting practices and distribution of resources in health system priorities prevail (McIntyre 2015).
23 | P a g e

4. Is unnecessary given underspending health budgets A less likely but still arguable situation is that illustrated by data from the Africa region, which
indicate that the proportion of unspent health budget ranges from 10% to 30% of authorized allocations in African countries (World Health Organization 2016b). It has been argued that, from a fiscal space for health perspective, failing to spend the entirety of the Parliament authorized budgets entails a loss of financial resources for the health sector, and missed opportunities for improving overall service coverage and financial protection, while at the same time makes the case for increased taxes to earmark for health potentially less successful.
5. Increases government accountability The most important reason against earmarking is that of increased accountability of
governments in implementing such measures. The expectation of earmarking and providing more resources for health care increases accountability of governments from the public’s perspective. Examples of countries where earmarking has taken place have experienced that increases in revenue from new taxes imply a reduction of regular budgets, setting back the income for health and care to that which was before. Thus, earmarking might increase public’s expectation of programmes and services and thus increase government’s accountability; but, a situation might arise where there is no assurance within departments of increased income, and this tends to disfavour earmarking.
For fiscal measures specifically, which are the ones with largest evidence base, implementation and most widely available, some other cons could be noted:
6. Tax increase (earmarked or not) is an unpopular measure and has strong political opposition Arguments have been made that alcohol taxes are unfair to “responsible drinkers”; the cost of alcohol tax increases are disproportionately paid by those moderate drinkers who are not the cause of the problem. However, strong counter-arguments from recent studies in the USA have demonstrated that increases in revenue taxing proportionally all drinkers including excessive drinkers, would lead to those with higher incomes and non-Hispanic whites to pay the most (Naimi et al., 2016). The US study suggests that excessive drinkers would pay 4.8 to 6.8 times as much as non-excessive drinkers on a per capita basis and would pay at least 72% of aggregate costs. For non-excessive drinkers, the largest tax increase ($0.25 per drink) would average less than $10. Likewise, modelling studies in the UK have concluded that impacts of price changes on moderate drinkers are small regardless of income or socio-economic groups (Meier et al., 2016).
7. The poor will be worse off given the regressive nature of the measure Given that taxes are regressive, they place a greater relative burden on lower-income consumers. On the other hand, some studies have noted that, given that the economically disadvantaged are more price sensitive, they might reduce their expenditure on alcohol goods and end up being no poorer than before. A recent study in South Africa, where 40% of the cigarette tax burden is estimated to be borne by the poorest 20% of the population, found than an increase in the tax actually reduced the burden on this group, concluding that “not only are tobacco taxes important to improve public health but they are also a useful instrument in the fight against poverty” (Bosch & Koch 2014), even when accounting for stockpiling.
8. Increased tax is passed-through to the consumer
24 | P a g e

The further revenue generated by the earmarked surcharge will support closing the treatment gap, benefiting the population as a whole. Effective use of alcohol duty to reduce consumption and harm depends partly on retailers passing duty increases on to consumers via price increases, also known as ‘pass-through’. Thus, the extra tax portion would normally be paid by the consumer, as business tend to pass on such taxes through retail prices. While it would increase the shopping basket cost of consumers, the extra tax will have the effect of reducing alcohol consumption. If the businesses’ strategy is to absorb the tax in lower profit margins, the extra tax will be collected nevertheless and support treatment. So if the tax is passed on to the consumer, it might result in less tax than expected being collected, but it would be more than before the introduction of the measure and it will also lead to a decrease in consumption and thus health problems. If the tax is absorbed by the producers, the full expected tax will be collected and projected revenue be used towards SDG 3.5. An analysis of evidence of UK excise duty and sales tax (VAT) pass-through rates for alcohol products at different price points identified different strategies of under and over-shifting that impacted consumption of heavy drinkers and should be taken into account.
9. Cross-border revenue effects as an overall risk of increased excise taxes or strong regulatory measures
In those regions and countries where it applies, cross-border purchasing might be a strategy consumers use to overcome the increased price of alcoholic beverages, although the evidence with respect to alcohol is not so strong (Room et al. 2013). Cross-border shopping can be reduced by either narrowing the tax differences, or regulations enforcing stricter control (Lachenmeier et al., 2011).
IV. ROADMAP TO EXPLORE THE DEVELOPMENT OF NEW FUNDING MECHANISMS FOR PREVENTION AND TREATMENT OF ALCOHOL AND SUBSTANCE USE DISORDERS Different countries have different legislations and measures in place, and will find themselves with differing levels of resources, needs, mechanisms for implementation, and milestones to respond to. This section outlines a very general set of steps when considering the application of new revenue mechanisms for addressing SDG 3.5., the prevention and treatment of alcohol and substance use disorders, and outlines a series of “watch out” considerations more specifically related to the proposals made in sections II and III. Based on different roadmaps for implementation (WHO 2013, Gavigan et al. 2015) of new measures, Box 13 outlines some basic steps to take into account. Box 13. Recommendations for the development of a common roadmap when aiming to adopt new financing mechanisms (Sources: WHO 2013, Gavigan et al. 2015) Ensure high-level political commitment: Without commitment at the highest political levels, developing any new financing mechanisms can be easily derailed by changes in staffing, in political parties, in economic circumstances, etc. Develop and link the national strategy at government level: to strategies for sustainable development, for the implementation of the decisions taken, and adding a clear rationale for SDG 3.5. Develop a clear strategy for the new financing mechanisms: detailing an extensive set of revenue mechanisms and the clear rationale, with expected outputs of the choices undertaken Develop and agree a roadmap: containing specified financial and operational targets Engage all relevant stakeholders from the outset: including non-State actors and civil society Maximizing efficiencies: Enhance coherence, reduce fragmentation and overlap and increase
25 | P a g e
effectiveness, efficiency and transparency, while reinforcing coordination and cooperation across areas of action, Coordination and oversight: Set up a national co-ordination structure responsible for the follow-up of the revenue generation and reaching milestones Time dimension: Introduce a system of decision making that takes into account the time dimension, i.e. the need to combine and balance short-term with long-term thinking (including building in long-term thinking despite short election cycles and the desire for short-term political gains). Built-in monitoring and evaluation: M&E is needed to assess progress against the roadmap targets, as well as to track changes to the epidemic, issues affecting the testing and treatment cascade, access by key populations to essential services, and other important considerations. Develop the right indicators and process to register progress, balancing process and outcome evaluation, including the right mechanisms and stakeholders Address ongoing challenges: Develop a system to identify challenges as measures are developed/implemented, and put in a plan to allow the development of appropriate strategies to overcome them Continuous science-policy interface: Set up a knowledge dimension that improves the science-policy interface and the need to integrate knowledge and experience from various areas in society in decision-making, to strengthen the arguments in further expanding the new financing mechanisms Accountability is key: Ensure there is an accountability plan in place along the financing mechanisms, with agreed reporting mechanisms and information campaigns that reach all sectors and stakeholders IV.1. GENERAL TECHNICAL ‘WATCH-OUTS’ WHEN APPLYING NEW MEASURES FOR REVENUE GENERATION FOR PREVENTION AND TREATMENT OF ALCOHOL AND SUBSTANCE USE DISORDERS This section provides a series of general recommendations for the implementation of any types of revenue mechanisms that have proven to be instrumental in the success of existing country efforts. They are watch-outs from the implementation of the measure itself, rather than necessarily the development of the roadmap, but in many cases, they should be an integral part of to be developed country roadmaps for identifying and raising new financing mechanisms. • Make arguments that have intersectoral influence - ensure to make the case to other
ministries See Box 14
Box 14. A range of taxes to establish a Prevention Fund in the French Polynesia (Source: Thow et al., 2010) In 2002 the French Polynesian government introduced a range of taxes including “production” (excise) taxes on sweetened drinks and beer, “consumption” (import) taxes on sweetened drinks, beer and confectionery and a separate tax on ice-cream, to fund the establishment for prevention (EPAP). The taxes gained widespread support from government ministers because the wide range of activities undertaken (public health, education, youth and culture, sport, family and road safety) benefited 7 out of the 17 ministers. The production tax revenue increased by 18% between 2002 and 2005, and the import tax revenue by 5.2% in those three years. A change in government in 2006 kept the taxes but changed earmarking process, so funds from production tax would go to the government’s general budget (80% of which were still earmarked for the general Health budget), highlighting that political change can influence the sustainability of prevention funds. Learning lessons might include securing funding streams for specific purposes (e.g., treatment) over time.
26 | P a g e

• Determine where/in what to invest for highest health return
Determining how to invest the potential revenue should be carefully planned and executed with clear timelines, milestones, involvement of the relevant stakeholders and information campaigns to the public as to what will be undertaken by the earmarked surcharge. A balance will have to be struck between investing in health system-based best buys for alcohol and substance use disorders (e.g., brief interventions in primary health care, increasing treatment options for alcohol and substance use disorders), with a more horizontal approach that supports universal health care or strengthens health systems, with a particular emphasis on alcohol and substance use disorders. Different tools can help in the decision-making process such as the WHO CHOICE model and OneHealth tool
o OneHealth tool – CHOICE model o New tools could be developed particularly to ascertain the levels of tax - calculator
of % increase, health benefit and revenue generated using closest estimates for externalities
• Ensure planning of interventions/deployment matches introduction of new financing
mechanism Failure and lack of sustainability of new financing mechanisms has been linked at times with a lack of a clear relation between revenue generated and what it has been used for, leading to lack of trust by the public, and loss of support. For example, underlined by the benefit principle, public support is known to grow when newly introduced taxes are announced as being clearly earmarked for a specific related area, like taxes on alcoholic beverages will be used to reduce alcohol harm and address alcohol treatment. But accountability is key in the public demand, and thus it is essential to plan intervention deployment and mass communication campaigns to match the introduction of the tax collection. The realistic planning needs to take into account health system capacity. Scaling up services by a factor of 50% or even by 10% over the next 5–10 years may require substantial investments in the medicines supply chain, in health worker availability and deployment, and in the establishment of management and supervisory processes.
• Work with civil society to counteract industry lobbying efforts
Industry lobbying is known to be one of the most important roadblocks in developing, passing and implementing tax reforms, Box 15.
Box 15. Industry lobbying as an important influencing barrier in the spirits excise tax debate in Poland (Source Zatonski et al., 2016) In 2013, a15% increase on spirits excise tax was announced by the Polish government, representing the largest single tax rise on alcohol products in Poland in a decade. The announcement precipitated a heated public discussion over the merits and drawbacks of the policy, characterized by intensified alcohol industry lobbying and significant media coverage, with two main leading reasoning frames: health and economic. The spirits industry successfully promoted the economic frame, which dominated the debate by arguments about potential growth of the grey market, losses in tax revenue that might result from the excise tax increase, uncontrolled flow of spirits from across de border neighbouring countries where prices were lower, The lack of a strong public health voice in the excise tax debate in Poland remains in stark contrast with the active role taken by public health activists in similar debates in countries such as the UK, where a unified and well-co-ordinated public health lobby brought the MUP onto the agenda in face of strong industry opposition
27 | P a g e

The framing of the debate in Poland differed from the framing of the MUP debate in the United Kingdom. The Polish public health community was unsuccessful in making health considerations a significant element of the alcohol policy debate.
• Mobilize global support
“While some of the strategies for tax increases are a matter of domestic fiscal policy choice”, the above-mentioned watch-outs underline that there is also a need to mobilize support at global level. This will depend on the type of financing mechanisms that will be developed, but at all levels (dealing with pooled funding, taxation systems, regulatory frameworks), international cooperation will be necessary to garner more support and avoid potential loopholes. For example, as McIntyre and colleagues have stated, there is a need to address tax havens; deal with tax competition between countries such as repeatedly reducing corporate tax rates to attract and retain investment; reduce transfer pricing to multinational corporations; improve transparency around payments to developing country governments by extractive companies (McIntyre et al. 2014; McIntyre 2015). Current developments under the SDGs could provide an excellent framework to continue some of these broader discussions and garnering global support for going forward.
IV.2. SPECIFIC ‘WATCH-OUTS’ WHEN ADMINISTERING FISCAL MEASURES TO ALCOHOLIC BEVERAGES From all the measures, the different fiscal option that has had most support and success at country level, being more close to direct government intervention, generating both revenue and public health goods, and with ample country examples to draw from, is a surcharge tax on alcohol. The administration and evaluation of the introduction of a new tax is as important as the measure itself and requires careful planning and support. Although there is no magic recipe for an optimal implementation, a series of recommendations and watch-outs can be derived from case studies included in this paper and evidence in the field. Without aiming to be exhaustive, this section provides a compilation, of some important technical factors to have in mind before and during the introduction of a surcharge tax. • Improve tax compliance and put in place more efficient and resourced collecting systems
Apart from requiring a change in budget priorities, the shift to more domestic funding for health, where this occurs, has to be supported by strengthened revenue collection efforts. As McIntyre & Kutzin (2016) describes, in South Africa, revenue increased through improving the management capacity of the revenue authority, changing the organizational culture to one of delivering a service and of zero tolerance for corruption, offering periods of amnesty for tax evaders to encourage compliance, and taking legal steps against those who remained non-compliant. In general, GDP growth of 5% in real terms over the past fifteen years has not been matched by comparable increases in state revenues, with an average tax-to-GDP ratio remaining relatively low at 17.9% in 2014. Apart from macro-economic enablers, policy measures such as strengthening tax compliance and administration, reforming tax structures and broadening bases of certain taxes that would enhance progressivity, can all help to mobilize increased tax revenues, and ultimately to finance the sector at constant budget share.
• Ensure re-evaluating tax levels to keep up with inflation
28 | P a g e

In the Texas case study, if Texas had simply indexed its current alcohol excise tax to keep up with inflation, the revenue generated in 2013 would have been $472 million, instead of $208 million. From beer alcohol excise taxes alone, the excise tax collected would have been $236 million, instead of $104 million (Figure 5).
Figure 5. Beer excise taxes for a 6 pack in Texas 1984-2014
• Have measures in place that deal with deterrents of tax impact
OECD studies show that the beneficial effects of tax increases can be diminished by illegal production, tax evasion and illegal trading in some jurisdictions (OECD 2015). Reducing this unrecorded consumption via concerted tax enforcement strategies by law enforcement and excise officers has been estimated to cost more than a tax increase, and to produce similar levels of effect (Anderson et al., 2009). To be effective, tax increases must accommodate changes in the affordability of alcohol compared with other goods. Targeted taxes on specific types of alcohol are less supported by existing evidence. Setting a floor price for alcoholic beverages was also found to be an effective and cost-effective policy option in reducing alcohol-related harm, capable of preventing heavy drinking, both regular and episodic (Stockwell et al., 2012; Meier et al. 2016).
• Be aware of over-shifting and under-shifting pass-through tax to consumers to ensure the win-
win public health outcomes of tax increases in heavy drinkers See Box 16
Box 16. Overcoming retailers’ strategies of under-shifting and over-shifting to influence pass-through tax to consumers (Source: Ally et al., 2014) A study to find the evidence of UK excise duty and sales tax (VAT) pass-through rates for alcohol products at different price points found that within all four categories of products (beer, wine, spirits and cider/ready to drink) there exists considerable heterogeneity in the level of duty pass-through for cheaper versus expensive products. Price increases for the cheapest 15% of products fall below duty rises (under-shifting), while products sold above the median price are over-shifted (price increases are higher than duty increases). The level of under-shifting is greatest for beer [0.85 (0.79,
29 | P a g e

0.92)] and spirits [0.86 (0.83, 0.89)]. Under-shifting affects approximately 67% of total beer sales and 38% of total spirits sales. The study concludes that alcohol retailers in the United Kingdom appear to respond to increases in alcohol tax by under-shifting their cheaper products (raising prices below the level of the tax increase) and over-shifting their more expensive products (raising prices beyond the level of the tax increase). This is likely to impact negatively on tax policy effectiveness, because high-risk groups favour cheaper alcohol and under-shifting is likely to produce smaller consumption reductions. In order to off-set the under-shifting of cheaper products a duty rise could be implemented in conjunction with other interventions, such as minimum unit pricing. This may maximize public health benefits by ensuring greater effects on the alcohol disproportionately purchased by high-risk drinkers.
• Use taxation as a revenue generation strategy to achieve public health interventions
In countries where there is little action on alcohol, the arguments made in this paper can be used in reverse, i.e., proposing an earmarked surcharge in order to implement public health interventions to reduce alcohol harms.
• Ensure effective tax administration in place Tax administration should be effective and efficient. The effectiveness of tax administration means ensuring high compliance of taxpayers, while the efficiency of tax administration means lowering administrative costs relative to revenue collected. Effective and efficient tax administration requires a strong technical capacity by the administrative agency and a well-designed tax system. A well-designed excise tax policy exhibits transparency and easy definability, thus increasing efficiency by reducing administrative costs. Effective administration of excise taxation requires a well-established cooperation between taxpayers and the tax administration agency. In countries with well-established tax collection systems, excise taxes are administered by relying on the taxpayer’s registration, filing and payment of tax returns. Tax authorities, in return, execute enforcement actions aiming to ensure compliance by verification. Generally, in countries with poor administration systems, “enforced compliance” is executed by imposing physical control over the production and manufacturing process and applying various kinds of tax stamps.
• Put measures in place to deal with unrecorded alcohol consumption and illicit production Unrecorded alcohol consumption constitutes a sizable portion of overall alcohol and should, therefore, be reduced or controlled as part of a national alcohol policy that integrates different measures including taxation. The Global Strategy to Reduce the Harmful use of Alcohol (WHO, 2010) lists the following options to reduce the public health impact of illicit alcohol and informally produced alcohol: a) good quality control with regard to production and distribution of alcoholic beverages; b) regulating sales of informally produced alcohol and bringing it into the taxation system; c) an efficient control and enforcement system, including tax stamps; d) developing or strengthening tracking and tracing systems for illicit alcohol; e) ensuring necessary cooperation and exchange of relevant information on combating illicit
alcohol among authorities at national and international levels; and f) issuing relevant public warnings about contaminants and other health threats from informal
or illicit alcohol.
30 | P a g e
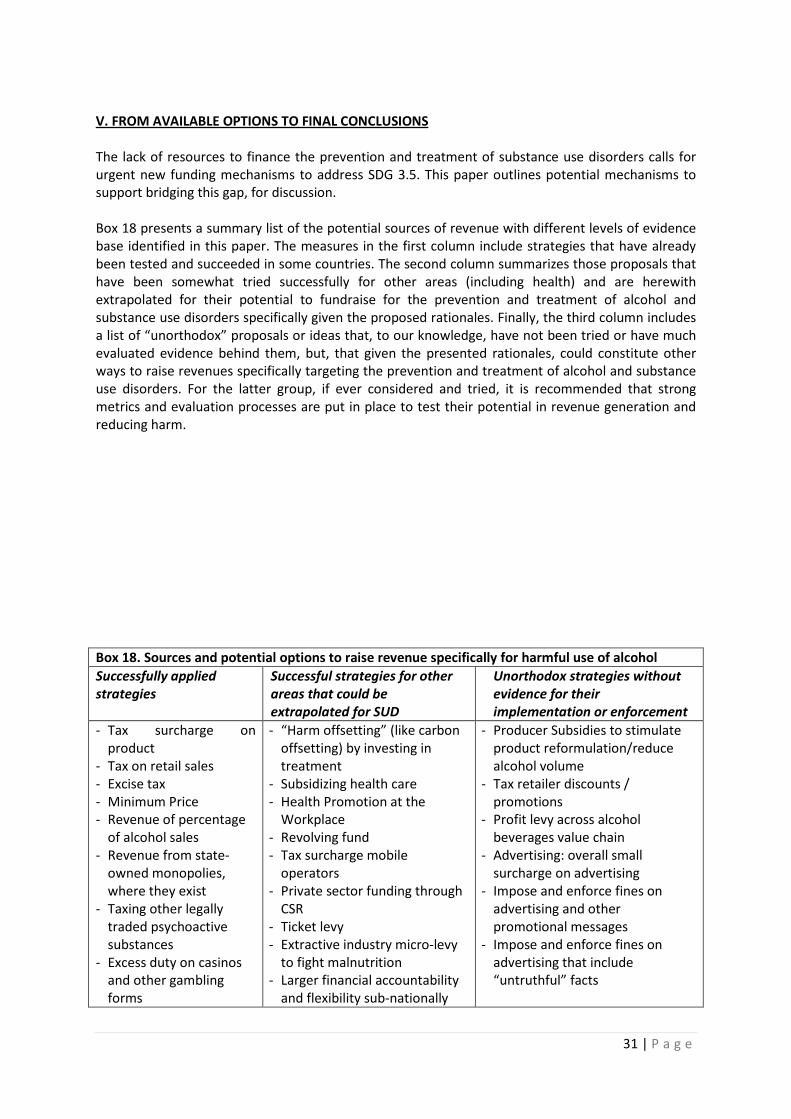
V. FROM AVAILABLE OPTIONS TO FINAL CONCLUSIONS The lack of resources to finance the prevention and treatment of substance use disorders calls for urgent new funding mechanisms to address SDG 3.5. This paper outlines potential mechanisms to support bridging this gap, for discussion. Box 18 presents a summary list of the potential sources of revenue with different levels of evidence base identified in this paper. The measures in the first column include strategies that have already been tested and succeeded in some countries. The second column summarizes those proposals that have been somewhat tried successfully for other areas (including health) and are herewith extrapolated for their potential to fundraise for the prevention and treatment of alcohol and substance use disorders specifically given the proposed rationales. Finally, the third column includes a list of “unorthodox” proposals or ideas that, to our knowledge, have not been tried or have much evaluated evidence behind them, but, that given the presented rationales, could constitute other ways to raise revenues specifically targeting the prevention and treatment of alcohol and substance use disorders. For the latter group, if ever considered and tried, it is recommended that strong metrics and evaluation processes are put in place to test their potential in revenue generation and reducing harm. Box 18. Sources and potential options to raise revenue specifically for harmful use of alcohol Successfully applied strategies
Successful strategies for other areas that could be extrapolated for SUD
Unorthodox strategies without evidence for their implementation or enforcement
- Tax surcharge on product
- Tax on retail sales - Excise tax - Minimum Price - Revenue of percentage
of alcohol sales - Revenue from state-
owned monopolies, where they exist
- Taxing other legally traded psychoactive substances
- Excess duty on casinos and other gambling forms
- “Harm offsetting” (like carbon offsetting) by investing in treatment
- Subsidizing health care - Health Promotion at the
Workplace - Revolving fund - Tax surcharge mobile
operators - Private sector funding through
CSR - Ticket levy - Extractive industry micro-levy
to fight malnutrition - Larger financial accountability
and flexibility sub-nationally
- Producer Subsidies to stimulate product reformulation/reduce alcohol volume
- Tax retailer discounts / promotions
- Profit levy across alcohol beverages value chain
- Advertising: overall small surcharge on advertising
- Impose and enforce fines on advertising and other promotional messages
- Impose and enforce fines on advertising that include “untruthful” facts
31 | P a g e

Building on the above, this final section provides a series of general conclusions for the strongest options to generate revenues at country levels to address the prevention and treatment of alcohol and drug use disorders. CONCLUSION 1. Tax surcharges are the most feasible and win-win measures to reduce the treatment gap and to reach the SDG 2030 3.5 health target An earmarked tax surcharge, meaning an additional tax on existing price and tax structures, is the most feasible and win-win measure to reduce the treatment gap and to reach the SDG 2030 3.5 health target. Increasing taxes on products that can be harmful to health so they can be earmarked for public health purposes, has shown to make the introduction of such surcharges more politically acceptable and to provide the needed revenue to finance the prevention and treatment of alcohol and substance use disorders. An obvious product for such a surcharge is alcohol, given the high prevalence of alcohol use disorders and the harmful use of alcohol, in general the existing rather low levels of taxation on alcoholic products, and the extent of conditions that are 100% attributable to alcohol, for which provision of treatment is an obligation by health services. CONCLUSION 2. Many existing measures for other areas could be applied for substance use disorders Column 2 of Box 18 lists a number of successful measures that have raised revenues for other health conditions. With proper argumentation on the harm, externalities and potential savings, these measures could be expanded or adopted to raise funds for the prevention and treatment of alcohol and substance use disorders. There are some measures, like CSR or workplace health, that with SDG17 and the call for multi-stakeholder approaches could provide new avenues for collaboration and resource mobilization or structural investments in some countries. CONCLUSION 3. Urgent need for evaluation of the new set of innovative mechanisms As indicated in column 3 of Box 18, there are potential areas to develop truly innovative mechanisms to raise extra funds for the prevention and treatment of alcohol and substance use disorders. These are based on evidence provided from similar fields or extrapolations. If any are to be developed it would be essential that they are done with proper process and outcome evaluations to understand how and why they might work. FINAL REMARKS: Why new funding mechanisms for the prevention and treatment of substance use disorders? There are growing concerns as to how SDGs in general will be financed. As a final word, first and overall, it would be good to consider the scale of financing needs in a broader perspective, in comparison with the overall size of the world economy, world wealth, and world savings. As Elder and colleagues note (2016): “a rough estimate of the additional investments necessary for SDGs, beyond those already planned, amounts to about 2 or 3 trillion USD, which seems like a large amount of money. However, world GDP in 2014 was 78 trillion USD, while global financial assets totalled 273 trillion USD. The world’s annual savings was 17 trillion USD, and 46% of this was from developing countries. The world’s taxes amounted to over 22 trillion USD, or 28.4% of global GDP. These kinds of comparisons usually mention military spending, which amounted to 1.8 trillion USD in
32 | P a g e
2014, about 2.3% of world GDP. Therefore, the cost of SDGs would be about 2.5%–3.8% of world GDP, and 0.7%–1.1% of global financial assets. Is this a lot of money, considering what the SDGs seek to achieve in terms of enhanced and lasting human wellbeing?” Yet, while decisions as to whether this is, or not, a resource the world could invest in, in our own domain, pressing health matters and preventable morbidity and early mortality call for immediate action. Whilst there are a range of intoxicating and dependence-producing substances and services that are legally traded, they come at the expense of an extensive range of problems to the health and well-being of individuals, families and societies. Governments at all levels have an obligation to protect the health of populations, and they have an obligation to provide treatment for those with disorders that are 100% attributable to exposure. This paper provides the rationale of why it is essential to support the revenue generation to address health-related sustainable development goals, and, in particular, the prevention and treatment of alcohol and substance use disorders. A set of potential mechanisms is put forward in the paper for consideration and deliberation between Member States, to further provide other case studies, options and innovations that could prove helpful in mobilizing resources. It seems to be down to national and local governments, civil society, research bodies and all other relevant stakeholders to build alliances, identify the best mechanisms and mobilize resources to address this pressing issue.
33 | P a g e
VII. REFERENCE LIST
Adulyanon S. Funding health promotion and diseases prevention programmes: An innovative financing experience from Thailand. WHO South-East Journal of Public Health. 2012; 1(2):201-207
Allen L, Williams J, Townsend N. et al. Socioeconomic status and non-communicable disease behavioural risk factors in low-income and lower-middle-income countries: a systematic review. Lancet Global Health 2017 5:e277-89.
Ally A., Meng Y., Chakraborty R., Dobson P., Seaton J., Holmes J., Angus C., Guo Y., Hill-McManus D., Brennan A., Meier P. Alcohol tax pass-through across the product and price range: do retailers treat cheap alcohol differently?2014. Addiction, 109, 1994–2002
American Psychiatric Association (2013). Diagnostic and Statistical Manual of Mental Disorders. Washington, DC, American Psychiatric Association.
Anderson P, Chisholm, D., Fuhr, D.C. (2009) Effectiveness and cost-effectiveness of policies and programmes to reduce the harm caused by alcohol. Lancet. 373 2234-2246.
Anesi V. earmarked taxation and political competition. Journal of Public Economics, 2006, Volume 90, Issues 4–5, May 2006, Pages 679–701
Babor T., Caetano R., Casswell S., Edwards G., Giesbrecht N., Graham K. et al. Alcohol: No Ordinary Commodity—Research and Public Policy. Oxford, UK: Oxford University Press; 2010.
Baicker, K., Cutler, D., & Song, Z. (2010). Workplace Wellness Programs Can Generate Savings. Health Affairs , no.2 (2010):304-311.
Bird R. Tobacco and Alcohol Excise Taxes for Improving Public Health and Revenue outcomes. Marrying Sin and Virtue? World Bank Group. Governance Global Practice Group & Health Nutrition and Population Global Practice Group. November 2015
Bloom, D., L. R. Bloom, D. Steven, and M. Weston. 2004. "Business and HIV/AIDS: Who Me? A Global Review of the Business Response to HIV/AIDS." Harvard School of Public Health, Joint United Nations Programme on HIV/AIDS, World Economic Forum: Geneva.
Bosch A & Koch SF. ERSA working paper 434Using a Natural Experiment to Examine Tobacco Tax Regressivity. https://econrsa.org/system/files/publications/working_papers/working_paper_434.pdf
Chaloupka FJ, Yurekli A, Fong GT. Tobacco taxes as tobacco control strategy. Tobacco control 2012; 21:172-180.
Charlson FJ, Baxter AJ, Dua T, Degenhardt L, Whiteford HA & Vos T. Excess mortality from mental, neurological, and substance use disorders in the Global Burden of Disease Study 2010 , In Patel, V., D. Chisholm., T. Dua, R. Laxminarayan, and M. E. Medina-Mora, editors. 2015. Mental, Neurological, and Substance Use Disorders. Disease Control Priorities, third edition, volume 4. Washington, DC: World Bank. doi:10.1596/978-1-4648-0426-7.
Community Preventive Services Task Force. The Community Guide-Summary-Excessive Alcohol Consumption: Increasing Alcohol Taxes. at http://www.thecommunityguide.org/alcohol/ increasingtaxes.html
Connor J & Casswell S. Alcohol-related harm to others in New Zealand: evidnce of the burden and gaps in knowledge. The New Zealand Medical Journal 2012 125 11-27.
Cooper, C.L. and Dewe, P. (2008). Well-being – absenteeism, presenteeism, cost and challenges. Occupational Medicine, 58(8):5223-524.
Diaz M, Chaloupka F, Jerigan D. 2015. Effects of alcohol excise tax increases on public health and safety in Texas. Texans Standing Tall.
34 | P a g e

Dieleman JL, Graves C, Johnson E, Templin T, Birger M, Hamavid H, Freeman M, Leach-Kemon K, Singh L, Haakenstad A, Murray CJ. Sources and Focus of Health Development Assistance, 1990-2014. JAMA. 2015 Jun 16;313(23):2359-68. doi: 10.1001/jama.2015.5825.
Economist. “Face Value: AIDS and Business.” Economist 2004 373 (8404): 68
Ekström KM & Hannson L. Establishing a healthy drinking culture. Systembolaget - alcohol monopoly and public health in Sweden. In Eds. Cheng H, Kotler P, Lee N. Social Marketing for Public Health: Global Trends and Success Stories. Sudbury, Massachusetts: Jones & Bartlett Publishers, 2011.
Elder M, Bengtsson M., Akenji L. An Optimistic Analysis of the Means of Implementation for Sustainable Development Goals: Thinking about Goals as Means. Sustainability. 2016, 8(9), 962; doi:10.3390/su8090962; http://www.mdpi.com/2071-1050/8/9/962/htm
Gavigan S, Jung S, Lee S, Schwarz T. (2015). ASEF Outlook Report 2014-2015. Volume II: perspectives on sustainable development. Singapore
GBD 2015 Risk Factors Collaborators (2016). Global, regional and national comparative risk assessment of 79 behavioural, environmental and occupational, and metabolic risks or clusters of risks, 1990-2015: a systematic analysis for the Global Burden of Disease Study 2015. Lancet 2016 388 1659-724.
Golden SD, Holt Smith M., Feighery E., Roeseler A., Rogers T., Ribisl K. Tobacco Control 2016;25:377–385. doi:10.1136/tobaccocontrol-2015-052294
Gupta I & Chowdhury S. Finances for Health in India: Are New Sources the Way to Go? 2015 IEG Working Paper No. 356 http://www.iegindia.org/upload/publication/Workpap/wp356.pdf.
Inaugural Report 2016 Inter-agency Task Force on Financing for Development http://www.un.org/esa/ffd/wp-content/uploads/2016/03/Report_IATF-2016-full.pdf
Johnston R, Stafford J, Pierce H, Daube M. Alcohol promotions in Australian supermarket catalogues. Drug Alcohol Rev. 2016 Sep 28. doi: 10.1111/dar.12478.
Kaiser, Kai-Alexander; Bredenkamp, Caryn; Iglesias, Roberto Magno. 2016. Sin tax reform in the Philippines : transforming public finance, health, and governance for more inclusive development. Directions in development. Washington, D.C. : World Bank Group. http://documents.worldbank.org/curated/en/638391468480878595/Sin-tax-reform-in-the-Philippines-transforming-public-finance-health-and-governance-for-more-inclusive-development
Kilmer B. (2016). Legalizing cannabis, government revenue and public budgets. Testimony presented before the Vermont Senate Committee on Finance on January 19, 2016. Rand Office of External Affairs.
Kohn R et al. The treatment gap in mental health care. Bulletin of the World Health Organization, 2004;82:858-866.
Kontis V, Mathers, CD, Rehm J, Stevens G A, Shield K D, Bonita R, et al. Contribution of six risk factors to achieving the “25×25” NCD mortality reduction target. Lancet 2014 http://dx.doi.org/10.1016/ S0140-6736(14)60616-4.
Lachenmeier D., Taylor B, Rehm J. Alcohol under the radar: Do we have policy options regarding unrecorded alcohol? International Journal of Drug Policy, Volume 22, Issue 2, March 2011, Pages 153–160
Lai HMX, Cleary M, Sitharthan T, Hunt GE. Prevalence of comorbid substance use, anxiety and mood disorders in epidemiological surveys, 1990-2014: a systematic review and meta-analysis. Drug and Alcohol Dependence 2015 154: 1-13.
35 | P a g e
https://www.ncbi.nlm.nih.gov/pubmed/?term=Johnston%20R%5BAuthor%5D&cauthor=true&cauthor_uid=27678489

May PA, Marais AS, de Vries MM, Kalberg WO, Buckley D, Hasken JM, Adnams CM, Barnard R, Joubert B, Cloete M, Tabachnick B, Robinson LK, Manning MA, Jones KL, Bezuidenhout H, Seedat S, Parry CD, Hoyme HE. The continuum of fetal alcohol spectrum disorders in a community in South Africa: Prevalence and characteristics in a fifth sample. Drug Alcohol Depend. 2016 Nov 1;168:274-286. doi: 10.1016/j.drugalcdep.2016.09.025. Epub 2016 Oct 6.
McIntyre D & Kutzin J. Health financing country diagnostic: a foundation for national strategy development. (Health Financing Guidance No. 1). WHO/HIS/HGF/HFGuidance/16.1. Geneva, World Health Organization 2016
McIntyre D, Meheus F. Fiscal space for domestic funding of health and other social services. Working Group on Financing, Paper 5. London: Chatham House, 2014. (https://www.chathamhouse.org/publications/papers/view/198263)
McIntyre D. WHO global coordinating mechanism on the prevention and control of noncommunicable diseases. Working group on how to realize governments’ commitment to provide financing for NCDs. Geneva: World Health Organization, 2015.
Meier P., Holmes J., Angus C., Ally A., Meng Y., Brennan A. (2016). Estimated effects of different alcohol taxation and prive policies on health inequalities: a mathematical modelling study. PloS Med 13 (2): e1001963
Mohapatra S1, Patra J, Popova S, Duhig A, Rehm JSocial cost of heavy drinking and alcohol dependence in high-income countries. Int J Public Health. 2010 Jun;55(3):149-57. doi: 10.1007/s00038-009-0108-9. Epub 2009 Dec 19.
Naimi T, Daley J, Zuan Z, Blanchette J, Chaloupka F, Jerigan D. Who would pay for state alcohol tax increases in the United States? Prev Chronic Dis 2016, 13: 150450
Nugent R & Knaul F. (2006). Chapter 11. Fiscal policies for health promotion and disease prevention. In: Disease control priorities in developing countries (2nd Edition). The International Bank for Reconstruction and Development / The World Bank, Washington (DC); Oxford University Press, New York
Odlaug BL, Gual A, DeCourcy J et al. Alcohol dependence, co-occurring conditions and attributable burden. Alcohol and Alcoholism 2016 51: 201-209.
OECD (2011), Sick on the Job? Myths and Realities about Mental Health and Work, Mental Health and Work, OECD Publishing. http://dx.doi.org/10.1787/9789264124523-en.
OECD (2015), Tackling Harmful Alcohol Use: Economics and Public Health Policy, OECD Publishing.
Okulicz-Kozaryn K, Zin-Sędek M, Łukowska K, Brzózka K (State Agency for Prevention of Alcohol-Related Problems). Solutions to alcohol consumption related problems at the municipal level. “The search of effective control of alcohol consumption and prevention tools in modern society”, Vilnius, 2016. https://ntakd.lrv.lt/uploads/ntakd/documents/files/Naujienos/Renginiai/2016/5.pdf. Accessed 7 June 2016.
Ordunez P, Luciani S, Barojas A, Fitzgerald J, Hennis A. A public health approach to hypertension. The Lancet, Volume 385, No. 9980, p1833–1834, 9 May 2015
Oregon Constitution. Section 4f of Article XV of the Oregon Constitution. 2016
Parsonage, M. (2007). The impact of mental health on business and industry – An economic analysis. Sainsbury Centre for Mental Health.
Policy Cures. Innovative financing mechanisms for South East Asia Policy Brief 2: Global or Regional Taxes http://www.policycures.org/downloads/Policy%20Brief%202%20-%20Global%20or%20Regional%20Taxes.pdf
36 | P a g e
https://www.ncbi.nlm.nih.gov/pubmed/?term=Kalberg%20WO%5BAuthor%5D&cauthor=true&cauthor_uid=27736681

Public Health England. The Public Health Burden of Alcohol and the Effectiveness and Cost-Effectiveness of Alcohol Control Policies An evidence review, 2016. https://www.gov.uk/government/uploads/system/uploads/attachment_data/file/583047/alcohol_public_health_burden_evidence_review.pdf
Rabinovich L, Hunt P., Staetsky L., Goshev S., Nolte E., Pedersen J., Tiefensee C. Further Study on the Affordability of Alcoholic Beverages in the EU. A Focus on Excise Duty Pass-Through, On- and Off-Trade Sales, Price Promotions and Statutory Regulations. Rand Health Q. 2012 Summer; 2(2): 17. https://www.ncbi.nlm.nih.gov/pmc/articles/PMC4945281/?report=printable
Rehm J, Gmel GE, Gmel G et al. The relationship between different dimensions of alcohol use and the burden of disease - an update. Addiction 2017 doi:10.1111/add.13757.
Rehm J, Mathers C, Popova S, Thavorncharoensap M, Teerawattananon Y, Patra J (2009). "Global burden of disease and injury and economic cost attributable to alcohol use and alcohol-use disorders." Lancet 373(9682): 2223-2233.
Rehm, J., Shield, K. D., Gmel, G., Rehm, M. X., & Frick, U. (2013). Modeling the impact of alcohol dependence on mortality burden and the effect of available treatment interventions in the European Union. European Neuropsychopharmacology, 23(2), 89–97.
Room R, Bloomfield K, Grittner U et al. What happened to alcohol consumption and problems in the Nordic countries when alcohol taxes were decreased and borders opened? International Journal of Alcohol and Drug Research 2013, 2, 77 – 87
Room R. The evolution of alcohol monopolies and their relevance for public health. Contemporary Drug Problems 1993 20:169-187.
Rossow I., Bang Hansen M. Gambling and gambling policy in Norway—an exceptional case. Addiction 2016. Volume 111, Issue 4 April 2016 Pages 593–598
Sacks JJ, Roeber J, Bouchery EE, Gonzales K, Chaloupka FJ, Brewer RD. State costs of excessive alcohol consumption, 2006. American Journal of Preventive Medicine 2013; 45 (4): 474-85
Sacks, Gonzales, Bouchery, Tomedi, Brewer. 2010 National and state costs of excessive alcohol consumption. American Journal of Preventive Medicine 2015; 49 (5): e73-9
Schmidt-Traub G., Sachs J. (2015). Financing Sustainable Development: Implementing the SDGs through Effective Investment Strategies and Partnerships. Working paper. Sustainable Development Solutions Network. http://www.equityforchildren.org/wp-content/uploads/2015/04/150408-SDSN-Financing-Sustainable-Development-Paper.pdf
Shome P. Tax Policy Handbook. 1995. Washington: International Monetary Fund.
Smith J. Gambling Taxation: Public Equity in the Gambling Business. 2000. The Australian Economic Review, vol. 33, no. 2, pp. 120–44
Stenberg K, Chisholm D. 2012. Resource Needs for Addressing Noncommunicable Disease in Low- and Middle-Income Countries. Current and Future Developments. Global Heart. VOL . 7 , NO. 1 , 2012. ª World Health Organization
Stenberg k, Elovainio R, Chisholm D, Fuhr D, Perucic AM, Rekve D, Yurekli A. Responding to the challenges of resource mobilization – mechanisms for raising additional domestic resources for health. World Health Report 2010. Background paper 13. Geneva: World Health Organization, 2010.
Stockwell T, Zhao J, Giesbrecht N, Macdonald S, Thomas G, Wettlaufer A. The Raising of Minimum Alcohol Prices in Saskatchewan, Canada: Impacts on Consumption and Implications for Public Health. Am J Public Health. 2012 Oct 18;102(12):e103–e110.
37 | P a g e
Stockwell T, Zhao J, Martin G, Macdonald S, Vallance K, Treno A, et al. Minimum alcohol prices and outlet densities in British Columbia, Canada: estimated impacts on alcohol-attributable hospital admissions. Am J Public Health. 2013 Nov;103(11):2014–20.
Task force on Community Preventive Services. Increasing Alcoholic Beverage Taxes Is Recommended to Reduce Excessive Alcohol Consumption and Related Harms. American Journal of Preventive Medicine. Volume 38, Issue 2, February 2010, Pages 230–232
Thow A.M., Quested C., Juventin L, kun R., Khan N., & Swinburn B. (2010). Taxing soft drinks in the Pacific: implementation lessons for improving health. Health Promotion International, Vol. 26, No 1: 55-64
U.S. Department of Health and Human Services (HHS), Office of the Surgeon General, Facing Addiction in America: The Surgeon General’s Report on Alcohol, Drugs, and Health. Washington, DC: HHS, November 2016.
United Nations Office on Drugs and Crime, World Drug Report 2016 (United Nations publication, Sales No. E.16.XI.7).
United Nations. Addis Ababa Action Agenda Monitoring commitments and actions
Wardel J. Price-based promotions of alcohol: legislative consistencies and inconsistencies across the Australian retail, entertainment and media sectors. Int J Drug Policy. 2015 May;26(5):522-30. doi: 10.1016/j.drugpo.2015.01.013. Epub 2015 Jan 17.
Whiteford HA, Ferrari AJ, Degenhardt L, Feigin V, Vos T (2015) The Global Burden of Mental, neurological and Substance Use Disorders: An Analysis from the Global Burden of Disease Study 2010. PLoS ONE 10(2): e0116820. doi:10.1371/journal.pone.0116820
Wilson DP, Donald B, Shattock AJ, Wilson D, Fraser-Hurt N. The cost-effectiveness of harm reduction. International Journal of Drug Policy 26 (2015) S5–S11
Wolrd Health Organization 2016b. Public financing for in Africa: from Abuja to the SDGs. Geneva: World Health Organization.
World Health Organization Global action plan for the prevention and control of noncommunicable diseases 2013-2020. 2013. http://apps.who.int/iris/bitstream/10665/94384/1/9789241506236_eng.pdf
World Health Organization. (2014). Global Status Report on Alcohol and Health 2014. Geneva, Switzerland: WHO Press.
World Health Organization. Global strategy to reduce the harmful use of alcohol. Geneva, Switzerland: World Health Organization; 2010.
World Health Organization. Mhgap Mental Health Gap Action Programme. Scaling Up Care for Mental, Neurological, and Substance Use Disorders, 2008. http://www.who.int/mental_health/evidence/mhGAP/en/.
World Health Organization. Raising tax on tobacco: What you need to know. Geneva: WHO, 2014.
World Health Organization. Scaling up against non communicable diseases: how much will it cost? Geneva: WHO 2011.
World Health Organization. World Health Statistics: 2016. Monitoring Health for the Sustainable Development Goals. Geneva: WHO 2016a
Zatoński M., Hawkins B, McKee M. Framing the policy debate over spirits excise tax in Poland. Health Promotion International. 2016, 93, 1-10
38 | P a g e
Zhao J, Stockwell T, Martin G, Macdonald S, Vallance K, Treno A, et al. The relationship between minimum alcohol prices, outlet densities and alcohol-attributable deaths in British Columbia, 2002–09. Addiction. 2013;108(6):1059–69.
39 | P a g e