Fundamentals of Formation Evaluation
84
Fundamentals Of Formation Evaluation Elhadi Abusin Schlumberger Sudan
description
it presentation handling the formation evaluation using of well logs
Transcript of Fundamentals of Formation Evaluation

Fundamentals Of Formation Evaluation
Elhadi AbusinSchlumberger
Sudan

Outlines
Introduction
Reservoir Properties
Logging Measurement and Applications
Tools and Applications
OH Logging and Quick Look Analysis
Introduction
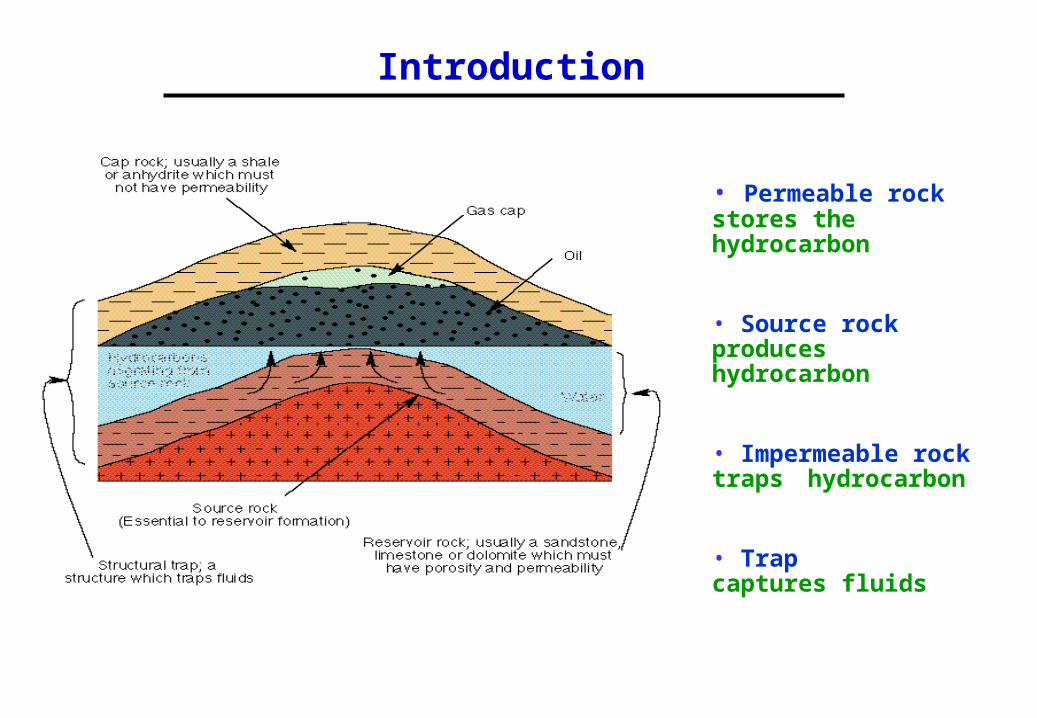
• Permeable rockstores the hydrocarbon
• Source rockproduces hydrocarbon
• Impermeable rocktraps hydrocarbon
• Trapcaptures fluids
Introduction
Measurement
Open Hole Logging
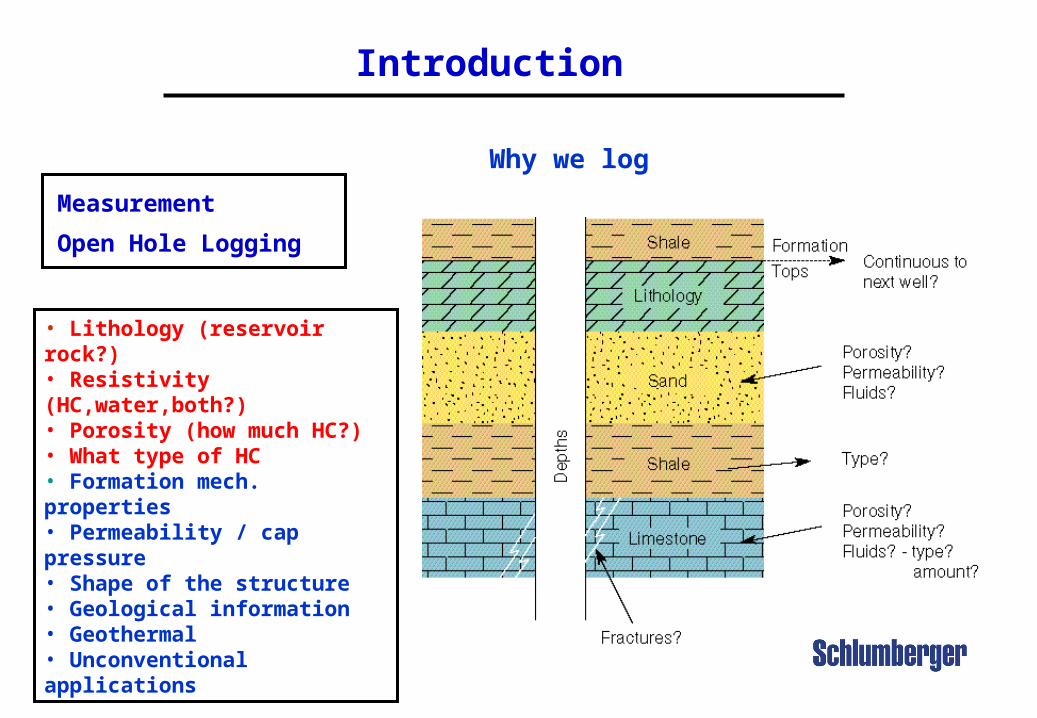
• Lithology (reservoir rock?)• Resistivity (HC,water,both?)• Porosity (how much HC?)• What type of HC• Formation mech. properties• Permeability / cap pressure• Shape of the structure• Geological information• Geothermal• Unconventional applications
Why we log

Introduction
The life of a well
Regional Studies – Gravity / Other Geophysical Studies. Identification of main sedimentary basins.
Regional Seismic – Large 2D surveys over sedimentary basins. Identification of main subsurface
structures that can allow HC presence.
Local 3D Seismic – Detailed seismic survey over a smaller area to provide a more detailed
description on a prominent structure. In this stage a well is located to be drilled.
Well Drilling – After previous studies a well is located. During drilling: mud logging/cores and Logging
While Drilling allows for geological and preliminary petrophysical info.
Well Logging – Detailed subsurface petrophysical/geophysical measurements are obtained in order
to better characterize the formation on interest and determine its hydrocarbon potential. At this
stage, intervals are selected to be put on production.
Well Completion – The well is completed. Casing and Cement are applied. Preliminary Cased Hole
Logging can be run. Perforation is performed in the selected intervals. Production string is set and the
well is put on production.
Well Production – During this phase, monitoring the well production is performed using cased hole
techniques and data obtained from other wells in the field.

Introduction
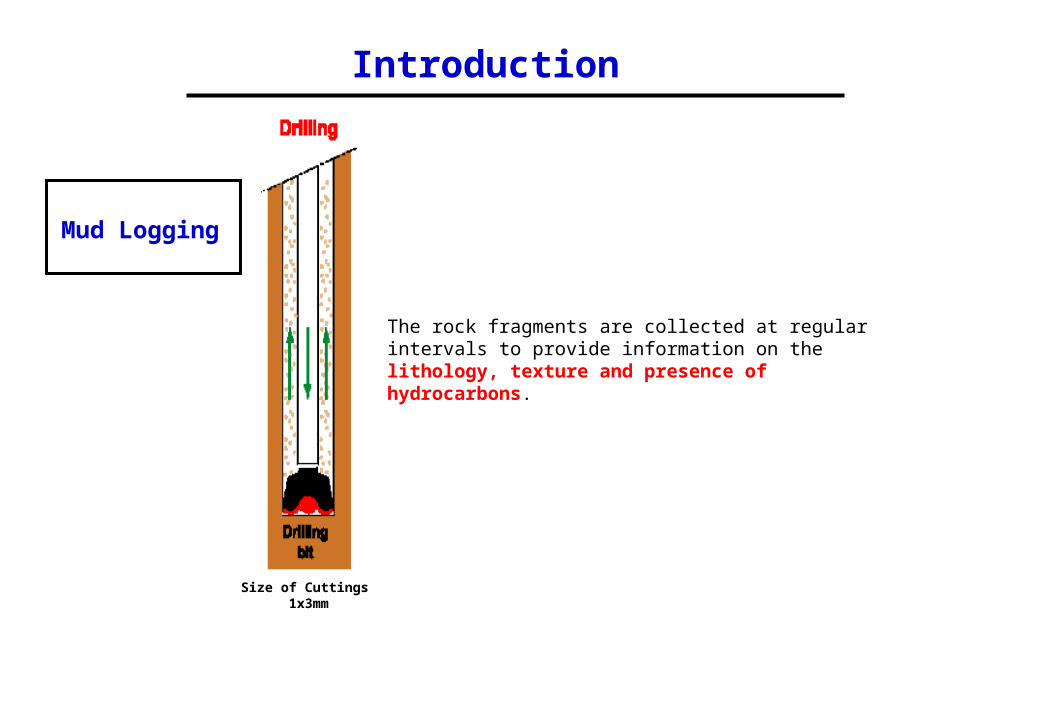
During the drilling operations, the fluid is continuously circulated down the inside of the drill pipe, through the bottom of the bit, and back.
Mud Logging
Introduction
Mud Logging
The rock fragments are collected at regular intervals to provide information on the lithology, texture and presence of hydrocarbons.
Size of Cuttings 1x3mm

Introduction
Mud Logging
Weight on Bit (WOB), Drill string rotation speed (RPM), Mud pump speed (SPM), Mud pump pressure (SPP), Drilling Rate or Rate of Penetration (ROP), Lithology and texture of cutting, Percentage of gas in air and/or gas composition, Hydrocarbon staining on the cuttings and information such as bit diameter (D) and Drill-string configuration.
Reservoir Properties
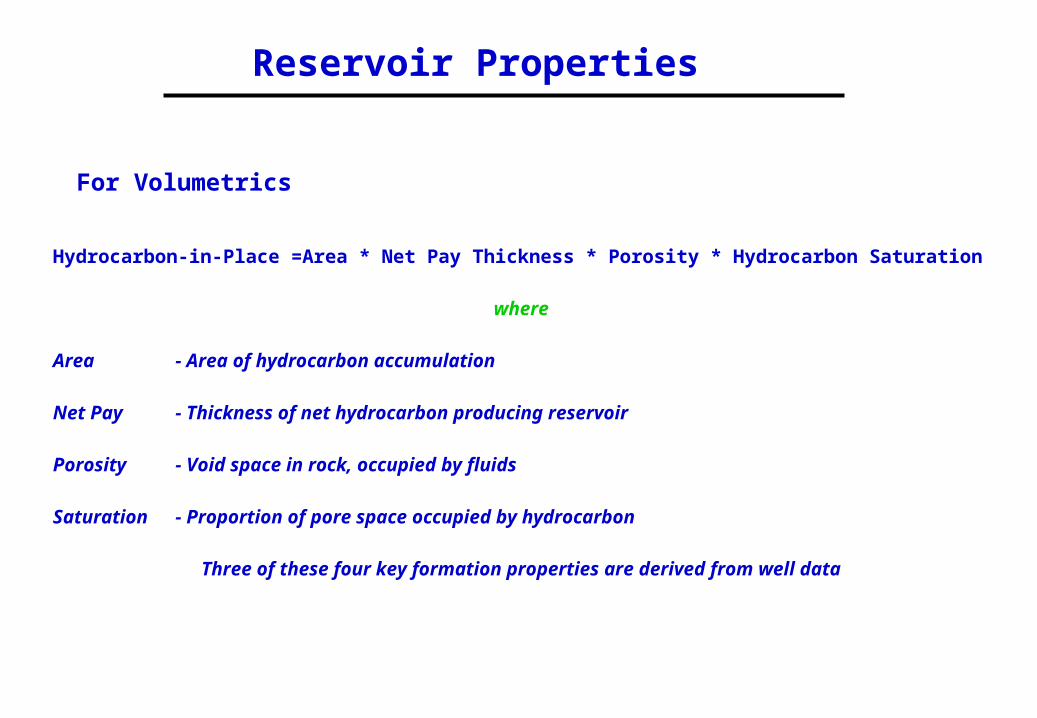
Hydrocarbon-in-Place =Area * Net Pay Thickness * Porosity * Hydrocarbon Saturation
where
Area - Area of hydrocarbon accumulation
Net Pay - Thickness of net hydrocarbon producing reservoir
Porosity - Void space in rock, occupied by fluids
Saturation - Proportion of pore space occupied by hydrocarbon
Three of these four key formation properties are derived from well data
For Volumetrics

Reservoir Properties
Thickness Terminology
∑Net Pay <= ∑ Net Reservoir <= Gross Reservoir
Claystone
Porous & Permeable Sst
Claystone
Claystone
Claystone
Porous & Permeable Sst
Porous & Permeable Sst
Wa
ter
Tight Cemented Sst / Lst
OWC
Net Pay
Net Pay
Net Pay
Net Pay
Net Reservoir
Net Reservoir
Net Reservoir
Net Reservoir
Non-Reservoir
Non-Reservoir
Gro
ss Re
servo
ir
Aquifer
Oil
Oil
Oil
Oil
Non-Reservoir
Reservoir Properties
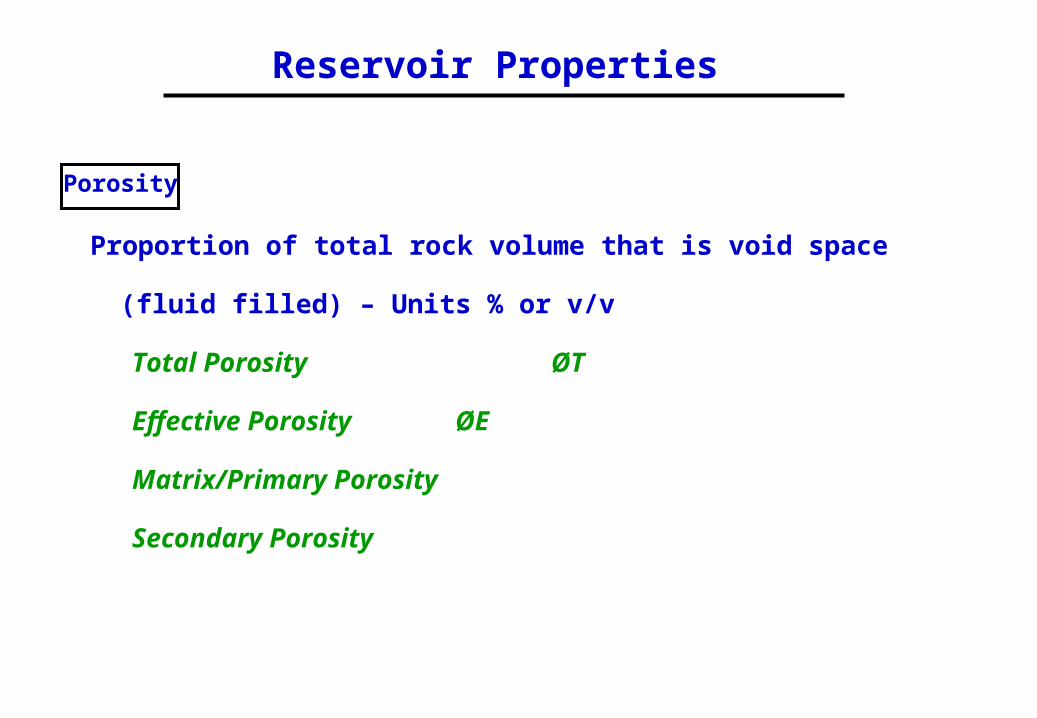
Proportion of total rock volume that is void space (fluid filled) – Units
% or v/v
Total Porosity ØT
Effective Porosity ØE
Matrix/Primary Porosity
Secondary Porosity
Porosity

Porosity
Reservoir Properties
Pore Space / Total Rock Volume
1 -
Rock Matrix
Porosity indicates how much fluid a rock can hold.
Most of all oil and gas produced today comes from the accumulations in the pore spaces of reservoir rocks.

Primary porosity refers to the porosity characteristics that have existed in a rock formation since it was first deposited.
Secondary porosity refers to porosity characteristics as they have been changed.
Porosity
Reservoir Properties
Primary Porosity Secondary Porosity
RockMatrix
Pores formed during originaldeposition
RockMatrix
Pores formed after originaldeposition
Porosity Types

Reservoir Properties
Matrix Pore System with predominantlyEffective Intergranular Porosity
Predominantly Non-effective Porositywith Effective Secondary fracture
Porosity

Reservoir Properties
Proportion of void space that is occupied by a specific fluid - Units
% or v/v
Total Fluid Saturation SwT
Effective Fluid SaturationSwE
Moveable Fluid Saturation Shmov
Residual Fluid SaturationShr
Irreducible Fluid Saturation Swirr
Saturation

Saturation
Reservoir Properties
SH = Hydrocarbon saturation (oil + gas)
SW = Water Saturation
SH + SW = 1
The saturation of the formation is the fraction of its pore volume occupied by a specified fluid. Water saturation is the fraction of the pore volume that contains formation water. If only water exists in the pores, the formation has a water saturation of 100%.
1 -
SH
SW
Rock Matrix
Reservoir Properties
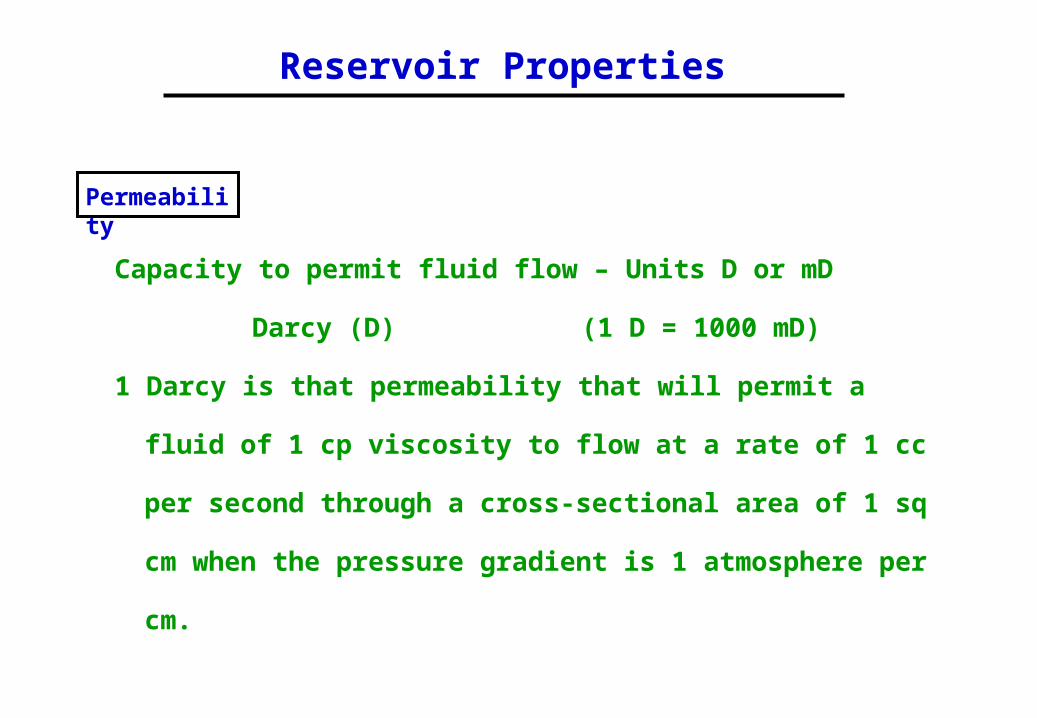
Capacity to permit fluid flow – Units D or mD
Darcy (D) (1 D = 1000 mD)
1 Darcy is that permeability that will permit a fluid of 1 cp
viscosity to flow at a rate of 1 cc per second through a cross-
sectional area of 1 sq cm when the pressure gradient is 1
atmosphere per cm.
Permeability

Permeability
Permeability is a measure of how easy a fluid flows through the connecting pore spaces. The unit of measurement is the millidarcy (mD).
Reservoir Properties
Rock Matrix Pore Space
FluidPath
Intermediate fluid flow path
Tortous fluid flow path
FluidPath
Easy fluid flow path
FluidPath
Fluid Flow in various formations with same porosity but different grain size, structure and packing

Logging Measurement and
Applications
A full range of measurements are acquired, either via Wireline or LWD, then interpreted to reveal the rock and fluid properties of the formation such as:
Applications of Open Hole Logging
• Lithology • Porosity• Permeability• Hydrocarbon Identification• Hydrocarbon Quantification• Reservoir Evaluation

Logging Measurement and
Applications
Applications of
Open Hole Logging

Logging Measurement and
Applications
Measurement
Open Hole Logging
Open hole logging provides the most important source of information for well evaluation. It can be performed:1) After the well has been drilled by lowering a set of sensors on an electrical cable (Wireline Logging); 2) While the well is being drilled by placing the sensors in the drill string (Logging While Drilling).
Wireline Logging Logging While Drilling

Logging Measurement and
Applications
Measurement
Open Hole Logging
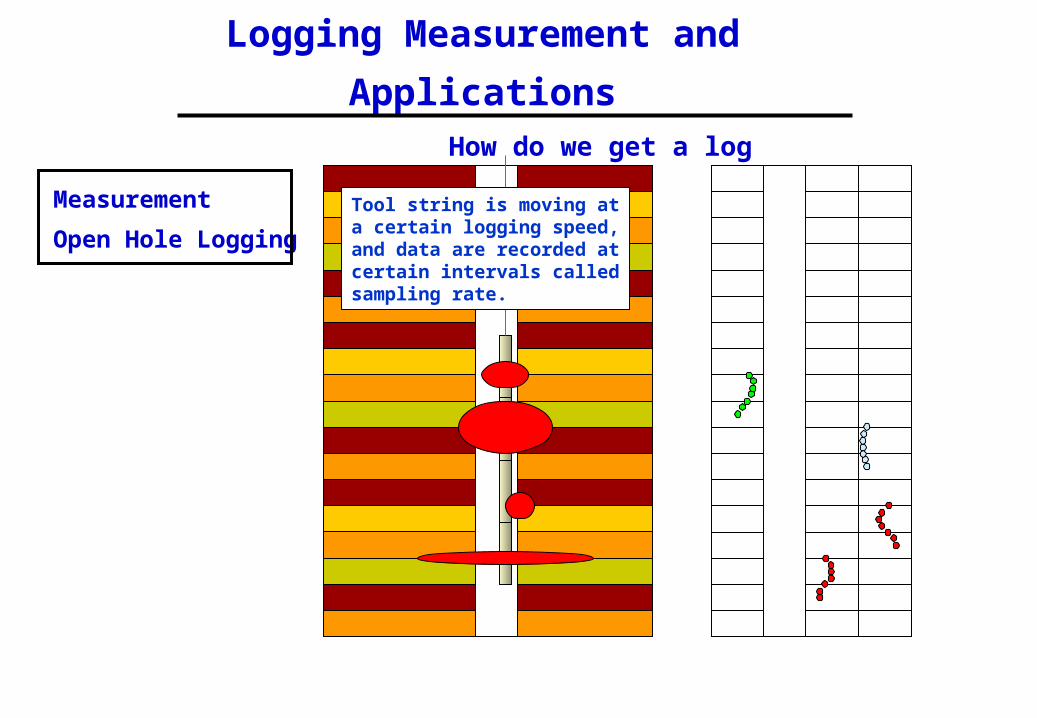
How do we get a log
A tool string containing 4 tools
Logging Measurement and
Applications
Measurement
Open Hole Logging
How do we get a log
Tool string is moving at a certain logging speed, and data are recorded at certain intervals called sampling rate.

Logging Measurement and
Applications
Measurement
Open Hole Logging
How do we get a log

Logging Measurement and
Applications
Measurement
Open Hole Logging
How do we get a log
And we get a group of wiggly lines called a “log”

Lithology
Some naturally occurring elements(Potassium, Thorium & Uranium) in the earth’s crust undergo radioactive decay spontaneously. Alpha and beta particles and gamma rays are emitted as their atomic nuclei disintegrate.
The Gamma Ray is the only one that can penetrate the rock for an appreciable distance. A Gamma Ray (GR) log measures this radiation.
Tools and Applications
Radioactive DecayGamma ray Logging
Rock Formation Rock Formation
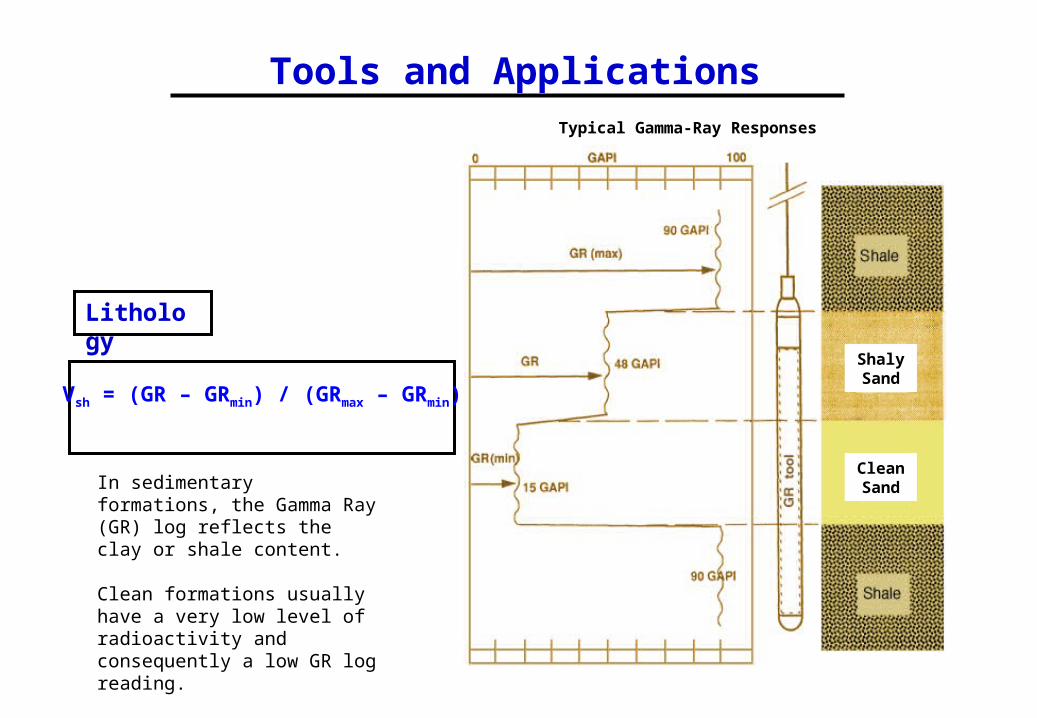
In sedimentary formations, the Gamma Ray (GR) log reflects the clay or shale content.
Clean formations usually have a very low level of radioactivity and consequently a low GR log reading.
Lithology
Tools and ApplicationsTypical Gamma-Ray Responses
CleanSand
ShalySand
Vsh = (GR – GRmin) / (GRmax – GRmin)

The spontaneous potential is a measurement against depth of the borehole the difference between the voltage in the wellbore and an electrode on the surface.
Differences in potential are developed due to the differences in salinity between the mud filtrate and the formation water.
Lithology
Tools and Applications
Borehole
Electrode
IsolatedCable
Ground onsurface
Spontaneous Potential Measurement
The SP log cannot be recorded when a well is drilled with oil based mud, or when Rmf = Rw, or in a cased hole.

In the shale zones, the SP curve usually defines a more or less straight line on the log.
In sands and more permeable formations, the curves show excursions from the straight line.
Lithology
Tools and Applications
Shale A
Sandstone B
Rmf > Rw
Shale C
Sandstone D
Rmf < Rw
SP LOG
- 42
+ 44

For a quick evaluation at the well-site, the SP log is used in a similar way as the GR log.
Baselines for 100% sandstone and 100% shale are established at the maximum and minimum SP excursions.
Lithology
Tools and Applications
SP Log Example
Vsh = (SP – SPcl) / (SPsh – SPcl)

The Litho-Density tool (LDT) consists of a chemical gamma ray (-ray) emitting source and -ray detectors. The -rays emitted from the source interact with the formation in various ways and are scattered back to detectors.
One of the ways in which the -rays interact with the formation is known as photo-electric absorption. A parameter called PEF is defined by measuring the number of g-rays that are absorbed by photo-electric absorption.
Lithology
Tools and Applications
Density LoggingPhotoelectric Absorption

The PEF is a good matrix indicator.
PEF responds mainly to the lithology and has very little effect due to changes in or fluid content.
Lithology
Tools and ApplicationsLithology Identification using PEF
PEF as a function of fluid content and lithology

Porosity
Sonic
A simple sonic tool consists of:1) A transmitter which emits a sound pulse.
2) And a receiver which picks up and records the pulse as its passes the receiver.
For eliminate the influences of tool tilting and borehole size, modern sonic tools has several receivers.
Tools and Applications
Wellbore FormationReceiver
Compressional Shear Stoneley

The Sonic log records the time required for a sound wave to travel 1 ft of the formation. Commonly referred to as interval transit time (t) or slowness, it is the reciprocal of the velocity of the sound wave and is measured in micro-seconds per foot (s/ft).
Porosity
Sonic
Tools and ApplicationsTwo Transmitters/
Four Receivers

Porosity
Sonic
Tools and Applications
Willie Time Average Equation
Uncompacted Sands Raymer-Hunt Equation
In sedimentary formations sound velocity primarily depends on the rock matrix and the distributed porosity.
For clean consolidated formations with uniformly distributed small pores, a relationship between porosity and transit time was proposed by Willie.
Density
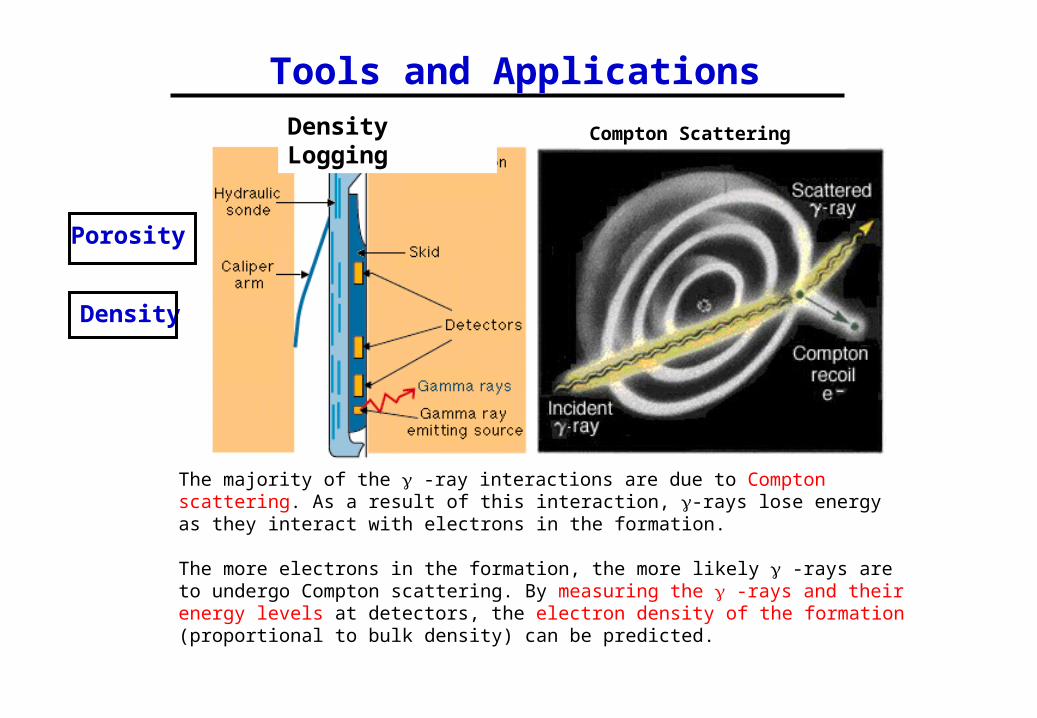
The majority of the -ray interactions are due to Compton scattering. As a result of this interaction, -rays lose energy as they interact with electrons in the formation.
The more electrons in the formation, the more likely -rays are to undergo Compton scattering. By measuring the -rays and their energy levels at detectors, the electron density of the formation (proportional to bulk density) can be predicted.
Porosity
Tools and ApplicationsDensity Logging Compton Scattering

Density log response is a combination of the matrix density and the density of fluids in their relative proportions.
The porosity can be computed from the density log for a known matrix and saturating fluid densities.
Density
Porosity
Tools and Applications

The density log consists of three curves. RHOB - Formation bulk density, DRHO -Bulk density correction – depends on caliper. CALI - Caliper - the density tool is a pad type tool. PEF – Photo - electric factor is also a part of the density tool recording.
Density
Porosity
Tools and Applications

Neutron
Porosity
Tools and ApplicationsThermal Neutron AbsorptionNeutron Logging Thermal Neutron Absorption
The neutron tool consists of a chemical or an electronic high energy neutron emitter and neutron detectors.
The high energy neutrons slow down to thermal levels via elastic scattering, mainly due to the collision with the hydrogen atoms in the formation. Assuming that the majority of the hydrogen atoms are present in the water or hydrocarbons in the pore spaces, the formation porosity can be determined.

The Hydrogen atoms in the pore fluid of the formation act as tiny bar magnets. The Nuclear Magnetic Resonance measurement is obtained by manipulating the hydrogen nuclei with magnetic field.
NMR
Porosity
Tools and Applications
NMR PrinciplesH Protons as magnets
RandomAlignments
Inherent Spin

NMR
Porosity
Tools and Applications
Each H-atom has a nuclear (proton)spin
No magnetic Field Present:
Nuclear Spins not aligned
Static Magnetic Field Present B0:
Spins aligned by static magnet
Apply RF pulse B1 (B1 I B0)
Spins swept to new direction
Spins decay to old static field
direction, giving off RF signal
NMR
Porosity
Tools and Applications
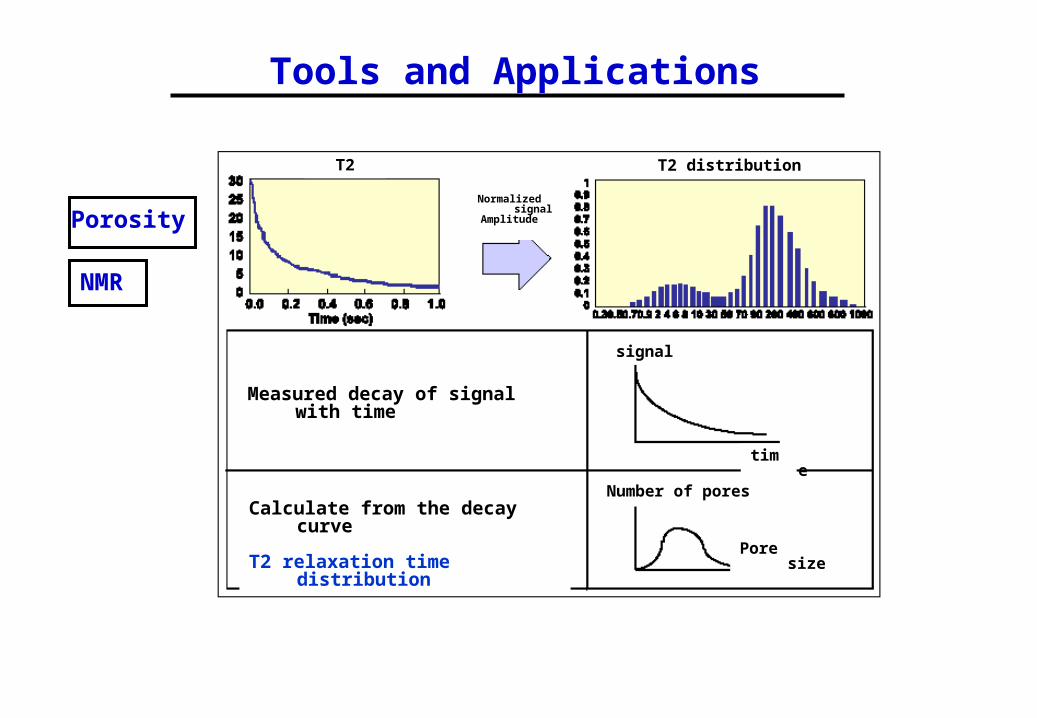
Measured decay of signal with time
Calculate from the decay curve
T2 relaxation time distribution
T2 distribution
Normalized signalAmplitude
T2
signal
time
Number of pores
Pore size
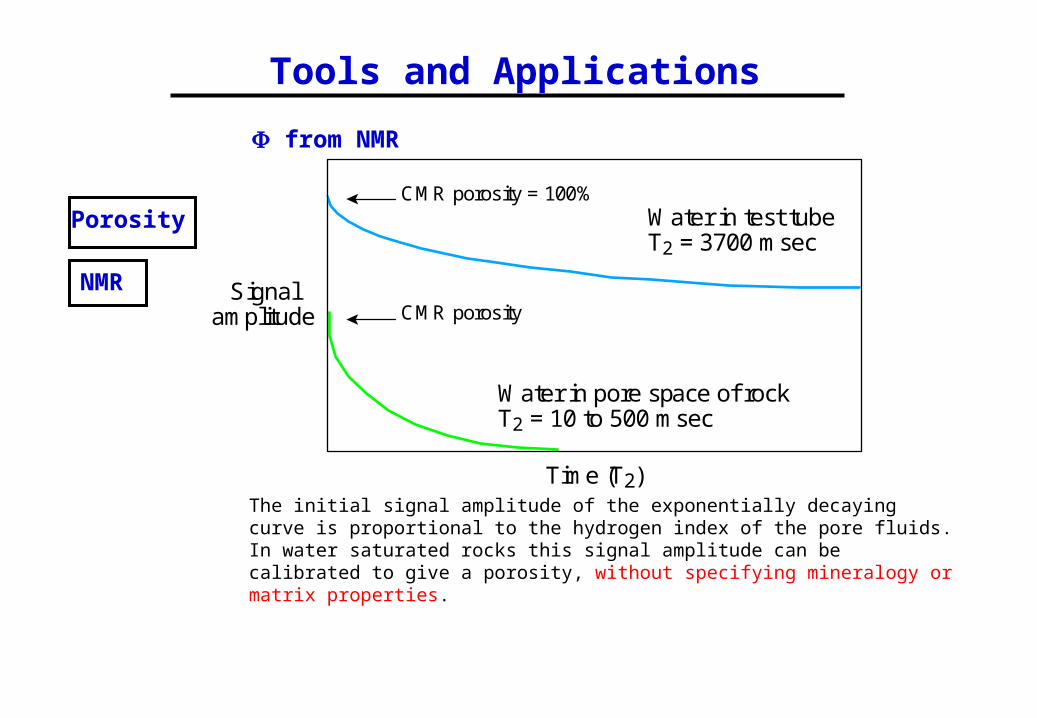
The initial signal amplitude of the exponentially decaying curve is proportional to the hydrogen index of the pore fluids. In water saturated rocks this signal amplitude can be calibrated to give a porosity, without specifying mineralogy or matrix properties.
NMR
Porosity
Tools and Applications
from NMR
Water in test tubeT2 = 3700 msec
Water in pore space of rockT2 = 10 to 500 msec
CMR porosity
CMR porosity = 100%
Time (T2)
Signalamplitude

Saturation
Resistivity
Invasion affects all logs. Lithology and porosity do not change significantly in the invaded zone.
However, saturation has to be computed for the uninvaded zone, since invasion changes fluid saturation in the invaded zone.
The main tools for determining hydrocarbon saturation in open hole are the Resistivity tools.
Tools and Applications
Inv
ad
ed
Zo
ne
Tools and Applications
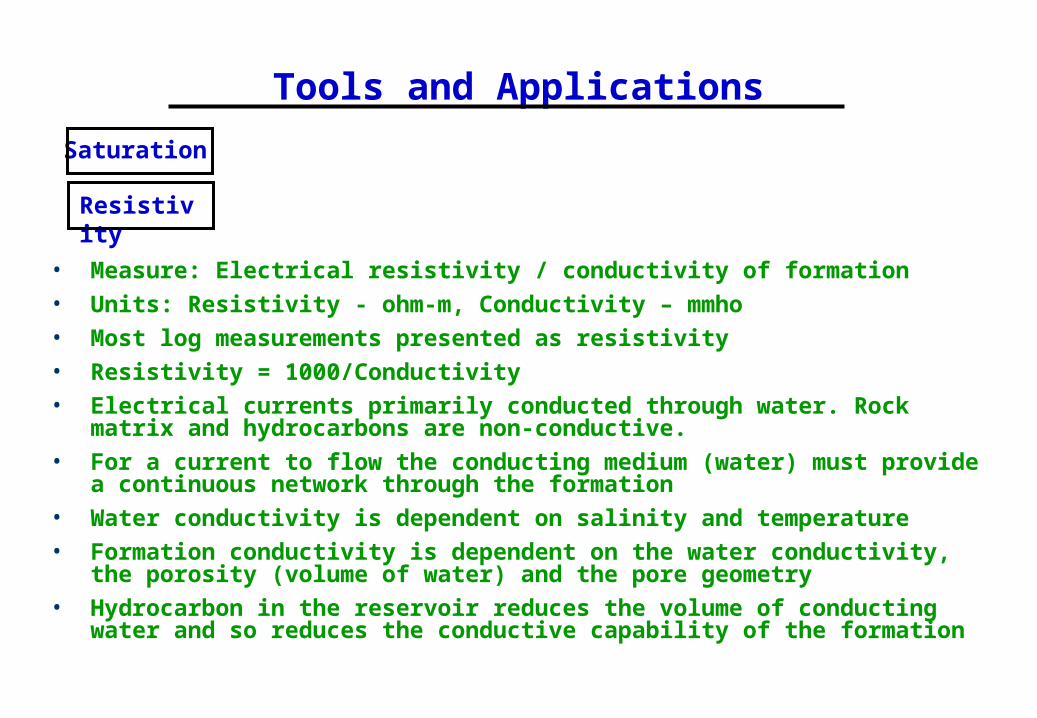
• Measure: Electrical resistivity / conductivity of formation
• Units: Resistivity - ohm-m, Conductivity – mmho
• Most log measurements presented as resistivity
• Resistivity = 1000/Conductivity
• Electrical currents primarily conducted through water. Rock matrix and hydrocarbons are non-conductive.
• For a current to flow the conducting medium (water) must provide a continuous network through the formation
• Water conductivity is dependent on salinity and temperature
• Formation conductivity is dependent on the water conductivity, the porosity (volume of water) and the pore geometry
• Hydrocarbon in the reservoir reduces the volume of conducting water and so reduces the conductive capability of the formation
Saturation
Resistivity

The formation lithology and do not alter much due to invasion.
The Rt changes significantly in the invaded zone and the resistivity
tools need to measure deep into the virgin zone to compute the Sw.
ResistivityBasics
Tools and Applications
HydrocarbonSaturation
Invasion
Invaded Transition Annulus Virgin
Rmf100%
BoreholeWall
0%

ResistivityBasics
Tools and Applications
HydrocarbonSaturation
Depth of Investigationof Resistivity Logs
Rt determination Deep Log Medium Log
Very ShallowLog
Invaded Zone
Virgin Zone
Rxo = f (Very Shallow Log) Sxo = 1/ (Rmf/Rxo)1/2
Rt = f (Very Shallow Log,Medium Log,Deep Log) Sw = 1/ (Rw/Rt)1/2
The resistivity tools are designed to read at various depths of investigation: The shallow reading is used to measure the Sxo.
The deep reading is affected by the invasion and is often not the R t.
The medium reading, together with the shallow reading, is used to correct the deep reading to obtain the the Rt.
Tools and Applications
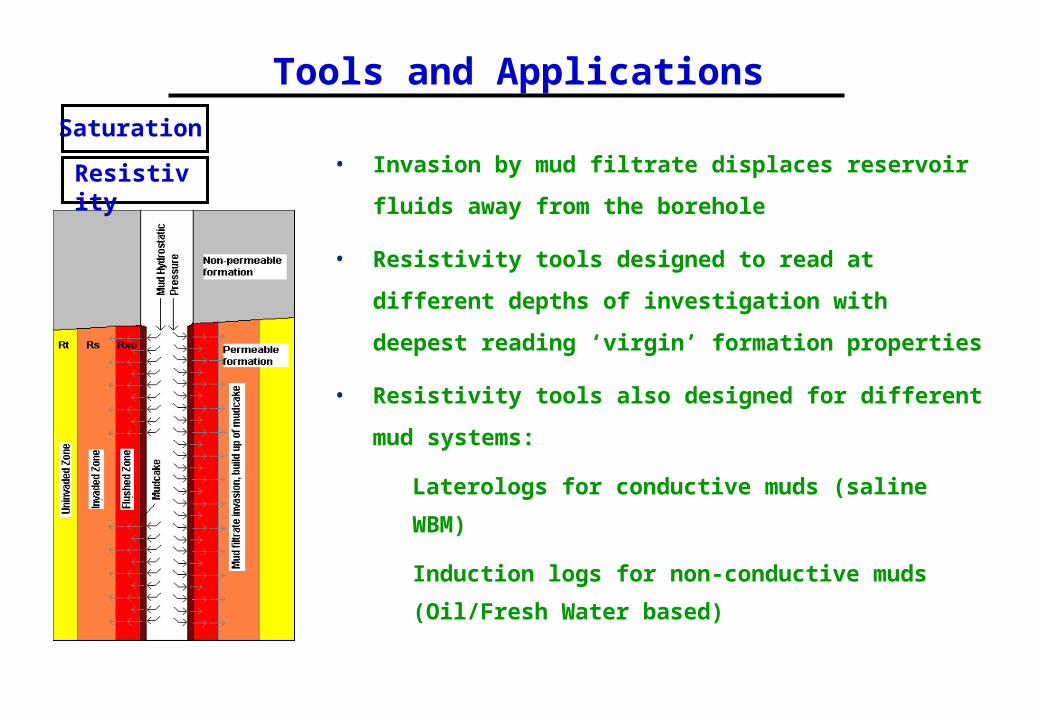
• Invasion by mud filtrate displaces reservoir fluids
away from the borehole
• Resistivity tools designed to read at different depths
of investigation with deepest reading ‘virgin’
formation properties
• Resistivity tools also designed for different mud
systems:
– Laterologs for conductive muds (saline WBM)
– Induction logs for non-conductive muds
(Oil/Fresh Water based)
Saturation
Resistivity
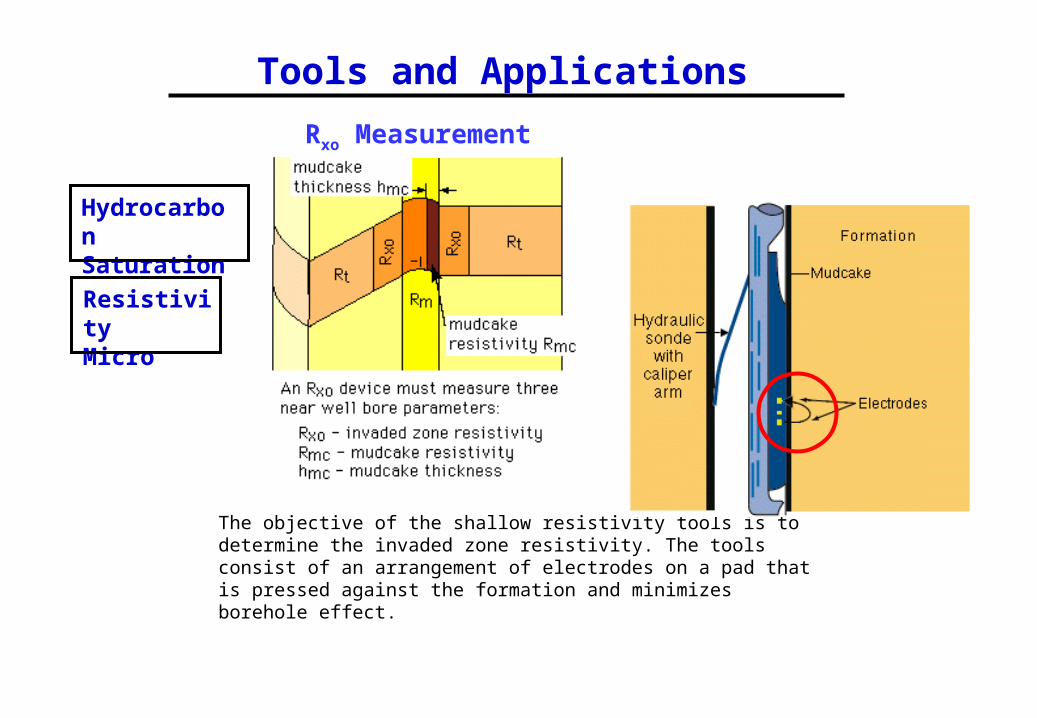
The objective of the shallow resistivity tools is to determine the invaded zone resistivity. The tools consist of an arrangement of electrodes on a pad that is pressed against the formation and minimizes borehole effect.
ResistivityMicro
Tools and Applications
HydrocarbonSaturation
Rxo Measurement

Laterolog tools function in conductive drilling mud environments.
They send focused current into the formation to measure the voltage in a specific volume of the formation.
This voltage is related to the resistivity of the formation.
Saturation
Resistivity
Tools and Applications
Dual Lateralog MeasurementDeep Measurements Shallow measurement
Volume ofInvestigation

Saturation
Resistivity
Tools and Applications
In non-conductive mud environments, lateralog tools do not work and induction-principles based tools are used.
The principles of an induction tool:1) The transmitter coil creates a primary magnetic field;2) The primary magnetic field induces current loop in the formation;3) The current loop creates an secondary magnetic field;4) The secondary magnetic field induces a current in the receiver coil. The current tensity is related to the formation conductivity (or resistivity).
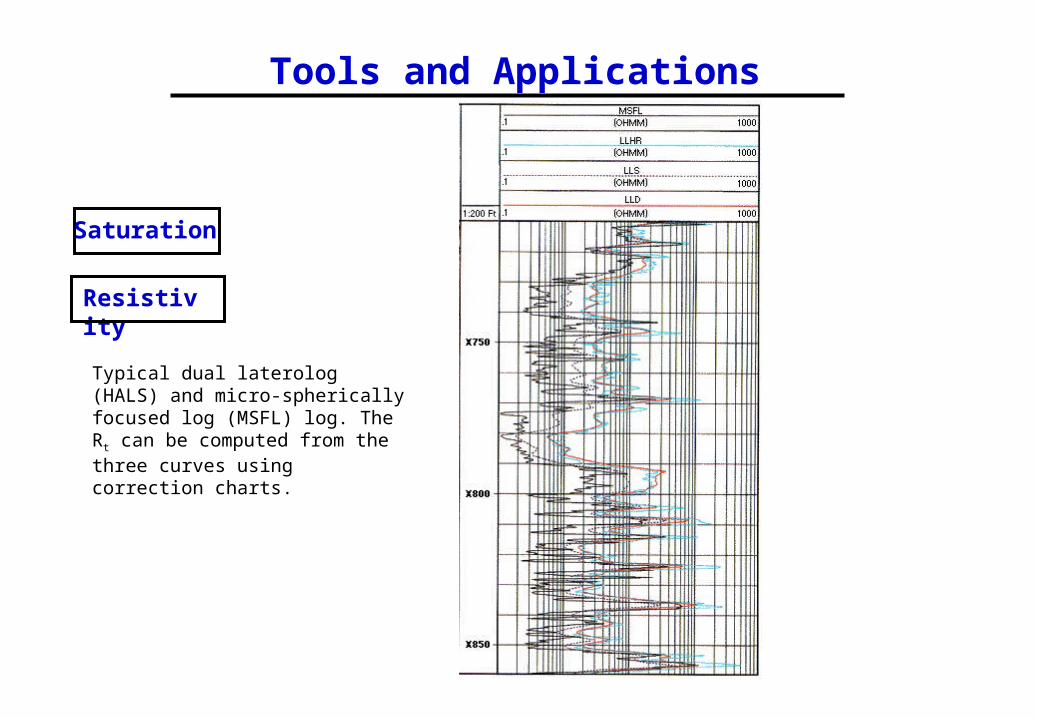
Typical dual laterolog (HALS) and micro-spherically focused log (MSFL) log. The Rt can be computed from the three curves using correction charts.
Saturation
Resistivity
Tools and Applications
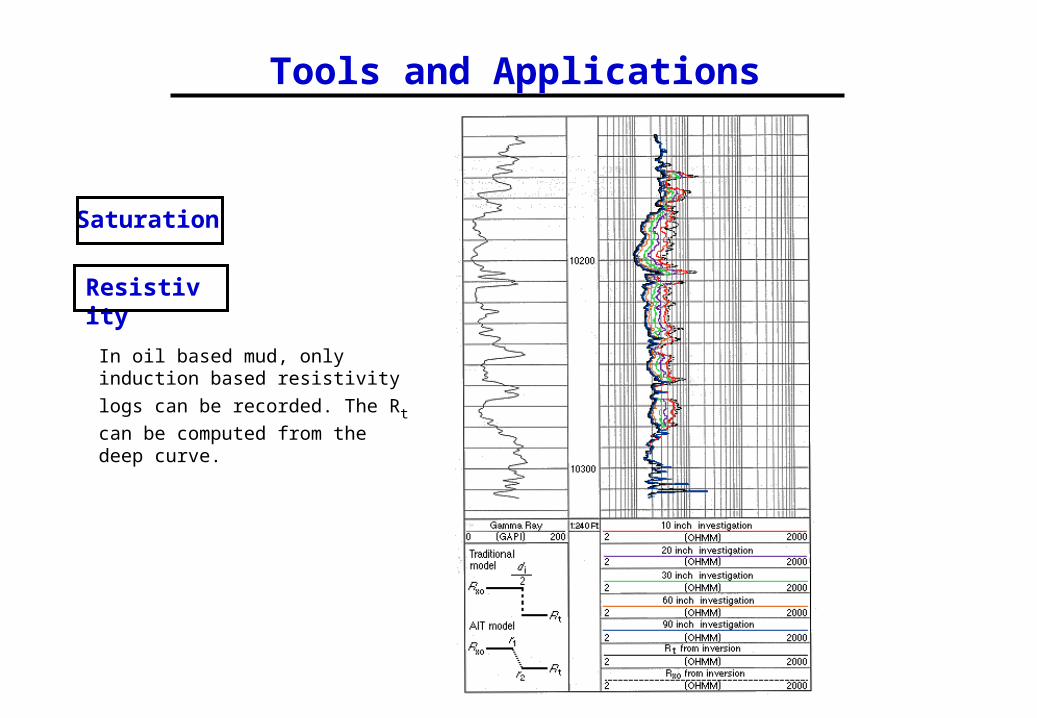
In oil based mud, only induction based
resistivity logs can be recorded. The Rt
can be computed from the deep curve.
Saturation
Resistivity
Tools and Applications
Tools and Applications
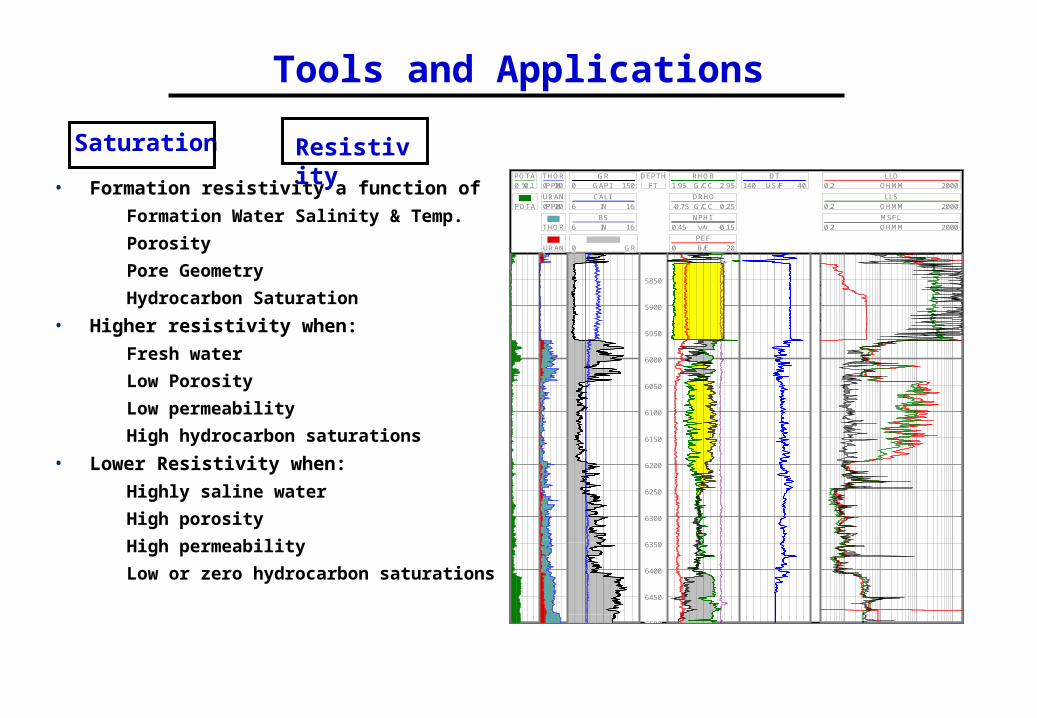
• Formation resistivity a function of
– Formation Water Salinity & Temp.
– Porosity
– Pore Geometry
– Hydrocarbon Saturation
• Higher resistivity when:
– Fresh water
– Low Porosity
– Low permeability
– High hydrocarbon saturations
• Lower Resistivity when:
– Highly saline water
– High porosity
– High permeability
– Low or zero hydrocarbon saturations
POTA%0 0.1
0POTA
THORPPM0 20
URANPPM0 20
0THOR
0URAN
GRGAPI0 150
CALIIN6 16
BSIN6 16
0 GR
DEPTHFT
RHOBG/CC1.95 2.95
DRHOG/CC-0.75 0.25
NPHIv/v0.45 -0.15
PEFB/E0 20
DTUS/F140 40
LLDOHMM0.2 2000
LLSOHMM0.2 2000
MSFLOHMM0.2 2000
5850
5900
5950
6000
6050
6100
6150
6200
6250
6300
6350
6400
6450
6500
Saturation Resistivity

Saturation
The saturation of a formation represents the amount of a given fluid present in the
pore space.
The porosity logs react to the pore space.
The resistivity logs react to the fluids in the pore space.
The combination of the two measurements gives the saturation
Matrix
water
oil

Basics 1
Rw = resistivity of water in the pore space.
Define Ro = resistivity of a rock totally filled with water.
F: Fn Factor.
At constant porosity F is constant.
As porosity increases, Ro decreases and F decreases.
Experiments have shown that F is inversely proportional to m.
m: is called the "cementation exponent".
a: is called the "lithology" constant.
F R0
Rw
F a
m
Basics 2
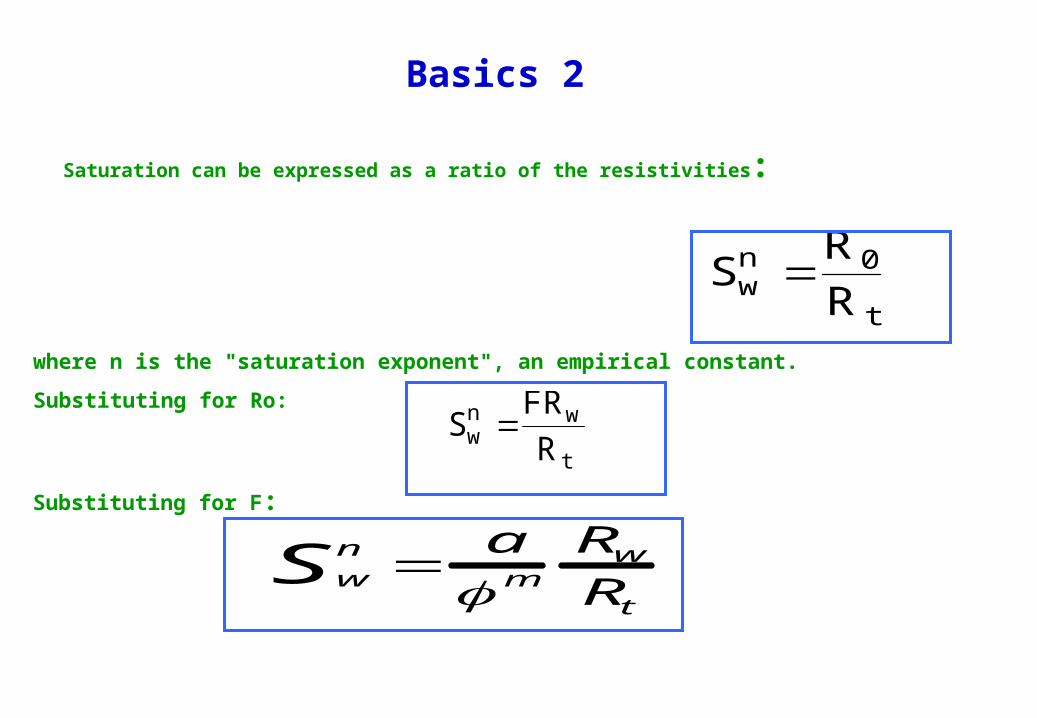
Saturation can be expressed as a ratio of the resistivities:
where n is the "saturation exponent", an empirical constant.
Substituting for Ro:
Substituting for F:
Swn
R0
R t
Swn
FRw
R t
w
nS a
m
RwRt

Saturation Equation
The Archie equation is hence very simple. It links porosity and resistivity with the amount of water present,
Sw.
Increasing porosity, will reduce the saturation for the same Rt.
Increasing Rt for the same porosity will have the same effect.
w
nS a
m
RwRt

Type
Density-Neutron
Gas in formation causes the apparent porosity from density log to increase and porosity from neutron log to decrease, causing a density-neutron separation.
Tools and Applications

The tester can obtain vertical pressure profiles which are used to define fluid type within the reservoir and locate fluid contacts in medium to high permeability virgin reservoirs.
Formation Testing
Type
Tools and Applications

MicroResistivity
Separation between the two curves from microlog resistivity can indicate permeability.
The log does not provide the absolute permeability value and is only used as an indicator for permeable formations.
Tools and Applications
Permeability
Permeability from Microlog
OH Logging and Quick Look Analysis
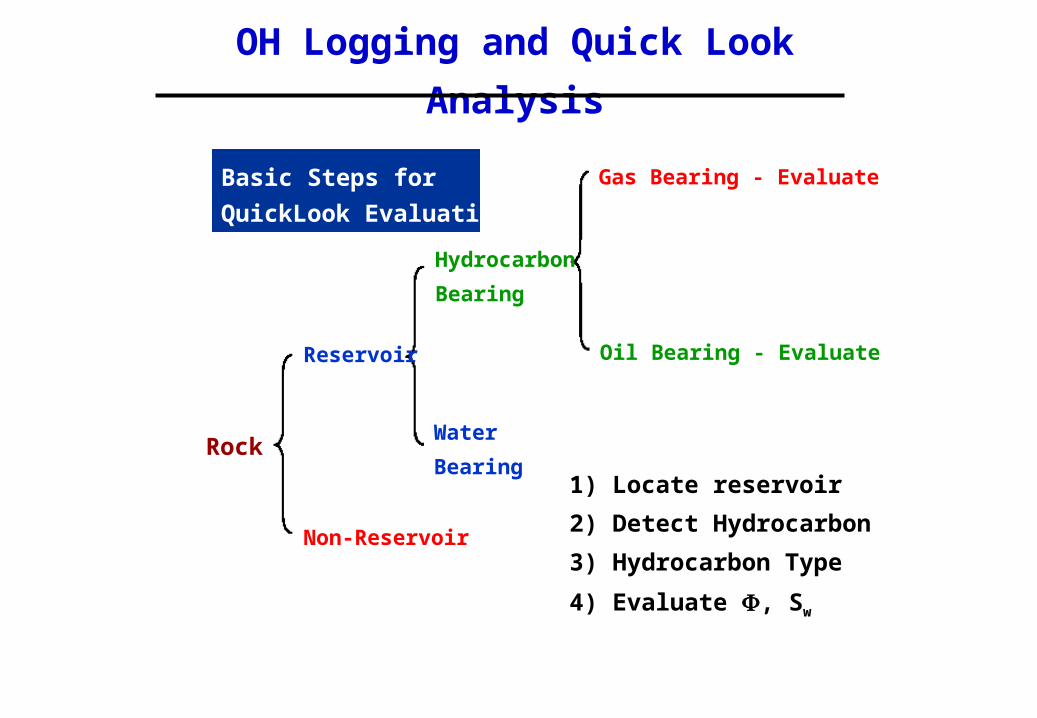
Rock
Reservoir
Non-Reservoir
Hydrocarbon
Bearing
Water
Bearing
Gas Bearing - Evaluate
Oil Bearing - Evaluate
1) Locate reservoir
2) Detect Hydrocarbon
3) Hydrocarbon Type
4) Evaluate , Sw
Basic Steps for
QuickLook Evaluation

Before start interpretation:
•Review the quality of the logs : check headers, depths, scales, calibrations. Read the remarks section.
•Inspect the mud log for intervals with reservoir rock, hydrocarbon shows and mud gains.
•Use logs from surrounding wells, if available, to identify any obvious anomalies in the data. Have a look on the local geology.
OH Logging and Quick Look Analysis
OH Logging and Quick Look Analysis
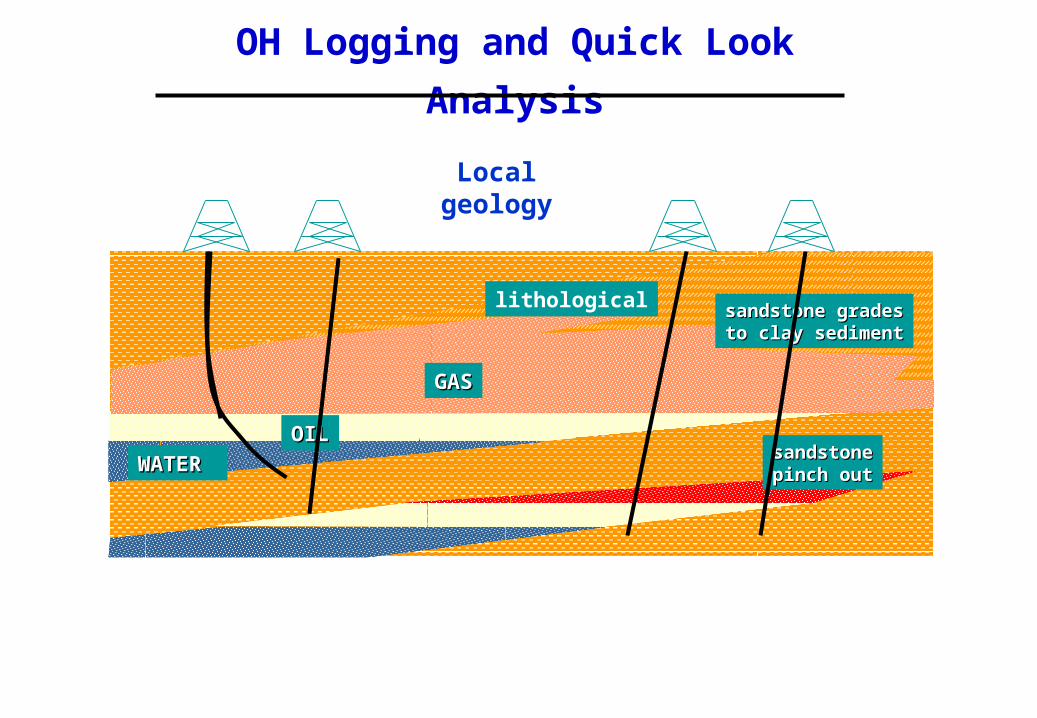
GASGAS
OILOIL
WATERWATER
sandstone gradessandstone gradesto clay sedimentto clay sediment
sandstonesandstonepinch outpinch out
lithological
Local geology

OH Logging and Quick Look Analysis
Descriptor Measurement Functional Behavior
Clean/Shaly SP
GR
Vshale SP Vshale GR
Porosity() Density
Neutron
Sonic
b n t
Hydrocarbon Rt Sw Rt So Rt Rt
Recoverable/
Moveable
Rxo vs. Rt
(shallow vs. deep)
Rxo=Rt no invasion
Rxo/RtRmf/Rw Moved fluid
This is a summary of Qualitative Interpretation
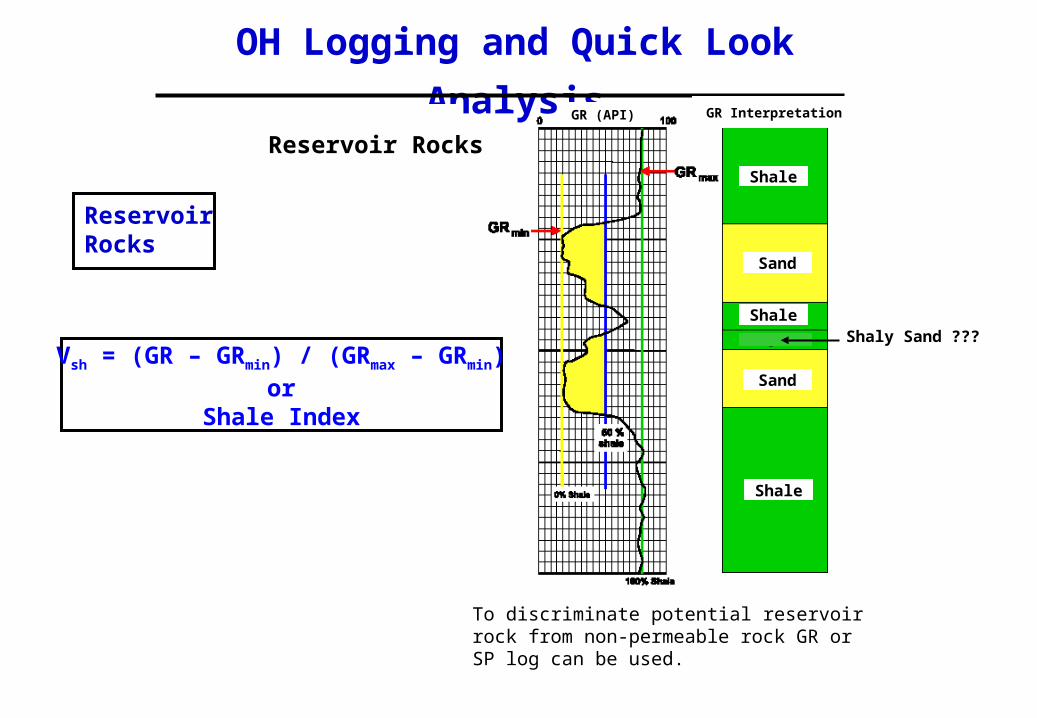
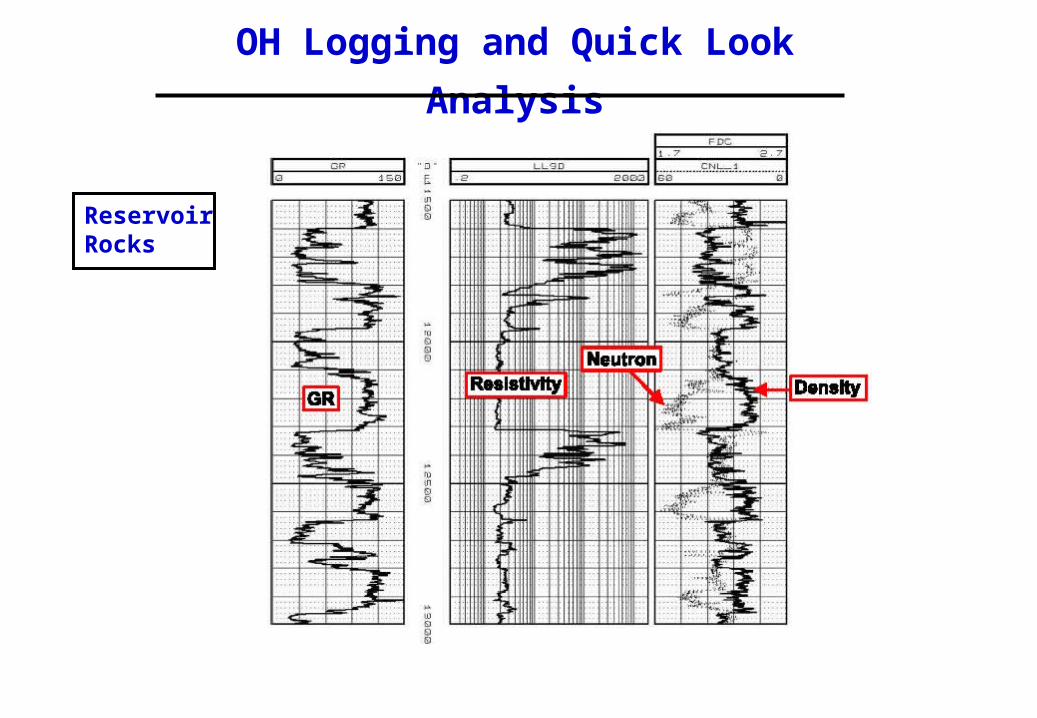
ReservoirRocks
To discriminate potential reservoir rock from non-permeable rock GR or SP log can be used.
OH Logging and Quick Look Analysis
Reservoir Rocks
Vsh = (GR – GRmin) / (GRmax – GRmin)or
Shale Index
GR (API) GR Interpretation
Shale
Shale
Shale
Sand
Sand
Shaly Sand ???
ReservoirRocks
OH Logging and Quick Look Analysis
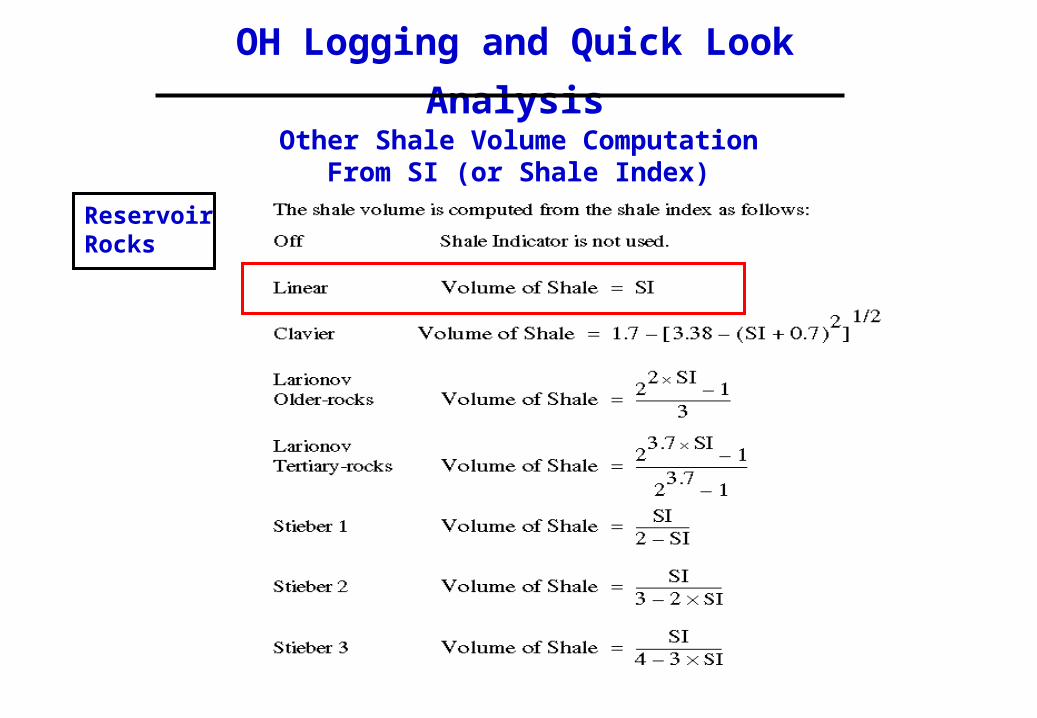
Other Shale Volume ComputationFrom SI (or Shale Index)
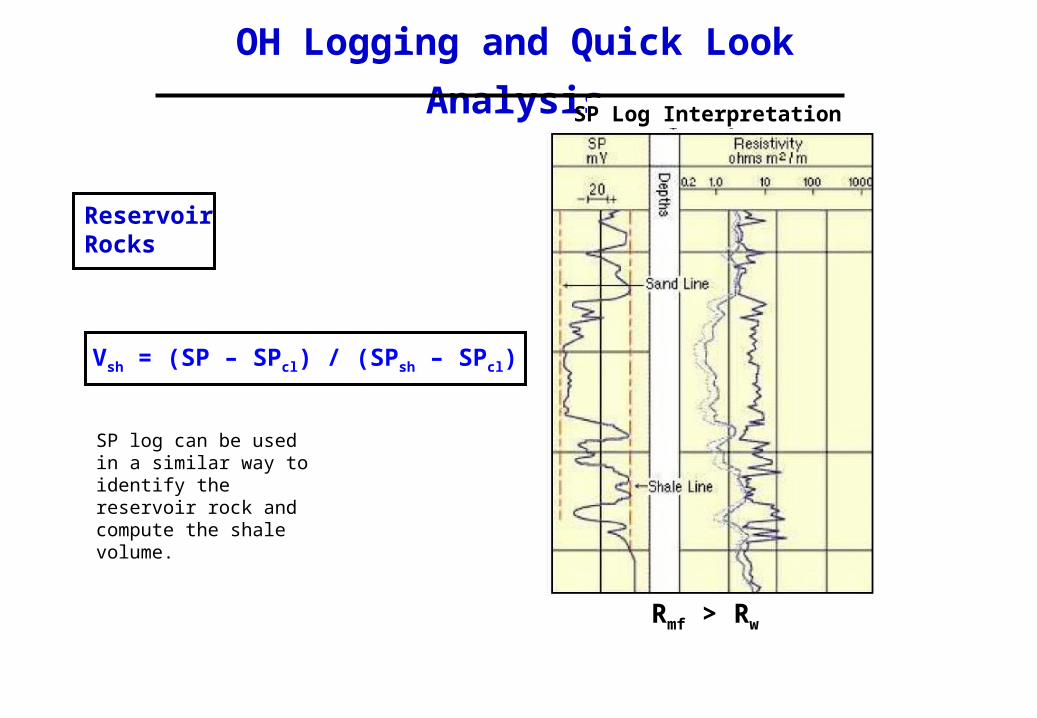
SP log can be used in a similar way to identify the reservoir rock and compute the shale volume.
OH Logging and Quick Look Analysis
ReservoirRocks
Vsh = (SP – SPcl) / (SPsh – SPcl)
SP Log Interpretation
Rmf > Rw
OH Logging and Quick Look Analysis
ReservoirRocks
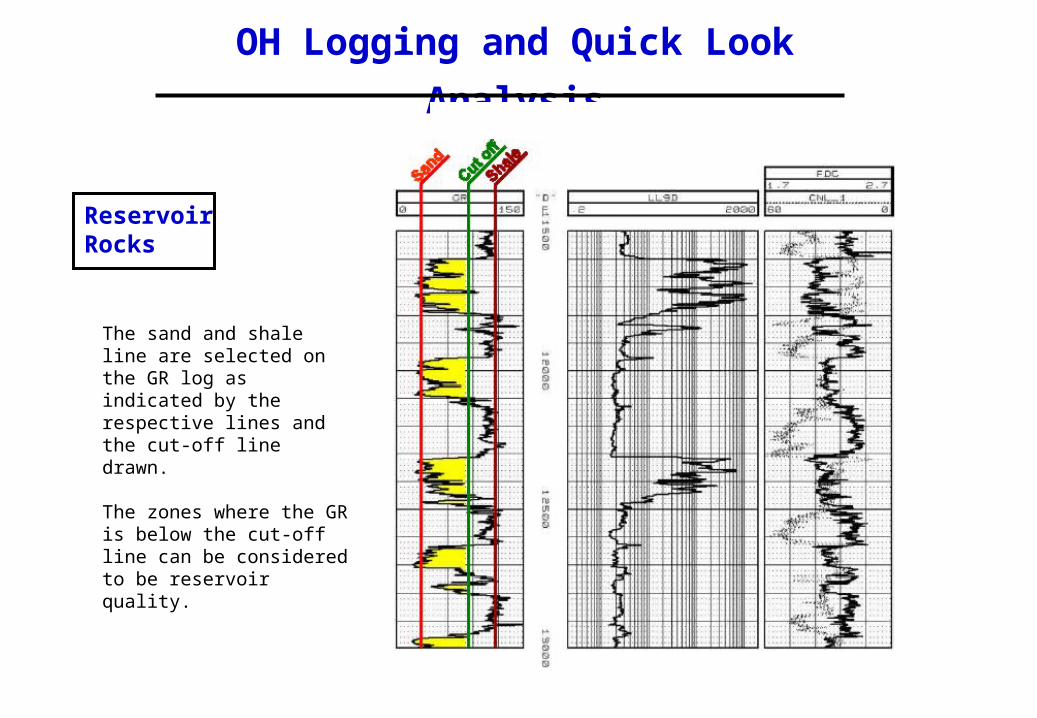
The sand and shale line are selected on the GR log as indicated by the respective lines and the cut-off line drawn.
The zones where the GR is below the cut-off line can be considered to be reservoir quality.
OH Logging and Quick Look Analysis
ReservoirRocks

HydrocarbonZones
From the Archie’s equation Rt increases when the water is replaced
by oil with and lithology remaining constant. This feature is used to differentiate oil and water zones in the reservoir intervals.
OH Logging and Quick Look AnalysisIdentify Hydrocarbon Zones
OilZone
WaterZone
Archie’s Equation
Rt = Rw / (m Swn)
Cle
an s
and
s w
ith
co
nst
ant
Resistivity Log
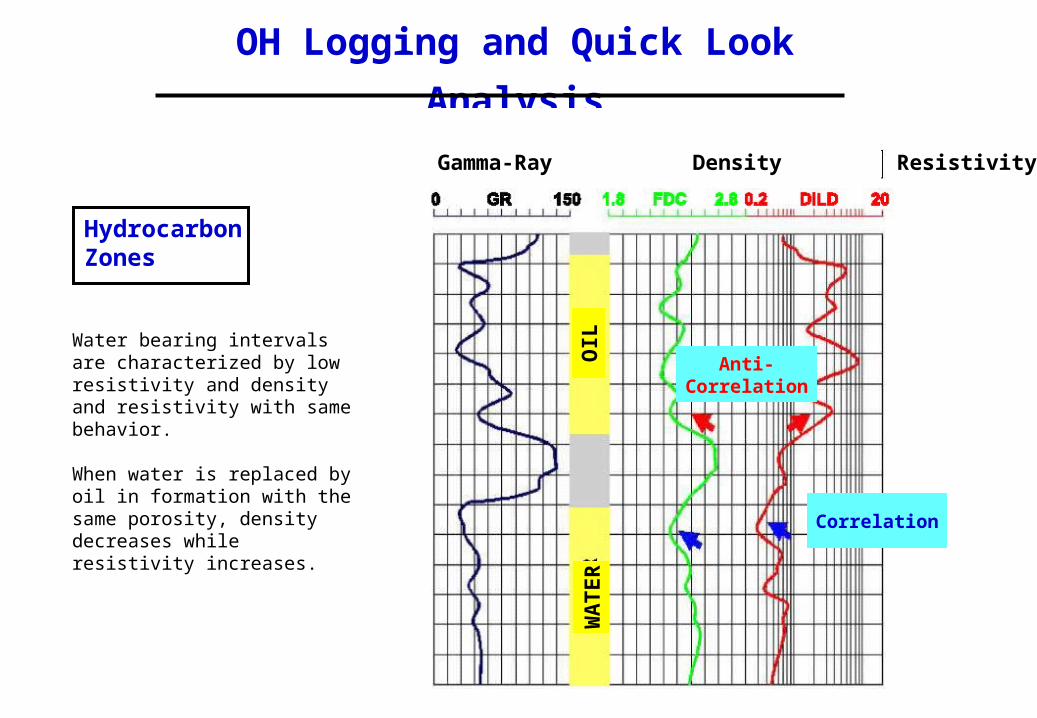
Water bearing intervals are characterized by low resistivity and density and resistivity with same behavior.
When water is replaced by oil in formation with the same porosity, density decreases while resistivity increases.
HydrocarbonZones
OH Logging and Quick Look Analysis
Gamma-Ray Density Resistivity
Anti-Correlation
WA
TE
RO
IL
Correlation

Once the reservoir intervals have been identified, next step is to identify the hydrocarbon bearing zones. Zones with high resistivity are the candidates to confirm the presence of hydrocarbons.
HydrocarbonZones
OH Logging and Quick Look Analysis

Oil/GasDifferentiation
Gas in formation causes the apparent porosity from Density log to increase and porosity from Neutron log to decrease, causing a high density-neutron separation (cross-over).
OH Logging and Quick Look Analysis
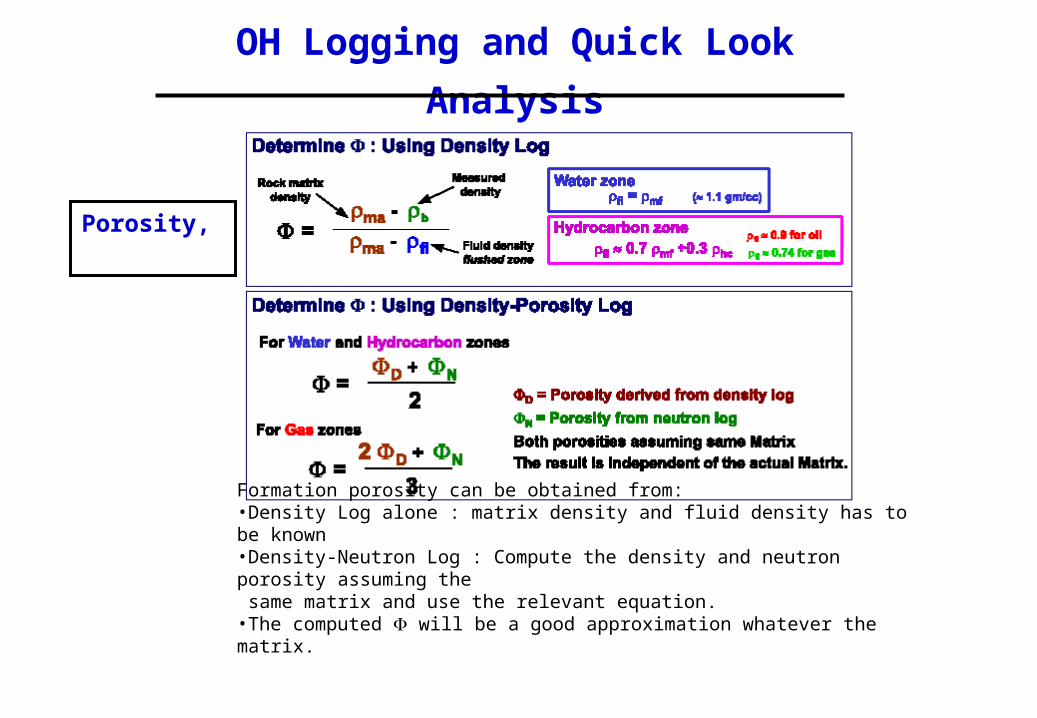
Porosity,
Formation porosity can be obtained from:•Density Log alone : matrix density and fluid density has to be known•Density-Neutron Log : Compute the density and neutron porosity assuming the same matrix and use the relevant equation.•The computed will be a good approximation whatever the matrix.
OH Logging and Quick Look Analysis

Here matrix is sandstone, then density log alone is used to compute the formation porosity.
OH Logging and Quick Look Analysis
Porosity,
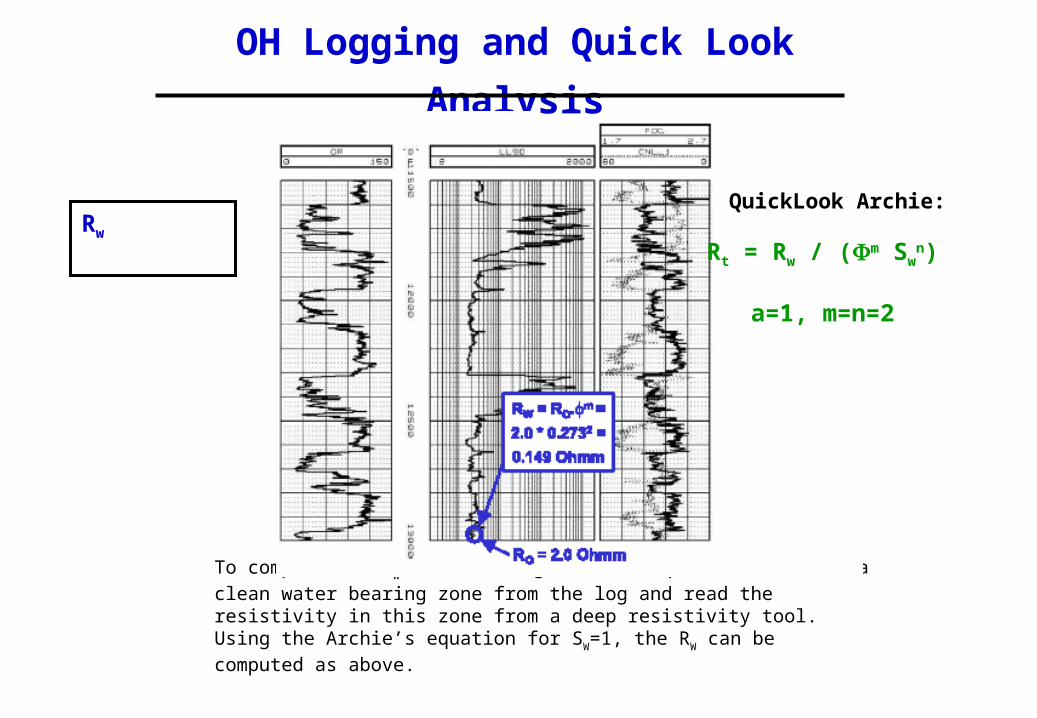
To compute the RW from the log, the interpreter must find a clean water bearing
zone from the log and read the resistivity in this zone from a deep resistivity tool. Using the Archie’s equation for SW=1, the RW can be computed as above.
OH Logging and Quick Look Analysis
Rw
QuickLook Archie:
Rt = Rw / (m Swn)
a=1, m=n=2
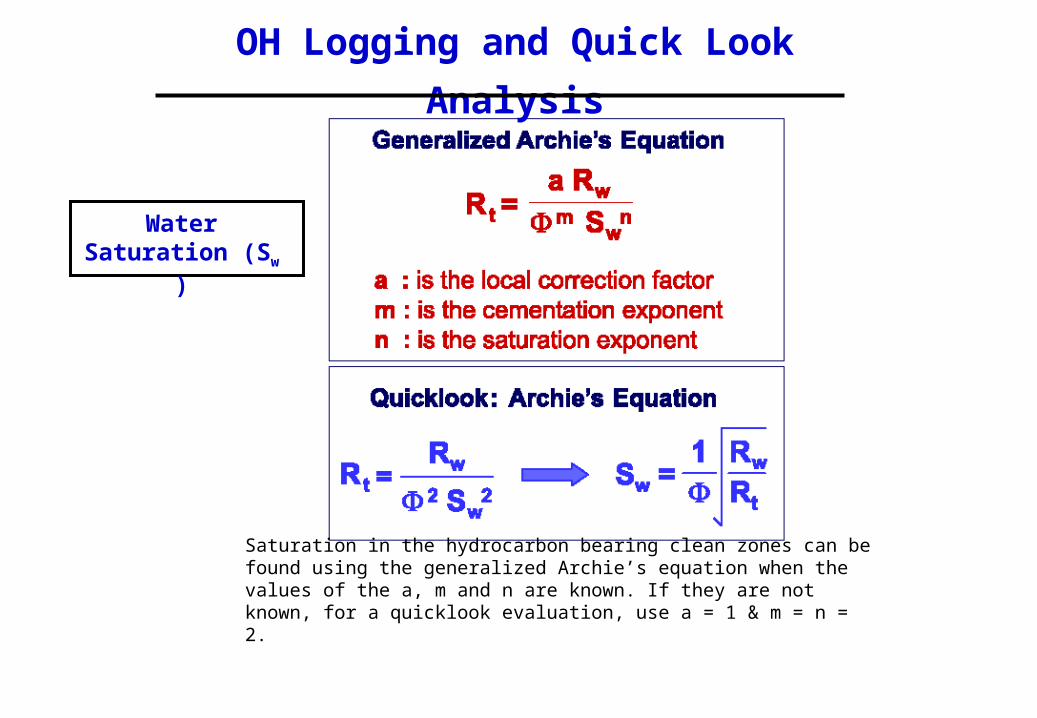
Saturation in the hydrocarbon bearing clean zones can be found using the generalized Archie’s equation when the values of the a, m and n are known. If they are not known, for a quicklook evaluation, use a = 1 & m = n = 2.
OH Logging and Quick Look Analysis
Water Saturation (Sw )
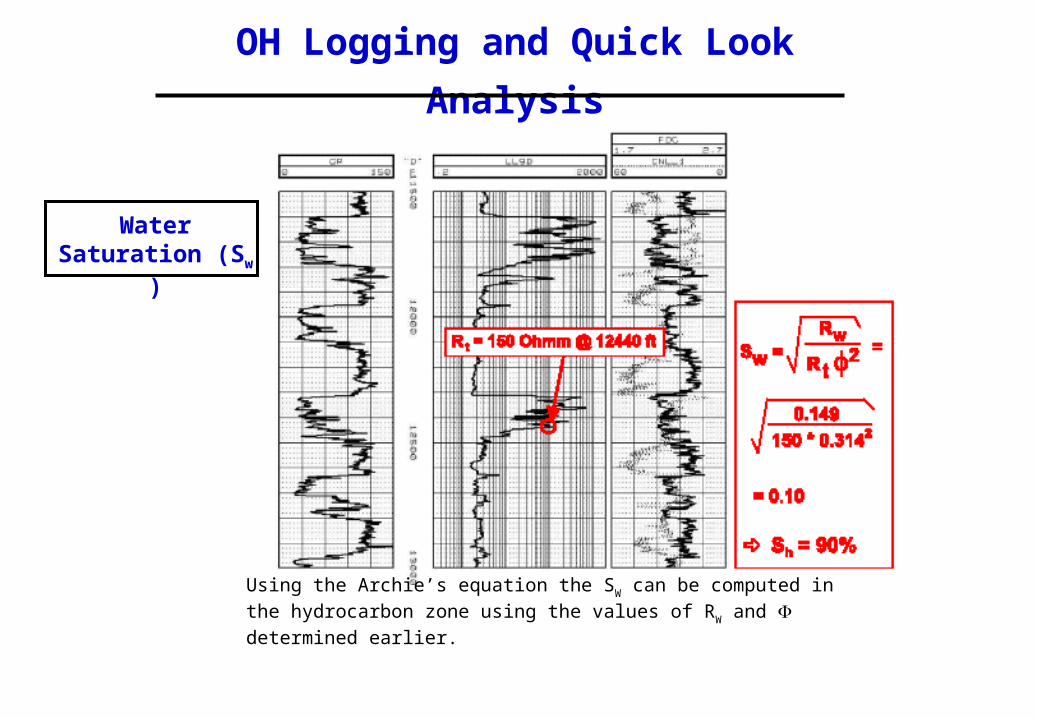
Using the Archie’s equation the SW can be computed in the
hydrocarbon zone using the values of RW and determined earlier.
OH Logging and Quick Look Analysis
Water Saturation (Sw )

OH Logging and Quick Look Analysis
Summary
Water Saturation (Sw )

Thank You
Other computations that can be done:
For each major reservoir and fluid type:
Total net sand count (Net / Gross)
Average porosity
Average hydrocarbon saturation
Fluid Contact Levels
Petrophysical parameters used (ma, Rw, m, n...)
OH Logging and Quick Look Analysis

Practical
1
2
3
4
5
Questions 1-5: Which answer best describes the zones 1-5 below. (A,B,C or D)
Question 6: Which zone below likely contains Oil or Gas
A- Permeable, low resistivity and porous.
B- Permeable, high resistivity and porous.
D- Permeable, high resistivity and tight.
C-Impermeable shale.
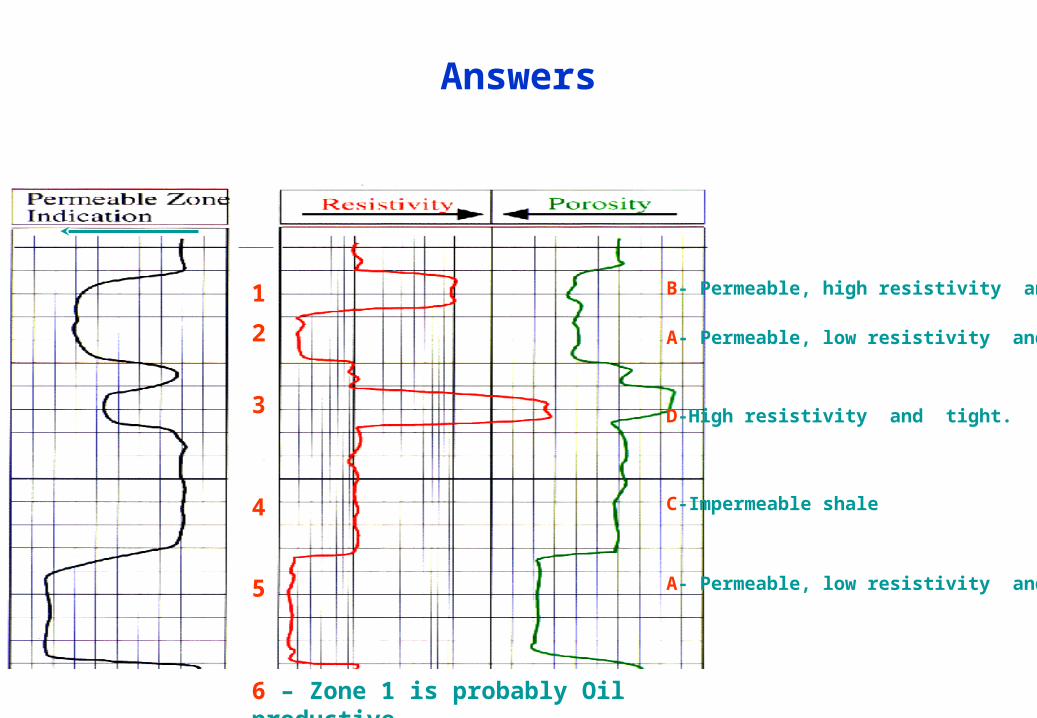
Answers
B- Permeable, high resistivity and porous.
A- Permeable, low resistivity and porous.
D-High resistivity and tight.
A- Permeable, low resistivity and porous.
1
2
3
4
5
C-Impermeable shale
6 – Zone 1 is probably Oil productive