Fun With SAS
8
Fun with SAS By Chandra Prakash
description
SAS is the leader in business analytics software and services, and the largest independent vendor in the business intelligence market.Let's explore fun with learning.
Transcript of Fun With SAS

Fun with SAS
By Chandra Prakash

I had an encounter with SAS long back during my MBA days but I never appreciated
neither I found something exciting about it. It was just; seems another software. I knew there are lots of demands in the market for this software and it cost a sky high price. But I never could digest the logic.
After MBA I joined a BIG4 Audit firm as a data analytics professional and among many other softwares I had to work on SAS as well. But I always preferred ACL, an alternate analytics tool. ACL is very much appreciated software in Auditing space. The very reason for this popularity is being customized to audit needs. Though Excel become much handy to handle smaller set of data and in most cases what audit need. In few of the instances where audit procedure need to handle much bigger data, ACL come into use and while SAS is the only option in abnormally bigger data.
So Finally I concluded with limited scope of SAS Usage in audit that the much appreciated software has no better use.
I continued using ACL until I met with requirement to use statistical technique for analytical review. There was another in-house developed VBA based program that was used through the ages in the firm which utilizes regression technique for these purposes. I thought of using ACL for such a requirement and realized that it is just incapable. I searched into many other software and found less know SPSS to audit has a good capability of performing statistical procedures, although, it had its own limitations. We could not do more than what has been provided in the tool. So it was not an end of search. After much revolving around I understood why SAS keeps its place.
This book do not intend to any purpose. I am trying to include SAS procedure which I liked and can provide additional capabilities.
Preface
SAS is the leader in business
analytics software and services, and the largest independent vendor in the business intelligence market.
In addition, SAS has many business solutions that enable large-scale software solutions for areas such as IT management, human resource management, financial management, business intelligence, customer relationship management and more
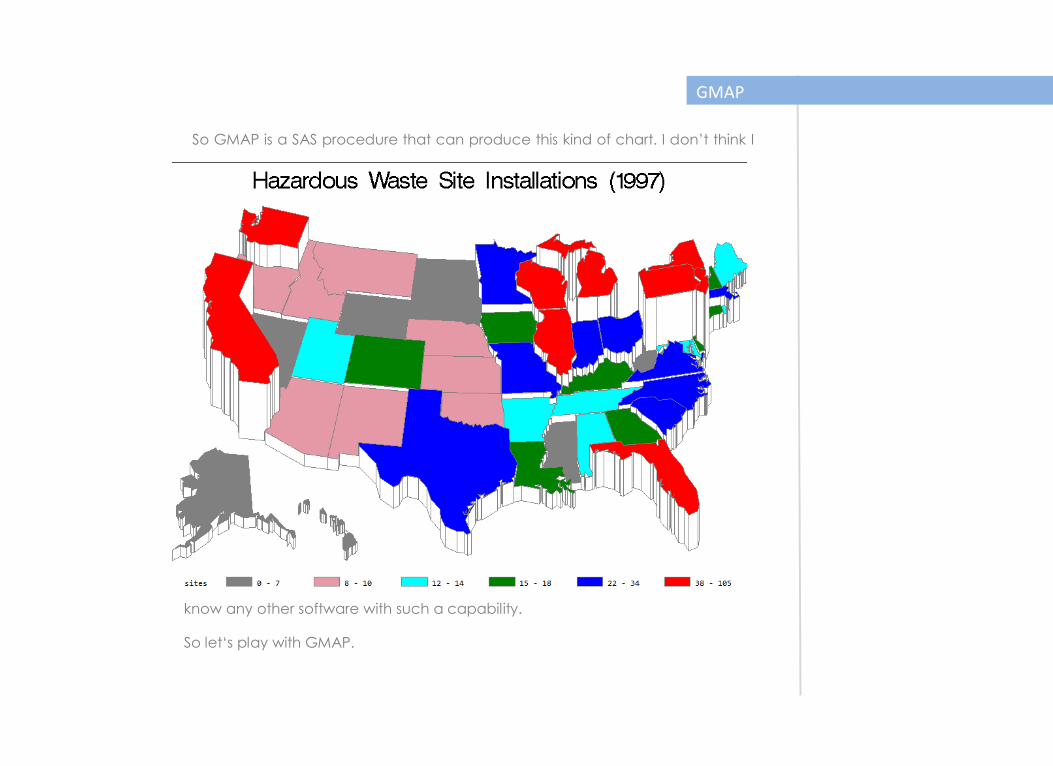
So GMAP is a SAS procedure that can produce this kind of chart. I don’t think I
know any other software with such a capability.
So let‘s play with GMAP.
GMAP
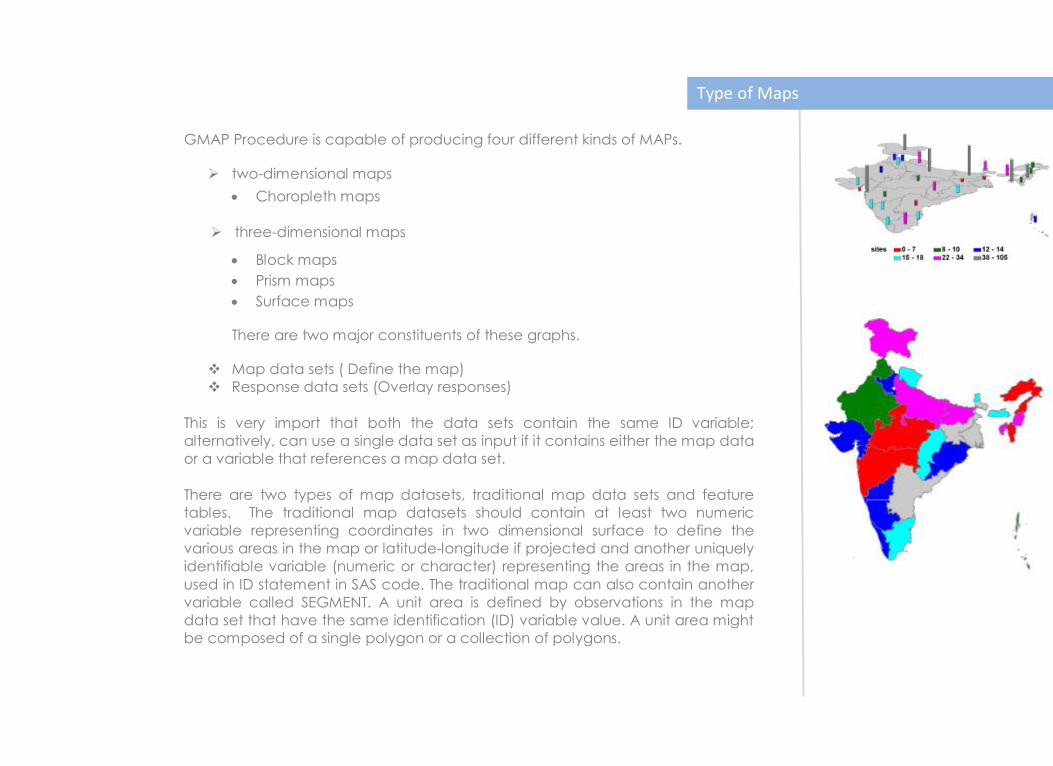
GMAP Procedure is capable of producing four different kinds of MAPs.
Ø two-dimensional maps
• Choropleth maps
Ø three-dimensional maps
• Block maps • Prism maps • Surface maps
There are two major constituents of these graphs.
v Map data sets ( Define the map) v Response data sets (Overlay responses)
This is very import that both the data sets contain the same ID variable; alternatively, can use a single data set as input if it contains either the map data or a variable that references a map data set. There are two types of map datasets, traditional map data sets and feature tables. The traditional map datasets should contain at least two numeric variable representing coordinates in two dimensional surface to define the various areas in the map or latitude-longitude if projected and another uniquely identifiable variable (numeric or character) representing the areas in the map, used in ID statement in SAS code. The traditional map can also contain another variable called SEGMENT. A unit area is defined by observations in the map data set that have the same identification (ID) variable value. A unit area might be composed of a single polygon or a collection of polygons.
Type of Maps
A polygon is defined by all of the observations that have the same SEGMENT variable value within the same unit area. In contrast to the traditional map data set which stores the spatial information across multiple observations, the feature table uses a data arrangement to store a reference to the spatial information in a single variable value.
Response data set contains the information that need to be overlaid at the map. They are generally made up of Reponses and identification (ID) Variable.
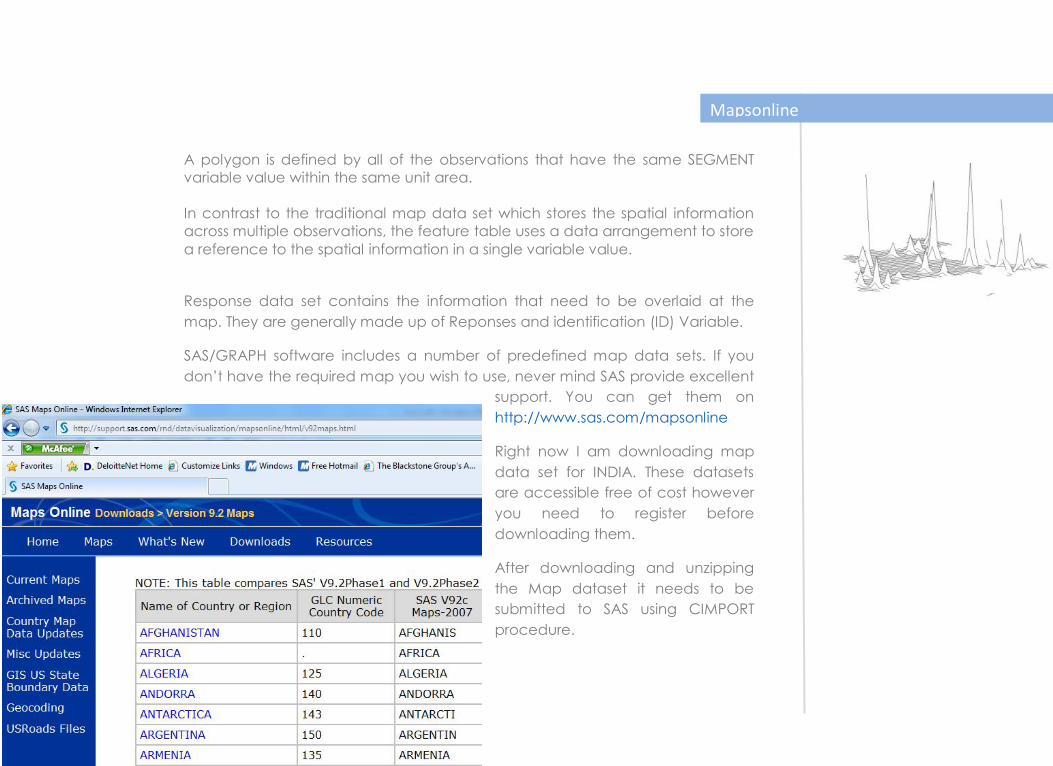
SAS/GRAPH software includes a number of predefined map data sets. If you don’t have the required map you wish to use, never mind SAS provide excellent
support. You can get them on http://www.sas.com/mapsonline
Right now I am downloading map data set for INDIA. These datasets are accessible free of cost however you need to register before downloading them.
After downloading and unzipping the Map dataset it needs to be submitted to SAS using CIMPORT procedure.
Mapsonline
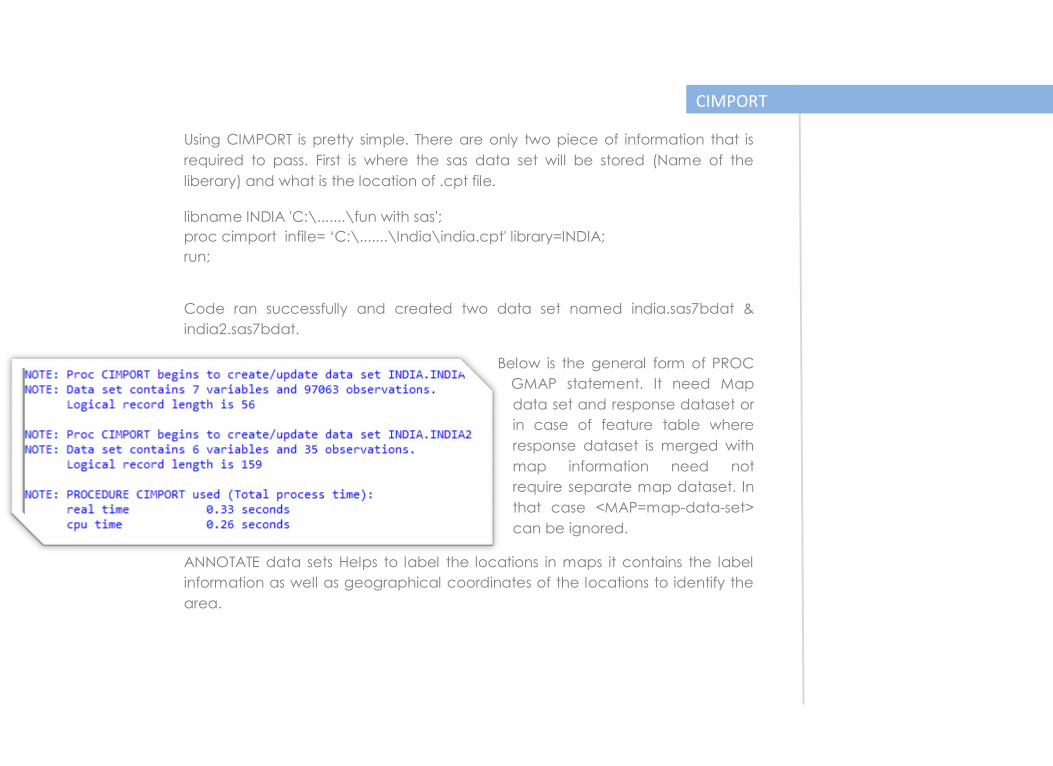
Using CIMPORT is pretty simple. There are only two piece of information that is required to pass. First is where the sas data set will be stored (Name of the liberary) and what is the location of .cpt file.
libname INDIA 'C:\.......\fun with sas'; proc cimport infile= ‘C:\.......\India\india.cpt' library=INDIA; run;
Code ran successfully and created two data set named india.sas7bdat & india2.sas7bdat.
Below is the general form of PROC GMAP statement. It need Map data set and response dataset or in case of feature table where response dataset is merged with map information need not require separate map dataset. In that case <MAP=map-data-set> can be ignored.
ANNOTATE data sets Helps to label the locations in maps it contains the label information as well as geographical coordinates of the locations to identify the area.
CIMPORT
PROC GMAP <MAP=map-data-set> DATA=response-data-set | feature-table <ALL> <ANNOTATE=Annotate-data-set> <DENSITY=0...6 | LOW | MEDIUM | HIGH> <GOUT=<libref.>output-catalog> <IMAGEMAP=output-data-set> <STRETCH> <UNIFORM>; ID id-variable(s) | geo-variable; AREA response-variable </ option(s)>; BLOCK response-variable(s) </ option(s)>; CHORO response-variable(s) </ option(s)>; PRISM response-variable(s)</ option(s)>; SURFACE response-variable(s) </ option(s)>;
If response dataset do not contain observations for all the ma areas they would be ignored from the map; using “ALL“would specify to include the map area even when they do not have their respective observations. “DENSITY” relates to resolution of the map. GOUT directs the location of the output catalogue which can be viewed later using GREPLAY procedure.
Generic Code
This book is not complete. Keep watching this space for updation/ revision.
This book is written with non monetary purpose. Print, transfer, Copy, download, upload…. Anything you wish; please feel
free. If you have any comment/ suggestion/ critic/grievances/query/request, do write me at