Full Time Domain EMI measurement system applied to Railway ...
6
978-1-4673-9698-1/18/$31.00©2018 IEEE Full Time Domain EMI measurement system applied to Railway emissions according to IEC 62236-3-1/EN 50121-3-1 standards Marc Pous, Marco A. Azpúrua, José A. Oliva, Marc Aragón, Iván González and Ferran Silva Grup de Compatibilitat Electromagnètica Universitat Politècnica de Catalunya Barcelona, Spain email: [email protected] Abstract—This paper studies the advantages of applying time- domain based instrumentation to conduct electromagnetic interference emissions from rolling-stock. In IEC 62236-3-1 or EN 50121-3-1 standards, it is mandatory to measure the railway vehicle in static and in-motion conditions. When conventional frequency sweep instrumentation is employed, difficulties regarding ambient noise variation and the short-duration of worst-case emission modes take place. In Annex B of the standard, a test procedure is described to acquire the worst-case EMI, however, as it is explained at the paper the effective measured time at each frequency is only 0.08 ms in some frequency bands. Hence, multiple movements of the vehicle are needed increasing the uncertainty of the measured source and making difficult to distinguish vehicle EMI from background noise interference. To solve this problem, a Full-TDEMI measurement system is proposed with the availability to increase the effective measured time, reduced the ambient noise variation, the usage of multiple antennas at the same time and the possibility to discard transient interference that should not be evaluated. At the end of the paper, measurements carried out with the time-domain system are shown demonstrating the effectivity of the methodology. Keywords—electromagnetic interference, measuring receiver, time-domain measurements, railway I. INTRODUCTION The Electromagnetic Compatibility (EMC) assessment for Railway is carried out following the IEC 62236 / EN 50121 standard series [1], [2], which define the measurement procedure, the test site, the test conditions and the limits. The electromagnetic interference (EMI) emissions test for the complete vehicle is performed at an outdoors railway infrastructure, which implies important difficulties common with other in-situ measurements [3]-[4] due to the presence of non-stable background noise and varying interferences. Moreover, the rolling stock is evaluated in static conditions and in dynamic mode, circulating at low speed and accelerating and/or braking at the measurement point. This dynamic mode measurement is a challenge for the test technicians making sometimes unfeasible to acquire the worst emission mode and distinguish it from the Background Noise (BGN). Furthermore, according to the standards, transient interference produced by events like the discontinuity between the pantograph and the catenary should be ignored. This is an undesired phenomenon that usually appears when railway EMI assessment is performed [5], [6], [7]. These problems are emphasized by the use of traditional EMI receivers based on a Superheterodyne architecture. The frequency-sweep instrumentation measures the EMI spectrum- components at different observation time, doing hard to decide which measurement is caused by the rolling-stock, changes in the background noise or transient interferences. This limitation is even more critic if we consider the short-duration events like braking or acceleration that should be measured by the dynamic measurement. With the aim to overcome the problematics of the dynamic measurement, Annex B of EN 50121-3-1 explains the test procedure for in-motion measurements, defining the sweep time at different small frequency bands (Table I). Each sub-band is divided with the intention to reduce the sweep time and to be capable of catching the worst emission mode. TABLE I. FREQUENCY SWEEP CONFIGURATION ACCORDING TO EN 50121-3-1 ANNEX B. Band Test guide according to EN 50121-3-1 Annex B for dynamic measurements Subrange (Hz) Span (Hz) RBW (kHz) Sweep time (ms) B 150 k -1.15 M 1 M 9/10 37 1-11 M 10 M 9/10 370 10-20 M 10 M 9/10 370 20-30 M 10 M 9/10 370 C/D 30-230 M 200 M 100/120 42 200-500 M 300 M 100/120 63 500-1000 M 500 M 100/120 100 If we study Table I, the peak measurement is obtained at a rate of 37 ms to 100 ms, depending on the frequency sub-band. Nevertheless, this is the time elapsed to complete the full
Transcript of Full Time Domain EMI measurement system applied to Railway ...
978-1-4673-9698-1/18/$31.00©2018 IEEE
Full Time Domain EMI measurement system applied to Railway emissions according to
IEC 62236-3-1/EN 50121-3-1 standards
Marc Pous, Marco A. Azpúrua, José A. Oliva, Marc Aragón, Iván González and Ferran Silva Grup de Compatibilitat Electromagnètica
Universitat Politècnica de Catalunya Barcelona, Spain
email: [email protected]
Abstract—This paper studies the advantages of applying time-domain based instrumentation to conduct electromagnetic interference emissions from rolling-stock. In IEC 62236-3-1 or EN 50121-3-1 standards, it is mandatory to measure the railway vehicle in static and in-motion conditions. When conventional frequency sweep instrumentation is employed, difficulties regarding ambient noise variation and the short-duration of worst-case emission modes take place. In Annex B of the standard, a test procedure is described to acquire the worst-case EMI, however, as it is explained at the paper the effective measured time at each frequency is only 0.08 ms in some frequency bands. Hence, multiple movements of the vehicle are needed increasing the uncertainty of the measured source and making difficult to distinguish vehicle EMI from background noise interference. To solve this problem, a Full-TDEMI measurement system is proposed with the availability to increase the effective measured time, reduced the ambient noise variation, the usage of multiple antennas at the same time and the possibility to discard transient interference that should not be evaluated. At the end of the paper, measurements carried out with the time-domain system are shown demonstrating the effectivity of the methodology.
Keywords—electromagnetic interference, measuring receiver, time-domain measurements, railway
I. INTRODUCTION
The Electromagnetic Compatibility (EMC) assessment for Railway is carried out following the IEC 62236 / EN 50121 standard series [1], [2], which define the measurement procedure, the test site, the test conditions and the limits. The electromagnetic interference (EMI) emissions test for the complete vehicle is performed at an outdoors railway infrastructure, which implies important difficulties common with other in-situ measurements [3]-[4] due to the presence of non-stable background noise and varying interferences. Moreover, the rolling stock is evaluated in static conditions and in dynamic mode, circulating at low speed and accelerating and/or braking at the measurement point. This dynamic mode measurement is a challenge for the test technicians making sometimes unfeasible to acquire the worst emission mode and distinguish it from the Background Noise (BGN). Furthermore,
according to the standards, transient interference produced by events like the discontinuity between the pantograph and the catenary should be ignored. This is an undesired phenomenon that usually appears when railway EMI assessment is performed [5], [6], [7].
These problems are emphasized by the use of traditional EMI receivers based on a Superheterodyne architecture. The frequency-sweep instrumentation measures the EMI spectrum-components at different observation time, doing hard to decide which measurement is caused by the rolling-stock, changes in the background noise or transient interferences. This limitation is even more critic if we consider the short-duration events like braking or acceleration that should be measured by the dynamic measurement. With the aim to overcome the problematics of the dynamic measurement, Annex B of EN 50121-3-1 explains the test procedure for in-motion measurements, defining the sweep time at different small frequency bands (Table I). Each sub-band is divided with the intention to reduce the sweep time and to be capable of catching the worst emission mode.
TABLE I. FREQUENCY SWEEP CONFIGURATION ACCORDING TO EN 50121-3-1 ANNEX B.
Band
Test guide according to EN 50121-3-1 Annex B for dynamic measurements
Subrange (Hz) Span (Hz) RBW (kHz)
Sweep time (ms)
B
150 k -1.15 M 1 M 9/10 37
1-11 M 10 M 9/10 370
10-20 M 10 M 9/10 370
20-30 M 10 M 9/10 370
C/D
30-230 M 200 M 100/120 42
200-500 M 300 M 100/120 63
500-1000 M 500 M 100/120 100
If we study Table I, the peak measurement is obtained at a rate of 37 ms to 100 ms, depending on the frequency sub-band. Nevertheless, this is the time elapsed to complete the full

978-1-4673-9698-1/18/$31.00©2018 IEEE
sweep with the peak detector, meaning that we are only measuring one frequency point each 100 ms. Hence, the effective measurement time can be obtained by dividing the sweep-time of the sub-band by the number of points of the frequency sweep. To provide some data, in Table II the effective time is computed considering two different situations. The first one is when we are conducting a full dynamic measurement, since the train is coming, passing through the measurement point and leaving, this measurement usually lasts 30 s. Otherwise, for highlighting the inconvenience of using traditional superheterodyne receivers, another situation has been contemplated in Table II. This is the short-duration event column, where the observation time lasts around one second. This short-duration event is a plausible scenario as the maximum emissions generated by acceleration or deceleration could appear in less than a second.
TABLE II. EFFECTIVE MEASUREMENT TIME AT EACH FREQUENCY-POINT
Effective time measured (ms)
Subrange (Hz)
Measured points
time at each frequency
(ms)
Full dynamic measurement
30 s
Short-Event
duration 1s
time measured (%)
150 k -1.15 M
250 0.148 120 4 0.4
1-11 M 2500 0.148 12 0.4 0.04
10-20 M 2500 0.148 12 0.4 0.04
20-30 M 2500 0.148 12 0.4 0.04
30-230 M 5000 0.0084 6 0.2 0.02
200-500 M
7500 0.0084 4 0.13 0.013
500-1000 M
12500 0.008 2.4 0.08 0.0008
Considering Table II data, we are only measuring between 0.4 % and 0.008 % of the time depending on the sub-band evaluated. Elsewhere, if we consider a short-duration event of 1 s, this implies that we are only measuring 80 µs between 500 MHz and 1 GHz, which apparently seems improbable to ensure to catch the maximum emission. Therefore, usually, several movements of the vehicle are needed to acquire the worst emission mode, however, it causes a more complex assessment with more variability on the outdoors measurements. We should consider that between each time that the rolling stock circulates in front of the measurement point, several minutes could occur. Meaning that at the end several hours of measurement are elapsed and uncontrollable changes at the background noise appear, making sometimes difficult or impossible to associate the interference measured with the vehicle or with the changes at the BGN. Even more, as it has been mentioned before, we had to include the appearance of transient interference, which should be avoided from the evaluation.
Although the presence of Annex B at the standard, the problem is still present and the test technicians reported us their difficulties to identify the EMI produced by the rolling stock. Therefore, novel methodologies not based on traditional frequency-sweep instrumentation should be applied to improve the EMC evaluation. Fortunately, during the recent years, new software developments and the improvement of hardware capabilities make feasible to employ Real Time or Full-TDEMI
measurement systems. The time-domain systems based on Fast Fourier Transform (FFT) allows reducing the observation time increasing the effective measured time [8]-[11]. Additionally, the Full-TDEMI system has been successfully employed at in-situ measurements providing other advantages like the multi-channel synchronous measurements or the possibility to trigger the measurements with the time-domain data.
In the next section, the Full-TDEMI methodology is explained identifying the main advantages to be applied at the EN 50121-3-1 standard. Moreover, results obtained from a rolling stock evaluation using the novel methodology are presented in section III.
II. METHODOLOGY
A. Full-TDEMI Measurement system overview
Full-TDEMI measurement systems have been developed according to CISPR 16-1-1 and it is employed for conventional and in-situ emissions tests [11]-[13]. The system is based on acquiring the time-domain data of the EMI using oscilloscopes and thereafter compute the spectrum with the detectors defined at CISPR 16-1-1 standard. A basic schematic of the measurement system is shown in Fig. 1.
EMI conditioning
OSC/ADC
Hardware
DSP
Software
AMP / FILTER
Transducers
LISN
Fig. 1. Overview of the Full-TDEMI measurement system
The transducers of the Full-TDEMI measurement system are connected to one or several channels, as oscilloscopes have the capability to measure synchronously multiple inputs. For the railway application, the transducers are the antennas to measure the Magnetic Field (H-field) or the Electric Field (E-Field), nevertheless, other transducers like Line Impedance Stabilization Networks are suitable to be used.
Regarding the oscilloscope, it limits the measurement bandwidth; consequently, it needs to ensure that the Voltage Standing Wave Ratio (VSWR) is less than 2 within all the measurable frequency range. Otherwise, the memory of the scope and the sample rate are the other key-points of the hardware. To fulfill CISPR 16-1-1 requirements, generally, it is necessary to oversample the time-domain signal five times the maximum measured frequency and to use the memory needed to compute the weighting detectors. The scopes used to obtain the results presented at the next section are a 5444B Picoscope® (OSC1) for measurements at A and B bands and a DPO 5104B Tektronix® (OSC2) employed at C and D bands. The OSC1 is sampling at 250 MSamples/s and the OSC2 at 5 GSamples/s.
Finally, all the post-processing tasks are done with a laptop, where the software is conducting windowing, resolution enhancing, resampling, spectral estimation (using the Short-Time FFT and the Welch’s method) and the detector emulation.

978-1-4673-9698-1/18/$31.00©2018 IEEE
B. Effective time improvement using Full-TDEMI systems
As it has been stated in the introduction section, the effective measured time is extremely low when frequency sweep instrumentation is used. With the Full time-domain methodology, we can improve the dwell time at each frequency as we are obtaining the full spectrum at every acquisition. Hence, the final effective time, using the Full-TDEMI, is the time set at the scope multiplied by the number of acquisitions. Clearly, we have some idle time between different trigger events due to deep memory acquisitions transfer data to the Personal Computer (PC).
A study has been completed analyzing the optimum time scale and data-transfer time to maximize the total evaluated time. Considering that the detector employed for dynamic measurement is the peak one, short-time captures are allowed to compute the spectrum. In tables III and IV, it is presented the effective time measured by Full-TDEMI system, compared with the frequency sweep, highlighting the gain, which is referred to the total time measured by the Full-TDEMI instrumentation divided by the total time at each frequency by the frequency sweep instrumentation. In table III, the Full-TDEMI is optimized to measure an entire dynamic movement that usually lasts 30 seconds and in table IV the system is adjusted to acquire a worst-case event that lasts one second.
TABLE III. EFFECTIVE MEASUREMENT TIME CONSIDERING A DYNAMIC MEASUREMENT THAT LASTS 30 S
(ms) (a) % (ms) % Gain (b) (ms) % Gain (b)48 0,160 112,5 23,75
24 0,080 225 47,5
120 0,400 4,5 9,5
12 0,040 45 95
12 0,040 45 95
12 0,040 45 95
C 6 0,020 207,9 0,69 34,65
4 0,013 10,40
2,4 0,008 17,33
Frequency band
according to
CISPR16‐1‐1
A 5400 18
1140
Frequency sweep OSC 2 OSC 1
B 540 1,8
3,8
D 41,58 0,14
a. Measured time at each frequency for sweep (see Table II) b. Gain is referred to the total time measured by the Full-TDEMI instrumentation divided by the total time
at each frequency for the sweep method
In Table III it is observed that a gain between 4.5 and 95 times on the equivalent measured time is obtained with the Full-TDEMI system. In B-Band, we increase the measured time at each frequency by 95 times with OSC1 and 45 times with OSC2. Therefore, with a single dynamic measurement, we measure the same effective-time as moving the vehicle 95 times with the frequency sweep method. Moreover, in C-Band the improvement is close to 35 times and in D-Band it is between 10 and 17 times. For instance, in D-Band we increase the effective time from 2.4 ms to a 41.58 ms, when the 30 s measurement is analysed.
Alternatively, if the objective is to evaluate a short-duration braking or accelerating event, it is recommended to increase the acquisition time set at the scope, being able to rise the percentage of the effective time. In Table IV, the observation time has been reduced from 30 s to 1 s, but at the same time, we are capable to enlarge the effective-time as the data-transfer to the PC is not a penalty.
TABLE IV. EFFECTIVE MEASUREMENT TIME CONSIDERING A SHORT-DURATION EVENT THAT LASTS 1 S
(ms) (a) % (ms) % Gain (b) (ms) % Gain (b)1,60 0,160 625 625
0,80 0,080 1250 1250
4,00 0,400 25 250
0,40 0,040 250 2500
0,40 0,040 250 2500
0,40 0,040 250 2500
C 0,20 0,020 50 5 250
0,13 0,013 75
0,08 0,008 125D 10 1
OSC 2 OSC 1
A 1000 100
1000 100
B 100 10
Frequency band
according to
CISPR16‐1‐1
Frequency sweep
a. Measured time at each frequency for sweep (see Table II)
b. Gain is referred to the total time measured by the Full-TDEMI instrumentation divided by the total time at each frequency for the sweep method
In this occasion, when we are employing OSC2 in B-Band, we are capable to observe the 100% of the short-event. Making feasible not to miss the worst-case emission. At this frequency band, we improve from observing only 0.4 ms to 1000 ms with OSC1 and 100 ms with OSC2, meaning a gain up to 2500 times. Otherwise, the gain in C and D bands are between 75 and 250. Therefore, the Full-TDEMI system is a remarkable step-forward in terms of effective time measured at each frequency, compared with the sweep times defined in Annex B of EN 50121-3-1. Furthermore, other advantages take place when the Full-TDEMI system is used, some of them related to the increase of the effective time measured.
C. Advantages of using Full-TDEMI systems instead of frequency sweep receivers
Applying Full-TDEMI measurement system to measure rolling stocks implies different advantages as a consequence of increasing the measurement effective-time and the use of multiple synchronous channels.
Simultaneous Multi-antenna measurements. The employment of scopes instead of spectrum analyzers or EMI receivers allows us to conduct multiple-channel synchronous measurements. Therefore, multi-antenna set-up is used in parallel to measure H-Field and E-Field, reducing the number of vehicle movements needed. Moreover, the simultaneous measurement ensures to obtain the radiated emissions for the same functional mode at all the frequency bands, making possible to acquire the worst-case at all the frequency ranges with a single movement of the rolling stock.
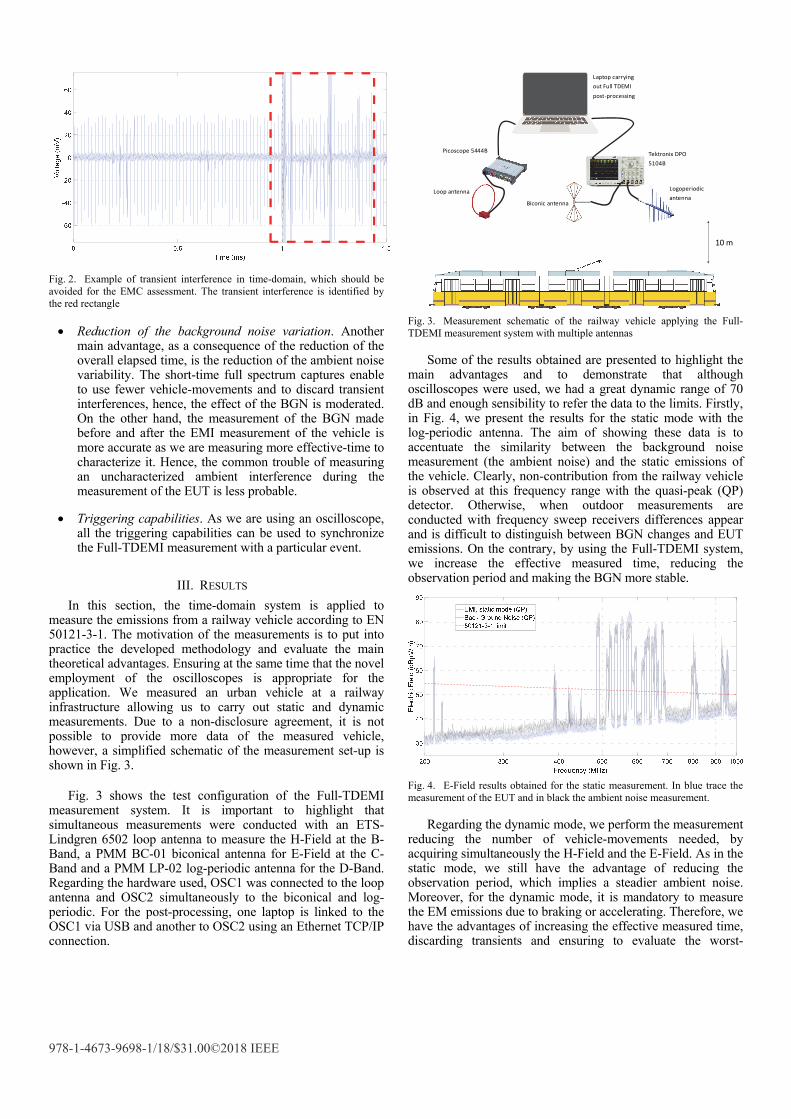
Availability to discard transient interference. Another great advantage is to eliminate from the useful data broadband transient interference produced by transients like pantograph discontinuities. This type of impulsive noise is difficult to identify at the spectrum domain. However, in time-domain, transient interference is characterized by huge amplitude and a short-duration. Therefore, the transient interference is clearly observed in the time domain and can be discarded without a doubt. An example of a discarded measured is shown in Fig. 2, where we can identify easily the transient interference. This short-time domain acquisition shall be discarded for the final analysis, as it is described in standards.
978-1-4673-9698-1/18/$31.00©2018 IEEE
Fig. 2. Example of transient interference in time-domain, which should be avoided for the EMC assessment. The transient interference is identified by the red rectangle
Reduction of the background noise variation. Another main advantage, as a consequence of the reduction of the overall elapsed time, is the reduction of the ambient noise variability. The short-time full spectrum captures enable to use fewer vehicle-movements and to discard transient interferences, hence, the effect of the BGN is moderated. On the other hand, the measurement of the BGN made before and after the EMI measurement of the vehicle is more accurate as we are measuring more effective-time to characterize it. Hence, the common trouble of measuring an uncharacterized ambient interference during the measurement of the EUT is less probable.
Triggering capabilities. As we are using an oscilloscope, all the triggering capabilities can be used to synchronize the Full-TDEMI measurement with a particular event.
III. RESULTS
In this section, the time-domain system is applied to measure the emissions from a railway vehicle according to EN 50121-3-1. The motivation of the measurements is to put into practice the developed methodology and evaluate the main theoretical advantages. Ensuring at the same time that the novel employment of the oscilloscopes is appropriate for the application. We measured an urban vehicle at a railway infrastructure allowing us to carry out static and dynamic measurements. Due to a non-disclosure agreement, it is not possible to provide more data of the measured vehicle, however, a simplified schematic of the measurement set-up is shown in Fig. 3.
Fig. 3 shows the test configuration of the Full-TDEMI measurement system. It is important to highlight that simultaneous measurements were conducted with an ETS-Lindgren 6502 loop antenna to measure the H-Field at the B-Band, a PMM BC-01 biconical antenna for E-Field at the C-Band and a PMM LP-02 log-periodic antenna for the D-Band. Regarding the hardware used, OSC1 was connected to the loop antenna and OSC2 simultaneously to the biconical and log-periodic. For the post-processing, one laptop is linked to the OSC1 via USB and another to OSC2 using an Ethernet TCP/IP connection.
10 m
Tektronix DPO
5104B
Picoscope 5444B
Loop antenna
Biconic antenna
Logoperiodic
antenna
Laptop carrying
out Full TDEMI
post‐processing
Fig. 3. Measurement schematic of the railway vehicle applying the Full-TDEMI measurement system with multiple antennas
Some of the results obtained are presented to highlight the main advantages and to demonstrate that although oscilloscopes were used, we had a great dynamic range of 70 dB and enough sensibility to refer the data to the limits. Firstly, in Fig. 4, we present the results for the static mode with the log-periodic antenna. The aim of showing these data is to accentuate the similarity between the background noise measurement (the ambient noise) and the static emissions of the vehicle. Clearly, non-contribution from the railway vehicle is observed at this frequency range with the quasi-peak (QP) detector. Otherwise, when outdoor measurements are conducted with frequency sweep receivers differences appear and is difficult to distinguish between BGN changes and EUT emissions. On the contrary, by using the Full-TDEMI system, we increase the effective measured time, reducing the observation period and making the BGN more stable.
Fig. 4. E-Field results obtained for the static measurement. In blue trace the measurement of the EUT and in black the ambient noise measurement.
Regarding the dynamic mode, we perform the measurement reducing the number of vehicle-movements needed, by acquiring simultaneously the H-Field and the E-Field. As in the static mode, we still have the advantage of reducing the observation period, which implies a steadier ambient noise. Moreover, for the dynamic mode, it is mandatory to measure the EM emissions due to braking or accelerating. Therefore, we have the advantages of increasing the effective measured time, discarding transients and ensuring to evaluate the worst-

978-1-4673-9698-1/18/$31.00©2018 IEEE
emission case. In Fig. 5 and Fig. 6 dynamic results of the B-Band and the C-Band are displayed.
Fig. 5. H-Field results obtained for the dynamic measurement. In blue trace the measurement of the EUT and in black the ambient noise measurement
Ele
ctric
Fie
ld (
dBV
/m)
Fig. 6. E-Field results obtained for the dynamic measurement. In blue trace the measurement of the EUT and in black the ambient noise measurement
The emissions results of the vehicle in-motion show disturbances at the lower frequencies, which are properly measured with the Full-TDEMI. In fact, we carried out up to 10 movements of the train, however, non-changes were observed at the spectrum between the first measurement and the other nine. Implying that with a unique movement of the rolling-stock it is sufficient to measure the worst-case emission at all the frequency range. This is a great advantage compared with the difficulties that appear when conventional receivers are employed, making essential to move the train several times to complete the spectrum emissions. Furthermore, the background noise is also changing and it makes near to impossible to differentiate between the vehicle emissions and the ambient noise. Hence, it is a significant improvement to use the time-domain approach as it makes necessary to measure just once the vehicle in motion to perform the evaluation.
IV. CONCLUSIONS
The applicability of the Full-TDEMI system to conduct properly EN 50121-3-1 EMI measurements has been demonstrated theoretically and practically through in-situ measurements. Overcoming the main difficulties due to the background noise and the mandatory dynamic mode. The main advantages of the Full-TDEMI are the increasing of the effective measured time at each frequency, which can rise up to 2500 times, the availability of employing multiple antennas
synchronously and the possibility to discard transient interference that should not be evaluated.
Therefore, authors consider time-domain methodologies should be included in Annexes of the railway standards. Novel time-domain based systems are in compliance with CISPR 16-1-1, henceforward, a specific guide should be included to maximize the performance and explain the main benefits of the system, as it is done in Annex B for frequency sweep instrumentation. Furthermore, the Full-TDEMI systems offer us the possibility to measure properly the worst-case scenario using instrumentation with a moderate cost, where the most expensive hardware is the 1 GHz oscilloscope.
ACKNOWLEDGMENT
This work was supported in part by the EURAMET 15RPT01 research project (the EMPIR is jointly funded by the EMPIR participating countries within EURAMET and the European Union), by the Spanish “Ministerio de Economía, Industria y Competitividad,” under project TEC2016-79214-C3-2-R (AEI/FEDER, UE), by the “Secretaria d’Universitats i Recerca del Departament d’Economia i Coneixement de la Generalitat de Catalunya” and the European Social Fund and The author(s) would like to acknowledge the contribution of the COST Action IC1407 ‘ACCREDIT’.
REFERENCES [1] IEC 62236-3-1 Railway applications - Electromagnetic compatibility -
Part 3-1: Rolling stock - Train and complete vehicle. IEC
[2] CENELEC - EN 50121-3-1: Railway applications - Electromagnetic compatibility - Part 3-1: Rolling stock - Train and complete vehicle. CENELEC
[3] J. Catrysse, F. Vanhee, J. Knockaert, I. Hendrickx and V. Beauvois, "In situ testing of large machines: Alternative methods for conducted emission measurements," Electromagnetic Compatibility, 2008. EMC2008. IEEE International Symposium on, Detroit, MI, 2008, pp. 1-6
[4] M. Pous, M. Azpúrua and F. Silva, "Benefits of full time-domain EMI measurements for large fixed installation," 2016 International Symposium on Electromagnetic Compatibility - EMC EUROPE, Wroclaw, 2016, pp. 514-519.
[5] G. Romero, E. P. Simon, V. Deniau, C. Gransart and M. Kousri, "Evaluation of an IEEE 802.11n communication system in presence of transient electromagnetic interferences from the pantograph-catenary contact," 2017 XXXIInd General Assembly and Scientific Symposium of the International Union of Radio Science (URSI GASS), Montreal, QC, 2017, pp. 1-4.
[6] S. Dudoyer, V. Deniau, S. Ambellouis, M. Heddebaut and A. Mariscotti, "Classification of Transient EM Noises Depending on their Effect on the Quality of GSM-R Reception," in IEEE Transactions on Electromagnetic Compatibility, vol. 55, no. 5, pp. 867-874, Oct. 2013.
[7] M. Pous, M. A. Azpúrua, and F. Silva, “Radiated transient interferences measurement procedure to evaluate digital communication systems,” in 2015 IEEE International Symposium on Electromagnetic Compatibility (EMC), 2015, pp. 456–461.
[8] S. Braun, T. Donauer, and P. Russer, “A real-time time-domain EMI measurement system for full-compliance measurements according to CISPR 16-1-1,” IEEE Trans. Electromagn. Compat., vol. 50, no. 2, pp. 259–267, 2008.
[9] C. Hoffmann and P. Russer, “A real-time low-noise ultrabroadband time-domain EMI measurement system up to 18 GHz,” IEEE Trans. Electromagn. Compat., vol. 53, no. 4, pp. 882–890, 2011.
[10] F. Krug and P. Russer, “The time-domain electromagnetic interference measurement system,” IEEE Trans. Electromagn. Compat., vol. 45, no. 2, pp. 330–338, 2003.
978-1-4673-9698-1/18/$31.00©2018 IEEE
[11] M. A. Azpúrua, M. Pous, and F. Silva, “A measurement system for radiated transient electromagnetic interference based on general purpose instruments,” in IEEE International Symposium on Electromagnetic Compatibility (EMC), 2015, vol. 2015–Septm.
[12] M. A. Azpúrua, M. Pous, S. Çakir, M. Çetinta, and F. Silva, “Improving time-domain EMI measurements through digital signal processing,” IEEE Electromagn. Compat. Mag., vol. 4, no. 2, pp. 82–90, 2015.
[13] M. A. Azpúrua, M. Pous, J. A. Oliva, and F. Silva, “Fast and automated verification of multi-channel full time-domain EMI measurement system,” in 2017 IEEE International Instrumentation and Measurement Technology Conference (I2MTC), 2017, pp. 1–6