FULL-SCALE FLAMMABILITY MEASURES - nvlpubs.nist.gov · burning item that threatened to ignite the...
53
NIST Technical Note 1461 Full-Scale Flammability Measures for Electronic Equipment Matthew Bundy Thomas Ohlemiller
Transcript of FULL-SCALE FLAMMABILITY MEASURES - nvlpubs.nist.gov · burning item that threatened to ignite the...

NIST Technical Note 1461
Full-Scale Flammability Measures for Electronic Equipment
Matthew BundyThomas Ohlemiller
NIST Technical Note 1461
Full-Scale Flammability Measures for Electronic Equipment
Matthew BundyThomas Ohlemiller
Fire Research DivisionBuilding and Fire Research Laboratory
Gaithersburg, MD
August 2004
Phillip J. Bond,
National Institu
U.S. Department of CommerceDonald L. Evans, Secretary
Technology Administration
Under Secretary for Technology
te of Standards and TechnologyArden L. Bement, Jr., Director

Certain commercial entities, equipment, or materials may be identified in this document in order to describe an experimental procedure or concept adequately. Such
identification is not intended to imply recommendation or endorsement by the National Institute of Standards and Technology, nor is it intended to imply that the entities, materials, or equipment are necessarily the best available for the purpose.
National Institute of Standards and Technology Technical Note 1461Natl. Inst. Stand. Technol. Tech. Note 1461, 46 pages (August 2004)
CODEN: NTNOEF
U.S. GOVERNMENT PRINTING OFFICEWASHINGTON: 2004
_________________________________________
For sale by the Superintendent of Documents, U.S. Government Printing OfficeInternet: bookstore.gpo.gov — Phone: (202) 512-1800 — Fax: (202) 512-2250
Mail: Stop SSOP, Washington, DC 20402-0001

Executive Summary
An experimental study of the bench-scale fire performance of eighteen different commercial polymeric materials was previously conducted by the National Institute of Standards and Technology. The results of that study described the ignition resistance, self-extinguishing behavior, heat release rate (HRR), and combustion product yields of these materials using three standard bench-scale fire tests. The current report details the second of a two part study in which the relationship between bench-scale and full-scale fire performance was examined. Five of the eighteen materials characterized in the bench-scale study were examined here in the form of 19” computer monitor housings. The ignition resistance, fire growth rate and threat to surrounding objects were characterized using several ignition methods. While the objects studied here were computer monitor enclosures and keyboards, the qualitative conclusions should apply to other electronic equipment that could be similarly ignited, such as printers or other peripherals, as well as TV sets, that are enclosed in similar housings. Four of the monitor enclosures were molded using UL94 V-class (V-0, V-1, V-2) plastics; these did not yield sustained ignition when exposed to a small open flame ignition source (a 38 W needle flame, height=20 mm). The one UL94 HB rated monitor enclosure was easily ignited using the needle flame and resulted in a peak HRR of (200 ± 25) kW. The threat of fire spread to surrounding objects (i.e., the farthest distance at which piloted ignition could occur) was determined using the measured radiant heat flux distribution near the fires. The ignition threat distance for this fire was found to be (58 ± 15) cm for piloted ignition of a stack of paper and (112 ± 28) cm for ignition of insulated cotton fabric. A UL94 HB rated polystyrene keyboard was also tested using a small open flame ignition source resulting in a measured peak HRR of (23 ± 3) kW. The fire resulting from ignition of a keyboard was used as a more severe ignition source for the monitor housings. The specimen using a V-2 class polypropylene material clearly posed the most significant fire hazard of the V-class specimens in this scenario. The peak HRR and ignition threat distances for this monitor were almost identical to the HB monitor exposed to the smaller ignition source, but due to the low viscosity of the V-2 monitor the polymer melt pool had greater potential for transport away from the original specimen footprint. Only one of the monitor specimens, the V-0 ABS (brominated FR), did not result in significant fire propagation away from the keyboard. A radiant heat panel was used as a well controlled heat flux source to simulate an existing burning item that threatened to ignite the computer monitor. A 21 kW/m2 heat flux was imposed by the panel on the side area of the monitor where a localized open flame was also applied. This combination resulted in ignition and significant flame spread for each of the monitor specimens. The relative performance of the specimens in this test series was consistent with that in the keyboard fire ignition tests. These tests demonstrated that even highly flame retarded materials can contribute to the HRR of an existing fire. A main objective of this study was to assess the accuracy of the bench scale tests in predicting full scale fire performance. For the materials considered here the UL94 test accurately predicted the self extinguishing behavior of the full-scale specimens exposed to the needle flame ignition source, but provided limited information on the response to the two larger ignition sources. A reasonable qualitative correlation was observed between the Cone Calorimeter results and full-scale peak HRR for the radiant panel ignition tests, but the relationship between the Cone test results and the response of the full-scale specimen to the needle flame ignition source was less obvious.
Previous bench scale testing demonstrated little correlation between UL94 and Cone Calorimeter performance. This was partly attributed to the sample orientation in the standard Cone tests, which do not capture the vertical flame spread and melting observed in the UL94 test and in many real fire scenarios. For these reasons additional Cone testing was performed in which the sample configuration was modified to capture the dynamics of a developing melt/drip pool fire. The results of the melt/drip Cone Calorimeter were able to show both the self extinguishing response of the full scale specimens to the needle flame ignition method and the qualitative fire growth when exposed to a larger ignition source. The melt/drip Cone test correlates rather loosely with full scale tests, however, and there is a continuing need for a better bench-scale test. As a result, a full-scale test remains the only certain way to obtain a definitive measure of fire hazard. A secondary objective of this study was to provide empirical evidence that could be used to support a standard setting the maximum allowable peak HRR for electronic equipment assemblies. The 200 kW fire resulting from the needle flame ignition of the HB monitor specimen would be a serious fire hazard in any home or office. The 23 kW fire resulting from the ignition of a keyboard would be a threat to any item in close contact (such as a monitors used in this study), and was shown to have an ignition threat radius of up to 27 cm for an item such as an upholstered office chair. A peak HRR of less than 10 kW would reduce the radiant ignition threat radius to less than 12 cm.
ii

Acknowledgements The authors would like to thank Scott Dillon and Ken Steckler from the ATF Fire
Research Laboratory for their assistance in performing the full-scale experiments. Randy Shields was instrumental in setting up and helping to carry out the Cone Calorimeter melt/drip fire tests.
Special thanks are given to the following companies for their generous donation of materials and resources to this project: The Dow Chemical Company, Albemarle Corp., Polyone Corp., Cheil Industries, and Underwriters Laboratories Inc.
The following individuals are acknowledged for their participation: Sanghyun Hong, Alex Morgan, Tony Kingsbury, Susan Landry, Douglas Wetzig, Robert Backstrom, David Edenburn, Robert Grifffin, Gordon Nelson, Edward Watt, Michael Smith, Richard Harris, Takashi Kashiwagi, Jeffrey Gilman and Richard Lyon.
iii

Table of Contents
Executive Summary ......................................................................................................... iv Acknowledgements .......................................................................................................... iii Introduction....................................................................................................................... 1 Background ....................................................................................................................... 1 Description of Full-Scale Calorimeter ............................................................................ 3 Description of Full-Scale Experiments............................................................................ 7
Full Scale Resins ............................................................................................................. 7 Full Scale Test Specimens............................................................................................... 7 Ignition Methods.............................................................................................................. 8
Small local ignition source........................................................................................... 8 Large ignition source (radiant heat panel) .................................................................. 9 Large ignition source (polystyrene keyboard) ........................................................... 11
Experimental Setup........................................................................................................ 12 Results .............................................................................................................................. 15
Needle Flame Ignition Results ...................................................................................... 15 Keyboard Fire Ignition Results...................................................................................... 17 Radiant Heat Panel Ignition Results.............................................................................. 21 Threat of Ignition of Other Objects ............................................................................... 25 Modified Cone Calorimeter Tests ................................................................................. 37
Bench-Scale and Full-Scale Comparison ...................................................................... 42 Conclusions ...................................................................................................................... 44 References ........................................................................................................................ 45
iv
Introduction This report describes an experimental investigation by NIST to study the fire hazard of electronic equipment having thermoplastic enclosures. This work was part of the project titled “Flammability Measures for Electronic Equipment” which was supported under the NIST “Reduced Risk of Flashover” program. It was one of several related projects aimed at studying fire growth and spread on real materials. Consumer electronics are ubiquitous in today’s society. The fact that fires originating from consumer electronic equipment represent less than one percent of all residential fires in the United States is largely credited to the use of flame retardant plastics. Although fires originating within these items are rare, the hazard presented when exposed to a small external ignition source (such as a candle) is not well known. Even when the equipment is not the first item involved in a fire its contribution to the total fire load and impact on flashover of a room can be significant. Both of these issues are important due to an increasing number of both candles and electronics in the home. It should also be noted that in recent years the number of electronic fires has increased in many European countries following a reduction in the use of some flame retardant compounds due to environmental concerns [1]. It is anticipated that this trend could follow in the United States. The objective of this work is to relate the full-scale flammability and fire hazard of consumer electronics assemblies having enclosures made from different resin formulations to bench-scale fire performance of these resins. A research consortium was established between NIST, UL, Dow, Polyone, Albemarle and Samsung Cheil to conduct this research. Eighteen commercial resins were evaluated using three different standard bench-scale flammability tests. Based on the bench-scale test results, five of these resins were molded into 19” computer monitor housings and examined in full-scale fire tests that measured the overall heat release rate (HRR) and the heat flux threat to the surroundings. The selection of these materials was based on HRR, UL94 performance and physical burning behavior such as melting and charring. The results are compared and contrasted to bench-scale results from a previous study [2] to infer useful guidelines. There is a current international effort (IEC TC108) to develop a hazard based standard for electronic equipment. This report aims to provide useful data to help determine standard requirements.
Background A number of previous studies have examined the fire performance of electronic equipment. A comprehensive study was sponsored by the Society of the Plastic Industry (SPI) in 1981 [3] that rated the relative performance of 5 flame retarded plastic materials (UL94 V-0 and V-1) using 10 different bench-scale fire tests and compared the ranked performance to the fire performance of model electronic enclosures exposed to a 3 kW propane sand burner. The results showed reasonable qualitative agreement between the overall bench-scale and full-scale performance. The Flame Retardant Chemical Association (FRCA) sponsored a study by the National Bureau of Standards (NBS) in 1988 [4] that showed a significant reduction in the fire hazard of TV cabinets using flame retardant materials. Several reports [5,6,7,8] by the Swedish National Testing and Research Institute (SP) and the National Association of Fire Marshals (NASFM) compared the fire growth of off the shelf printers, computer monitors and CPU’s to the UL94 ranking of the enclosure material and
1
concluded that enclosures using HB rated plastics are vulnerable to ignition by a small flame and can lead to flashover of a room. The fire growth from ignition of a European television using a 1 kW flame was reported by the Technical Research Centre of Finland (VTT) [9] resulting in a peak HRR of over 250 kW. A study funded by the European Flame Retardants Association (EFRA) examined the fire safety of TV sets and computer monitors sold in Europe, the United States and Japan [10] and demonstrated the reduced fire safety level of products sold in Europe. A 1998 report [11] by the U.S. Consumer Product Safety Commission (CPSC) compared the UL94 performance of materials sampled from off the shelf electrical appliance enclosures and UL746C end product fire test results. Appliances using HB rated materials were reported to provide inadequate fire safety when exposed to both internal and external ignition sources. In 2000 Safety Engineering Laboratories (SEL) prepared a report for the Consumer Electronics Association (CEA) [12] that described fire testing of 15 TV sets with UL94 V-0 plastics enclosures and one UL94 HB enclosure TV set. The conclusion was that TV sets sold in the US have adequate fire safety levels due to the required used of V-0 materials. The contribution of a computer terminal to the fire development in an office workstation was considered as part of a NIST/GSA study [13]. Cone calorimeter data were used in a model to predict the fire growth. The fire hazard of the computer was not the focus of this study. A statistical risk analysis for fires involving electrical appliance enclosures was performed in 2002 [14]. The author states that, based on the statistical evidence in the US, fires involving electronic equipment enclosures are relatively low (compared to other equipment) and do not warrant any urgent change in current standards and regulations in the United States. The flammability of fire retarded (FR) styrene resins was studied in the context of monitor and TV housings [15]. UL94, Cone Calorimeter and limited oxygen index (LOI) bench-scale data were compared to the qualitative burning of the housings when exposed to three different ignition n sources. The results showed that the UL94 and Cone data were good indicators of full-scale behavior and the V-0 and V-1 resins resisted sustained ignition in all the tests, while the HB and V-2 resins exhibited significant fire spread.
2

Description of Full-Scale Calorimeter All full scale tests were performed using the 3 m square exhaust hood located at the Alcohol Tobacco and Firearms (ATF) Fire Research Laboratory in Beltsville, Maryland. This facility was designed to accommodate sustained fires with a net heat release rate (HRR) of up to 1MW. A schematic of the exhaust flow configuration is shown in Figure 1. The exhaust mass flow rate was set to 2 kg/s (≈3600 SCFM) for these tests to provide optimal resolution for fires less than 400 kW in size. An active control damper was used to maintain a constant mass flow rate. The exhaust flow rate was measured using a bi-directional probe and 2 thermocouples. An orifice plate located just downstream of the duct inlet was used to insure adequate mixing and flow uniformity. A perforated tube was used to sample the gas across the exhaust duct. A paramagnetic gas analyzer was used to determine the composition of oxygen in the exhaust flow. The carbon dioxide and carbon monoxide compositions were measured using an infrared absorption analyzer. The exhaust sample gas stream was dried and filtered before entering the analyzers. A pollution control smoke abatement system was used to clean the exhaust gases before they entered the atmosphere. Heat release rate measurements were based on the well established oxygen consumption principle [16,17]. This principle states that for a wide range of materials (13.1 ± 0.35) kJ of energy is released for each gram of oxygen consumed by combustion. The energy contribution due to the formation of CO was also taken into account for these measurements. For calibration tests using natural gas a more specific value of 12.55 kJ/g was used for the heat of combustion per mass of O2. The exact form of the equations used for calculating the heat release rate can be found in reference [18]. The heat release and exhaust flow measurements were calibrated using the natural gas sand burner shown in Figure 2. The calibration burner consisted of a 23 cm square steel box filled with course gravel and a 5 cm layer of sand. The results from 7 different calibration tests over a three week period, during which all fire tests were conducted, are shown in Figure 3. Each of the data points in this figure represents an 8.5 min average during a period of steady heat release rate from the burner. The HRR plot for an individual calibration is given in Figure 4. The burner heat release rate was calculated using the following equation: q .
The volumetric flow rate, V , was measured using a dry test meter. The relative standard uncertainty of the proving volume time was less than ± 1 %. The net heat of combustion of the natural gas, = (48.4 ± 0.3) MJ/kg, was determined using the average fuel composition from a series of gas chromatograph reports attained from the local utility company during the 3 week test period. Methane was the main component with a volume fraction of (94.94 ± 0.59) %. The natural gas density,
lNGcNGNGburner HV ,∆= && ρ
NG&
lNGcH ,∆
NGρ , was calculated using the ideal gas law with measured temperature and pressure and using a molecular weight of 17.05 g/mol from the gas composition. A propagation of uncertainty analysis of the calibration gas burner data at 255 kW resulted in a combined expanded relative uncertainty (95 % confidence level) of 2.5 % for the burner heat release rate. The exhaust flow rate can be a large component of the total uncertainty in the HRR measurement due to a non-uniform duct velocity profile and a 5 % relative accuracy of the bi-directional probe constant [19]. The slope of the linear regression analysis of the calibration data in Figure 3 was found to be 0.9409 ± 0.003. It was assumed that the difference between the
3
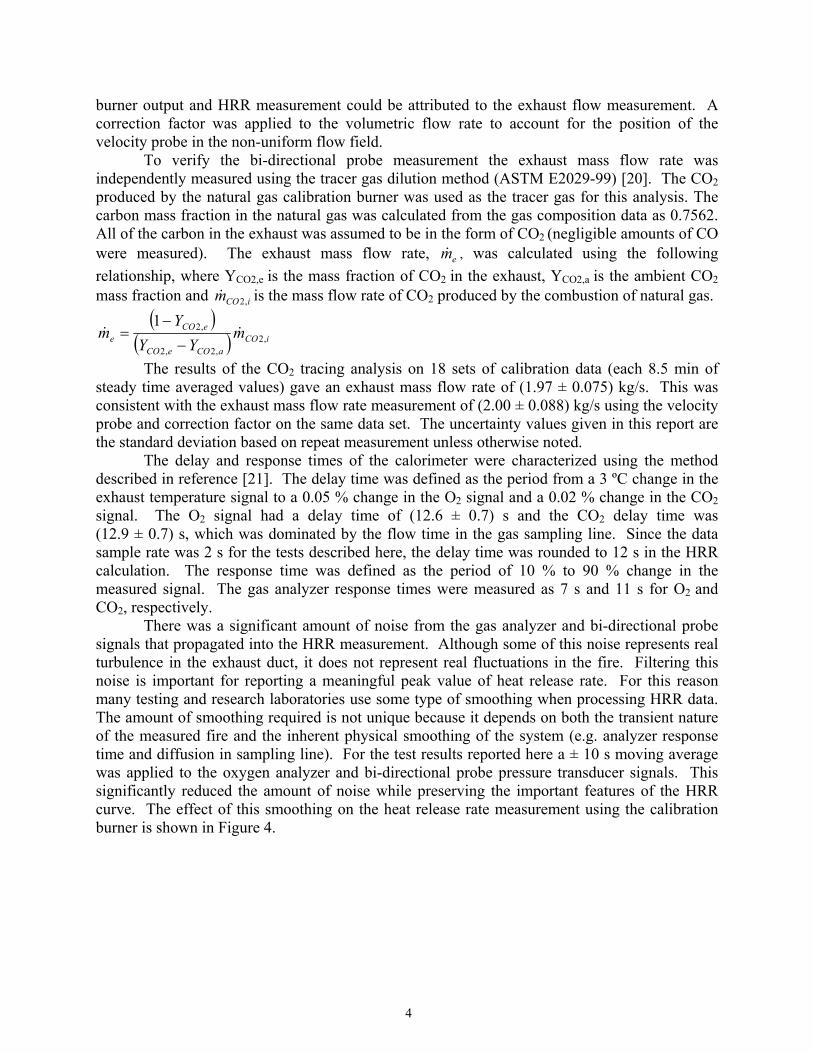
burner output and HRR measurement could be attributed to the exhaust flow measurement. A correction factor was applied to the volumetric flow rate to account for the position of the velocity probe in the non-uniform flow field. To verify the bi-directional probe measurement the exhaust mass flow rate was independently measured using the tracer gas dilution method (ASTM E2029-99) [20]. The CO2 produced by the natural gas calibration burner was used as the tracer gas for this analysis. The carbon mass fraction in the natural gas was calculated from the gas composition data as 0.7562. All of the carbon in the exhaust was assumed to be in the form of CO2 (negligible amounts of CO were measured). The exhaust mass flow rate, , was calculated using the following relationship, where Y
em&CO2,e is the mass fraction of CO2 in the exhaust, YCO2,a is the ambient CO2
mass fraction and is the mass flow rate of COiCOm ,2& 2 produced by the combustion of natural gas. ( )
( ) iCOaCOeCO
eCOe m
YYY
m ,2,2,2
,21&&
−
−=
The results of the CO2 tracing analysis on 18 sets of calibration data (each 8.5 min of steady time averaged values) gave an exhaust mass flow rate of (1.97 ± 0.075) kg/s. This was consistent with the exhaust mass flow rate measurement of (2.00 ± 0.088) kg/s using the velocity probe and correction factor on the same data set. The uncertainty values given in this report are the standard deviation based on repeat measurement unless otherwise noted.
The delay and response times of the calorimeter were characterized using the method described in reference [21]. The delay time was defined as the period from a 3 ºC change in the exhaust temperature signal to a 0.05 % change in the O2 signal and a 0.02 % change in the CO2 signal. The O2 signal had a delay time of (12.6 ± 0.7) s and the CO2 delay time was (12.9 ± 0.7) s, which was dominated by the flow time in the gas sampling line. Since the data sample rate was 2 s for the tests described here, the delay time was rounded to 12 s in the HRR calculation. The response time was defined as the period of 10 % to 90 % change in the measured signal. The gas analyzer response times were measured as 7 s and 11 s for O2 and CO2, respectively. There was a significant amount of noise from the gas analyzer and bi-directional probe signals that propagated into the HRR measurement. Although some of this noise represents real turbulence in the exhaust duct, it does not represent real fluctuations in the fire. Filtering this noise is important for reporting a meaningful peak value of heat release rate. For this reason many testing and research laboratories use some type of smoothing when processing HRR data. The amount of smoothing required is not unique because it depends on both the transient nature of the measured fire and the inherent physical smoothing of the system (e.g. analyzer response time and diffusion in sampling line). For the test results reported here a ± 10 s moving average was applied to the oxygen analyzer and bi-directional probe pressure transducer signals. This significantly reduced the amount of noise while preserving the important features of the HRR curve. The effect of this smoothing on the heat release rate measurement using the calibration burner is shown in Figure 4.
4

3.0 m x 3.0 m square hood
0.655 m I.D. exhaust duct
2.1 m
4.15 m
floor
0.365 m I.D. orifice plate
Gas sampling tube Bi-directional probe & thermocouples
10.0 m
Ceiling
Mezzanine
Main Exhaust Flow
Flow control damper Instrumentation Room
0.67 m
4.1 m 4.4 m
2.9 m
Figure 1. Schematic drawing of exhaust hood and instrumentation.
Figure 2. Natural gas calibration burner (HRR ≈ 275 kW)
5

y = 0.9409xR2 = 0.9981
0
50
100
150
200
250
300
350
0 50 100 150 200 250 300 350
Measured HRR (kW) from Oxygen Calorimetry
Nat
ural
Gas
Cal
ibra
tion
Bur
ner H
RR
(kW
)
Figure 3. Summary of calorimeter calibration results using natural gas burner.
0 5 10 15 20 25 30 35 40-50
0
50
100
150
200
250
300
350
400
Time (min)
HR
R(k
W)
Figure 4. HRR data from natural gas calibration burner. Solid line represents ±10 s moving average.
6

Description of Full-Scale Experiments Full Scale Resins The 18 formulations used in the bench-scale phase of this study [2] were chosen based on extent of industry use and on diversity of flame retardant (FR) approach. The 5 materials used in the full scale tests reported here were selected to represent a wide range of fire performance in the bench scale tests. A list of materials used in these tests and a summary of results from 3 bench-scale tests (3.2 mm thick samples) are given in Table 1. The resin identification labels in Table 1 are consistent with the previous study. The format of the label is: number - resin type – FR type. The resin types include Acrylonitrile Butadiene Styrene (ABS), High Impact Polystyrene (HIPS), Polycarbonate (PC) and Polypropylene (PP). The flame retardant types include Bromine/Antimony (BFR), non-halogenated (NH) and no flame retardant (NFR). The cone calorimeter results shown are for an incident heat flux of 50 kW/m2. The UL94 Vertical Burn Test and Glow Wire Ignitability Test (GWIT) are described in detail in reference [2]. The full scale specimen mass listed in Table 1 is the combined mass of the front and rear pieces of the pre-assembled monitor enclosure. Table 1. Summary of bench-scale performance for materials used in full-scale tests, and initial mass of combustible material on full scale specimens.
Resin Identification
Cone peak HRR (kW/m2) @50 kW/m2
UL94 Classification
GWIT (oC) / GWFT (oC)
Full-Scale Enclosure Mass (g)
3-HIPS-NFR 1307 HB 750 / 725 2335
13-PP-BFR 1916 V-2 800 / 960 1999
18-HIPS-NH 398 V-1 NT 2453
1-PC-NH 586 V-0 825 / 960 2839
7-ABS-BFR 409 V-0 750 / 960 2683 Full Scale Test Specimens As shown in Figure 5, two piece 19” CRT computer monitor housings were molded from the materials listed in Table 1. The average specimen wall thickness was (3.0 ± 0.25) mm. The fire characterization was performed using both real and simulated internal components. The simulated internal frame consisted of 1.6 mm steel sheet metal formed roughly into the shape of the real components. Draped over the frame was a sheet of aluminum foil that served to increase the lateral cross section of the sheet metal frame. The frame also served to partially support the plastic enclosure during the fire test and shield interior surfaces from radiation. The frame was thus intended to achieve the same qualitative effects that real monitor components have on a fire. The real internal components consisted of a cathode ray tube (CRT) and other various electronic components (see right side of Figure 5), some of which were combustible. The 22 cm x 29 cm opening at the base of the enclosure was covered with 1.6 mm sheet metal. The specimen was placed on a brick such that the mid-length side lower edge was (8 ± 1) cm from the table surface.
7

The table surface, on which much of the burning occurred, was 12.7 mm thick Marinite I1, a calcium silicate board.
Figure 5. Photograph of 19” computer monitor test specimen. A 19” CRT is shown on the right side mounted to the front bezel. Ignition Methods Small local ignition source A small local ignition source representing a typical candle sized flame was used for these tests. A 0.5 mm I.D. needle flame burner was used to produce an n-butane flame with a height of (20 ± 1) mm, shown in Figure 6. The fuel mass flow rate was measured as (0.84 ± 0.02) mg/s and the net heat release rate of this flame was calculated as (37.5 ± 2) W. An effective net heat of combustion value of 44.7 kJ/g was used for n-butane fuel.
The needle flame burner was mounted to a flexible arm to allow the position and orientation of the test flame to be easily adjusted. The flame was applied mid-length along the side of the specimen, (3 ± 1) cm above the lower edge (shown in ). This emphasized both the potential for upward flame spread and for the development of an interactive melt pool fire on the table surface.
Figure 7
The initial flame application was for a period of 20 s. If the burning specimen extinguished within 60 s, the flame was immediately re-applied for 60 s. The 60 s application was repeated 3 times for a total flame application time of 200 s. In the case
Figure 6. 20 mm needle flame ignition
1 Certain commercial products are identified in this paper in order to specify the experimental procedure adequately. Such identification is not intended to imply recommendation or endorsement by the National Institute of Standards and Technology, not is it intended to imply that the materials or equipment identified are necessarily the best available for this purpose.
8
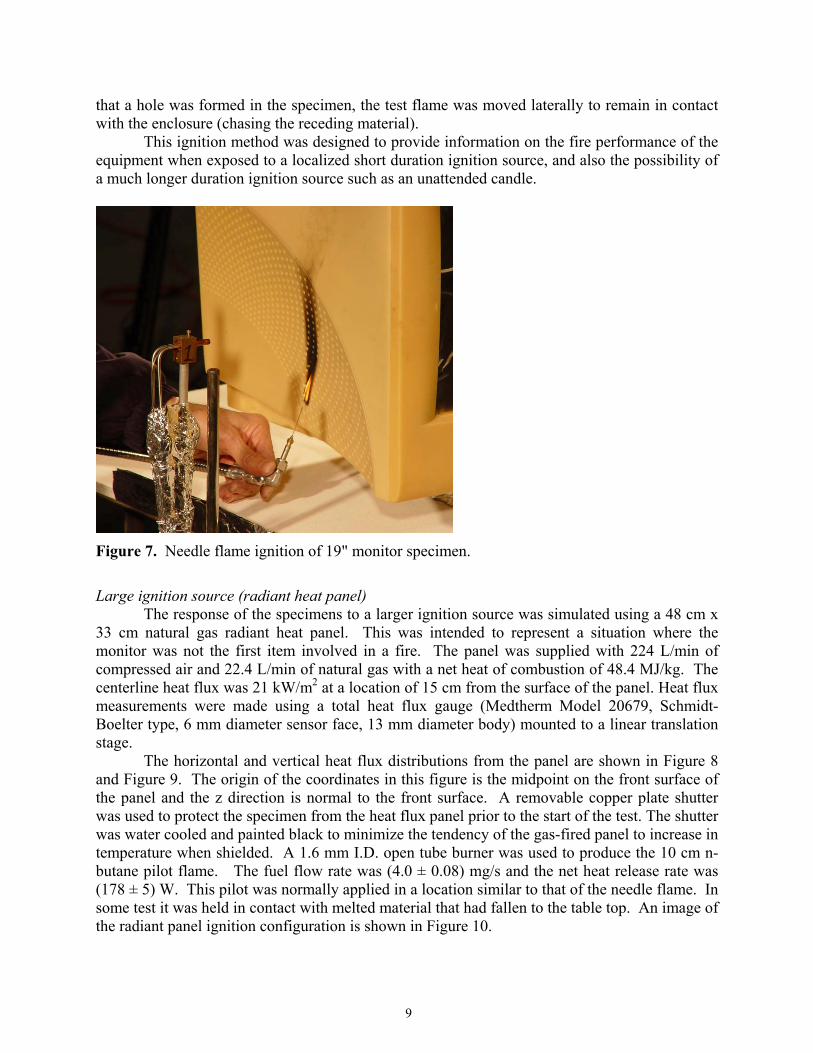
that a hole was formed in the specimen, the test flame was moved laterally to remain in contact with the enclosure (chasing the receding material).
This ignition method was designed to provide information on the fire performance of the equipment when exposed to a localized short duration ignition source, and also the possibility of a much longer duration ignition source such as an unattended candle.
Figure 7. Needle flame ignition of 19" monitor specimen.
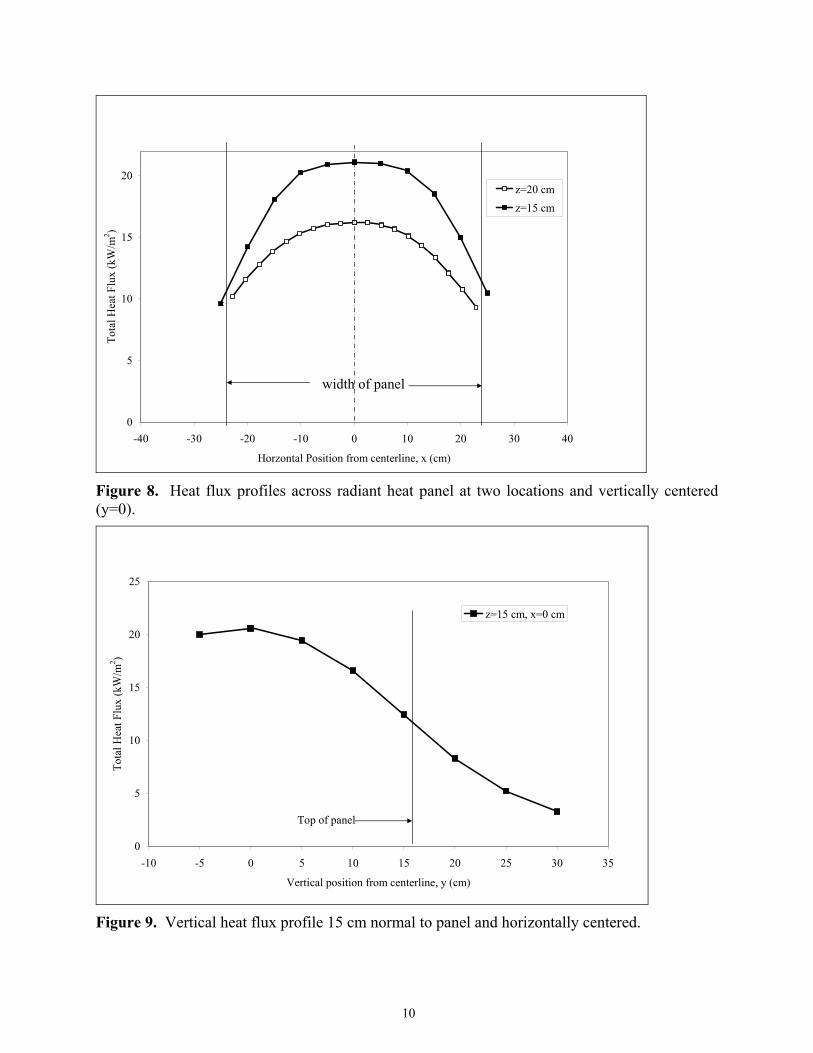
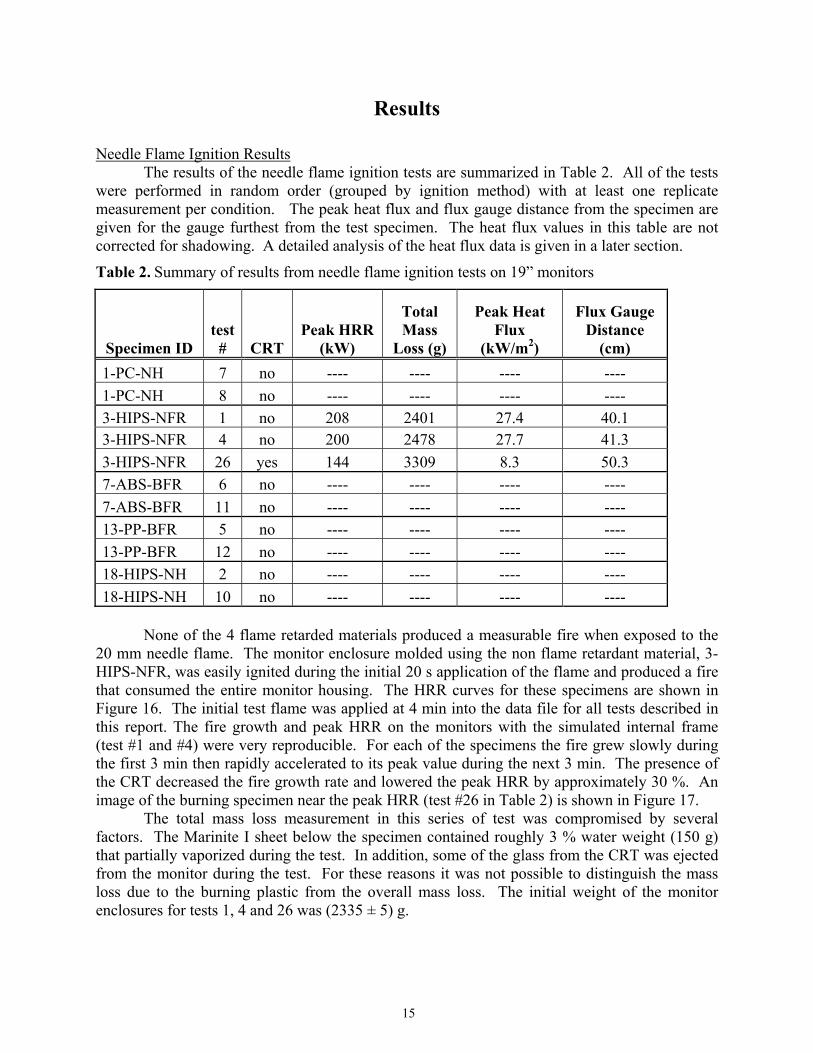
Large ignition source (radiant heat panel) The response of the specimens to a larger ignition source was simulated using a 48 cm x 33 cm natural gas radiant heat panel. This was intended to represent a situation where the monitor was not the first item involved in a fire. The panel was supplied with 224 L/min of compressed air and 22.4 L/min of natural gas with a net heat of combustion of 48.4 MJ/kg. The centerline heat flux was 21 kW/m2 at a location of 15 cm from the surface of the panel. Heat flux measurements were made using a total heat flux gauge (Medtherm Model 20679, Schmidt-Boelter type, 6 mm diameter sensor face, 13 mm diameter body) mounted to a linear translation stage.
The horizontal and vertical heat flux distributions from the panel are shown in and . The origin of the coordinates in this figure is the midpoint on the front surface of the panel and the z direction is normal to the front surface. A removable copper plate shutter was used to protect the specimen from the heat flux panel prior to the start of the test. The shutter was water cooled and painted black to minimize the tendency of the gas-fired panel to increase in temperature when shielded. A 1.6 mm I.D. open tube burner was used to produce the 10 cm n-butane pilot flame. The fuel flow rate was (4.0 ± 0.08) mg/s and the net heat release rate was (178 ± 5) W. This pilot was normally applied in a location similar to that of the needle flame. In some test it was held in contact with melted material that had fallen to the table top. An image of the radiant panel ignition configuration is shown in Figure 10.
Figure 8Figure 9
9
0
5
10
15
20
-40 -30 -20 -10 0 10 20 30 40
Horzontal Position from centerline, x (cm)
Tota
l Hea
t Flu
x (k
W/m
2 )
z=20 cmz=15 cm
width of panel
Figure 8. Heat flux profiles across radiant heat panel at two locations and vertically centered (y=0).
0
5
10
15
20
25
-10 -5 0 5 10 15 20 25 30 35
Vertical position from centerline, y (cm)
Tota
l Hea
t Flu
x (k
W/m
2 )
z=15 cm, x=0 cm
Top of panel
Figure 9. Vertical heat flux profile 15 cm normal to panel and horizontally centered.
10

Figure 10. Image showing the relative position of the radiant heat panel, specimen and 10 cm pilot flame.
Large ignition source (polystyrene keyboard) A generic non-FR polystyrene keyboard was used as a secondary ignition source for the monitor specimens in some tests. The total weight of the keyboard was (580 ± 5) g. The keyboard was placed under the front bezel of the monitor, Figure 11, and ignited using the 20 mm needle flame described previously. The needle flame was applied for 20 s to the side of the F9 key. Tests were also conducted using only the keyboard to determine its contribution to the heat release rate.
Figure 11. Keyboard ignition using 20 mm needle flame.
11

Experimental Setup All experiments were performed directly below the 3m x 3m exhaust hood described previously. A schematic drawing of the needle flame ignition test setup is shown to scale in
. The keyboard was present only for the specimens that did not sustain ignition using only the 20 mm needle flame. The test configuration for the radiant panel ignition tests is shown in Figure 13. A photograph of the hardware configuration during a test is shown in Figure 14.
Figure 12
A 12.7 mm thick calcium silicate board (Marinite I) was used as the surface for the tests. This material was chosen because of its thermal properties and resistance to fire. A new test surface was used for each test.
An array of four total heat flux gauges (Medtherm Model 20679, Schmidt-Boelter type, 6 mm diameter sensor face, 13 mm diameter body) was placed in a position to view one side of the burning object (monitor or keyboard). The goal of the array was to obtain data on the distribution of radiative heat flux versus distance along a line perpendicular to the object surface being viewed. This information is used below to infer the maximum distance at which different materials could be ignited as a result of radiative heating from the object fire.
The four gauges were arranged as follows. The front and rear gauge were on the same horizontal axis, both facing along this axis, and separated by 25 cm to 30 cm. The remaining two gauges were on a single vertical axis, both facing in the same direction as the first two, i.e., toward the side of the burning object. That vertical axis was displaced 5 cm from the horizontal axis of the first two gauges. The two gauges on this vertical axis were separated vertically by a distance of 15.3 cm, symmetrically above and below the horizontal axis of the first two gauges. This vertical axis was approximately midway along the horizontal axis between the first two gauges. This arrangement ultimately supplies three measures of the heat flux versus perpendicular distance away from the viewed surface of the burning object. In addition, since this distribution depends also on the height at which it is measured, the two vertical gauges provide a first order correction for this effect. A side view of the heat flux gauge array is shown in Figure 15.
Since the gauges (and their physical supports) had a finite size and could be within the field of view of those behind them, corrections had to be made to their readings for this shadowing, using a procedure described later.
For the isolated keyboard fires, the flux gauge array was centered mid-length along the keyboard, facing the front of the keyboard. For the monitor fires in which either a small flame or a burning keyboard was the igniter, the flux array faced one side of the monitor at its mid-length (and approximately, at mid-height). For the monitor fires in which one side was exposed to a radiant panel, the flux array faced the rear end of the monitor and was laterally centered on it. In all cases the horizontal axis of the flux array was 15.3 cm above the Marinite surface on which the burning test object was supported. The gauges were cooled with 21 oC water which was the same temperature at which they had been calibrated.
Data were sampled at 2 s intervals on 21 channels using a 12 bit data logger. All signals were recorded for a period of 4 min before ignition and after extinguishment of the specimens. The ambient temperature, pressure and relative humidity were recorded during each test. An event marker channel was used to record the time of any significant event during the test. Video cameras were used to record all tests from two different view angles.
12

74 cm
Steel Table
Marinite I (61 cm x 81 cm)
Needle flame ignition point
Keyboard
Two piece monitor enclosure
Floor
Load cell
Simulated internal frame
HF gauges 1&2
HF gauge 3
HF gauge 4
Figure 12. Side view schematic drawing of experimental setup for needle flame ignition and keyboard fire ignition tests.
15 cm
Radiant heat panel
Heat flux gauge array
Simulated internal frame Monitor enclosure
Removable water cooled shutter
Marinite board
10 cm pilot flame location
Figure 13. Top view schematic drawing of experimental setup using radiant heat panel.
13

Figure 14. 3-HIPS-NFR monitor test #4, simulated internal components. HRR=155 kW, 7.5 min after ignition with needle flame.
Figure 15. Side view of heat flux gauge array during monitor test # 12a.
14
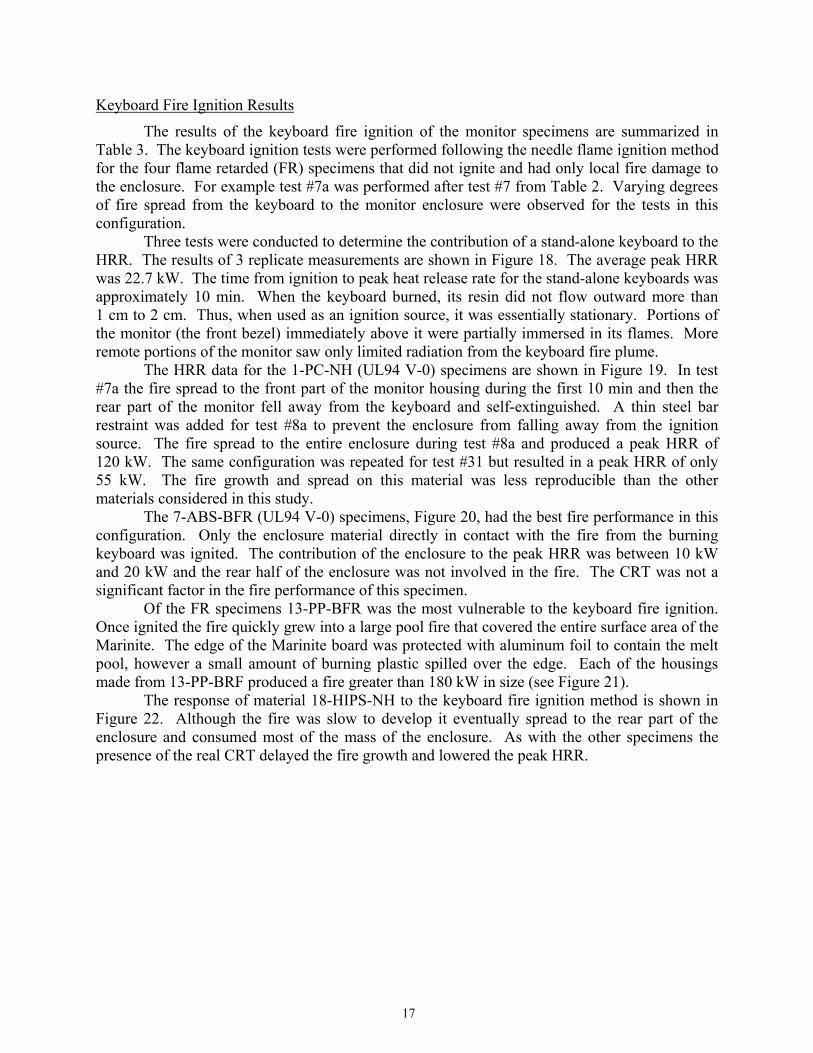
Results Needle Flame Ignition Results The results of the needle flame ignition tests are summarized in Table 2. All of the tests were performed in random order (grouped by ignition method) with at least one replicate measurement per condition. The peak heat flux and flux gauge distance from the specimen are given for the gauge furthest from the test specimen. The heat flux values in this table are not corrected for shadowing. A detailed analysis of the heat flux data is given in a later section.
Table 2. Summary of results from needle flame ignition tests on 19” monitors
Specimen ID test # CRT
Peak HRR (kW)
Total Mass
Loss (g)
Peak Heat Flux
(kW/m2)
Flux Gauge Distance
(cm) 1-PC-NH 7 no ---- ---- ---- ---- 1-PC-NH 8 no ---- ---- ---- ---- 3-HIPS-NFR 1 no 208 2401 27.4 40.1 3-HIPS-NFR 4 no 200 2478 27.7 41.3 3-HIPS-NFR 26 yes 144 3309 8.3 50.3 7-ABS-BFR 6 no ---- ---- ---- ---- 7-ABS-BFR 11 no ---- ---- ---- ---- 13-PP-BFR 5 no ---- ---- ---- ---- 13-PP-BFR 12 no ---- ---- ---- ---- 18-HIPS-NH 2 no ---- ---- ---- ---- 18-HIPS-NH 10 no ---- ---- ---- ----
None of the 4 flame retarded materials produced a measurable fire when exposed to the
20 mm needle flame. The monitor enclosure molded using the non flame retardant material, 3-HIPS-NFR, was easily ignited during the initial 20 s application of the flame and produced a fire that consumed the entire monitor housing. The HRR curves for these specimens are shown in
. The initial test flame was applied at 4 min into the data file for all tests described in this report. The fire growth and peak HRR on the monitors with the simulated internal frame (test #1 and #4) were very reproducible. For each of the specimens the fire grew slowly during the first 3 min then rapidly accelerated to its peak value during the next 3 min. The presence of the CRT decreased the fire growth rate and lowered the peak HRR by approximately 30 %. An image of the burning specimen near the peak HRR (test #26 in Table 2) is shown in Figure 17.
Figure 16
The total mass loss measurement in this series of test was compromised by several factors. The Marinite I sheet below the specimen contained roughly 3 % water weight (150 g) that partially vaporized during the test. In addition, some of the glass from the CRT was ejected from the monitor during the test. For these reasons it was not possible to distinguish the mass loss due to the burning plastic from the overall mass loss. The initial weight of the monitor enclosures for tests 1, 4 and 26 was (2335 ± 5) g.
15

The combined expanded relative uncertainty (95 % confidence level) of the peak heat release rate measurement was ±12 %. The dominant components of this uncertainty were the exhaust mass flow rate and the fuel heat of combustion per gram of O2.
0 5 10 15 20 25 30 350
50
100
150
200
250
Time (min)
HR
R(k
W)
monitor 1monitor 4monitor 261
4
26
tign = 4 min
Figure 16. Heat release rate curves for needle flame ignition of 19” monitors. Ignition flame applied to specimen at t = 4 min.
Figure 17. Image of monitor test #26, 3-HIPS-NFR, near peak heat release rate. Array of heat flux gauges is shown on right side of image.
16
Keyboard Fire Ignition Results
The results of the keyboard fire ignition of the monitor specimens are summarized in Table 3. The keyboard ignition tests were performed following the needle flame ignition method for the four flame retarded (FR) specimens that did not ignite and had only local fire damage to the enclosure. For example test #7a was performed after test #7 from Table 2. Varying degrees of fire spread from the keyboard to the monitor enclosure were observed for the tests in this configuration.
Three tests were conducted to determine the contribution of a stand-alone keyboard to the HRR. The results of 3 replicate measurements are shown in . The average peak HRR was 22.7 kW. The time from ignition to peak heat release rate for the stand-alone keyboards was approximately 10 min. When the keyboard burned, its resin did not flow outward more than 1 cm to 2 cm. Thus, when used as an ignition source, it was essentially stationary. Portions of the monitor (the front bezel) immediately above it were partially immersed in its flames. More remote portions of the monitor saw only limited radiation from the keyboard fire plume.
Figure 18
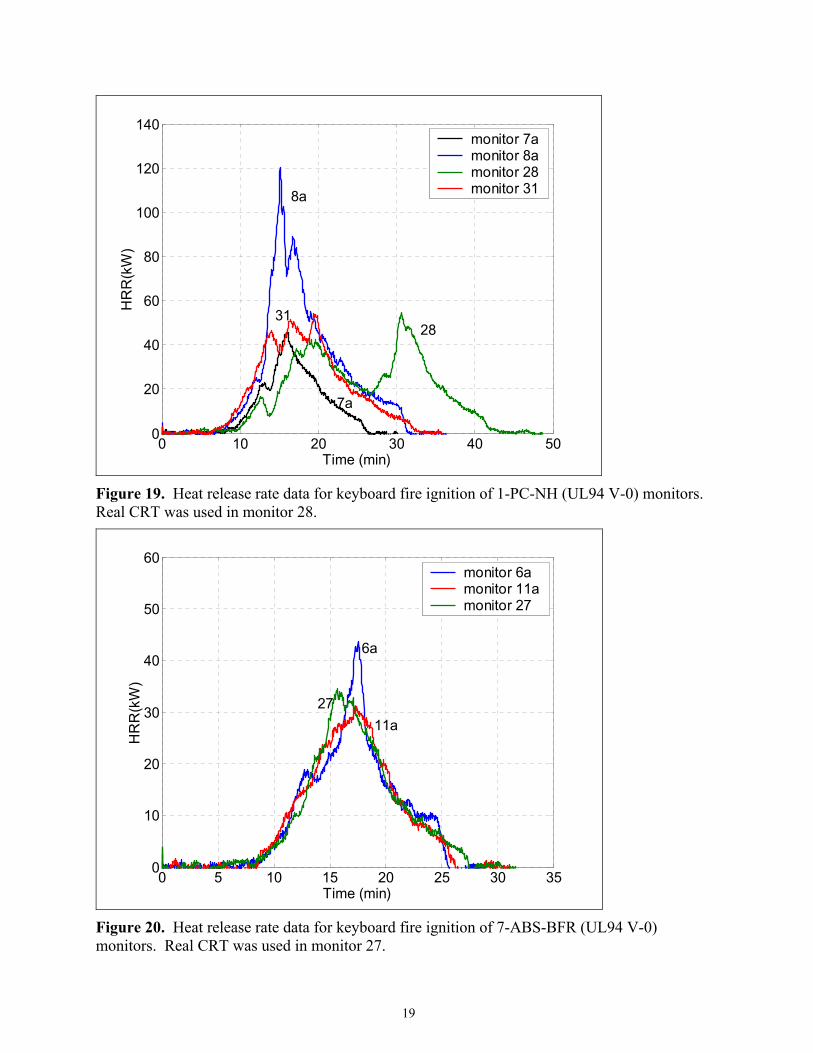
The HRR data for the 1-PC-NH (UL94 V-0) specimens are shown in . In test #7a the fire spread to the front part of the monitor housing during the first 10 min and then the rear part of the monitor fell away from the keyboard and self-extinguished. A thin steel bar restraint was added for test #8a to prevent the enclosure from falling away from the ignition source. The fire spread to the entire enclosure during test #8a and produced a peak HRR of 120 kW. The same configuration was repeated for test #31 but resulted in a peak HRR of only 55 kW. The fire growth and spread on this material was less reproducible than the other materials considered in this study.
Figure 19
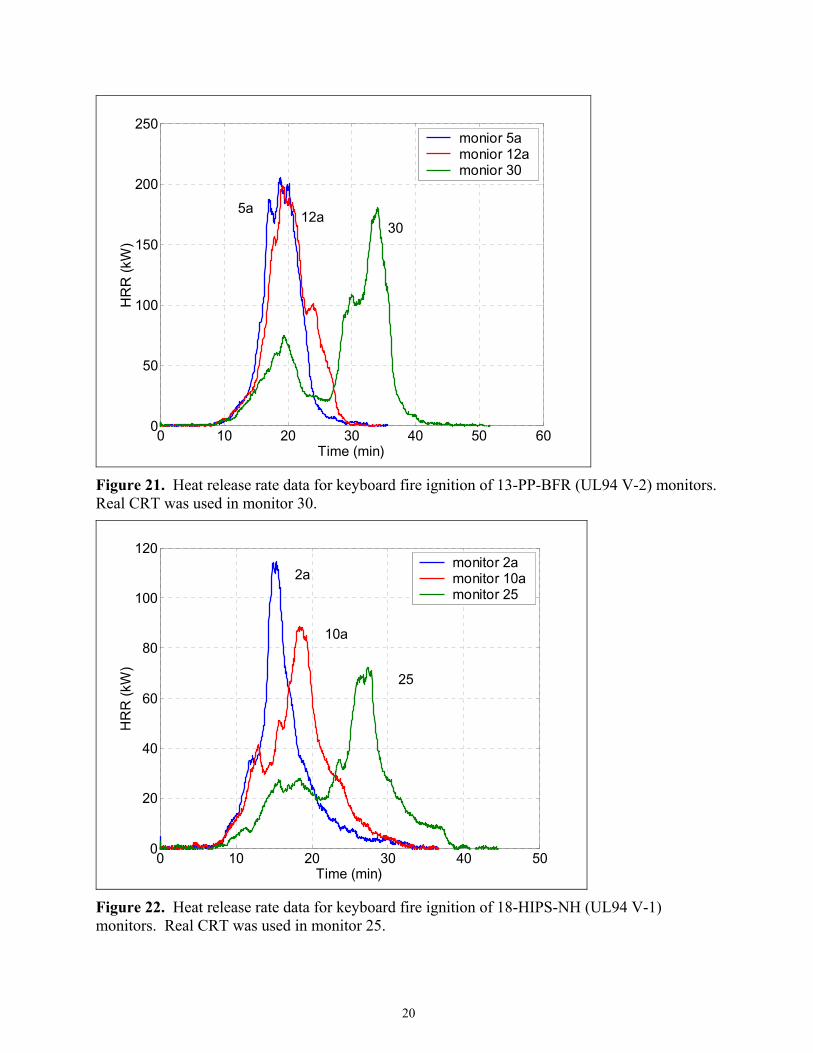
The 7-ABS-BFR (UL94 V-0) specimens, Figure 20, had the best fire performance in this configuration. Only the enclosure material directly in contact with the fire from the burning keyboard was ignited. The contribution of the enclosure to the peak HRR was between 10 kW and 20 kW and the rear half of the enclosure was not involved in the fire. The CRT was not a significant factor in the fire performance of this specimen. Of the FR specimens 13-PP-BFR was the most vulnerable to the keyboard fire ignition. Once ignited the fire quickly grew into a large pool fire that covered the entire surface area of the Marinite. The edge of the Marinite board was protected with aluminum foil to contain the melt pool, however a small amount of burning plastic spilled over the edge. Each of the housings made from 13-PP-BRF produced a fire greater than 180 kW in size (see Figure 21).
The response of material 18-HIPS-NH to the keyboard fire ignition method is shown in . Although the fire was slow to develop it eventually spread to the rear part of the
enclosure and consumed most of the mass of the enclosure. As with the other specimens the presence of the real CRT delayed the fire growth and lowered the peak HRR.
Figure 22
17
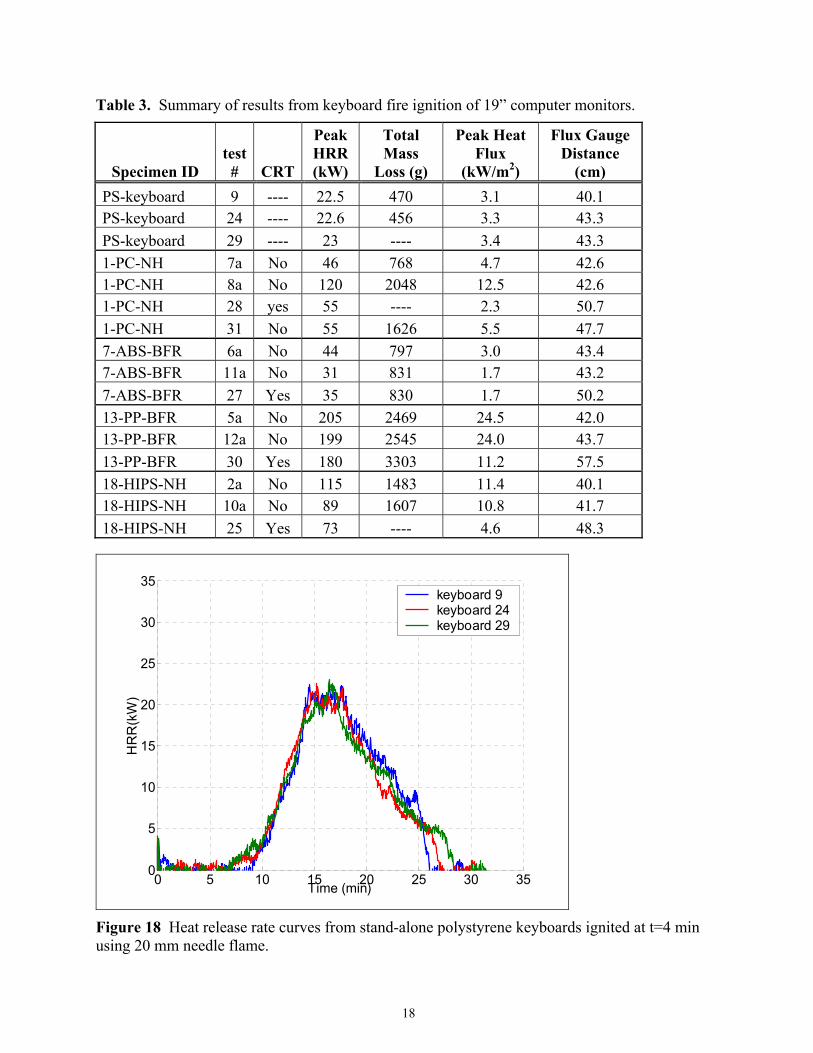
Table 3. Summary of results from keyboard fire ignition of 19” computer monitors.
Specimen ID test # CRT
Peak HRR (kW)
Total Mass
Loss (g)
Peak Heat Flux
(kW/m2)
Flux Gauge Distance
(cm) PS-keyboard 9 ---- 22.5 470 3.1 40.1 PS-keyboard 24 ---- 22.6 456 3.3 43.3 PS-keyboard 29 ---- 23 ---- 3.4 43.3 1-PC-NH 7a No 46 768 4.7 42.6 1-PC-NH 8a No 120 2048 12.5 42.6 1-PC-NH 28 yes 55 ---- 2.3 50.7 1-PC-NH 31 No 55 1626 5.5 47.7 7-ABS-BFR 6a No 44 797 3.0 43.4 7-ABS-BFR 11a No 31 831 1.7 43.2 7-ABS-BFR 27 Yes 35 830 1.7 50.2 13-PP-BFR 5a No 205 2469 24.5 42.0 13-PP-BFR 12a No 199 2545 24.0 43.7 13-PP-BFR 30 Yes 180 3303 11.2 57.5 18-HIPS-NH 2a No 115 1483 11.4 40.1 18-HIPS-NH 10a No 89 1607 10.8 41.7 18-HIPS-NH 25 Yes 73 ---- 4.6 48.3
0 5 10 15 20 25 30 350
5
10
15
20
25
30
35
Time (min)
HR
R(k
W)
keyboard 9keyboard 24keyboard 29
Figure 18 Heat release rate curves from stand-alone polystyrene keyboards ignited at t=4 min using 20 mm needle flame.
18
0 10 20 30 40 500
20
40
60
80
100
120
140
Time (min)
HR
R(k
W)
monitor 7amonitor 8amonitor 28monitor 318a
31 28
7a
Figure 19. Heat release rate data for keyboard fire ignition of 1-PC-NH (UL94 V-0) monitors. Real CRT was used in monitor 28.
0 5 10 15 20 25 30 350
10
20
30
40
50
60
Time (min)
HR
R(k
W)
monitor 6amonitor 11amonitor 27
6a
27 11a
Figure 20. Heat release rate data for keyboard fire ignition of 7-ABS-BFR (UL94 V-0) monitors. Real CRT was used in monitor 27.
19
0 10 20 30 40 50 600
50
100
150
200
250
Time (min)
HR
R (k
W)
monior 5amonior 12amonior 30
5a 12a 30
Figure 21. Heat release rate data for keyboard fire ignition of 13-PP-BFR (UL94 V-2) monitors. Real CRT was used in monitor 30.
0 10 20 30 40 500
20
40
60
80
100
120
Time (min)
HR
R (k
W)
monitor 2amonitor 10amonitor 25
2a
10a
25
Figure 22. Heat release rate data for keyboard fire ignition of 18-HIPS-NH (UL94 V-1) monitors. Real CRT was used in monitor 25.
20
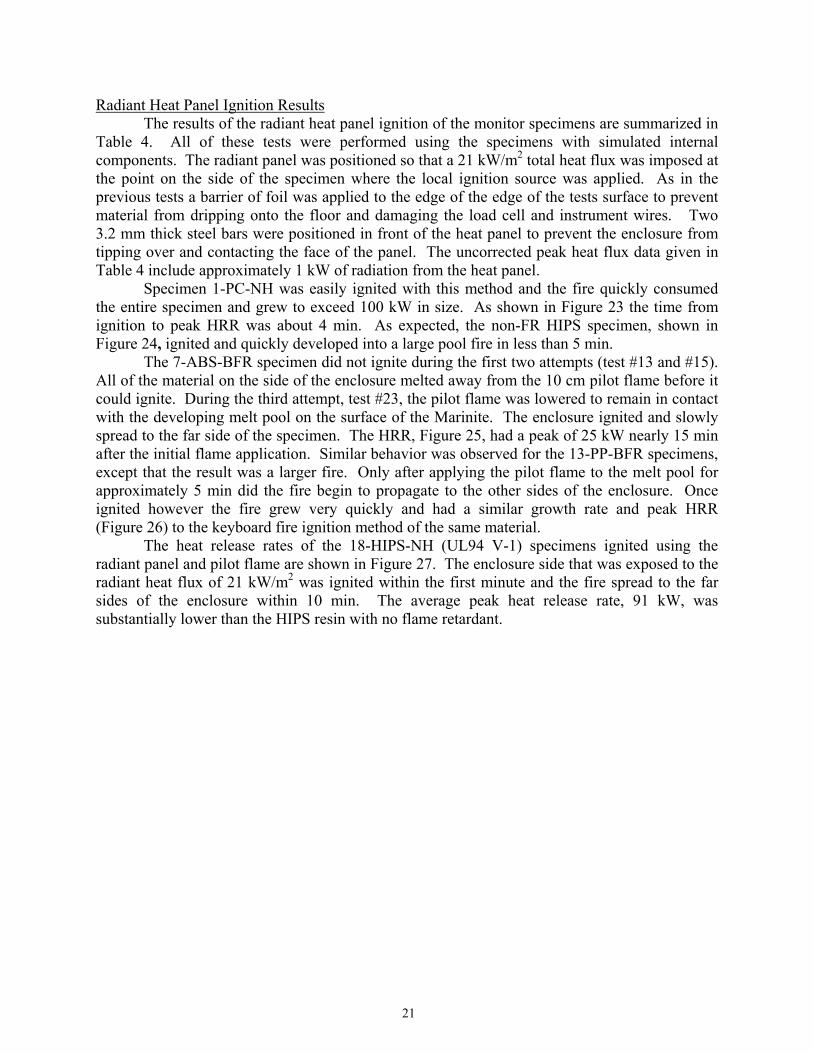
Radiant Heat Panel Ignition Results The results of the radiant heat panel ignition of the monitor specimens are summarized in Table 4. All of these tests were performed using the specimens with simulated internal components. The radiant panel was positioned so that a 21 kW/m2 total heat flux was imposed at the point on the side of the specimen where the local ignition source was applied. As in the previous tests a barrier of foil was applied to the edge of the edge of the tests surface to prevent material from dripping onto the floor and damaging the load cell and instrument wires. Two 3.2 mm thick steel bars were positioned in front of the heat panel to prevent the enclosure from tipping over and contacting the face of the panel. The uncorrected peak heat flux data given in Table 4 include approximately 1 kW of radiation from the heat panel.
Specimen 1-PC-NH was easily ignited with this method and the fire quickly consumed the entire specimen and grew to exceed 100 kW in size. As shown in the time from ignition to peak HRR was about 4 min. As expected, the non-FR HIPS specimen, shown in
, ignited and quickly developed into a large pool fire in less than 5 min.
Figure 23
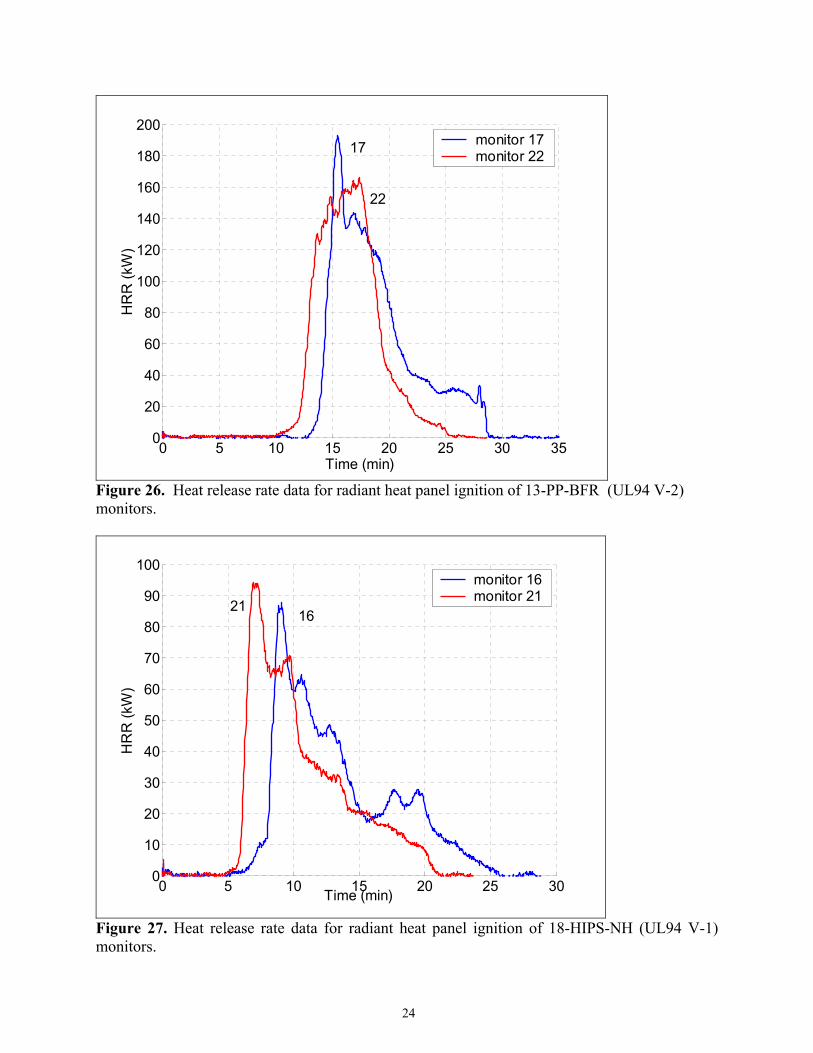
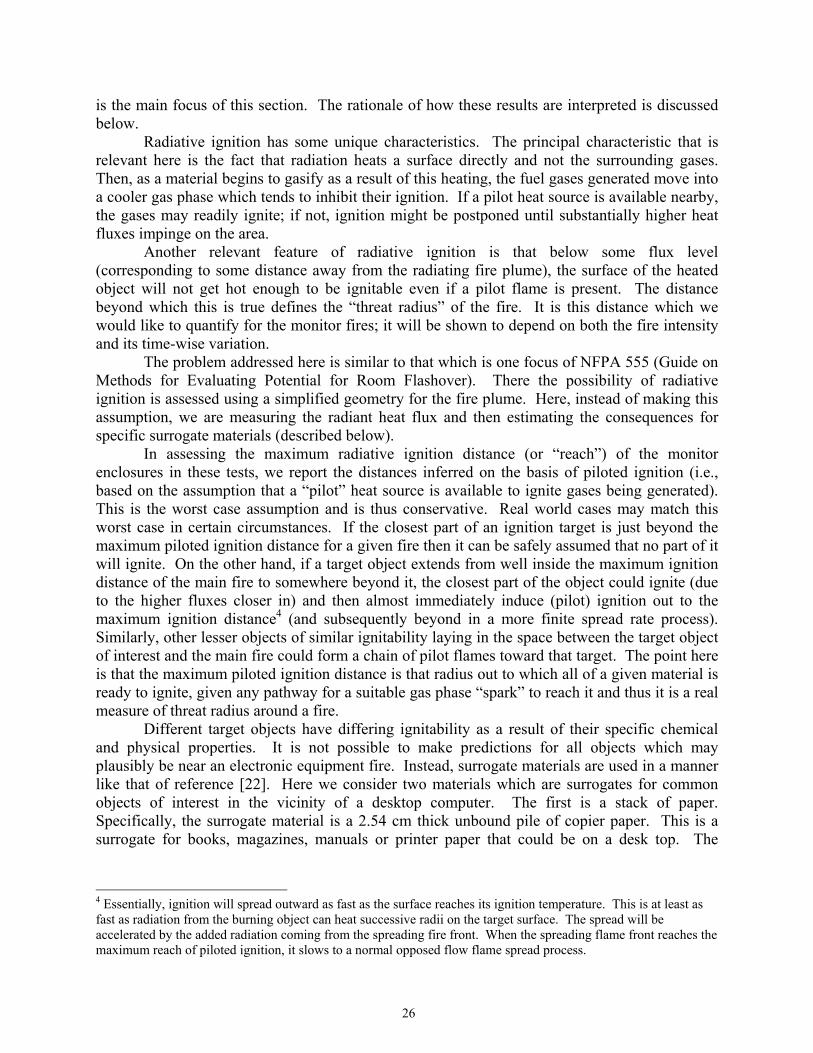
Figure 24 The 7-ABS-BFR specimen did not ignite during the first two attempts (test #13 and #15). All of the material on the side of the enclosure melted away from the 10 cm pilot flame before it could ignite. During the third attempt, test #23, the pilot flame was lowered to remain in contact with the developing melt pool on the surface of the Marinite. The enclosure ignited and slowly spread to the far side of the specimen. The HRR, Figure 25, had a peak of 25 kW nearly 15 min after the initial flame application. Similar behavior was observed for the 13-PP-BFR specimens, except that the result was a larger fire. Only after applying the pilot flame to the melt pool for approximately 5 min did the fire begin to propagate to the other sides of the enclosure. Once ignited however the fire grew very quickly and had a similar growth rate and peak HRR (Figure 26) to the keyboard fire ignition method of the same material. The heat release rates of the 18-HIPS-NH (UL94 V-1) specimens ignited using the radiant panel and pilot flame are shown in Figure 27. The enclosure side that was exposed to the radiant heat flux of 21 kW/m2 was ignited within the first minute and the fire spread to the far sides of the enclosure within 10 min. The average peak heat release rate, 91 kW, was substantially lower than the HIPS resin with no flame retardant.
21

Table 4. Summary of results from radiant heat panel ignition tests of 19” computer monitors.
Specimen ID test # CRT
Peak HRR (kW)
Total Mass
Loss (g)
Peak Heat Flux
(kW/m2)
Flux Gauge Distance
(cm) 1-PC-NH 18 no 124 1504 11.0 45.6 1-PC-NH 20 no 117 1441 11.1 44.3 3-HIPS-NFR 14 no 240 2475 16.9 45.9 3-HIPS-NFR 19 no 190 2413 14.1 45.5 7-ABS-BFR 13 no ---- 24 1.0 46.4 7-ABS-BFR 15 no ---- 23 1.0 46.4 7-ABS-BFR 23 no 25 765 3.9 45.8 13-PP-BFR 17 no 193 1776 11.1 45.6 13-PP-BFR 22 no 167 1849 11.4 46.7 18-HIPS-NH 16 no 88 1267 7.0 45.5 18-HIPS-NH 21 no 94 1329 6.7 46.8
0 5 10 15 20 250
50
100
150
Time (min)
HR
R (k
W)
monitor 18monitor 20
18
20
Figure 23. Heat release rate data for radiant heat panel ignition of 1-PC-NH (UL94 V-0) monitors.
22

0 5 10 15 20 250
50
100
150
200
250
Time (min)
HR
R (k
W)
monitor 14monitor 1914
19
Figure 24. Heat release rate data for radiant heat panel ignition of 3-HIPS-NFR (UL94 HB) monitors.
0 5 10 15 20 250
5
10
15
20
25
30
35
40
45
50
Time (min)
HR
R (k
W)
monitor 13monitor 15monitor 23
Figure 25. Heat release rate data for radiant heat panel ignition of 7-ABS-BFR (UL94 V-0) monitors.
23
0 5 10 15 20 25 30 350
20
40
60
80
100
120
140
160
180
200
Time (min)
HR
R (k
W)
monitor 17monitor 2217
22
Figure 26. Heat release rate data for radiant heat panel ignition of 13-PP-BFR (UL94 V-2) monitors.
0 5 10 15 20 25 300
10
20
30
40
50
60
70
80
90
100
Time (min)
HR
R (k
W)
monitor 16monitor 21
16 21
Figure 27. Heat release rate data for radiant heat panel ignition of 18-HIPS-NH (UL94 V-1) monitors.
24

Threat of Ignition of Other Objects
Any fire poses an ignition threat to objects in its surroundings. Such ignition could occur by one of several modes. Each has a differing direction or extent of reach beyond the boundaries of the burning object. Direct flame contact with the surface of another object
The greatest reach by this mode is typically upward due to the buoyancy of the flames but fire plumes can be diverted laterally by interaction with object surfaces or by air movement in the surrounding space. In the present tests, for the largest fires, lateral flame extent occasionally reached about 15 cm from the original sides of the monitor surface, mainly as a result of deflection of lower flames by a surface that was skewed temporarily in the process of collapsing downward. The upward reach of the flame tips was, for the highest HRR cases, as much as 1.5 m above the table surface on which the sample rested. Due to dilution, the mean gas temperature at flame tip height (≈ 500 ºC) is not much higher than that required to ignite many materials but, in combination with the radiation from the plume (see below), the ignition reach above the fire is likely to be significantly greater than the flame tip height (this does not seem to have been investigated in the literature and was not a focus here).
Movement of flaming material
For the thermoplastic-based electronic equipment enclosures that are the focus here, the main moving material hazard is lateral and downward flow of flaming molten resin. Here it has the potential to carry flames from desk top level to the floor. The principal threat of flaming melt material reaching the floor is associated with melts having low viscosity. The main resin posing this threat here was 13-PP-BFR. Flaming melt material reached the floor with some other resins but this was mainly a result of the small size of the table being used to support the sample2. It is worth noting that a very low viscosity resin might also extend the lateral flame reach on something like a desk surface if a flaming flow continues to move outward3. For some burning materials or objects, another mode of flaming material movement could be floating shreds or “brands” carried upward from the fire by buoyant flow and dropped virtually anywhere. No significant examples of this behavior were observed here.
Remote ignition by radiation
A sooty fire plume is a strong radiator. The intensity of this radiation drops off with distance from the fire in accord with the view factor a target point has with respect to the fire plume. The lateral reach of this radiation (at a threatening intensity) can be substantially greater than that of the flames themselves. For electronic equipment this implies a significant threat to other objects that may be used in conjunction with it, e.g. other objects on a desk top. Assessment of this threat was the reason for including the heat flux gauge array in these tests and
2 Flaming material occasionally fell over the edge of the table while a monitor was in the process of collapse. This could happen in the real world if a monitor was near the edge of a desk. 3 This sort of outward flow is inhibited by heat loss to the surface on which it is occurring and will usually stop unless a large fire plume is countering the heat loss to the surface.
25
is the main focus of this section. The rationale of how these results are interpreted is discussed below.
Radiative ignition has some unique characteristics. The principal characteristic that is relevant here is the fact that radiation heats a surface directly and not the surrounding gases. Then, as a material begins to gasify as a result of this heating, the fuel gases generated move into a cooler gas phase which tends to inhibit their ignition. If a pilot heat source is available nearby, the gases may readily ignite; if not, ignition might be postponed until substantially higher heat fluxes impinge on the area.
Another relevant feature of radiative ignition is that below some flux level (corresponding to some distance away from the radiating fire plume), the surface of the heated object will not get hot enough to be ignitable even if a pilot flame is present. The distance beyond which this is true defines the “threat radius” of the fire. It is this distance which we would like to quantify for the monitor fires; it will be shown to depend on both the fire intensity and its time-wise variation.
The problem addressed here is similar to that which is one focus of NFPA 555 (Guide on Methods for Evaluating Potential for Room Flashover). There the possibility of radiative ignition is assessed using a simplified geometry for the fire plume. Here, instead of making this assumption, we are measuring the radiant heat flux and then estimating the consequences for specific surrogate materials (described below).
In assessing the maximum radiative ignition distance (or “reach”) of the monitor enclosures in these tests, we report the distances inferred on the basis of piloted ignition (i.e., based on the assumption that a “pilot” heat source is available to ignite gases being generated). This is the worst case assumption and is thus conservative. Real world cases may match this worst case in certain circumstances. If the closest part of an ignition target is just beyond the maximum piloted ignition distance for a given fire then it can be safely assumed that no part of it will ignite. On the other hand, if a target object extends from well inside the maximum ignition distance of the main fire to somewhere beyond it, the closest part of the object could ignite (due to the higher fluxes closer in) and then almost immediately induce (pilot) ignition out to the maximum ignition distance4 (and subsequently beyond in a more finite spread rate process). Similarly, other lesser objects of similar ignitability laying in the space between the target object of interest and the main fire could form a chain of pilot flames toward that target. The point here is that the maximum piloted ignition distance is that radius out to which all of a given material is ready to ignite, given any pathway for a suitable gas phase “spark” to reach it and thus it is a real measure of threat radius around a fire.
Different target objects have differing ignitability as a result of their specific chemical and physical properties. It is not possible to make predictions for all objects which may plausibly be near an electronic equipment fire. Instead, surrogate materials are used in a manner like that of reference [22]. Here we consider two materials which are surrogates for common objects of interest in the vicinity of a desktop computer. The first is a stack of paper. Specifically, the surrogate material is a 2.54 cm thick unbound pile of copier paper. This is a surrogate for books, magazines, manuals or printer paper that could be on a desk top. The
4 Essentially, ignition will spread outward as fast as the surface reaches its ignition temperature. This is at least as fast as radiation from the burning object can heat successive radii on the target surface. The spread will be accelerated by the added radiation coming from the spreading fire front. When the spreading flame front reaches the maximum reach of piloted ignition, it slows to a normal opposed flow flame spread process.
26

second is a medium weight cotton fabric which is a surrogate for a drape or for the seatback of an upholstered desk chair. The fabric is 100 % cotton and weighs 0.41 kg/m2 (12 oz/yd2).
The piloted ignition behavior of these materials was measured in a Cone Calorimeter [22,23]over a flux range from 70 kW/m2 down to the minimum flux for ignition5. The results, taken from the two references, are shown in and . The Cone ignition process is purely radiative in nature and includes a spark igniter as the pilot. Note, however, that the heat flux there is constant in time (at each intensity level). In the monitor fires, the heat flux that would impinge on a target object rises and falls as the monitor fire builds and recedes. This has an effect on the viability of ignition and thus the Cone data cannot be used directly. Instead, it forms the basis for inferring the effective ignition properties of the surrogate material. A simple thermal ignition model is used to find effective property values which closely reproduce the measured ignition behavior from the Cone. These properties are the ignition temperature and the apparent thermal inertia (product of density (ρ), heat capacity (c) and thermal conductivity (k)). Actually, two versions of this model are needed since one material, the fabric, is thermally thin and the other is thermally thick. The models, which are based on the conventional concept of an ignition temperature and which are non-linear due to the inclusion of re-radiation from the heated material surface(s), are described in reference [22]. Both require numerical solution. In
and , the model fits are shown along with the experimental data; the effective ignition property values are shown in the figures.
Figure 28
Figure 28
Figure 29
Figure 29
Given these effective ignitability properties and the measured heat flux versus time from the monitor fire tests, this information can be used in the model(s) to predict the farthest distance from the fire at which ignition of the surrogate materials can just occur. Since the number of heat flux gauges was quite limited, only some portion of the flux versus distance profile was measured in each test; thus it is necessary to extrapolate/interpolate the measured values.
Before the raw heat flux data could be used (or extrapolated), it was necessary to correct the raw reading for the fact that the field of view of the gauge may have been partially blocked. For the most part, this blockage was due to the supports of gauges which were closer to the fire being viewed but even the front gauge had some blockage due to a rod used to prevent the monitor from tipping over (off the support table) as it began to collapse.
In general, the percent blockage of the field of view of one gauge by one or more gauges in front of it depends on the size of the fire the gauge views. Thus it was necessary to take photos of the fires, from behind the flux gauge array, at their peak and use these along with measurements of the gauge and gauge supports as seen by each gauge. The actual blocked area was projected forward onto the fire whose area (in the plane of the near face of the burning object, using known spacings) was estimated from the photos. The correction was then made assuming that the blocked area of the fire was as radiant as all other areas of the fire. (In fact all areas of these fires are assumed equally radiant.) Strictly speaking, such corrections are time-dependent since the fire size is time-dependent but it was not practical to account for this effect. The fire size varied on the same time scale as the flux peak being recorded so some shadowing corrections are underestimated meaning that the effective peaks are slightly broader (i.e., longer in time) than the values used below. Since the shadow corrections were generally in the 5 % to 10 % range, this is not a serious source of error.
5 The ignition results for paper were obtained on a horizontal stack. We apply them here unchanged for paper oriented vertically which receives the higher radiative flux in the situation under consideration. This could be a vertical surface on the same objects for which this material is a surrogate.
27

Generally (though not in all cases) the higher of the two vertically arrayed gauges read a higher peak flux. This indicates that the horizontal axis on which the front and back gauges were placed was not at the height of maximum outward reach of the flux distribution. To help compensate for this, the front and back gauge readings were corrected up to the level of the higher vertical gauge. Note that this is a correction in the right direction but it is not necessarily complete, i.e., the maximum outward reach of the flux distribution is almost certainly greater than that calculated in this manner. On the other hand these height corrections were typically of the order of 5 %, so, once again, this should not be a serious source of error.
The net result was a three point estimate of the flux distribution along a line perpendicular to the face of the burning object. Figure 30 shows an example of this corrected flux distribution, in this case for 3-HIPS-NFR, which had one of the most outward reaching flux distributions. Note that the peak flux at the farthest gauge location was approximately 30 kW/m2
. It will be shown below that the surrogate materials being examined here are capable of igniting at substantially lower heat fluxes than this. Thus, in this case, to find the maximum outward reach of ignition of such materials, it was necessary to extrapolate the flux distribution shown in
. In other cases, it was necessary to interpolate between pairs of points of the flux distribution. Figure 30
Figure 30
Also shown in Figure 30 are the data for the time width of the transient fluxes seen by the three gauges as the fire grew and then subsided. The time width is that at 50 % of the peak value. Because the flux data have substantial variability (due to the turbulent nature of the fire plume), it is simpler to approximate the transient nature of the flux by using a Gaussian time dependence. The Gaussian is specified to match the peak flux and its time width at 50 % of the peak. Since the three measures of peak width were generally quite comparable, the average of the three was used in the ignition model calculations
The simplest interpolation or extrapolation of the flux peak data in is a straight line that includes two of the measured points; extrapolation with a fitted polynomial could be seriously misleading. A more physically-based method uses the concept of radiative view factor. In the latter approach, the fire plume is broken, for convenience, into two rectangular segments, one above and one below the front flux gauge height. The view factor for this pair, as seen along a line through the front and rear flux gauges, is constructed with the usual assumption that both areas are uniform, diffuse radiators [24]. The view factor, plus the effective radiating temperature of the fire plume, sets the predicted variation and absolute level of flux versus distance along the line. Since this construction is to be used to interpolate or extrapolate the local flux gauge measurements, its prediction of the flux variation with distance from the near side of the burning object is force-fitted through the linear average flux at a point midway between the two gauges nearest the distance of interest (usually the outer two flux gauges). The force-fitting to match this midpoint is achieved by varying the effective radiator temperature.
shows an example of the result. Note that the line calculated from the view factor does not go through any of the measured peak flux values at the three gauge distances from the side of the monitor. This is presumably a result of non-uniform radiation from the fire plume plus various approximations such as those mentioned above. In spite of this, the concave upward curvature of the line is more correct than the zero curvature of the straight line approximation. We use both to estimate the maximum outward reach of piloted ignition for the two surrogate materials described above. In cases where the estimated maximum reach is well beyond the outermost flux gauge (see below), the view factor based extrapolation is expected to be more accurate. However, given the low slope of the flux vs. distance curves in such cases, the
Figure 31
28

absolute accuracy of that result is probably no better than ± 25 %. It is substantially better (± 5% to 10 %) for cases which involve an estimated reach which falls between or very near the gauges.
The line shown in relates flux and distance. When the ignition model yields a result for the lowest flux at which a given surrogate material will just ignite, the line shows the maximum distance at which this can occur. The uncertainties just noted apply to this result.
Figure 31
The cotton fabric, as noted above, is a surrogate for such items as drapes or the seat back of an upholstered desk chair. These two target objects could have significantly differing heat loss conditions on the back surface of the fabric, affecting their ignitability. Thus the upholstery application would typically involve polyurethane foam behind the fabric, making heat losses there minimal. A drape, depending on its exact physical configuration (folded vs. flat) could have heat losses on the back of the fabric that are as much as those on the front or nearly as little as those for the upholstery application. Thus the results were computed for the two extremes; adiabatic back surface or equal back and front surface heat losses (re-radiation plus convection). The ignition behavior of the paper surrogate was computed with the thermally thick model using a 2.5 cm depth. This is thick enough that the back surface condition is irrelevant on the time scale required for ignition.
Table 5 shows the computed maximum piloted ignition reach values for the cotton fabric and the paper. This was done only for a select set of fire tests since it is quite labor intensive. Most of the cases reported there are for the monitor enclosures containing the pseudo-CRT interior; the main goal is a comparison of the differing resins, plus some guidance regarding “acceptable” fire sizes. For both surrogate materials, reach values for both linear and view factor-based extrapolation/interpolation of the flux vs distance curves are reported. Again note that the view factor-based values are expected to be more accurate in cases involving extrapolation beyond the outermost flux gauge (i.e., cases in Table 5 where the reported value is greater than about 0.4 m to 0.43 m).
There are several observations to be made regarding the results in Table 5. First, for the monitor fires, the nature of the resin made a substantial difference in maximum ignition reach. The reported numbers show about a factor two variation. However, the best-behaved case was for 7-ABS-BFR for which ignition reach values could not be directly calculated (indicated by N.A. in Table 5). The reason for this was that the fire stopped before it propagated as far along the side as the flux gauge array and the peak flux values recorded even for the front flux gauge, were less than 4 kW/m2. Even the most ignitable surrogate case (cotton fabric with adiabatic rear surface) required a minimum peak flux of about 8 kW/m2 to ignite. Extrapolation of the available flux data imply that this would not be reached even at the monitor surface, at least in the vertical plane of the flux gauges. Closer to the front end of the monitor where the keyboard fire was forcing some burning, the ignition reach was probably finite but it was probably also dominated by the keyboard fire. The ignition reach for a keyboard alone is shown in Table 5 but this value is for gauges that view the keyboard from its front; the reach values for a side view are expected to be less since the radiative view factor there is less. Thus it would appear that the most effective resin can virtually eliminate the radiative ignition reach from a monitor fire by essentially squelching that fire.
Next, note the substantial differences in ignition reach for the two surrogate materials as well as the dependence of ignition reach on rear surface boundary conditions for the cotton fabric. This emphasizes that the (piloted) ignition process is governed by the simple issue of getting (and retaining) enough energy in the surface of a material for it to generate an ignitable
29

gas mixture (here taken as equivalent to achieving an ignition temperature). The ignition reach for a layer of paper is less because that layer is a conductive heat sink pulling heat away from the paper surface. Similarly, the cotton fabric can, in some configurations, lose a substantial portion of the incoming radiant heat through its rear surface; this also makes it require a higher radiant flux to achieve an ignitable condition and this in turn is achieved only closer to the monitor fire.
Another factor at work in the differing material responses was the ratio of the heat flux peak width to the response time for heating of the sample surface. The cotton fabric was thermally thin and sufficiently low in thermal mass to essentially follow the time-varying radiant flux from the monitor fire. As a result, it could ignite at fluxes as low as 8 kW/m2 which, as
implies, requires a few hundred seconds to achieve. The paper stack, with its in-depth conduction, has a much longer thermal response time; to compensate it required substantially higher minimum peak heat fluxes (typically at least 15 kW/m2) to reach its ignition temperature6. Had any of these fires been shorter in duration, the minimum heat flux would have gone up and thus the maximum ignition reach would have decreased.
Figure 28
The worst case situation (maximum ignition reach) is for the cotton fabric with no rear surface heat losses. Recall that this can be a surrogate for a folded drape or the back of an upholstered desk chair. The worst fires here threaten to ignite such objects from as much as 1 m away, the more moderate fires from more than half a meter. It is not possible to make a statement about how many secondary fires this situation would induce in the real world. One can only infer that the probability of a secondary fire is roughly proportional to the area encompassed by the ignition reach and thus to the square of the ignition reach value. Since this type of fire growth process is self-bootstrapping (the combined fires from primary and secondary objects threaten to ignite tertiary objects, etc.), it clearly is desirable to minimize the ignition reach of the primary fire.
The best measure of the size of a fire is its heat release rate. Typically some fraction of the total heat being released is given off as radiation from the plume; that fraction varies with the sooting tendency of the material burning. Thus for a simple fire geometry like a pool fire the radiant flux to the surroundings, for a given material, will be proportional to heat release rate. The fire geometries here are not simple due to the complex shape of the monitor enclosures and especially due to the presence inside these enclosures of opaque, non-flammable materials. These materials effectively break the fire plume into segments and can prevent radiation from some segments from going in some directions. One result could be that the heat flux gauge array sees little of the radiation being given off by major segments of the fire. This could disrupt the relation between fire size and heat release rate even if the monitor enclosures were all made of the same material. This disruption is less if the fire plume is so sooty that the radiation essentially all comes from those portions of the plume closest to the gauge array. All of the fire plumes here did appear to be very soot laden.
Figure 32 and show the measured relation between peak heat release rate and maximum piloted ignition reach (for the cotton fabric with no rear surface heat losses and for paper, respectively). Note that one of the points on each plot is for a keyboard alone; the remaining points are for the monitor shells with the pseudo-CRT interiors. Note also that the lowest point on each plot is for the ABS-BFR monitor enclosure where, as was noted above, specific information on ignition reach was not obtained, only a clear indication that the numbers were near zero. For the purposes of this plot these points have been assigned values of 0.05 m
Figure 33
6 Figure 29 indicates that if the heat flux was constant, as it is in the Cone calorimeter, the paper would ignite at fluxes as low as 11 to 12 kW/m2.
30
for the drape and 0.02 m for the paper as estimates of reach values that could pertain closer to that limited portion of the assembly that did burn. Clearly the fitted lines are not particularly sensitive to these values, as long as they are near zero.
While the relationship between maximum piloted ignition reach and peak heat release rate is not precise, for the reasons indicated above, it is sufficient to suggest that for a reasonable assurance that secondary ignitions will be unlikely, it is necessary to stay very near the lower left corner of the plots. Even a heat release rate peak of about 20 kW (here seen for the keyboard alone) can potentially ignite the back of an upholstered desk chair or a drape nearly 0.3 m away. This threat is directional for this type of source fire but one cannot assume any specific spatial arrangement of combustibles in the real world. It would be safest to stay well below this level of peak heat release rate. If the goal is set that the radiative ignition reach not exceed the 15 cm direct flame contact reach as some monitors collapsed, then Figure 32 suggests that the peak HRR be kept below approximately 10 kW. Note that the preceding results show that the peak HRR from an electronic enclosure depends on the size and intensity of the ignition source. Thus it is necessary to put the object in context, decide on plausible ignition sources, and test the object in full-scale to find its peak HRR. Only then can the ignition reach results presented here pertain to a specific monitor. If the only plausible ignition source is match-sized, and the object is not used in proximity with non-FR peripherals, then all FR resins here would be adequate since none led to a significant fire.
31
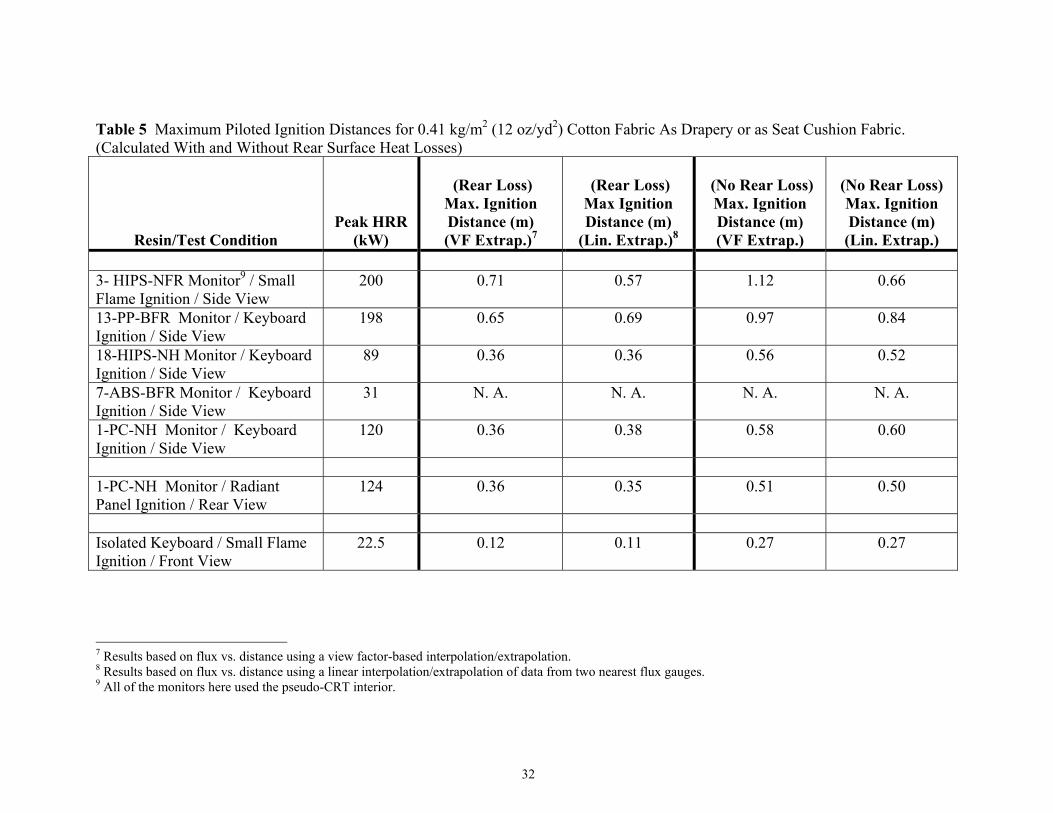
Table 5 Maximum Piloted Ignition Distances for 0.41 kg/m2 (12 oz/yd2) Cotton Fabric As Drapery or as Seat Cushion Fabric. (Calculated With and Without Rear Surface Heat Losses)
Resin/Test Condition
Peak HRR (kW)
(Rear Loss)
Max. Ignition Distance (m) (VF Extrap.)7
(Rear Loss) Max Ignition Distance (m)
(Lin. Extrap.)8
(No Rear Loss) Max. Ignition Distance (m) (VF Extrap.)
(No Rear Loss) Max. Ignition Distance (m) (Lin. Extrap.)
3- HIPS-NFR Monitor9 / Small Flame Ignition / Side View
200 0.71 0.57 1.12 0.66
13-PP-BFR Monitor / Keyboard Ignition / Side View
198 0.65 0.69 0.97 0.84
18-HIPS-NH Monitor / Keyboard Ignition / Side View
89 0.36 0.36 0.56 0.52
7-ABS-BFR Monitor / Keyboard Ignition / Side View
31 N. A. N. A. N. A. N. A.
1-PC-NH Monitor / Keyboard Ignition / Side View
120 0.36 0.38 0.58 0.60
1-PC-NH Monitor / Radiant Panel Ignition / Rear View
124 0.36 0.35 0.51 0.50
Isolated Keyboard / Small Flame Ignition / Front View
22.5 0.12 0.11 0.27 0.27
7 Results based on flux vs. distance using a view factor-based interpolation/extrapolation. 8 Results based on flux vs. distance using a linear interpolation/extrapolation of data from two nearest flux gauges. 9 All of the monitors here used the pseudo-CRT interior.
32

Table 5, Cont’d. Maximum Piloted Ignition Distances for Paper.
Resin/Test Condition
Peak HRR (kW)
Max. Ignition Distance (m) (VF Extrap.)
Max. Ignition Distance (m) (Lin. Extrap.)
3- HIPS-NFR Monitor10 / Small Flame Ignition / Side View
200 0.58 0.52
13-PP-BFR Monitor / Keyboard Ignition / Side View
198 0.56 0.62
18-HIPS-NH Monitor / Keyboard Ignition / Side View
89 0.29 0.28
7-ABS-BFR Monitor / Keyboard Ignition / Side View
31 N. A. N. A.
1-PC-NH Monitor / Keyboard Ignition / Side View
120 0.31 0.30
1-PC-NH Monitor / Radiant Panel Ignition / Rear View
124 0.26 0.29
Isolated Keyboard / Small Flame Ignition / Front View
22.5 0.08 0.06
10 All of the monitors here used the pseudo-CRT interior.
33

o
Figure 28. Comparison of Cone ignition data (triangles) and ignition model (black dots) using indicated values of ignition temperature and thermal inertia; cotton fabric.
o
o
o
2
Figure 29. Comparison of Cone ignition data (black dots) and ignition model prediction (triangles) using indicated properties; paper stack.
34
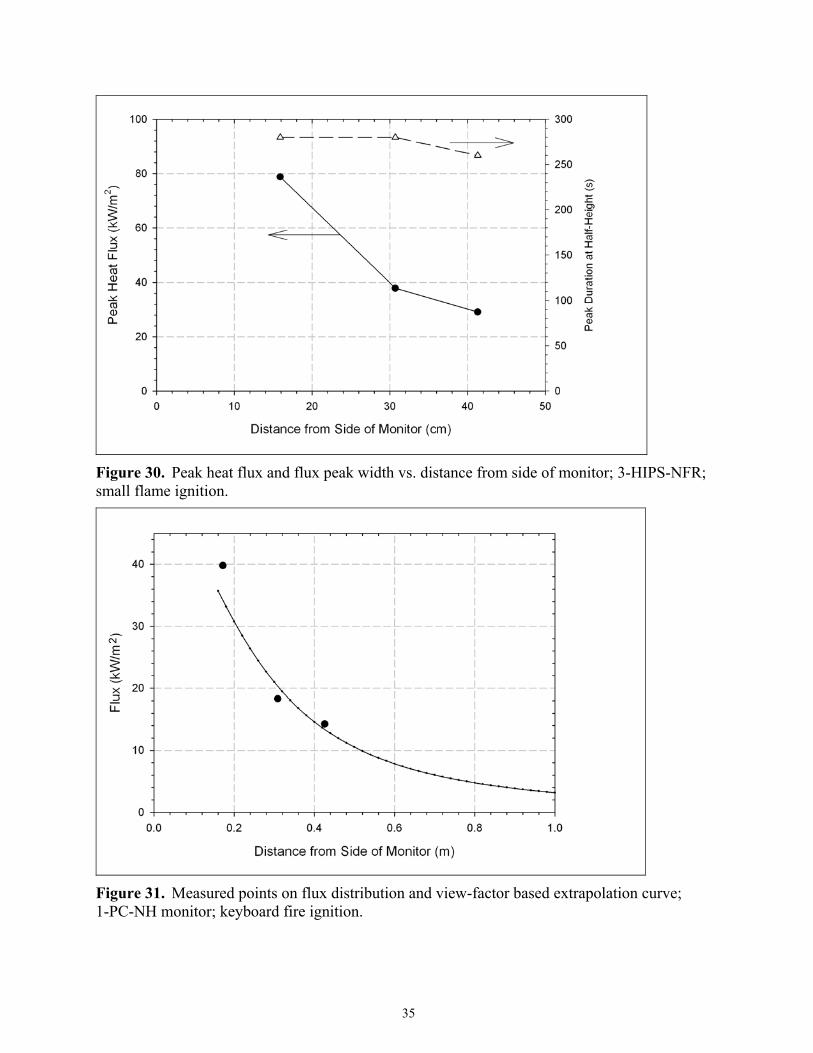
Figure 30. Peak heat flux and flux peak width vs. distance from side of monitor; 3-HIPS-NFR; small flame ignition.
2
Figure 31. Measured points on flux distribution and view-factor based extrapolation curve; 1-PC-NH monitor; keyboard fire ignition.
35
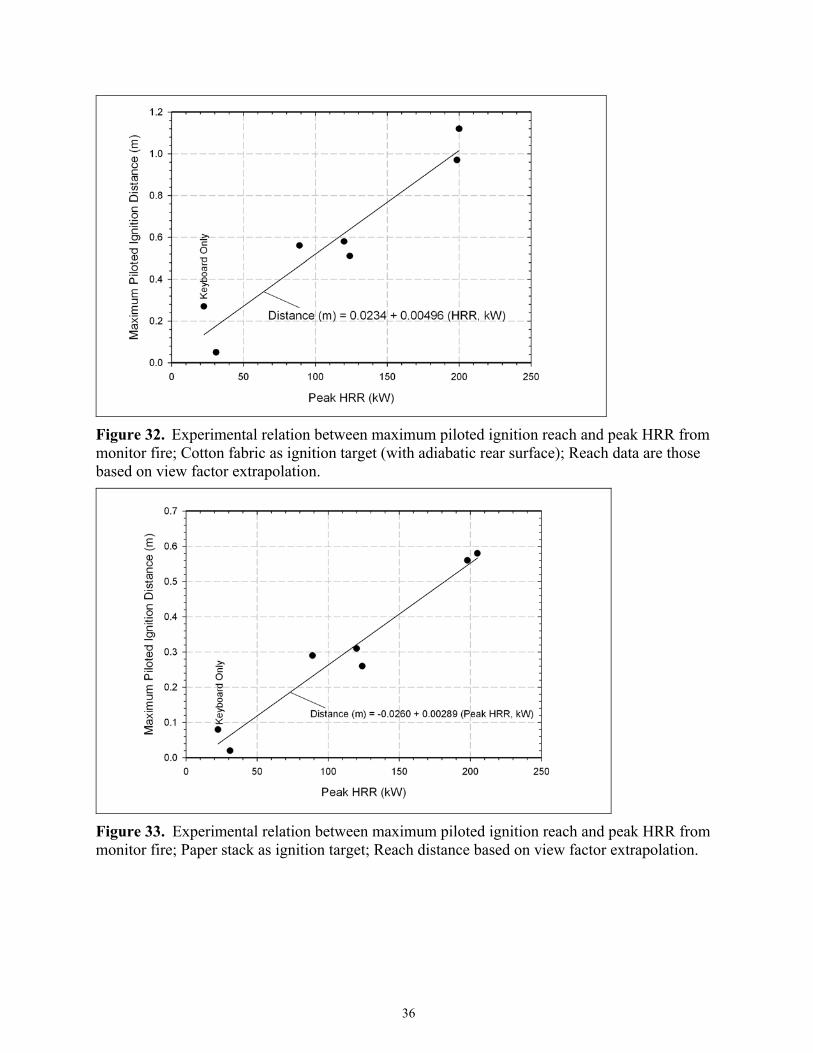
Figure 32. Experimental relation between maximum piloted ignition reach and peak HRR from monitor fire; Cotton fabric as ignition target (with adiabatic rear surface); Reach data are those based on view factor extrapolation.
Figure 33. Experimental relation between maximum piloted ignition reach and peak HRR from monitor fire; Paper stack as ignition target; Reach distance based on view factor extrapolation.
36
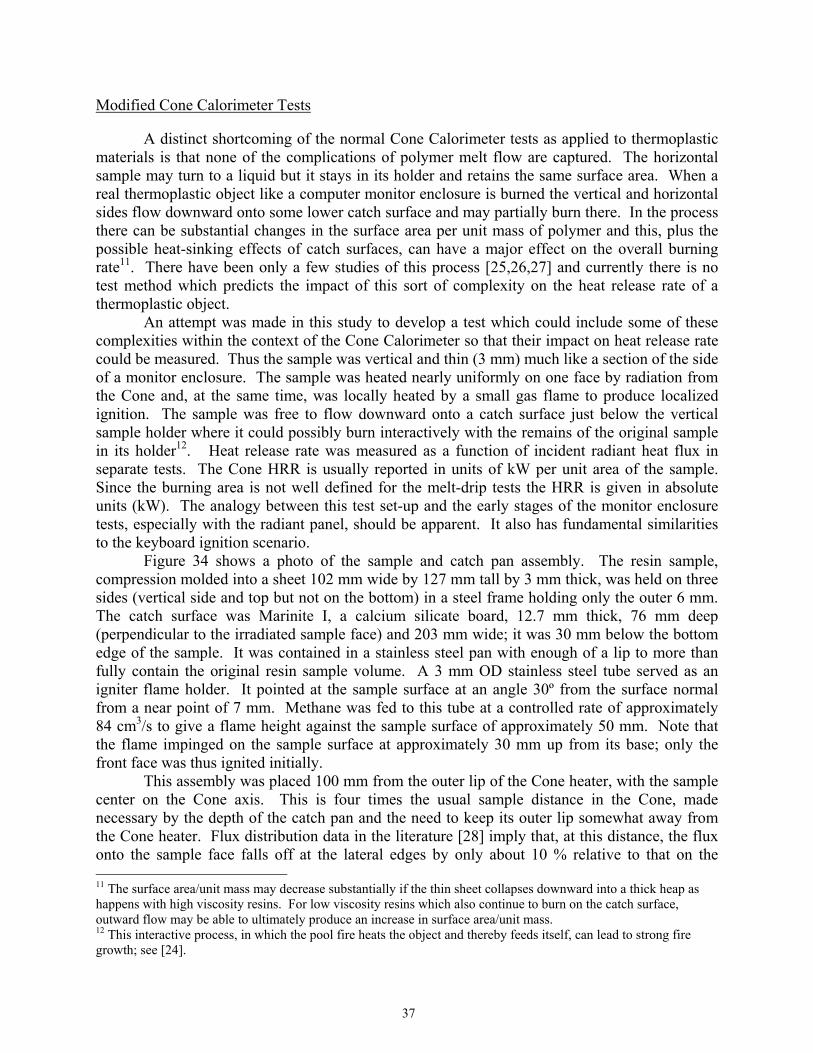
Modified Cone Calorimeter Tests
A distinct shortcoming of the normal Cone Calorimeter tests as applied to thermoplastic materials is that none of the complications of polymer melt flow are captured. The horizontal sample may turn to a liquid but it stays in its holder and retains the same surface area. When a real thermoplastic object like a computer monitor enclosure is burned the vertical and horizontal sides flow downward onto some lower catch surface and may partially burn there. In the process there can be substantial changes in the surface area per unit mass of polymer and this, plus the possible heat-sinking effects of catch surfaces, can have a major effect on the overall burning rate11. There have been only a few studies of this process [25,26,27] and currently there is no test method which predicts the impact of this sort of complexity on the heat release rate of a thermoplastic object.
An attempt was made in this study to develop a test which could include some of these complexities within the context of the Cone Calorimeter so that their impact on heat release rate could be measured. Thus the sample was vertical and thin (3 mm) much like a section of the side of a monitor enclosure. The sample was heated nearly uniformly on one face by radiation from the Cone and, at the same time, was locally heated by a small gas flame to produce localized ignition. The sample was free to flow downward onto a catch surface just below the vertical sample holder where it could possibly burn interactively with the remains of the original sample in its holder12. Heat release rate was measured as a function of incident radiant heat flux in separate tests. The Cone HRR is usually reported in units of kW per unit area of the sample. Since the burning area is not well defined for the melt-drip tests the HRR is given in absolute units (kW). The analogy between this test set-up and the early stages of the monitor enclosure tests, especially with the radiant panel, should be apparent. It also has fundamental similarities to the keyboard ignition scenario.
Figure 34 shows a photo of the sample and catch pan assembly. The resin sample, compression molded into a sheet 102 mm wide by 127 mm tall by 3 mm thick, was held on three sides (vertical side and top but not on the bottom) in a steel frame holding only the outer 6 mm. The catch surface was Marinite I, a calcium silicate board, 12.7 mm thick, 76 mm deep (perpendicular to the irradiated sample face) and 203 mm wide; it was 30 mm below the bottom edge of the sample. It was contained in a stainless steel pan with enough of a lip to more than fully contain the original resin sample volume. A 3 mm OD stainless steel tube served as an igniter flame holder. It pointed at the sample surface at an angle 30º from the surface normal from a near point of 7 mm. Methane was fed to this tube at a controlled rate of approximately 84 cm3/s to give a flame height against the sample surface of approximately 50 mm. Note that the flame impinged on the sample surface at approximately 30 mm up from its base; only the front face was thus ignited initially.
This assembly was placed 100 mm from the outer lip of the Cone heater, with the sample center on the Cone axis. This is four times the usual sample distance in the Cone, made necessary by the depth of the catch pan and the need to keep its outer lip somewhat away from the Cone heater. Flux distribution data in the literature [28] imply that, at this distance, the flux onto the sample face falls off at the lateral edges by only about 10 % relative to that on the 11 The surface area/unit mass may decrease substantially if the thin sheet collapses downward into a thick heap as happens with high viscosity resins. For low viscosity resins which also continue to burn on the catch surface, outward flow may be able to ultimately produce an increase in surface area/unit mass. 12 This interactive process, in which the pool fire heats the object and thereby feeds itself, can lead to strong fire growth; see [24].
37
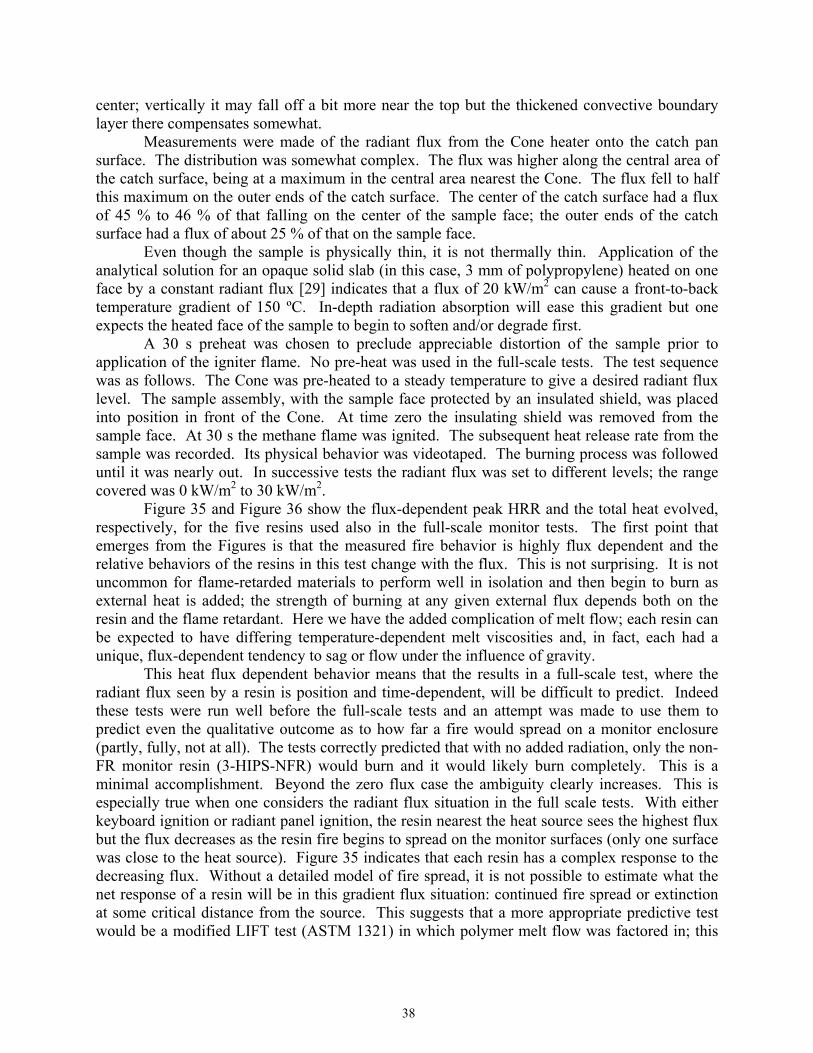
center; vertically it may fall off a bit more near the top but the thickened convective boundary layer there compensates somewhat.
Measurements were made of the radiant flux from the Cone heater onto the catch pan surface. The distribution was somewhat complex. The flux was higher along the central area of the catch surface, being at a maximum in the central area nearest the Cone. The flux fell to half this maximum on the outer ends of the catch surface. The center of the catch surface had a flux of 45 % to 46 % of that falling on the center of the sample face; the outer ends of the catch surface had a flux of about 25 % of that on the sample face.
Even though the sample is physically thin, it is not thermally thin. Application of the analytical solution for an opaque solid slab (in this case, 3 mm of polypropylene) heated on one face by a constant radiant flux [29] indicates that a flux of 20 kW/m2 can cause a front-to-back temperature gradient of 150 ºC. In-depth radiation absorption will ease this gradient but one expects the heated face of the sample to begin to soften and/or degrade first.
A 30 s preheat was chosen to preclude appreciable distortion of the sample prior to application of the igniter flame. No pre-heat was used in the full-scale tests. The test sequence was as follows. The Cone was pre-heated to a steady temperature to give a desired radiant flux level. The sample assembly, with the sample face protected by an insulated shield, was placed into position in front of the Cone. At time zero the insulating shield was removed from the sample face. At 30 s the methane flame was ignited. The subsequent heat release rate from the sample was recorded. Its physical behavior was videotaped. The burning process was followed until it was nearly out. In successive tests the radiant flux was set to different levels; the range covered was 0 kW/m2 to 30 kW/m2.
Figure 35 and show the flux-dependent peak HRR and the total heat evolved, respectively, for the five resins used also in the full-scale monitor tests. The first point that emerges from the Figures is that the measured fire behavior is highly flux dependent and the relative behaviors of the resins in this test change with the flux. This is not surprising. It is not uncommon for flame-retarded materials to perform well in isolation and then begin to burn as external heat is added; the strength of burning at any given external flux depends both on the resin and the flame retardant. Here we have the added complication of melt flow; each resin can be expected to have differing temperature-dependent melt viscosities and, in fact, each had a unique, flux-dependent tendency to sag or flow under the influence of gravity.
Figure 36
This heat flux dependent behavior means that the results in a full-scale test, where the radiant flux seen by a resin is position and time-dependent, will be difficult to predict. Indeed these tests were run well before the full-scale tests and an attempt was made to use them to predict even the qualitative outcome as to how far a fire would spread on a monitor enclosure (partly, fully, not at all). The tests correctly predicted that with no added radiation, only the non-FR monitor resin (3-HIPS-NFR) would burn and it would likely burn completely. This is a minimal accomplishment. Beyond the zero flux case the ambiguity clearly increases. This is especially true when one considers the radiant flux situation in the full scale tests. With either keyboard ignition or radiant panel ignition, the resin nearest the heat source sees the highest flux but the flux decreases as the resin fire begins to spread on the monitor surfaces (only one surface was close to the heat source). Figure 35 indicates that each resin has a complex response to the decreasing flux. Without a detailed model of fire spread, it is not possible to estimate what the net response of a resin will be in this gradient flux situation: continued fire spread or extinction at some critical distance from the source. This suggests that a more appropriate predictive test would be a modified LIFT test (ASTM 1321) in which polymer melt flow was factored in; this
38

test incorporates a radiant flux gradient and focuses on opposed flow fire spread which was at the heart of the full-scale fires.
Given the above discussion and the complexity of the behavior in and , it is somewhat arbitrary to pick a flux for correlation purposes. Nevertheless a flux of
22.5 kW/m2 was chosen here to illustrate the extent of correlation between the Cone melt/drip tests and the full-scale tests (in this case the tests with keyboard ignition). Figure 37 shows the relation between the peak HRR in the full-scale tests and the peak HRR in the Cone scale tests at this radiant flux. The individual full-scale test results have been plotted against the average of the bench scale results (from two tests with each resin). While the slope of the line is qualitatively correct, the scatter about the line is considerable.
Figure 35 Figure 36
Figure 34. Overall view of sample holder, local ignition source and catch pan.
39

2
Figure 35. Peak heat release rate measured in Cone melt/drip experiments as a function of heat flux.
Figflux
2
2
ure 36. Total heat release rate measured in Cone melt/drip experiments as a function of heat .
40

y = 79.15x - 97.27R2 = 0.75
0
50
100
150
200
250
0.0 0.5 1.0 1.5 2.0 2.5 3.0 3.5 4.0
Peak HRR at 22.5 kW/m2 in Cone Melt Drip Test (kW)
Peak
HR
R in
Ful
l Sca
le T
ests
with
Key
boar
d Ig
nitio
n (k
W)
Figure 37. Correlation between peak HRR in Cone melt/drip experiments (at a flux of 22.5 kW/m2) and peak HRR in full-scale monitor tests with keyboard ignition. The open circles represent monitor tests using real CRT.
41

Bench-Scale and Full-Scale Comparison A summary of results from all of the bench-scale tests [2] and the full-scale monitor tests described in this report is shown in Table 6. The bench-scale test results are for 3.2 mm thick samples. The full-scale peak HRR results in Table 6 represent the larger of the replicate measurements. Qualitatively, the UL94 vertical burn test and the melt/drip vertical Cone test at zero external heat flux gave the best indication of the full-scale monitor fire performance when exposed to the needle flame ignition source. All of the materials that self-extinguished in the UL94 test resisted sustained ignition in the full-scale monitor tests.
Table 6. Comparison of Bench-Scale and Full-Scale test results.
1-PC
-NH
3-H
IPS-
NFR
7-A
BS-
BFR
13-P
P-B
FR
18-H
IPS-
NH
UL94 Classification V-0 HB V-0 V-2 V-1 UL94 Mean after-flame time, t1+t2 (s) 1.0 34.6 0.0 8.1 19.8
Standard Cone Peak HRR @ 50 kW/m2 (kW) 4.6 10.3 3.2 15.0 3.1
Cone Time to Ignition (s) 63 40 42 38 30 Glow Wire Ignition Temperature (oC) 825 750 725 800 --
Melt/Drip Cone Peak HRR @ 0 kW/m2 (kW) -- 5.2 -- -- --
Melt/Drip Cone Peak HRR @ 22.5 kW/m2 (kW) 1.8 6.5 2.2 3.5 2.5
Full-Scale Peak HRR, needle flame ignition (kW) -- 208 -- -- --
Full-Scale Peak HRR, keyboard ignition (kW) 120 -- 44 205 115
Full-Scale Peak HRR, radiant panel ignition (kW) 124 240 25 193 94
The time to ignition in the Cone and the Glow Wire Ignition Temperature were the poorest indicators of full-scale fire performance in these tests. Although the presence of a flame retardant additive can cause a material to ignite faster and at a lower temperature, these factors did not help predict whether or not the flame would propagate once ignited. The peak HRR from the standard Cone Calorimeter test, ASTM E1354-99 [30], is often used to describe fire performance. The peak HRR from the Cone tests was not a good predictor of the full-scale response to the local ignition source in this study. A notable example of this is the polypropylene specimen (13-PP-BFR) that has a very high peak HRR in the Cone but did not ignite when exposed to the needle flame. In addition to examining the peak HRR, the peak HRR
42
extrapolated to zero heat flux (HRRo) and the Fire Growth Rate Index (FIGRA) were also considered but did not show a large improvement in predicting the needle flame ignition full-scale response.
The cone results compared more favorably with the full-scale monitor tests having a larger ignition source. The two specimens with the highest peak HRR in both the standard and melt/drip cone tests also produced the largest fires when exposed to the keyboard fire and radiant panel ignition sources. More research is needed to develop and interpret bench-scale tests capable of predicting full-scale performance. The most reliable existing measure is full-scale testing, assuming the appropriate ignition scenario can be identified.
Difficulties of Correlating Bench-Scale and Full-Scale Fire Behaviors Bench-scale tests that predict full-scale fire behavior have been sought for decades in a variety of full-scale product contexts. Here it is worth considering in some detail the processes occurring during the full-scale burning of an item such as a computer monitor so as to get a better feel for what one is asking the bench-scale test to predict.
All of the resins considered here are thermoplastic. As a result they begin to melt and flow downward as heat from nearby burning material reaches them. Since the typical resin thickness is only a few millimeters, heat permeates the wall thickness in about a minute and those walls begin to collapse even before they begin to melt. By the time a spreading fire on a computer monitor housing is reaching its peak, the original geometry has been largely lost with some melted resin material on the table support, some material draped and flowing over the inert components within the monitor and some material still recognizable as housing walls but displaced and re-oriented. Much of the exposed surface is burning. Due to the convoluted burning surface geometry, various burning surfaces see a wide variety of radiant fluxes coming from the fire plume(s) and from other hot surfaces. This affects the heat release rate from each of these burning surfaces. In short, the peak heat release rate of this full-scale object is the sum of the heat release from a complex distribution of burning melt surfaces (of unknown total area) seeing a full spectrum of heat fluxes and exposed to widely varying heat sinking effects from the materials on which they lay. In general, this distribution will depend on the location, size and intensity of the igniter, so it is not unique.
A simple bench-scale test cannot capture all of this complexity. Extremes of behavior can, however, be captured. If the ignition source is small, a flame-retarded material may not even ignite. A test such as UL 94 easily picks up this behavior since it is, in this case, virtually a full-scale replication of the localized ignition exposure. A material which is non flame-retarded can be expected to have a larger heat release rate than FR materials over much of the expected heat flux range; then the Cone Calorimeter will tend to flag it as likely to give a high peak heat release rate in a full-scale test. Extremely low resin melt viscosity can lead to a large pool fire and a high peak heat release rate. A test that incorporates melt flow behavior may pick this up. All such tests may correctly sort out the resins that are very low in flammability from those that are very high in flammability. Most resins are more intermediate in character. A bench-scale test that can correctly sort out the balance of resin characteristics that dictate the complete range of full-scale fire behavior is much more challenging.
43
Conclusions
• Progressively larger and more intense ignition sources caused the burning of an
increasing number of tested resins o The use of flame retardant materials (including non-halogenated) provided
adequate protection against the needle flame that represented a “candle size” ignition source. The fire hazard from needle flame ignition of the enclosure having a non-flame-retarded material (3-HIPS-NFR) was significant and resulted in the threat of fire spread to nearby objects.
o The keyboard fire ignition source produced a significant fire hazard for all but one (7-ABS-BFR) of the monitor enclosures.
o The radiant panel (heat flux=21 kW/m2) used to simulate an existing fire produced significant burning for all of the monitor specimens.
• Several bench-scale flammability measures were assessed for ability to predict full-scale monitor behavior with limited success.
o The UL94 vertical burn test was a good indicator of the likelihood of the full-scale specimens to resist sustained ignition by a “candle size” flame.
o The Cone Calorimeter test was a reasonable indictor of the response of the monitor specimens to ignition by a nearby burning object.
o The Glow Wire Ignition Test was a poor indicator of the full-scale response to an open flame ignition source.
o The modified Cone (melt/drip) test provided information on both self-extinction and radiant forced burning of the materials. The predictive value of this test for full scale peak HRR was only marginally better than the standard Cone test.
o More research is needed to develop and interpret bench-scale tests capable of predicting full-scale performance. The best existing measure is full-scale testing (if the ignition scenario is known).
• Electronic enclosure fires pose a three-fold threat to surrounding objects o Direct contact with flames in the plume; flame height reached 1.5 m for some of
the monitors in this study. o Flaming melt flow can reach the floor or spread on a desk surface. This threat is
largest for low melt viscosity materials such as polypropylene. o Radiant ignition of remote objects
A 200 kW (peak HRR) fire produced a threat distance of 1.1 m for upholstery fabric
A (20 to 25) kW (peak HRR) fire produced a threat distance of 0.3 m for upholstery fabric
A peak HRR of less than 10 kW would likely produce a minimal radiant ignition threat to its surroundings, comparable to the threat of direct flame contact.
• Peripheral items (such as the keyboards in this study) are often made from non-FR materials and can serve as an ignition source for other items if ignited.
44
References
[1] M. De Poortere, C. Schonbach, and M. Simonson, The Fire Safety of TV Set Enclosure Materials, a Survey of European Statistics, Fire and Materials 24 (1), 53-60 (2000).
[2] M. Bundy and T. J. Ohlemiller, Bench-Scale Flammability Measures for Electronic Equipment, NISTIR-7031 NIST, Gaithersburg, MD, (2003).
[3] R. Bieniarz, Fire Experiments on Structural Foam Plastic Equipment Enclosures, File C597 Underwriters Laboratories, (1981).
[4] V. Babrauskas, R. G. Gann, R. H. Harris, and B. C. Levin, Fire Hazard Comparison of Fire-Retarded and Non-Fire-Retarded Products, NBS-SP749 NBS, Gaithersburg, MD, 1-86 (1988).
[5] M. Simonson, Report for the Fire Testing of Computer Monitors, R31151 SP, (1999).
[6] M. Simonson, Report for the Fire Testing of Deskjet Printers, P005848 SP, (2000).
[7] M. Simonson, Report for the Fire Testing of One Printer and Two CPU's, P008664 SP, (2000).
[8] D. Bliss and M. Simonson, Fire Performance of IT Equipment Studied in the Furniture Calorimeter, Interflam171-179 (2001).
[9] J. Hietaniemi, J. Mangs, and T. Hakkarainen, Burning of Electrical Household Appliances – An Experimental Study, RN-2084 VTT, (2001).
[10] J. H. Troitzsch, Fire Safety of TV-Sets and PC-Monitors, EFRA, (1998).
[11] H. A. Malik, Assessment of Flammability of Plastic Material Used As Electrical Appliance Enclosures, CPSC/ES/TR98/001 (1998).
[12] Safety Engineering Laboratories, Television and Electronic Device Burn Demonstrations - Product Aftermarket Evaluation, CEA, (2000).
[13] D. Madrzykowski, Office Work Station Heat Release Rate Study: Full Scale Vs. Bench Scale, Interflam47-55 (1996).
[14] J. R. Hall, Fires Involving Appliance Housings - Is There a Clear and Present Danger?, Fire Technology 38 (2), 179-198 (2002).
[15] S. Hong, J. Yang, S. Ahn, Y. Mun, and G. Lee, Flame Retardancy Performance of Various UL94 Classified Materials Exposed to External Ignition Sources, Fire and Materials 28 (1), 25-31 (2004).
[16] C. Huggett, Estimation of Rate of Heat Release by Means of Oxygen-Consumption Measurements, Fire and Materials 4 (2), 61-65 (1980).
45

46
[17] W. J. Parker, Calculations of the Heat Release Rate by Oxygen-Consumption for Various Applications, Journal of Fire Sciences 2 (5), 380-395 (1984).
[18] R. A. Bryant, T. J. Ohlemiller, E. L. Johnsson, A. Hamins, B. S. Grove, A. Maranghides, G. W. Mulholland, and W. F. Guthrie, The NIST 3 Megawatt Quantitative Heat Release Rate Facility, NISTSP-1007 1-75 (2003).
[19] B. J. McCaffrey and G. Heskestad, Robust Bidirectional Low-Velocity Probe for Flame and Fire Applications, Combustion and Flame 1 125-127 (1976).
[20] ASTM E 2029 - 99, Standard Test Method for Volumetric and Mass Flow Measurement in a Duct Using Tracer Gas Dilution, ASTM International, West Conshohocken, Pennsylvania, (1999).
[21] B. Messerschmidt and P. van Hees, Influence of Delay Times and Response Times on Heat Release Measurements, Fire and Materials 24 (2), 121-130 (2000).
[22] T. J. Ohlemiller and R. G. Gann, Estimating Reduced Fire Risk Resulting From an Improved Mattress Flammability Standard, Technical Note 1446 NIST, Gaithersburg, MD, (2002).
[23] NIST Report on the World Trade Center Collapse, in Preparation.
[24] E. Eckert and R. Drake, Analysis of Heat and Mass Transfer, McGraw-Hill, New York, 622- (1972).
[25] J. Zhang, T. Shields, and G. Silcock, Effect of Melting Behavior on Upward Flame Spread of Thermoplastics, Fire and Materials 21 1-6 (1997).
[26] J. Sheratt and D. Drysdale, Effect of the Melt Flow Process on the Fire Behavior of Thermoplastics, Proceedings of Interflam '01 Interscience Communications, London, 149-159 (2001).
[27] T. Ohlemiller, J. Shields, K. Butler, B. Collins, and M. Seck, Exploring the Role of Polymer Melt Viscosity in Melt Flow and Flammability Behavior, Proceedings of the Fire Retardant Chemicals Association Annual Meeting, (2000).
[28] K. T. Paul, Cone Calorimeter: Initial Experiences of Calibration and Use, Fire Safety Journal 22 (1), 67-87 (1994).
[29] H. Carslaw and J. Jaeger, Conduction of Heat in Solids, 2 Oxford University Press, London, 113- (1959).
[30] ASTM E 1354-99, Standard Test Method for Heat and Visible Smoke Release Rates for Materials and Products Using an Oxygen Consumption Calorimeter, ASTM International, West Conshohocken, Pennsylvania, (1999).