FULL REPORT VRE - kbsec.com.vn · •Received the ownership from Vingroup in these shopping malls:...
19
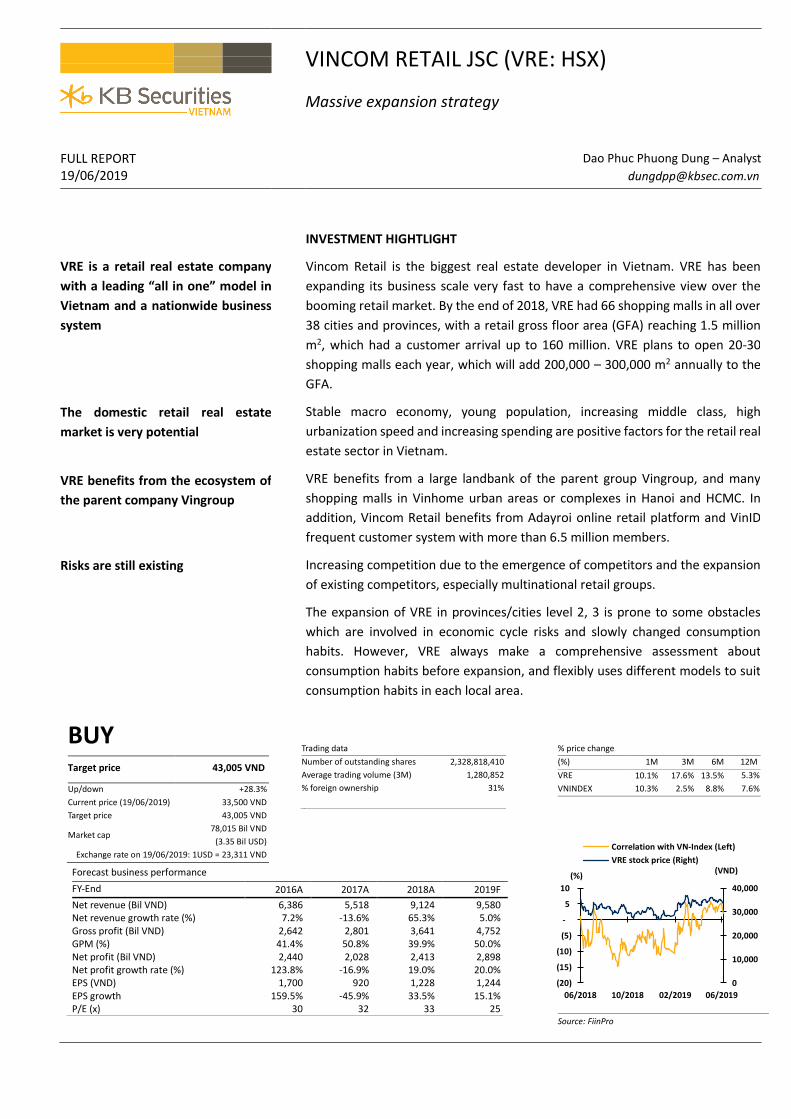
VINCOM RETAIL JSC (VRE: HSX) Massive expansion strategy FULL REPORT 19/06/2019 Dao Phuc Phuong Dung – Analyst [email protected] VRE is a retail real estate company with a leading “all in one” model in Vietnam and a nationwide business system The domestic retail real estate market is very potential VRE benefits from the ecosystem of the parent company Vingroup Risks are still existing INVESTMENT HIGHTLIGHT Vincom Retail is the biggest real estate developer in Vietnam. VRE has been expanding its business scale very fast to have a comprehensive view over the booming retail market. By the end of 2018, VRE had 66 shopping malls in all over 38 cities and provinces, with a retail gross floor area (GFA) reaching 1.5 million m 2 , which had a customer arrival up to 160 million. VRE plans to open 20-30 shopping malls each year, which will add 200,000 – 300,000 m 2 annually to the GFA. Stable macro economy, young population, increasing middle class, high urbanization speed and increasing spending are positive factors for the retail real estate sector in Vietnam. VRE benefits from a large landbank of the parent group Vingroup, and many shopping malls in Vinhome urban areas or complexes in Hanoi and HCMC. In addition, Vincom Retail benefits from Adayroi online retail platform and VinID frequent customer system with more than 6.5 million members. Increasing competition due to the emergence of competitors and the expansion of existing competitors, especially multinational retail groups. The expansion of VRE in provinces/cities level 2, 3 is prone to some obstacles which are involved in economic cycle risks and slowly changed consumption habits. However, VRE always make a comprehensive assessment about consumption habits before expansion, and flexibly uses different models to suit consumption habits in each local area. BUY Target price 43,005 VND Up/down +28.3% Current price (19/06/2019) 33,500 VND Target price 43,005 VND Market cap 78,015 Bil VND (3.35 Bil USD) Exchange rate on 19/06/2019: 1USD = 23,311 VND Trading data Number of outstanding shares 2,328,818,410 Average trading volume (3M) 1,280,852 % foreign ownership 31% Forecast business performance FY-End 2016A 2017A 2018A 2019F Net revenue (Bil VND) 6,386 5,518 9,124 9,580 Net revenue growth rate (%) 7.2% -13.6% 65.3% 5.0% Gross profit (Bil VND) 2,642 2,801 3,641 4,752 GPM (%) 41.4% 50.8% 39.9% 50.0% Net profit (Bil VND) 2,440 2,028 2,413 2,898 Net profit growth rate (%) 123.8% -16.9% 19.0% 20.0% EPS (VND) 1,700 920 1,228 1,244 EPS growth 159.5% -45.9% 33.5% 15.1% P/E (x) 30 32 33 25 % price change (%) 1M 3M 6M 12M VRE 10.1% 17.6% 13.5% 5.3% VNINDEX 10.3% 2.5% 8.8% 7.6% Source: FiinPro 0 10,000 20,000 30,000 40,000 (20) (15) (10) (5) - 5 10 06/2018 10/2018 02/2019 06/2019 Correlation with VN-Index (Left) VRE stock price (Right) (%) (VND)
Transcript of FULL REPORT VRE - kbsec.com.vn · •Received the ownership from Vingroup in these shopping malls:...
VINCOM RETAIL JSC (VRE: HSX)
Massive expansion strategy
FULL REPORT 19/06/2019
Dao Phuc Phuong Dung – Analyst
VRE is a retail real estate company
with a leading “all in one” model in
Vietnam and a nationwide business
system
The domestic retail real estate
market is very potential
VRE benefits from the ecosystem of
the parent company Vingroup
Risks are still existing
INVESTMENT HIGHTLIGHT
Vincom Retail is the biggest real estate developer in Vietnam. VRE has been
expanding its business scale very fast to have a comprehensive view over the
booming retail market. By the end of 2018, VRE had 66 shopping malls in all over
38 cities and provinces, with a retail gross floor area (GFA) reaching 1.5 million
m2, which had a customer arrival up to 160 million. VRE plans to open 20-30
shopping malls each year, which will add 200,000 – 300,000 m2 annually to the
GFA.
Stable macro economy, young population, increasing middle class, high
urbanization speed and increasing spending are positive factors for the retail real
estate sector in Vietnam.
VRE benefits from a large landbank of the parent group Vingroup, and many
shopping malls in Vinhome urban areas or complexes in Hanoi and HCMC. In
addition, Vincom Retail benefits from Adayroi online retail platform and VinID
frequent customer system with more than 6.5 million members.
Increasing competition due to the emergence of competitors and the expansion
of existing competitors, especially multinational retail groups.
The expansion of VRE in provinces/cities level 2, 3 is prone to some obstacles
which are involved in economic cycle risks and slowly changed consumption
habits. However, VRE always make a comprehensive assessment about
consumption habits before expansion, and flexibly uses different models to suit
consumption habits in each local area.
BUY
Target price 43,005 VND
Up/down +28.3%
Current price (19/06/2019) 33,500 VND
Target price 43,005 VND
Market cap 78,015 Bil VND
(3.35 Bil USD)
Exchange rate on 19/06/2019: 1USD = 23,311 VND
Trading data
Number of outstanding shares 2,328,818,410
Average trading volume (3M) 1,280,852
% foreign ownership 31%
Forecast business performance
FY-End 2016A 2017A 2018A 2019F
Net revenue (Bil VND) 6,386 5,518 9,124 9,580 Net revenue growth rate (%) 7.2% -13.6% 65.3% 5.0% Gross profit (Bil VND) 2,642 2,801 3,641 4,752 GPM (%) 41.4% 50.8% 39.9% 50.0% Net profit (Bil VND) 2,440 2,028 2,413 2,898 Net profit growth rate (%) 123.8% -16.9% 19.0% 20.0% EPS (VND) 1,700 920 1,228 1,244 EPS growth 159.5% -45.9% 33.5% 15.1% P/E (x) 30 32 33 25
% price change
(%) 1M 3M 6M 12M
VRE 10.1% 17.6% 13.5% 5.3%
VNINDEX 10.3% 2.5% 8.8% 7.6%
Source: FiinPro
0
10,000
20,000
30,000
40,000
(20)
(15)
(10)
(5)
-
5
10
06/2018 10/2018 02/2019 06/2019
Correlation with VN-Index (Left)
VRE stock price (Right)
(%)(VND)

FULL REPORT VRE KBSV RESEARCH
2
I. OVERVIEW
HISTORY OF DEVELOPMENT
Figure 1: The history of development of Vincom Retail
Source: VRE
BUSINESS SCOPE AND MARKET POSITION
Vincom Retail is the biggest real
estate developer in Vietnam
Vincom Retail (HSX: VRE) is a brand that operates in retail market of Vingroup
(HSX: VIC). VRE mainly operates in providing retail shopping malls for lease
and accompanied services, and invests and develops real estate forms.
By the end of December 31, 2018, VRE had 66 shopping malls operating in 38
cities and provinces all over the country, with a retail GFA reaching about 1.5
million m2. These malls had a customer visit of 160 million to go shopping and
experience services, gaining 45 million customer arrivals against 2017.
Vincom Retail has 4 main product lines which are Vincom Center, Vincom
Mega Mall, Vincom Plaza, and Vincom+.
REVENUE STRUCTURE
Earnings from leasing of
investment properties had the
highest proportion in the total
revenue
The main source of VRE revenue comes from the leasing of investment
properties and rendering related services, with a weight of over 60% total
revenue in 2018. The revenue from sale of inventory properties accounted for
38% total revenue in 2018. In 2018, the sale from real estate selling took a
high proportion thanks to the hand-over of the two high-rise projects which
were the condotels in Da Nang and Bac Ninh. Other revenues (from the
operation and management of some offices surrounding Vincom shopping
malls and some other real estate projects) took a small component, just more
than 1% total revenue (Figure 3).
2012•Established Vincom Retail Co., Ltd.
2013
•Changed from a limited company to a corporation
•Received the ownership from Vingroup in these shopping malls: Vincom Center Ba Trieu, Vincom Center DongKhoi, Vincom Plaza Long Bien, Vincom Mega Mall Royal City
•Received the first USD200 million from Warburg Pincus Investment III B.V. and Credit Suisse AG SingaporeBranch
2014
•Received the ownership of Vincom Mega Mall Times City from Vingroup
•Opened Vincom Plaza Ha Long
2015
•Opened Vincom Mega Mall Thao Dien
•Opened 10 new shopping malls and bought 5 Maximark supermarkets. Owned 21 shopping malls, with a retailGFA reaching about 850,000 m2
•Received the second investment capital of USD100 million from Warburg Pincus Investments III B.V
2016
•Launched Vincom+
•Opened 10 new shopping malls, owned 31 shopping malls, with a retail GFA reaching about 1 million m2
•Sold 700 shophouses, condotels, shopoffices in 5 provinces and cities
•Received added capital and other assests worth VND8,610 billion from Vingroup
2017
•Opened 15 shopping malls, owned 46 shopping malls, with a retail GFA reaching about 1.2 million m2
•Sold over 1,200 appartments, condotels, shophouses in 8 provinces and cities
•Listed on the HOSE (HSX: VRE)
2018
•Opened 20 shopping malls, owned 66 shopping malls, with a retail GFA reaching about 1.5 million m2.
•Opened Vincom Center Landmark 81 - the highest building in Vietnam

FULL REPORT VRE KBSV RESEARCH
3
Figure 2: Revenue over the years Figure 3: 2018 revenue structure
Source: VRE Source: VRE
BUSINESS AND OWNERSHIP STRUCTURE
By December 31, 2018, Vincom Retail had 3 subsidiaries (Figure 5).
VRE currently has a charter capital of VND19,010 billion. VRE has a big
shareholder Saidong Urban Development & Investment J, owned by Vingroup
(32.3%); Vingroup, directly owns VRE (18.4%), and Hanoi Southern City
Development Joint Stock Company owns (8.3%). VRE also attracted some
foreign funds such as WP Investments III B.V (4.89%), Credit Suisse AG (1.63%)
(Figure 4).
Figure 4: Ownership structure Figure 5: List of subsidiaries
Source: VRE Source: VRE
60.3%
37.6%
2.0%
Leasing of Investment PropertiesSale of Inventory PropertiesOther revenue
2,4073,805 4,455
5,506
3,267
2,556 951
3,433
26424
112
185
0
2,000
4,000
6,000
8,000
10,000
2015 2016 2017 2018
Other revenue
Sale of Inventory Properties
Leasing of Investment Properties(Bn VND)
32.3%
18.4%
8.3%
41.1%
Sai Dong Investment & Development JSC
Vingroup JSC
Hanoi Southern City Development JSC
Subsidiaries Ownership (%)
Vincom Retail Northern Vietnam Co., Ltd 100
Vincom Retail Southern Vietnam Co., Ltd 100
Suoi Hoa Urban Development and Investment JSC. 97.27

FULL REPORT VRE KBSV RESEARCH
4
II. BUSINESS OPERATION
With the strategy to expand the system to the whole country, in 2018 VRE
expanded its business system to 14 provinces more than in 2017, which raised
the total number of provinces and cities included in VRE system to 38. In
particular, VRE business operation mainly concentrated in Hanoi and HCMC
(with 10% of total revenue in 2018 for each city) with typical models such as
Vincom Center, and Vincom Megamall (accounting for 45% GFA of the whole
system)
Figure 6: VRE business network in 2018
Source: VRE
TOTAL LEASING REVENUE IN 2018
TOTAL LEASING REVENUE IN 2018

FULL REPORT VRE KBSV RESEARCH
5
1. Leasing of real estate properties
VRE is a leading company in
shopping mall development,
ownership and management in
terms of scale and growth rate in
Vietnam
In 2018, VRE opened 20 new shopping malls, of which there are 2 Vincom
Center malls, 15 Vincom Plaza and 3 Vincom+ malls – a record high number
of shopping malls opened in one year. In particular, in July 2018, Vincom
Center Landmark 81 was officially launched at Landmark 81 – the highest
building in Vietnam with (Figure 9). In addition, 15 shopping malls were
opened in 2017 and came into operation in 2018, raising the revenue from
leasing investment properties and rendering related services to VND 1,462
billion in Q4.2018 (+19% QoQ) and VND5,506 billion in the whole year of 2018
(+24% YoY).
In 66 shopping malls, there are 13 shopping malls in HCMC and 8 shopping
malls in Hanoi. The overall occupancy rate in 2018 rose to 89.9% compared to
87.6% in 2017 thanks to the restructuring of tenants and many shopping malls
have entered a stable period of operation. The detailed model of leasing
shopping malls of VRE on December 31, 2018 was demonstrated as follows:
Figure 7: Shopping mall leasing model on December 31, 2018
Brand Vincom Center Vincom Mega Mall Vincom Plaza Vincom+
No.of malls 6 3 45 12
Retail GFA, m2/TTTM 40,000-60,000 60,000-150,000+ 10,000-40,000 3,000-5,000
Total GFA,m2 246,003 395,148 744,593 62,553
Occupancy 94.50% 88.60% 91.50% 75.90%
Location
High-density locations in key citites of Hanoi and HCMC, CBD
Integrated, mixed use developed in key citites of HCMC and Hanoi
High-density non CBD locations & in other provinces
Medium density non-CBD locations & in other provinces
Positioning Above average and luxury
All Average Average and below
Competitor
Lotte Department, Takashimaya, Parkson
Aeon, SC Vivo, Crescent
Sense City, Lotte mart
BigC, Co-opmart
Source: VRE, KBSV
Figure 8: Retail GFA by mall type FY2018
Figure 9: Vincom Center at Landmark 81 – the highest
building in Vietnam
Source: VRE Source: Internet
52%
27%
17%
4%
Vincom Plaza Vincom Mega Mall
Vincom Center Vincom+

FULL REPORT VRE KBSV RESEARCH
6
Anchor tenants help to improve the
average rental price
Large shopping malls in the center
area have expensive rental prices
and nearly reach the maximum
occupancy rate
Among shopping malls surrounding
center area, Vincom Center
Landmark 81 has advantages of
scale and brand name, which
brings high rental prices
VRE records revenue from leasing by each leasing agreement. The prices of
retail shopping malls of VRE have two types: (1) Fixed rental price and (2) the
share of sales revenue of tenants. For non-anchor tenants, the term of a
leasing agreement usually lasts for 3 years, rental prices may be adjusted
annually or after 3 years. For anchor tenants, a leasing agreement is often
signed under the form of sharing the revenue from sales achieved by tenants
with a term of 5-10 years, depending on the scale of the agreement. The
second type of agreement has improved the average rental prices of shopping
malls, particularly in Vincom Dong Khoi and Vincom Ba Trieu. After anchor
tenants came up, the average rental price has climbed 10-15%.
According to the report by Jones Lang LaSalle (JLL), in Q1/2018, the rental
prices of a ground floor at Saigon Center in Takashimaya were USD147
/m2/month, including service prices, excluding VAT. Diamond Plaza is located
on a golden land area in HCMC, and has the highest rental price at USD125
/m2/month, including all charges except for VAT. According to the statistics of
JLL, by the end of March 2018, the total supply on the retail market recorded
960,000 m2 area of shopping malls, nearly 40,000 m2 area of Bazaar. Shopping
malls located on the golden land of HCMC all have occupancy rates over 90%.
According to CBRE Vietnam, in 2019, the average rental price of the ground
floor and first floor of stores with an area from 80 - 250 m2 in the central area
is kept at 128.6 USD/m2/month, the vacancy rate is about 3%. Non-central
area’s rental prices decreased by 3% compared to the previous year, to
USD36/m2/month. Thus, the central rental prices are 3.6 times higher than
those in the sub-center area.
Thanks to the advantages of scale and brand, average rental price for the first
and second floors of Vincom Center Landmark 81 (leasing area is 34,688 m2)
is USD60/m2/month, the highest in comparison with the prices in shopping
malls at the sub-center area. Stalls at these shopping malls are still getting
more crowded as vacancy rates are decreasing. The occupancy rate until the
end of Q1/2019 was recorded at about 90%, a majority of the remaining area
was not sold to serve anchor tenants.
Figure 10: Retail rental prices in HCMC
Source: CBRE, Q4.2018
0
20
40
60
80
100
120
140
0
200
400
600
800
1000
1200
1400
2016 2017 2018 2019F 2020F
Re
nta
l pri
ce (
USD
)
Re
nta
l are
a,'0
00
m2
Occupancy Vacancy Rental price - non CBD Rental price - CBD

FULL REPORT VRE KBSV RESEARCH
7
Fashion is the business type that
accounts for the highest proportion
at shopping malls
The main types of business of tenants in VRE's shopping malls include fashion,
supermarket, F&B and entertainment. In particular, fashion accounted for the
highest proportion at 22.5% with the presence of famous fashion brands such
as Zara, H&M, and Mango. Next is the supermarket with 20.5%, mainly
VinMart and VinPro marts. Normally, companies that belong to Vingroup
account for about 30% of the leased area in new shopping malls.
Figure 11: Tenant Mix by NLA as at December 2018
Source: VRE
2. Sales of inventory properties
Revenue from the sales of
inventory properties supports
investment capital for shopping
malls
Since 2015, in addition to leasing properties at shopping malls, VRE has
also developed shophouse, office tower, apartment and condotel, which
brings cash flow in the short term. In 2018, VRE handed over two major
projects, Vinpearl Condotel Riverfront Da Nang and Suoi Hoa (Bac Ninh).
Revenue sources in 2019 came mainly from shophouses in Dong Thap,
Vinh Long, Hoa Binh, Ca Mau and Mong Cai. The sales of inventory
properties in these real estate projects will be recorded as revenue when
completed and handed over to buyers. According to VRE, from 2019, the
main revenue will come from shophouses, these projects are able to
recover capital quickly, shorten the project cash flow and increase source
of money for VRE. The company also sets a target that 20-25% of revenue
will come from shophouse projects each year.
36%26% 26% 22%
12%
13% 13% 14%
17%
16%22%
14%
12%
19%
19% 40%
23%38%
20%9%
Vincom Mega Mall Vincom Center Vincom Plaza Vincom+
Others F&B Entertainment Supermarket Fashion

FULL REPORT VRE KBSV RESEARCH
8
III. BUSINESS PERFORMANCE & FINANCIAL STATUS
Impressive revenue growth over
the years
Revenue in 2018 surged, especially
in leasing of real estate properties
with a record high number of newly
opened shopping malls
Amid the thriving Vietnam's retail market and the increasing demand for
modern shopping, Vincom Retail has achieved impressive business results in
recent years thanks to the expansion of Vincom shopping malls. The average
revenue growth of VRE in 2016-2018 was about 20%, especially at 64% in
2018.
VRE started to promote new shopping malls from 2015, from 6 shopping malls
in 2014 to 21 shopping malls. In 2016, VRE opened 10 new shopping malls,
which increased the total number of shopping malls to 31, and the total GFA
rose 10.2% to over 1 million m2. By 2017, VRE opened 15 new shopping malls,
rental revenue increased by 17% YoY but total revenue decreased due to a fall
in the revenue from sale of inventory properties. In 2017, revenue came from
handing over shophouse, while 2016 revenue mainly came from handing over
apartments at Vinhomes Nguyen Chi Thanh.
In 2018, VRE's business results increased sharply to VND 9,124 billion in total
net revenue, up 64% compared to 2017 and exceeding the annual plan by
113%. In which, revenue from leasing of investment properties accounted for
60.8% of total revenue, reached VND 5,506 billion, up 24% compared to 2017.
In 2018, VRE launched 20 more shopping malls, reaching a record number of
newly opened shopping malls in a year. These malls can be found in 38 cities
and provinces all over the country with a GFA reaching about 1.5 million m2,
which helped VRE maintain the position of the largest retail real estate
developer in Vietnam.
Figure 12: NOI and NOI margin of leasing revenue over
the years
Figure 13: Leasing revenue and GFA over the years
Source: VRE Source: VRE
Revenue from the sale of inventory
properties change over the years
Revenue and GPM of the sale of inventory properties change over the years.
In 2015, revenue from this segment accounted for 55% total revenue,
equivalent to VND3,267 billion. This revenue mainly came from the leasing of
offices in Nguyen Chi Thanh Vincom Center and shophouses in Vincom Hai
Phong. In 2016, revenue from the sale of inventory properties added 40% to
the total revenue (-22% YoY). In 2017, revenue from this segment significantly
fell to VND951 billion (-63% YoY) as there is no large project recorded.
No. of malls 21 31 46 66
68.0%
68.1%
69.3%
69.5%
67.0%
67.5%
68.0%
68.5%
69.0%
69.5%
70.0%
0
500
1,000
1,500
2,000
2,500
3,000
3,500
4,000
4,500
2015 2016 2017 2018
NOI NOI margin(Bil VND)
2,407
3,8054,455
5,506
0
1,000
2,000
3,000
4,000
5,000
6,000
-
500
1,000
1,500
2,000
2015 2016 2017 2018
GFA (m2)
Revenue of Leasing of Investment Properties
('000 m2) (Bn VND)

FULL REPORT VRE KBSV RESEARCH
9
Revenue from the sale of inventory
properties in 2018 3.6 times higher
than that in 2017
GPM was over 30% over the years
Revenue from the sale of inventory properties reached VND 1,400 billion in
the Q4.2018, 5.5 times higher than that in the same period of 2017, and
reached VND3,433 billion in the whole year of 2018, 3.6 times higher than
that in 2017, and accounted for 38% total revenue in 2018. This revenue
mainly comes from handing over condotel apartments in Danang Vinpearl
Condotel Riverfront project, apartments at Suoi Hoa project, Bac Ninh and
some shop-house projects in Vinh Long and Long An.
GPM of VRE was over 30% over the years. VRE has hit a GPM of 40.23% in
2018. In particular, profit margins of investment property leasing and
inventory property sale hit 52.3% and 23.5% respectively. In 2017, revenue
from the sale of investment properties was mainly contributed by the sale of
shophouses in Royal City, Times City with high GPM, leading to higher gross
profit in 2017 compared to previous years. In 2018, GPM of this segment
stayed flat at 23%.
Figure 14: Revenue from sale of Inventory Properties and GPM over the
years
Source: VRE
SG&A/revenue ratio stayed flat
around 10%
NPAT of VRE achieved a growth of
nearly 20% in 2018
SG&A/revenue was 9% on average over the years. In 2018, SG&A took a
component of 8.3% in total revenue structure, lower than 10.3% in 2017.
Like revenue, NPAT of VRE also changed over the years, and reached its peak
of 209% growth in 2015. NPAT in 2018 was VND2,414.8 billion, gaining 19%
over 2017, competing 97% of the year’s plan.
Figure 15: Revenue and NPAT in 2015 - 2018 Figure 16: GPM and SG&A/revenue ratio in 2015 - 2018
Source: VRE Source: VRE
3,267
2,556
951
3,433
0%
10%
20%
30%
40%
50%
0
1,000
2,000
3,000
4,000
2015 2016 2017 2018
Revenue of Inventory Properties
Gross margin of Inventory Properties(Bil VND)
-500%
0%
500%
1000%
0
2,000
4,000
6,000
8,000
10,000
2015 2016 2017 2018
Net revenueNPATNet revenue growth rateNPAT growth rate
(Bn VND)
-
10.0
20.0
30.0
40.0
50.0
60.0
2015 2016 2017 2018
(%)Gross profit margin
SG&A/revenue
FULL REPORT VRE KBSV RESEARCH
10
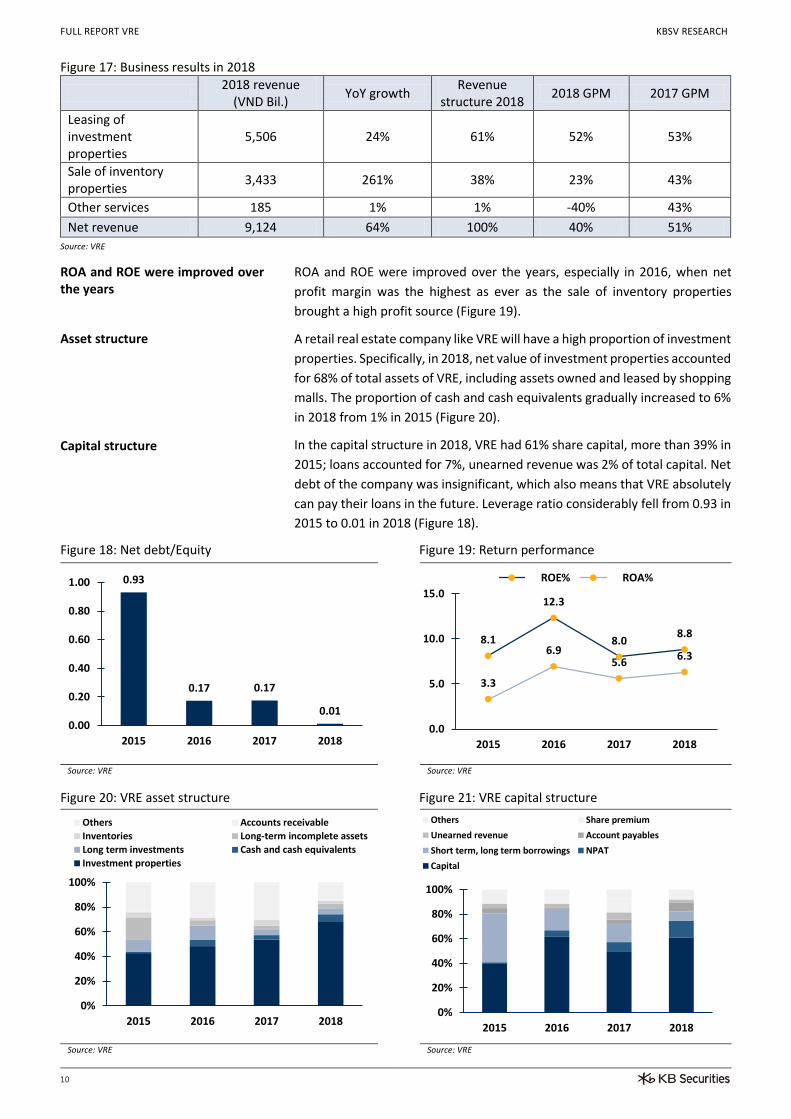
Figure 17: Business results in 2018
2018 revenue
(VND Bil.) YoY growth
Revenue structure 2018
2018 GPM 2017 GPM
Leasing of investment properties
5,506 24% 61% 52% 53%
Sale of inventory properties
3,433 261% 38% 23% 43%
Other services 185 1% 1% -40% 43%
Net revenue 9,124 64% 100% 40% 51%
Source: VRE
ROA and ROE were improved over the years
Asset structure
Capital structure
ROA and ROE were improved over the years, especially in 2016, when net
profit margin was the highest as ever as the sale of inventory properties
brought a high profit source (Figure 19).
A retail real estate company like VRE will have a high proportion of investment
properties. Specifically, in 2018, net value of investment properties accounted
for 68% of total assets of VRE, including assets owned and leased by shopping
malls. The proportion of cash and cash equivalents gradually increased to 6%
in 2018 from 1% in 2015 (Figure 20).
In the capital structure in 2018, VRE had 61% share capital, more than 39% in
2015; loans accounted for 7%, unearned revenue was 2% of total capital. Net
debt of the company was insignificant, which also means that VRE absolutely
can pay their loans in the future. Leverage ratio considerably fell from 0.93 in
2015 to 0.01 in 2018 (Figure 18).
Figure 18: Net debt/Equity Figure 19: Return performance
Source: VRE Source: VRE
Figure 20: VRE asset structure Figure 21: VRE capital structure
Source: VRE Source: VRE
8.1
12.3
8.08.8
3.3
6.95.6
6.3
0.0
5.0
10.0
15.0
2015 2016 2017 2018
ROE% ROA%0.93
0.17 0.17
0.010.00
0.20
0.40
0.60
0.80
1.00
2015 2016 2017 2018
0%
20%
40%
60%
80%
100%
2015 2016 2017 2018
Others Accounts receivable
Inventories Long-term incomplete assets
Long term investments Cash and cash equivalents
Investment properties
0%
20%
40%
60%
80%
100%
2015 2016 2017 2018
Others Share premium
Unearned revenue Account payables
Short term, long term borrowings NPAT
Capital

FULL REPORT VRE KBSV RESEARCH
11
III. INVESTMENT HIGHLIGHTS
The macroeconomic factors, population structure, people's income create a premise for retail activities to continue to thrive in Vietnam.
According to the Global Retail Development Index from US consulting firm
ATKearney, Vietnam ranks 14th out of 30 countries with growth prospects of
the most attractive retail industry in the world. With positive factors such as
a young population, an increase in the middle class and a boom in retail
spending, there is a lot of growth potential in the domestic retail real estate
sector. According to data from GSO, retail sales in 2018 reached about VND
3.3 million (equivalent to USD 142 billion), an increase of 12.4% compared to
2017 (Figure 22).
According to a study by Euromonitor, Vietnam is in the “golden population”
era, with of 25-44 aged people accounting for 32.8% of total population,
higher than other countries in the region such as Malaysia, Indonesia,
Thailand, Singapore, and the Philippines (Figure 23). In addition, the CAGR of
retail sales in 2017-2021E of Vietnam is also estimated at 10.9%, higher than
the above 5 countries (Figure 24). Above macro factors are strong supportive
driver for the retail industry to maintain growth.
Figure 22: Revenue and growth rate of retail industry in Vietnam
Source: GSO
Figure 23: % of population aged 25-44 in total population (2017)
Figure 24: CAGR of Retail 2017 - 2021E
Source: JLL Research, EIU, Euromonitor
Source: JLL Research, EIU, Euromonitor
32.8% 32.6%
30.7%
28.8% 28.8%
27.7%
25%
26%
27%
28%
29%
30%
31%
32%
33%
34% 10.9%9.7%
8.0%7.0%
3.7% 3.4%
0%
2%
4%
6%
8%
10%
12%
0%
10%
20%
30%
40%
50%
60%
70%
0
0.5
1
1.5
2
2.5
3
3.5
2008 2009 2010 2011 2012 2013 2014 2015 2016 2017 2018
Revenue (Trillion VND) Growth rate

FULL REPORT VRE KBSV RESEARCH
12
VRE benefits from the parent company Vingroup's ecosystem
Compared to other competitors, VRE benefits from the comprehensive
ecosystem of Vingroup's parent company. First, the support from Vingroup
about the right to access to 176 million m2 of land locating large projects. This
land area is right in the center of Hanoi and Ho Chi Minh City. In addition, with
strong financial potential, Vingroup has a background to continue to increase
landbank in the central areas.
In addition, Vingroup has a very strong advantage in retail premises and
management experience gained from operating Vincom shopping malls,
Vinmart, VinPro, and Vinmart+ convenient stores. The ecosystem of Vingroup
ranges in many fields from resort real estate, retail, education, healthcare,
food, vehicles, smartphones, which brings Vingroup a potential and large
customer base. Most of shopping malls of VRE are located in ideal areas
associated with Vinhomes where a large number of high-incomed residents
live. In these shopping malls, customers can experience all of the convenient
services in addition to shopping, entertainment, healthcare, spa, etc. which is
oriented towards “1 destinaton, all demands”. Besides, combined with the
online platform – Adayroi and frequent customer system VinID, VRE has
gained many advantages. Adayroi provides retailers and domestic
manufacturers a chance to expand their market, and a healthy environment
to develop effectively, stimulate the development of e-commerce and retail
sector in Vietnam. Frequent customer management system VinID also
accumulates points for customers who buy and use services at Vingroup
companies. As of the end of Q1/2019, VinID system has about 6.5 million
members.
In addition, Vingroup has a huge advantage in terms of space as well as
experience in not only Vincom shopping center, but also Vinmart, VinPro, and
Vinmart + convenience stores. Vingroup's ecosystem extends in all areas such
as resort real estate, retail, education, health, food, car, smart phones, helping
Vingroup own a huge and extremely potential customer group. power. Most
of VRE's shopping malls are located in prime locations associated with
Vinhomes urban population with high population and high income. There,
customers can experience almost full utilities besides shopping such as fun,
health, beauty ... oriented "one destination, all needs". In addition, with the
combination of online platform, namely Adayroi and the loyalty system VinID,
VRE gained many advantages. Adayroi provides an opportunity for retail
businesses and domestic manufacturers to expand their markets, to have a
healthy and efficient development environment, promoting the development
of the e-commerce and industry sectors. retail in Vietnam. Meanwhile, the
loyalty management system VinID accumulates points for customers who
purchase and use services at Vingroup's member companies. As of the end of
quarter 1/2019, VinID system has about 6.5 million members.
Figure 25: Vingroup ecosystem
Source: Vingroup, March 31, 2019
FULL REPORT VRE KBSV RESEARCH
13
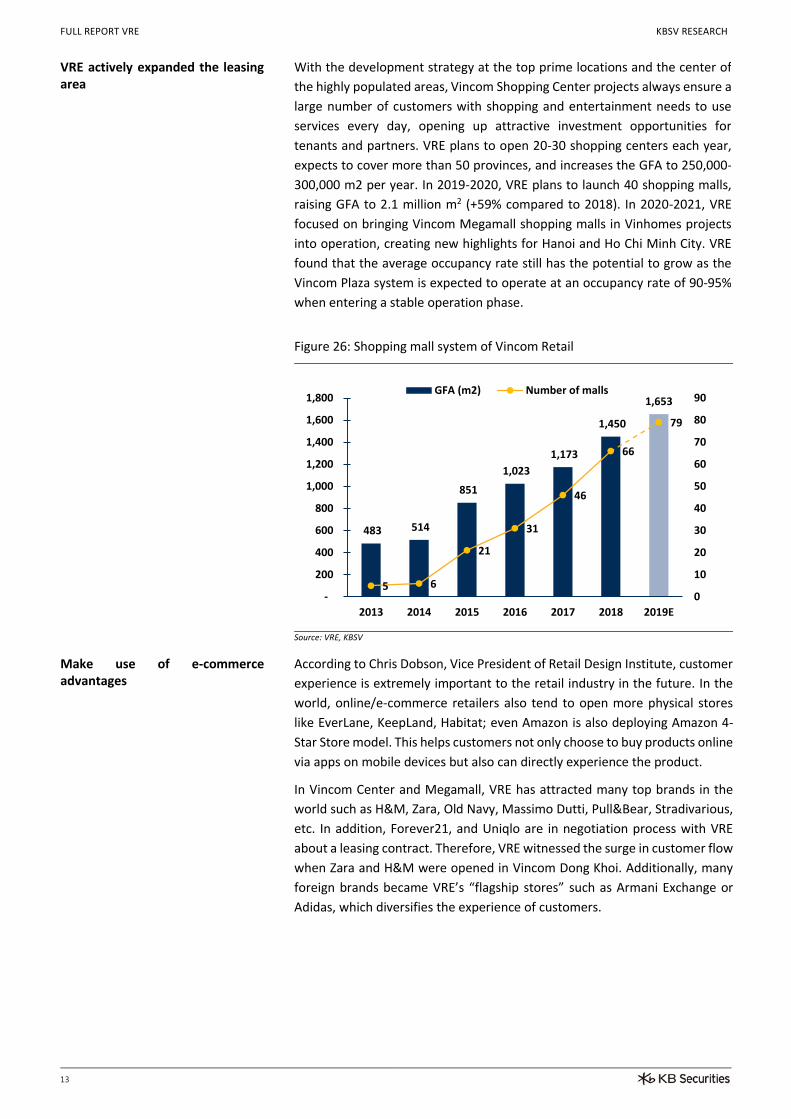
VRE actively expanded the leasing area
With the development strategy at the top prime locations and the center of
the highly populated areas, Vincom Shopping Center projects always ensure a
large number of customers with shopping and entertainment needs to use
services every day, opening up attractive investment opportunities for
tenants and partners. VRE plans to open 20-30 shopping centers each year,
expects to cover more than 50 provinces, and increases the GFA to 250,000-
300,000 m2 per year. In 2019-2020, VRE plans to launch 40 shopping malls,
raising GFA to 2.1 million m2 (+59% compared to 2018). In 2020-2021, VRE
focused on bringing Vincom Megamall shopping malls in Vinhomes projects
into operation, creating new highlights for Hanoi and Ho Chi Minh City. VRE
found that the average occupancy rate still has the potential to grow as the
Vincom Plaza system is expected to operate at an occupancy rate of 90-95%
when entering a stable operation phase.
Figure 26: Shopping mall system of Vincom Retail
Source: VRE, KBSV
Make use of e-commerce advantages
According to Chris Dobson, Vice President of Retail Design Institute, customer
experience is extremely important to the retail industry in the future. In the
world, online/e-commerce retailers also tend to open more physical stores
like EverLane, KeepLand, Habitat; even Amazon is also deploying Amazon 4-
Star Store model. This helps customers not only choose to buy products online
via apps on mobile devices but also can directly experience the product.
In Vincom Center and Megamall, VRE has attracted many top brands in the
world such as H&M, Zara, Old Navy, Massimo Dutti, Pull&Bear, Stradivarious,
etc. In addition, Forever21, and Uniqlo are in negotiation process with VRE
about a leasing contract. Therefore, VRE witnessed the surge in customer flow
when Zara and H&M were opened in Vincom Dong Khoi. Additionally, many
foreign brands became VRE’s “flagship stores” such as Armani Exchange or
Adidas, which diversifies the experience of customers.
483 514
851
1,023
1,173
1,450
1,653
5 6
21
31
46
66
79
0
10
20
30
40
50
60
70
80
90
-
200
400
600
800
1,000
1,200
1,400
1,600
1,800
2013 2014 2015 2016 2017 2018 2019E
GFA (m2) Number of malls

FULL REPORT VRE KBSV RESEARCH
14
IV. INVESTMENT RISKS
Influence from the business cycle
Increasing competition due to the
participation of foreign retailers
The expansion of VRE in cities and
provinces level 2 may come across
many difficulties due to the
business cycle and not-so-updated
consumption habits
Risks from the relevant side
S&P international credit rating agency forecast that the growth of big
economies will slow down as the global economy inched up 3.6% in 2019.
Many countries have tightened their monetary policies, the US-China trade
war showed no signs to cool down and large economies face political
challenges. Experts said that uncertainty stemming from policy changes in
major economies also adversely affects financial markets and economic
activities worldwide, causing stock markets to plunge. However, this will not
be a major concern for businesses because the central banks of countries tend
to adopt loosening monetary policies, signaling a better outlook for the world
economy.
The retail market in Vietnam continued to witness the expansion of existing
retailers and the increasing participation of many foreign foreigner retailers.
The emergence of some new competitors such as Lotte Mart, Aeon,
Takashimaya, and Big C have increased the competition on the market. Lotte
Mart Vietnam is a company that has 100% capital owned by Korea. It owns 13
active shopping malls, and plans to open 50 new supermarkets by 2020 in
Vietnam. Aeon has 4 shopping malls, and expects to open the 5rd one in Hanoi
in 2019 and the 6th in Hai Phong in 2020. Big C, after bought by Central Group,
has also been upgraded and improved in terms of service quality. In this way,
VRE should have suitable policies to attract customers such as choosing
suitable products and customer segments, applying discounts, which will
increase the expenses of the company.
Fast expansion of network and market share, and the management of a series
of shopping malls in cities and provinces level 2 may come across many
difficulties. To maintain the effectiveness of a nationwide business network is
not a small challenge to VRE as the economic cycle in Vietnam hides potential
risks and the consumption habits of consumers have not kept up with the
change. Therefore, the plan to expand the market in the near future may lead
to a not very successful result as in the first years of operation. However, VRE
always analyze and assess consumers’ habits very carefully before expanding
its system. Furthermore, different models are used flexibly to suit customer
habits in different local areas.
As analyzed above, VIC has a big influence on the development of VRE. At the
moment, Vingroup is one of the largest private business groups in Vietnam,
with a market capitalization of VND383 trillion (data on June 18, 2019). VIC
has a various ecosystem which needs an enormous resource to develop in may
areas such as Vinhomes, Vinfast, VinMec, Vinschool, etc. Therefore, risks to
VIC are also the risks that VRE may have to cope with.

FULL REPORT VRE KBSV RESEARCH
15
V. VALUATION
1. Forecast business performance
VRE expects to open 13 new
shopping malls in 2019, raising the
total number of shopping malls to
79
2019 is a prerequisite year for
Vincom Mega Mall projects in
Vinhome urban areas
VRE is reviewing the Vincom+
model to upgrade some Vincom+
marts to Vincom Plazas
The leasing of investment
properties saw a stable growth.
The revenue from the sale of
inventory properties mainly comes
from the sale of shophouses
VRE expects to have 13 shopping malls opened in 2019, reaching a total of 79
shopping malls located all over 42 out of 63 provinces and cities; put into
operation Landmark 81 Skyview Observatory, the highest building in Vietnam
in the 2Q of 2019; raise the total GFA to 1.6 million m2. Compared to previous
years, the plan for opening new shopping malls in 2019 is quite modest
because there is only a small number of shopping malls handed over in 2019,
and more shopping malls will be handed over in 2020. Therefore, the company
plans to open as many as 25 - 30 new shopping malls in 2020.
2019 is also a prerequisite year for Vincom Mega Mall highlight projects with
the scale of 60,000 - 100,000 m2 in Vinhome urban areas to be launched in
the period 2020-2021. The shopping mall model combined with the
commercial shophouse model in these new urban areas will create a
convenient shopping service complex to serve the residents of each project,
bringing a new experience of shopping space, culture and entertainment.
Vincom Retail is reviewing the Vincom+ model (some Vincom+ will be
upgraded to Vincom Plaza in the future), therefore, the number of newly
openned shopping malls may be reduced compared to the previously
announced plan. However, the total GFA of the retail system until 2021 will
likely complete the plan thanks to the increase in the area of shopping malls.
In 2019, revenue from leasing of investment properties is forecast to keep
increasing with a two-digit growth, while the revenue from sale of inventory
properties may cope with a decrease as there is no high-rise product handed
over in 2018. The revenue from the sale of inventory properties in 2019 is
expected to come from 550 shophouses nationwide such as some projects in
Ca Mau, Uong Bi, Mong Cai, Cam Pha and Cao Lanh and the rest of Bac Ninh
Vinhomes and Danang Condotel projects. We estimate the total revenue in
2019 will increase slightly by VND 9,580 billion (+5% YoY). Nevertheless,
thanks to the easing of investment properties – the segment that has higher
GPM than of sale of inventory properties, and maintains a stable growth, we
estimate that NPAT will gain 20% to VND2,898 billion.
Figure 27: Forecast business performances
V. ĐỊNH GIÁ
Source: VRE, KBSV
Bn VND 2015A 2016A 2017A 2018A 2019F
Net revenue 5,958 6,386 5,518 9,124 9,580
Cost of goods sold 3,951 3,743 2,717 5,483 4,828
Gross profit 2,007 2,642 2,801 3,641 4,752
Selling expenses 176 349 256 409 449
General & Admin expenses 227 327 314 342 385
NPAT 1,090 2,440 2,028 2,413 2,898
Attributable to Parent company 1,090 2,437 2,027 2,404 2,887
FULL REPORT VRE KBSV RESEARCH
16
2. Valuation
We provide a valuation for VRE based on discount cash flow (DCF) for each
business segment and P/E, P/B, EV/EBITDA.
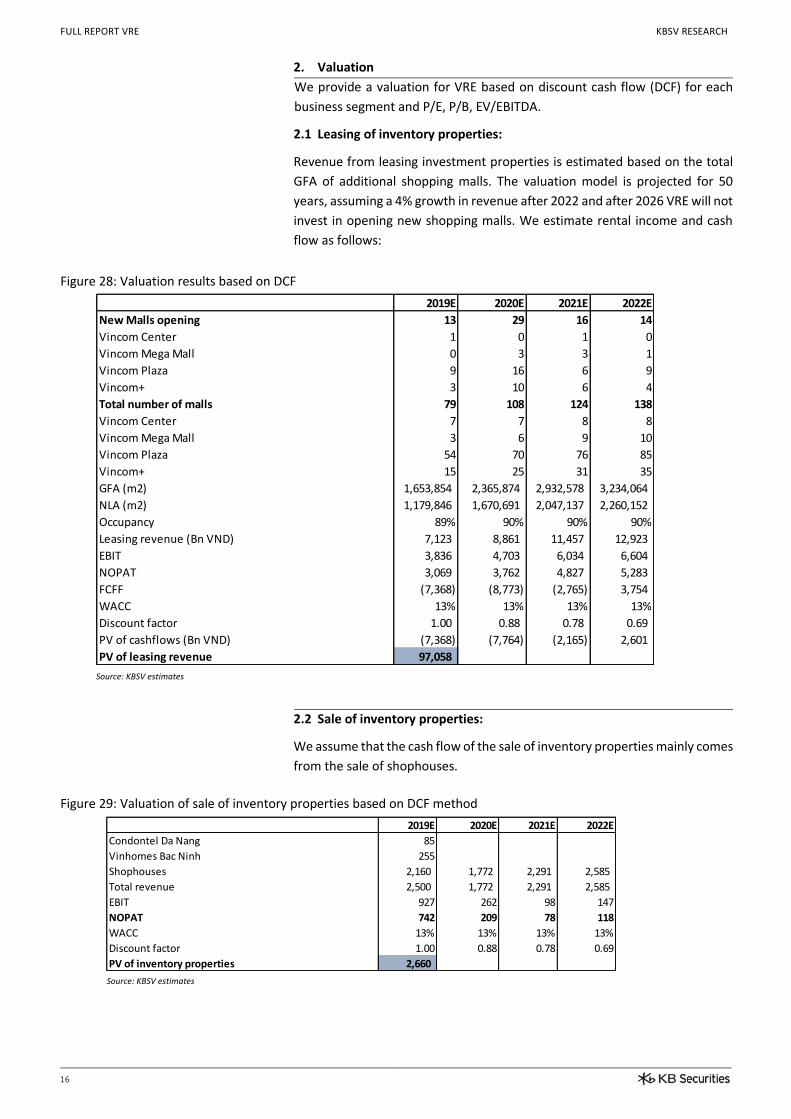
2.1 Leasing of inventory properties:
Revenue from leasing investment properties is estimated based on the total
GFA of additional shopping malls. The valuation model is projected for 50
years, assuming a 4% growth in revenue after 2022 and after 2026 VRE will not
invest in opening new shopping malls. We estimate rental income and cash
flow as follows:
Figure 28: Valuation results based on DCF
Source: KBSV estimates
2.2 Sale of inventory properties:
We assume that the cash flow of the sale of inventory properties mainly comes
from the sale of shophouses.
Figure 29: Valuation of sale of inventory properties based on DCF method
Source: KBSV estimates
2019E 2020E 2021E 2022E
New Malls opening 13 29 16 14
Vincom Center 1 0 1 0
Vincom Mega Mall 0 3 3 1
Vincom Plaza 9 16 6 9
Vincom+ 3 10 6 4
Total number of malls 79 108 124 138
Vincom Center 7 7 8 8
Vincom Mega Mall 3 6 9 10
Vincom Plaza 54 70 76 85
Vincom+ 15 25 31 35
GFA (m2) 1,653,854 2,365,874 2,932,578 3,234,064
NLA (m2) 1,179,846 1,670,691 2,047,137 2,260,152
Occupancy 89% 90% 90% 90%
Leasing revenue (Bn VND) 7,123 8,861 11,457 12,923
EBIT 3,836 4,703 6,034 6,604
NOPAT 3,069 3,762 4,827 5,283
FCFF (7,368) (8,773) (2,765) 3,754
WACC 13% 13% 13% 13%
Discount factor 1.00 0.88 0.78 0.69
PV of cashflows (Bn VND) (7,368) (7,764) (2,165) 2,601
PV of leasing revenue 97,058
2019E 2020E 2021E 2022E
Condontel Da Nang 85
Vinhomes Bac Ninh 255
Shophouses 2,160 1,772 2,291 2,585
Total revenue 2,500 1,772 2,291 2,585
EBIT 927 262 98 147
NOPAT 742 209 78 118
WACC 13% 13% 13% 13%
Discount factor 1.00 0.88 0.78 0.69
PV of inventory properties 2,660
FULL REPORT VRE KBSV RESEARCH
17
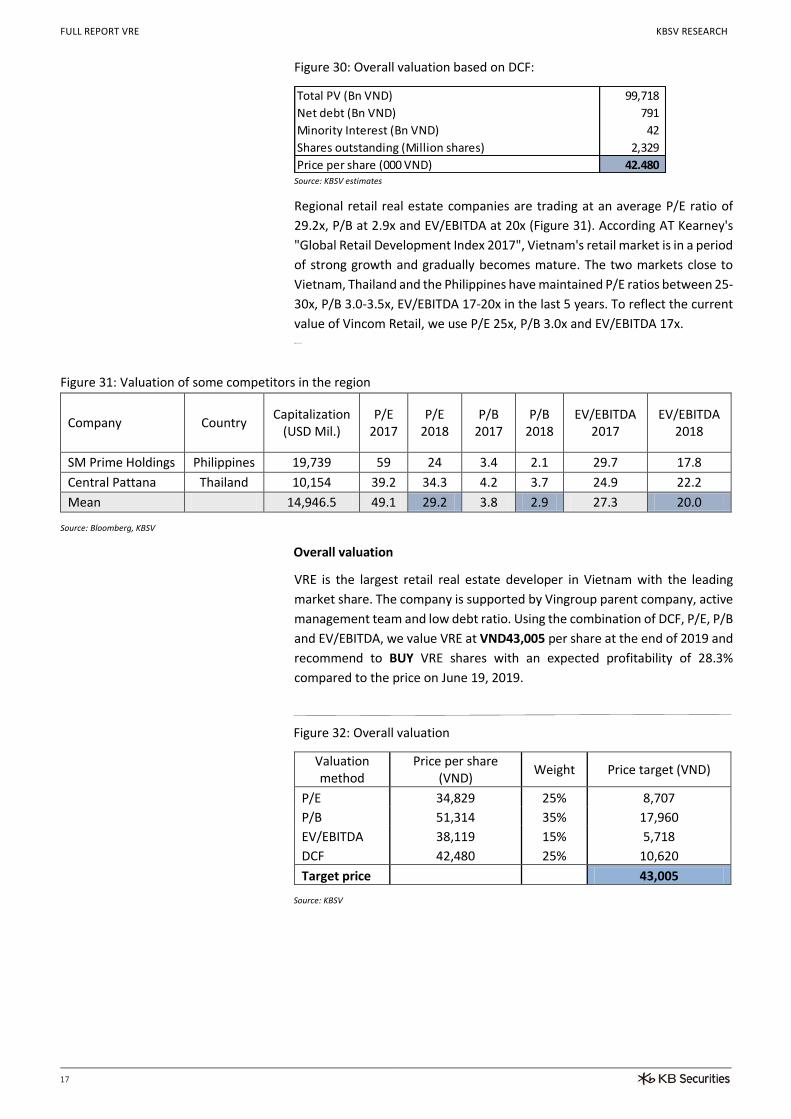
Figure 30: Overall valuation based on DCF:
Source: KBSV estimates
Regional retail real estate companies are trading at an average P/E ratio of
29.2x, P/B at 2.9x and EV/EBITDA at 20x (Figure 31). According AT Kearney's
"Global Retail Development Index 2017", Vietnam's retail market is in a period
of strong growth and gradually becomes mature. The two markets close to
Vietnam, Thailand and the Philippines have maintained P/E ratios between 25-
30x, P/B 3.0-3.5x, EV/EBITDA 17-20x in the last 5 years. To reflect the current
value of Vincom Retail, we use P/E 25x, P/B 3.0x and EV/EBITDA 17x. Regional retail
Figure 31: Valuation of some competitors in the region
Company Country
Capitalization (USD Mil.)
P/E 2017
P/E 2018
P/B 2017
P/B 2018
EV/EBITDA 2017
EV/EBITDA 2018
SM Prime Holdings Philippines 19,739 59 24 3.4 2.1 29.7 17.8
Central Pattana Thailand 10,154 39.2 34.3 4.2 3.7 24.9 22.2
Mean 14,946.5 49.1 29.2 3.8 2.9 27.3 20.0
Source: Bloomberg, KBSV
Overall valuation
VRE is the largest retail real estate developer in Vietnam with the leading
market share. The company is supported by Vingroup parent company, active
management team and low debt ratio. Using the combination of DCF, P/E, P/B
and EV/EBITDA, we value VRE at VND43,005 per share at the end of 2019 and
recommend to BUY VRE shares with an expected profitability of 28.3%
compared to the price on June 19, 2019.
Figure 32: Overall valuation
Valuation method
Price per share (VND)
Weight Price target (VND)
P/E 34,829 25% 8,707
P/B 51,314 35% 17,960
EV/EBITDA 38,119 15% 5,718
DCF 42,480 25% 10,620
Target price 43,005
Source: KBSV
Total PV (Bn VND) 99,718
Net debt (Bn VND) 791
Minority Interest (Bn VND) 42
Shares outstanding (Million shares) 2,329
Price per share (000 VND) 42.480

FULL REPORT VRE KBSV RESEARCH
18
APPENDIX
Source: VRE, KBSV
Income Statement Balance Sheet
(Billion VND) 2016 2017 2018 Q1/2019 (Billion VND) 2016 2017 2018 Q1/2019
Net sa les 6,385.89 5,518.24 9,123.95 2,284.07 CURRENT ASSETS 7,386.78 13,356.54 7,122.64 5,716.03
Cost of sa les -3,743.48 -2,717.09 -5,482.65 -1,312.02 Cash and cash equiva lents 1,697.77 1,421.53 2,431.38 1,112.61
Gross Profi t 2,642.41 2,801.15 3,641.30 972.05 Short-term investments 0.00 60.18 701.42 701.42
Financia l income 1,244.12 586.89 519.22 79.57 Accounts receivable 3,339.98 4,052.50 1,047.92 1,049.46
Financia l expenses -1,261.48 -1,165.56 -417.40 -72.71 Inventories 682.80 1,816.70 901.52 819.53
of which: interest expenses -1,252.38 -531.69 -375.27 -72.47 LONG-TERM ASSETS 26,912.37 24,776.70 31,561.04 32,905.28
Gain/(loss ) from joint ventures (from 2015) 783.71 539.87 0.00 0.00 Long-term trade receivables 2,621.21 7.59 10.11 6.19
Sel l ing expenses -349.18 -256.18 -408.67 -92.26 Fixed assets 399.24 170.58 307.84 299.94
Genera l and admin expenses -327.31 -313.54 -342.11 -115.69 Investment properties 16,578.70 20,401.21 26,429.42 26,521.20
Operating profi t/(loss ) 2,732.26 2,192.64 2,992.33 770.95 Long-term incomplete assets 1,469.55 1,080.11 1,343.48 1,625.22
Other incomes 47.32 33.74 78.05 9.30 TOTAL ASSETS 34,299.15 38,133.24 38,683.68 38,621.31
Other expenses -191.62 -57.63 -17.60 -2.41
Net other income/(expenses) -144.31 -23.89 60.45 6.89 LIABILITIES 9,615.76 12,039.18 10,174.40 9,509.04
Income from investments in other enti ties 0.00 0.00 0.00 0.00 Current l iabi l i ties 2,732.79 8,138.19 6,259.85 5,611.68
Net accounting profi t/(loss ) before tax 2,587.96 2,168.75 3,052.79 777.84 Trade accounts payable 453.46 1,065.33 3,423.55 2,784.57
Corporate income tax expenses -148.31 -141.08 -639.56 -166.66 Advances from customers 1,001.73 2,182.54 887.93 979.21
Net profi t/(loss ) after tax 2,439.65 2,027.68 2,413.23 611.18 Short-term unreal ized revenue 36.73 31.23 102.06 117.14
Minori ty interests 3.09 0.23 8.84 -0.92 Short-term borrowings 6.47 2,815.69 18.08 18.08
Attributable to parent company 2,436.56 2,027.45 2,404.39 612.10 Long-term l iabi l i ties 6,882.98 3,901.00 3,914.56 3,897.36
Long-term trade payables 0.00 0.00 0.00 0.00
Operating ratios Long-term advances from customers 0.00 0.00 0.00 0.00
2016 2017 2018 Q1/2019 Unreal ized revenue 92.19 56.37 215.36 190.26
Gross profi t margin 41.38% 50.76% 39.91% 39.23% Long-term borrowings 5,954.35 3,158.12 2,762.38 2,763.45
EBITDA margin 42.32% 57.40% 44.36% 43.81% OWNER'S EQUITY 24,683.39 26,094.05 28,509.28 29,112.27
EBIT margin 30.79% 40.44% 31.68% 30.97% Pa id-in capita l 21,091.72 19,010.79 23,288.18 23,288.18
Pre-tax profi t margin 40.53% 39.30% 33.46% 32.19% Share premium 1,788.49 4,324.38 46.98 46.98
Operating profi t margin 42.79% 39.73% 32.80% 31.52% Undis tributed earnings 1,831.05 2,786.54 5,190.93 5,794.84
Net profi t margin 38.20% 36.74% 26.45% 25.57% Minori ty interests 30.54 30.77 41.61 40.68
Cash Flow Main indicators
Indirect - Billion VND 2016 2017 2018 Q1/2019 2016 2017 2018 Q1/2019
Net profi t/(loss ) before tax 2,587.96 2,168.75 3,052.79 777.84 Valuations
Depreciation and amortisation 736.86 936.05 1,157.00 350.53 P/E 29.43 31.88 32.93 31.97
Profi t/loss from investing activi ties -2,028.98 -494.40 -517.86 -79.56 P/E di luted 29.43 31.88 32.93 31.97
Interest expense 1,252.38 531.69 375.27 72.47 P/B 2.91 2.48 2.78 2.72
Operating profi t/(loss ) before changes in Working Capita l 2,587.54 3,195.41 4,069.77 1,122.90 P/S 11.23 11.71 8.68 8.15
(Increase)/decrease in receivables 620.41 -80.30 257.41 86.13 P/Tangible Book 2.91 2.48 2.78 2.72
(Increase)/decrease in inventories 1,361.97 -1,030.01 1,087.89 82.56 P/Cash Flow -148.19 23.09 22.16 18.13
Increase/(decrease) in payables -1,892.29 1,676.29 -1,039.27 -58.05 EV/EBITDA 28.11 21.84 19.65 19.00
(Increase)/decrease in prepaid expenses -1,040.74 -234.56 -12.28 24.23 EV/EBIT 38.65 31.01 27.51 26.88
Net cash inflows/(outflows) from operating activi ties -483.93 2,799.41 3,573.73 916.25 Management Efficiency
Purchases of fixed assets and other long term assets -1,458.76 -7,223.88 -2,577.93 -2,254.79 ROE% 12.32 7.99 8.81 8.79
Proceeds from disposal of fixed assets 2.07 9.93 585.48 0.00 ROA% 6.94 5.60 6.26 6.62
Loans granted, purchases of debt instruments 0.00 -1,890.18 -685.95 0.00 ROIC% 6.42 6.96 9.24 -19.45
Col lection of loans , proceeds from sa les of debts instruments 159.00 1,574.69 2,659.27 0.00 Financia l s tructure
Investments in other enti ties -680.35 -4.21 -2.00 0.00 Cash Ratio 0.62 0.17 0.39 0.20
Proceeds from divestment in other enti ties 3,858.19 3,588.37 136.69 0.00 Quick Ratio 1.84 0.67 0.56 0.87
Dividends and interest received 682.91 1,856.02 520.57 19.76 Current Ratio 2.70 1.64 1.14 1.02
Net cash inflows/(outflows) from investing activi ties 2,563.05 -2,089.26 636.12 -2,235.03 LT Debt/Equity 0.24 0.12 0.10 0.09
Proceeds from issue of shares 5,133.05 0.00 0.00 0.00 LT Debt/Tota l Assets 0.17 0.08 0.07 0.07
Payments for share returns and repurchases 0.00 -0.25 0.00 0.00 Debt/Equity 0.24 0.23 0.10 0.10
Proceeds from borrowings 213.17 2,987.60 0.00 0.00 Debt/Tota l Assets 0.17 0.16 0.07 0.07
Repayment of borrowings -5,320.33 -2,712.19 -3,200.00 0.00 ST Liabi l i ties/Equity 0.11 0.31 0.22 0.19
Finance lease principa l payments 0.00 0.00 0.00 0.00 ST Liabi l i ties/Tota l Assets 0.08 0.21 0.16 0.15
Dividends pa id -803.70 -1,261.55 0.00 0.00 Tota l Liabi l i ties/Equity 0.39 0.46 0.36 0.33
Interests , dividends , profi ts received 0.00 0.00 0.00 0.00 Tota l Liabi l i ties/Tota l Assets 0.28 0.32 0.26 0.25
Net cash inflows/(outflows) from financing activi ties -777.81 -986.40 -3,200.00 0.00 Operating ratios
Net increase in cash and cash equiva lents 1,301.31 -276.24 1,009.85 -1,318.77 Account Receivable Turnover 8.90 7.90 18.02 21.60
Cash and cash equiva lents at the beginning o period 396.46 1,697.77 1,421.53 2,431.38 Inventory Turnover 3.46 2.15 3.99 4.34
Cash and cash equiva lents at the end of period 1,697.77 1,421.53 2,431.38 1,112.61 Account Payable Turnover 3.65 3.58 2.44 2.69
FULL REPORT VRE KBSV RESEARCH
19
Investment portfolio recommendations
Buy: +15% or more
Hold: between +15% and -15%
Sell: -15% or less
DISCLAIMER
This report has been prepared for informational purposes only, and does not constitute an offer or solicitation of a contract
for trading. Opinions in this report reflect professional judgment at this date based on information and data obtained from
sources KBSV considers reliable. However, KBSV does not guarantee that the information and data are accurate or complete,
and, therefore, this report is subject to change without prior notice. Individual investments should be made based on each
client’s own judgment and we expressly disclaim all liabilities for any investment decisions and any results thereof. This report
is a copyrighted material of KBSV and, thus, it may not be reproduced, distributed, or modified without the prior consent of
KB Securities. This report is not prepared for academic purposes and any third party wishing to quote from it for academic
publications should receive the prior consent of KBSV.
KB SECURITIES VIETNAM (KBSV)
Head Office:
Floor G, 2&7, Sky City Tower, 88 Lang Ha Street, Dong Da District, Hanoi, Vietnam. Tel: (+84) 24 7303 5333 - Fax: (+84) 24 3776 5928
Hanoi Branch
Floor 1, VP Tower, 5 Dien Bien Phu Street, Ba Dinh District, Hanoi, Vietnam
Tel: (+84) 24 3776 5929 - Fax: (+84) 24 3822 3131
Saigon Branch
Floor 1, Saigon Trade Center, 37 Ton Duc Thang Street, Ben Nghe Ward, District 1, HCMC, Vietnam
Tel: (+84) 28 7306 3338 - Fax: (+84) 28 3910 1611
Ho Chi Minh Branch
Floor 2, TNR Tower Nguyen Cong Tru, 180-192 Nguyen Cong Tru Street, District 1, HCMC, Vietnam
Tel: (+84) 28 7303 5333 - Fax: (+84) 28 3914 1969
CONTACT INFORMATION
Institutional Client Center: (+84) 28 7303 5333 - Ext: 2656
Private Customer Care Center: (+84) 24 7303 5333 - Ext: 2276
Hotmail: [email protected]
Website: www.kbsec.com.vn