January 2016 - Vingroup Release/2016... · Sources: Economist Intelligence Unit, CBRE reports,...
45
VINGROUP JOINT STOCK COMPANY Corporate Presentation January 2016
Transcript of January 2016 - Vingroup Release/2016... · Sources: Economist Intelligence Unit, CBRE reports,...

VINGROUP JOINT STOCK COMPANY
Corporate Presentation January 2016

CORPORATE PRESENTATION2
Contents
A. Vietnam Macroeconomic Updates 3 - 7
B. Introduction to Vingroup 8 - 13
C. Business Strategy 14 - 16
D. Key Investment Highlights 17 - 27
E. Financial Overview - VAS 28 - 34
F. Financial Overview - IFRS 35 - 41
G. Trading Performance 42 - 43

CORPORATE PRESENTATION3
A. Vietnam Macroeconomic Updates

CORPORATE PRESENTATION4
Improving Macroeconomic Conditions Supporting Growth
Sources: Economist Intelligence Unit, CBRE reports, General Statistics Office of Vietnam, State Bank of Vietnam, IMF, Bloomberg
Inflation and interest rates have eased considerably
6.2%
5.2% 5.4%6.0%
6.7%
2011 2012 2013 2014 2015
Real GDP growth remains strong
(US$ bn)
Disbursed FDI stays robust
11.0 10.5 11.5
12.4
14.5
2011 2012 2013 2014 2015
Driven by power & fuel price surges, devaluation of the currency in February and a
minimum wage hike in October
Exchange rate: VND remains resilient
20,649 20,859 21,017 21,189 22,495
2011 2012 2013 2014 2015
Currency has remained stable for
the past 5 years
(VND)
18.7%
9.1%6.6%
4.1% 0.6%
17.0%
13.5%
10.4%8.7% 8.4%
2011 2012 2013 2014 2015
Inflation Lending Interest Rate
Average devaluation: 2.1% p.a

CORPORATE PRESENTATION5
0
20
40
60
80
100
19
60
19
65
19
70
19
75
19
80
19
85
19
90
19
95
20
00
20
05
20
10
20
14
8.2%
4.1%4.9% 5.2%
6.1%
2010 2011 2012 2013 2014
Favorable Long-term Outlook for Consumption and Real Estate
Region’s lowest retail space(3)
Catching up with Regional Peers in Urbanization(2)
Rising income levels(4)
(GDP per capita, US$)Modern retail space in SEA cities (thousand sqm), 2014
Singapore–100%
Malaysia–74%
Philippines–49%
Vietnam–32%
(%)
Sources:
(1) General Statistics Office of Vietnam
(2) World Bank, Urbanization Data, 2014
(3) CBRE
(4) Economist Intelligence Unit
Private consumption growth(1)
India–32%
Indonesia–52%China–53%
Thailand–35%
0
2,000
4,000
6,000
8,000
Ba
ng
kok
Sin
ga
pore
Ma
nila
Ku
ala
Lu
mpu
r
Jakarta
Han
oi
Ho C
hi M
inh
City
Ph
no
m P
en
h
Ya
ng
oo
n
1,2771,507
1,7221,866
2,010 2,050 2,120 2,2502,430
2010A 2011A 2012A 2013A 2014A 2015E 2016E 2017E 2018E

CORPORATE PRESENTATION6
89.3100.4
111.6122.3
129.8143.3
160.1
2011 2012 2013 2014 2015E 2016E 2017E
5.05.6
6.57.3
8.09.0
10.3
2011 2012 2013 2014 2015E 2016E 2017E
8.59.6
10.511.4 11.9
13.014.3
2011 2012 2013 2014 2015E 2016E 2017E
8.910.0
11.312.6
13.615.1
17.1
2011 2012 2013 2014 2015E 2016E 2017E
Source: Economist Intelligence Unit as of 18 February 2016.
(1) Total Consumer Spending includes Consumer Expenditure on Housing, Tourism and Healthcare, amongst other sub-categories
(US$ bn) (US$ bn)
Consumer Expenditure on Housing Consumer Expenditure on Tourism
(US$ bn) (US$ bn)
Consumer Expenditure on Hospital Total Consumer Spending(1)
Integrated Platform Focused on the Vietnamese Urban Consumer
CORPORATE PRESENTATION7Source: CBRE
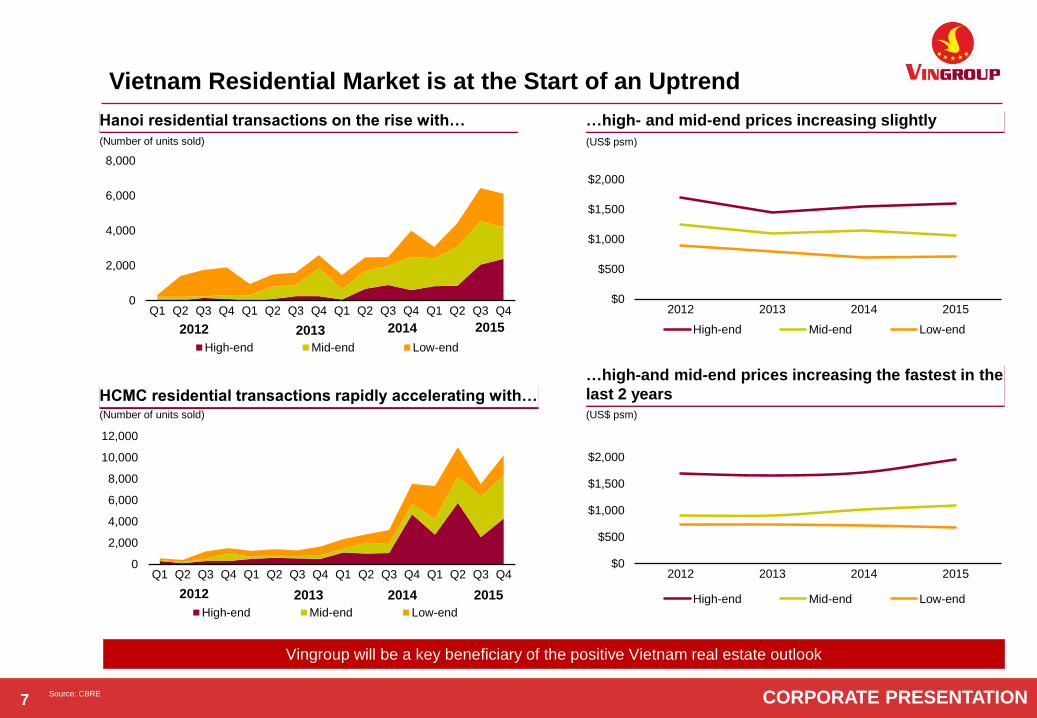
Vingroup will be a key beneficiary of the positive Vietnam real estate outlook
0
2,000
4,000
6,000
8,000
Q1 Q2 Q3 Q4 Q1 Q2 Q3 Q4 Q1 Q2 Q3 Q4 Q1 Q2 Q3 Q4
High-end Mid-end Low-end
20152012 2013 2014
0
2,000
4,000
6,000
8,000
10,000
12,000
Q1 Q2 Q3 Q4 Q1 Q2 Q3 Q4 Q1 Q2 Q3 Q4 Q1 Q2 Q3 Q4
High-end Mid-end Low-end
20152012 2013 2014
Vietnam Residential Market is at the Start of an Uptrend
(US$ psm)(Number of units sold)
Hanoi residential transactions on the rise with… …high- and mid-end prices increasing slightly
$0
$500
$1,000
$1,500
$2,000
2012 2013 2014 2015
High-end Mid-end Low-end
$0
$500
$1,000
$1,500
$2,000
2012 2013 2014 2015
High-end Mid-end Low-end
(Number of units sold) (US$ psm)
HCMC residential transactions rapidly accelerating with…
…high-and mid-end prices increasing the fastest in the
last 2 years

CORPORATE PRESENTATION8
B. Introduction to Vingroup

CORPORATE PRESENTATION9
Evolution of Vingroup
Note:
Financials for years 2008 – 2014 are presented based on IFRS and financials for earlier years and 2015 are presented based on VAS
Revenue (US$ mn) = Revenue (bn VND)/ Exchange rate VND/USD as of 31 December each year
9 34 1111
92 180109
305
863
1,293
1,499
0
1,000
2,000
3,000
4,000
5,000
6,000
7,000
8,000
Total Assets ($ mm)
Vinpearl Land Nha Trang
Listed on HOSE
(largest real estate co.)
$100 mm convertible bond
Vincom – Vinpearl merger
$300 mm convertible bond
Vinmec Times City International
Hospital (Hanoi) opened
$472 mm sale of Vincom Center A HCMC mall
$150 mm international credit facility
$200 mm international bond
$200 mm Warburg Pincus investment in Vincom Retail
Vincom Mega Mall Royal City & Vincom Mega Mall Times City
Vinschool Royal City, Times City opened
Vincom Center
Ba Trieu
Vinpearl Resort
Nha Trang
Vincom JSC
Vinpearl JSC
1993 2001 2002 2003 2004 2005 2006 2007 2008 2009 2010 2011 2012 2013 2014 2015
Revenues ($ mm)
$70 mm equity placement
Vinpearl Phu Quoc
Vincom Plaza Ha Long
Vinhomes Central Park construction
started
$100 mm Warburg Pincus
follow-on investment in
Vincom Retail
10 new Vincom shopping
malls:
- Vincom Center Nguyen Chi
Thanh (HN)
- Vincom Mega Mall Thao
Dien (HCMC)
- 8 Vincom Plazas in Thu Duc,
Da Nang, Can Tho, Dong
Nai, Quang Trung (HCMC),
Hai Phong, etc
3 new Vinpearl resorts:
- Nha Trang Bay Resort &
Villas
- Ha Long Bay Resort
- Phu Quoc Resort & Golf
2 new Vinmec Int’l hospitals
in:
- Central Park (HCMC)
- Phu Quoc
“Start-up spirit”
Technocom
Vincom Plaza Long Bien
3 new Vinpearl resorts:
- Vinpearl Luxury Nha Trang
- Vinpearl Golf Club – Nha Trang
- Vinpearl Da Nang Resort & Villas

CORPORATE PRESENTATION10
Largest Listed Real Estate Company with Diversified Consumer
Sector Exposure
Villas and Apartments (Vinhomes) Resorts (Vinpearl) and Amusement Parks (Vinpearlland)
Re
sid
en
tial Golf Courses, Gyms and Spas
Healthcare (Vinmec)
Agriculture (VinEco)Education (Vinschool)
Shopping Malls (Vincom Center, Vincom Mega Mall
and Vincom Plaza)
Supermarkets (VinMart), Electronic Retailing (VinPro), Specialities stores
(VinDS) and E-commerce (Adayroi)
Ho
sp
itality
Re
tail
,Co
mm
erc
e
Oth
ers
“To create a better life for the Vietnamese people”

CORPORATE PRESENTATION11
Significant Focus on Recurring Revenue Streams
45 58 84 97 109 45 56 75 99 125
19
186
7 16
60
147
90 121 174
276
567
Dec-11 Dec-12 Dec-13 Dec-14 Dec-15
Retail rental Hospitality & Entertainment Consumer retail Education, Heathcare & Others
…with profitability resilient through economic cycles(1)
(1) Source: Audited IFRS Consolidated Financial Statement for 2011, 2012, 2013, 2014 and
Unaudited VAS 2015
(2) Consolidation for 2010 and 2011 sourced from management accounts. Prepared for
comparability purposes
(US$ mm)
Recurring revenue streams continue to grow(1)…
(3) Includes negative gross profit from non-recurring revenue of (US$4.4mm) in 2012 and
(US$2.7mm) in 2013
(4) On 26 October 2015, Vingroup announced an acquisition of Maximark, a popular retail brand
with a large portfolio of malls and supermarkets concentrated in South Vietnam
Portfolio of commercial real estate continues to ramp up with…(4)
35 46 62 69 59
14 19
34 41
21
23
16 32
49 65
96
126 135
Dec-11 Dec-12 Dec-13 Dec-14 Dec-15
Retail rental Hospitality & Entertainment Consumer retail Education, Healthcare & Others(2)
(US$ mm)(% of total)
Strategic shift towards a greater percentage of revenues coming from recurring income streams such as retail, hospitality, healthcare, and schools enhances the resilience of the business model.
(2)
(3)
(3)
19%
22%
33%
26%
(% of total)
44%
16%
17%
24%
…17 Vincom shopping malls, 8 Vinpearl resorts & 2 Vinpearl Land
amusement parks…3 Vinmec hospitals and 5 Vinschools

CORPORATE PRESENTATION12
Strong Residential Sales: New Projects(1)
(1) As of 31 December 2015
(2) Pre-Sale launched
Prime location along the western bank of the Saigon River,
falling within the western border of the city center area, just
4km from the city’s business center in District 1
Total site area: 422,000 sqm
6,702 apartment units sold in 2015
82% of all residential units sold to date
Total contract value: US$1,367 mm, received US$1,011 mm
First delivery: Q4 2016
Vin
ho
mes
Cen
tral P
ark
Nov-14(2)
Mixed-use project in Tu Liem, Hanoi. Located in one of the
most prime locations of My Dinh - Hanoi's modern commercial
and administrative center, and well connected with
transportation infrastructure
Total site area: 176,300 sqm
Sales launched: Jan 2016
Total Units: Over 360 villas, shophouses & 2,000 apartments
First delivery: TBD
Vin
ho
mes G
ard
en
ia
Jan-162)
1,433 1,433
4,099
7,319
9,295
939 1,160
2,552
6,543 7,641
Dec-14 Mar-15 Jun-15 Sep-15 Dec-15
Cumulative units launched Cumulative units sold
Villas & Shophouses in Nha Trang, Phu Quoc, Ho Chi Minh
City, Ha Tinh & Hai Phong
1,082 units sold in 2015
60% of all units sold to date
Total contract value: US$986 mm, received US$709 mm
First delivery: Q3 2015 264
1,016
1,795
138
702
1,082
Dec-14 Mar-15 Jun-15 Sep-15 Dec-15
Cumulative units launched Cumulative units sold
Located just 4 km from Hanoi City center, adopting the eco-
friendly architectural design of the island country of
Singapore
Total site area: 140,643 sqm
3,925 units sold in 2015
78% of all residential units sold to date
Total contract value: US$587 mm, received US$492 mm
First delivery: Q4 2016
594
2,446
3,867
5,019
268
1,455
2,987
3,925
Dec-14 Mar-15 Jun-15 Sep-15 Dec-15
Cumulative units launched Cumulative units sold
Vin
ho
mes
Tim
es
Cit
y -
Park
Hill
Mar-15(2)
Villa
& S
ho
ph
ou
se
Pro
jects
Apr-15(2)
PRE-SALE LAUNCHED IN JANUARY 2016…
…TO BE UPDATED

CORPORATE PRESENTATION13
Overview of Land Acquisition and Sale Process
Understanding the development and presales process is a crucial part in appreciating Vingroup’s de-risked business model for residential projects
DeliveryPresalesLand Acquisition
1. Obtaining approval-in-principle
Acquire an “approval-in-principle”
from the local people’s committee
Indicates the approval of a
specific project
2. Investment Registration
Certificate
Can be obtained once “approval-
in-principle” received
After the investment certificate
obtained, a developer may
proceed to:
o Get approval on the land
clearance plan
o Commence the land
clearance process
o Start construction of the project
Delivery of property
upon completion
Buyer has to pay the remaining
~30% of contract value
upon delivery depending on
SPA
Revenue can be recognized by
the Group for sale of property
Property is delivered to buyer
and removed
from inventory
Obtain and deliver the land use
right certificate to buyers
First Stage of Presale –
Signing of SPA
When foundation work or
first floor area is complete
A deposit of c.5,000 USD is
required to be placed whilst
the SPA is being prepared
The first SPA payment is
about 25-30% of the
purchase price
Stage 1 – Sale & Purchase
Contract(1)
Stage 2 – Apportioned
Pre-sales Before
Completion
Second Stage -Installments
Subsequent installment
payments made – depending
on SPA terms
Installment payments of 5-
30% are made in varying
stages depending on SPA
(1) Vietnamese law requires the completion of either the foundation of a building or its 1st floor area before a sale and purchase agreement can be entered into. Sales prior to this completion
may some times be made in the form of a loan agreement, which gets converted into an SPA once conditions to signing SPAs are fulfilled.
CORPORATE PRESENTATION14
C. Business Strategy

CORPORATE PRESENTATION15
What Differentiates Vingroup?
VINGROUP’S DIFFERENTIATION
CREATES COMPETITIVE ADVANTAGES
Strong brand equity and
network of shopping malls,
resorts, amusement parks
and retail centers throughout
Vietnam that attracts
premium tenants, buyers &
clients
Premium pricing for new
projects focused on upper
and middle class Vietnamese
consumers
A pioneering established
corporation that leads the
development of real estate,
retail and services sectors.
Maintain large market share
especially with the upper and
mass affluent segments
Expands into new retail
business segments to lead
consumer trends in Vietnam
Expansion into
complementary businesses
to enhance the Group's
recurring revenue and
profitability
Leveraging nation-wide
network and brand equity to
achieve leadership position
in all business segments in
the near term
Realise synergies among
consumers of focused
segments
Higher percentage of
recurring revenues over time
driven by a growing
operational portfolio
Asset sales allow efficient
capital recycling into new
investments and generation
of RoE
Leading Privately Sponsored
Listed Company In Vietnam
with Premium Brand Names in
Commercial, Residential,
Hospitality, Education and
Retail with Demonstrated
Quality and Prestige
Fully Integrated Real Estate
Owner and Developer of
Large-Scale and Mixed-Used
Properties, with Exposure in
Key Consumer Segments
Established and Demonstrated
Track Record
Leverage Vingroup's Network,
Financial Capacity and
Resources to Develop an
Ecosystem of Complementary
Brands, Products and Services
CORPORATE PRESENTATION16
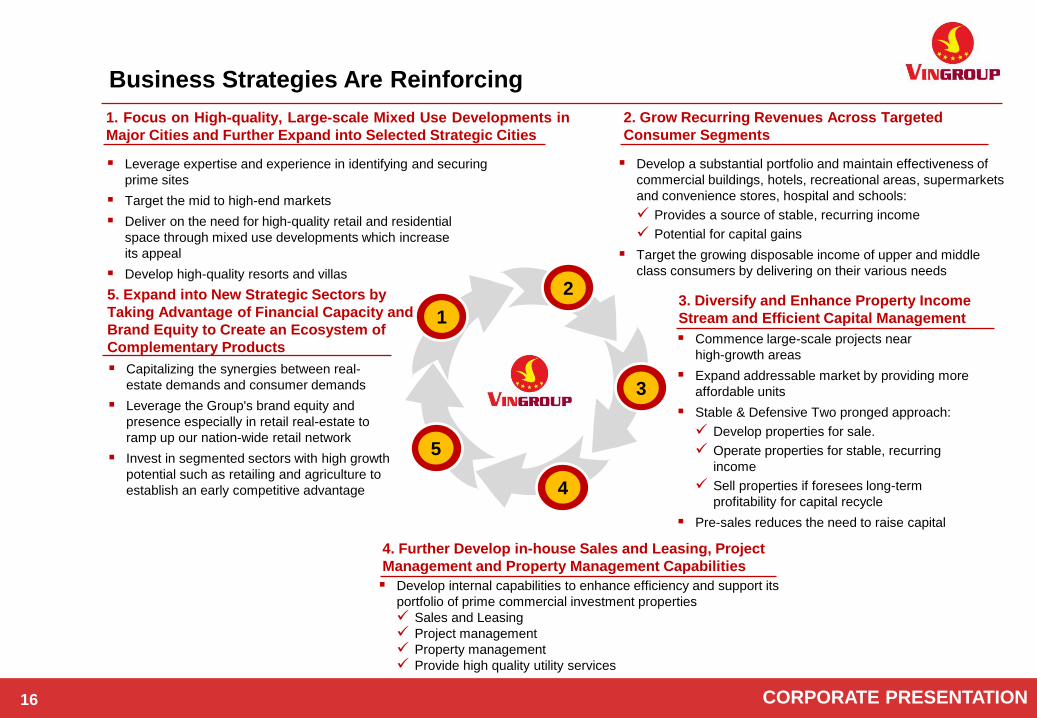
Business Strategies Are Reinforcing
Leverage expertise and experience in identifying and securing
prime sites
Target the mid to high-end markets
Deliver on the need for high-quality retail and residential
space through mixed use developments which increase
its appeal
Develop high-quality resorts and villas
Develop a substantial portfolio and maintain effectiveness of
commercial buildings, hotels, recreational areas, supermarkets
and convenience stores, hospital and schools:
Provides a source of stable, recurring income
Potential for capital gains
Target the growing disposable income of upper and middle
class consumers by delivering on their various needs
Develop internal capabilities to enhance efficiency and support its
portfolio of prime commercial investment properties
Sales and Leasing
Project management
Property management
Provide high quality utility services
Commence large-scale projects near
high-growth areas
Expand addressable market by providing more
affordable units
Stable & Defensive Two pronged approach:
Develop properties for sale.
Operate properties for stable, recurring
income
Sell properties if foresees long-term
profitability for capital recycle
Pre-sales reduces the need to raise capital
1. Focus on High-quality, Large-scale Mixed Use Developments in
Major Cities and Further Expand into Selected Strategic Cities
2. Grow Recurring Revenues Across Targeted
Consumer Segments
4. Further Develop in-house Sales and Leasing, Project
Management and Property Management Capabilities
3. Diversify and Enhance Property Income
Stream and Efficient Capital Management
5
2
3
4
1
5. Expand into New Strategic Sectors by
Taking Advantage of Financial Capacity and
Brand Equity to Create an Ecosystem of
Complementary Products
Capitalizing the synergies between real-
estate demands and consumer demands
Leverage the Group's brand equity and
presence especially in retail real-estate to
ramp up our nation-wide retail network
Invest in segmented sectors with high growth
potential such as retailing and agriculture to
establish an early competitive advantage

CORPORATE PRESENTATION17
D. Key Investment Highlights

CORPORATE PRESENTATION18
1 Vietnam’s Largest Listed Real Estate Developer
2Capital Efficient Real Estate Platform with Track Record of Successful Asset
Disposals
3 One of the Largest Landbank in Prime Locations Across Vietnam
7 Proven Track Record of Access to Capital Markets
8 Highly Experienced Management and Good Corporate Governance
6 Well-recognized Premium Brand Names in Vietnam
Investment Highlights
4 Ecosystem of Complementary Products and Services
5 Nation-wide Retail Network

CORPORATE PRESENTATION19
Largest Vietnamese Developer Offering ‘Pure-play’ Exposure
(1) Market data as of 31 January 2016
(2) As of 31 December 2015, Vingroup has 61 projects in Vietnam, of which, controlling interest in
60 projects, except Vinhomes La Seine
Vingroup (rated B+ by Fitch and B by S&P) is the largest listed real estate company in Vietnam by market capitalization with
controlling interest in over 40 developments, which are in prime urban and high growth areas in key cities throughout Vietnam
Proven ability to secure prime sites in the Central Business Districts
of Hanoi and Ho Chi Minh City
Quality properties that operate under the Vingroup brand names
Growing portfolio of investment properties: A critical contributor of
recurring revenues
Track record of successful project development, sales and
property management
Repeated successful launches of residential and commercial
projects
1
61 Projects(2) across VietnamThe Largest Listed Real-estate(1) Company in Vietnam
A Clear Leader in Vietnamese Real Estate
(US$ mm)
One of the largest-
listed companies in
Vietnam
High-quality
commercial,
residential,
hospitality and
mixed-used
properties
Mass market
residential builder
Furniture and
granite business
Diversifying into
agriculture, mining
& hydropower
Primarily
industrial parks
developer
Infrastructure
development
Telecom &
network
development
Developer of
industrial and
business parks
and high-end
hotels
Also invests in
energy, mining
and education
3,945
287 249 166
Vingroup #2 #3 #4
34 projects at prime central
locations in key cities27 projects at key
tourist destinations
Hanoi Vincom Center Ba Trieu Vincom Plaza Long Bien Vinmec Times City Int’l Hospital Royal City Times City (phase 1) Vinhomes Riverside
Vinhomes Times City – Park Hill
Vinhomes Nguyen Chi Thanh
Vinhomes Smart City
Vinhomes Riverside 2
Green City – Dan Phuong
Vinhomes Gardenia
Vincom Center Pham Ngoc Thach
Ho Chi Minh City Vincom Center Dong Khoi 307 – 309 Vo Van Ngan Vincom Plaza Thu Duc Vincom Mega Mall Thao Dien
Vinhomes Central Park
Vinhomes La Seine (Green City Sai
Gon)
North Vietnam (Excluding Hanoi)
Vincom Plaza Ha Long
Vincom Plaza Le Thanh Tong, Hai
Phong
Vincom Plaza Ly Bon, Thai Binh
Vincom Plaza Viet Tri, Phu Tho
Vincom Plaza Ly Thai To, Bac Ninh
Dream City, Hung Yen
Vinmec Medical University,
Hung Yen
South Vietnam (Excluding HCM city) Vincom Plaza Long Xuyen, An Giang Vincom Plaza Hung Vuong, Can Tho
Vincom Plaza Xuan Khanh, Can Tho
Vincom Plaza Rach Gia, Kien Giang
Central Vietnam Vincom Plaza Ngo Quyen, Da Nang Vincom Plaza Hung Vuong, Hue
Vincom Plaza Ha Huy Tap, Ha Tinh
Vincom Plaza Buon Ma Thuot South Vietnam (Excluding Nha Trang, Khanh Hoa) Vinpearl Phu Quoc Resort Vinpearl Land – Phu Quoc Vinpearl Golf Club – Phu Quoc Vinmec Phu Quoc Int’l Hospital Vinpearl Phu Quoc Resort & Golf
Vinpearl Cam Ranh, Khanh Hoa
Vinpearl Bai Dai, Cam Ranh
Vinpearl Da Lat
Vinpearl Quy Nhon, Binh Dinh
Central Vietnam Vinpearl Da Nang Resort & Villas
Lang Van, Da Nang
Da Nang 2, Da Nang
Vinpearl Resort Hoi An
Nha Trang, Khanh Hoa Vinpearl Nha Trang Resort Vinpearl Land Nha Trang Vinpearl Luxury Nha Trang Vinpearl Golf Club – Nha Trang Vinpearl Nha Trang Bay Resort & Villas
Vinpearl Golf Land Resort & Villas
Vinpearl Villas Hon Tre – Nha
Trang
Vinpearl Phu Quy
Vinpearl Hon Mot
Vinmec Nha Trang
North Vietnam
Vinpearl Ha Long Bay Resort
Vinmec Ha Long
Vinmec Hai Phong
Vu Yen Island, Hai Phong
Operating Project
Under construction and pipeline projects
CORPORATE PRESENTATION20
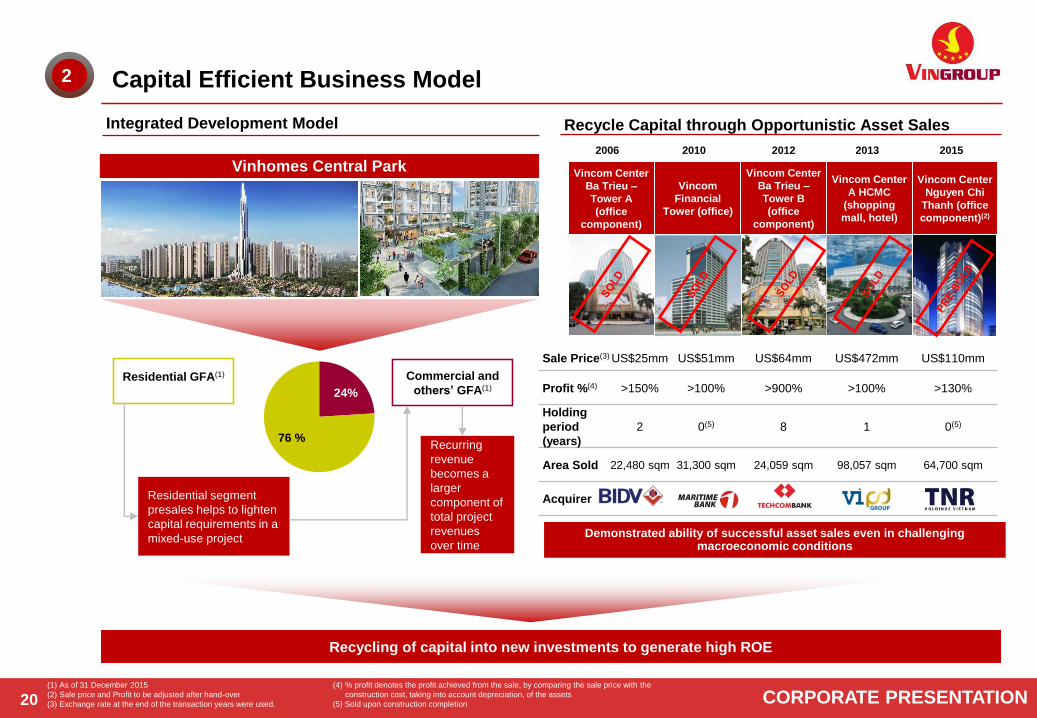
Capital Efficient Business Model
Demonstrated ability of successful asset sales even in challenging macroeconomic conditions
(1) As of 31 December 2015
(2) Sale price and Profit to be adjusted after hand-over
(3) Exchange rate at the end of the transaction years were used.
Recycling of capital into new investments to generate high ROE
2
Sale Price(3) US$25mm US$51mm US$64mm US$472mm US$110mm
Profit %(4) >150% >100% >900% >100% >130%
Holding
period
(years)
2 0(5) 8 1 0(5)
Area Sold 22,480 sqm 31,300 sqm 24,059 sqm 98,057 sqm 64,700 sqm
Acquirer
Integrated Development Model
Vinhomes Central Park
24%
76 %
Residential GFA(1)
Residential segment
presales helps to lighten
capital requirements in a
mixed-use project
Commercial and
others’ GFA(1)
Recurring
revenue
becomes a
larger
component of
total project
revenues
over time
Recycle Capital through Opportunistic Asset Sales
Vincom Center
Ba Trieu –
Tower A
(office
component)
Vincom
Financial
Tower (office)
Vincom Center
Ba Trieu –
Tower B
(office
component)
Vincom Center
A HCMC
(shopping
mall, hotel)
Vincom Center
Nguyen Chi
Thanh (office
component)(2)
2006 2010 2012 2013 2015
(4) % profit denotes the profit achieved from the sale, by comparing the sale price with the
construction cost, taking into account depreciation, of the assets
(5) Sold upon construction completion

CORPORATE PRESENTATION21
Beach Villas26%
High rise 23%
Commercial 7%
Hotel 5%
Hospital 9%
School 3%
Entertainment 1%
Villas, Shophouses
27%
(1) As of 31 December 2015, Landbank and GFA of under-development projects are subject to change
(2) GFA does not include (i) agricultural land, (ii)leased retail areas, or (iii) parking, public areas,
infrastructure and roads in projects
(mm sqm)
Vinhomes and Vincom Retail Projects Vinpearl Projects
(,mm sqm)
Total GFA: 27,846,807 sqm
One of the Largest Landbanks in Prime Locations Across Vietnam(1)
Landbank Breakdown by Construction Status GFA Breakdown(2)
Planned GFA Breakdown by Construction Status(1)(2)
13.2 mm sqm 76.8 mm sqm
17.5mm sqm 10.3 mm sqm 90 mm sqm of landbank is sufficient for at least 10 years of
development
Only look for land at prime locations in major cities
Proactive in infrastructure development to support accessibility of
own projects
Seek to acquire land adjacent to existing mixed-use projects to
benefit from economies of scale and increase the critical mass of
existing projects
2.2 0.9
10.1 4.9
18.8
53.2
Completed Underconstruction
Development Completed Underconstruction
Development
3.1 3.3
11.1
0.6
2.6
7.1
Completed Underconstruction
Development Completed Underconstruction
Development
3
Land Banking Strategy
CORPORATE PRESENTATION22
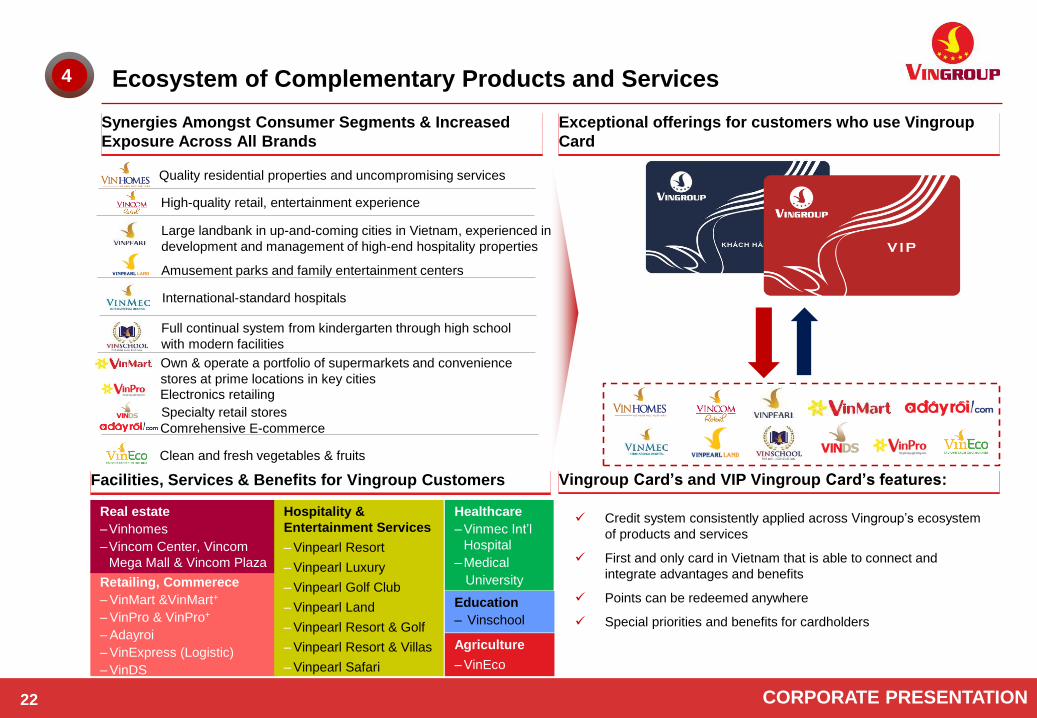
Ecosystem of Complementary Products and Services4
Synergies Amongst Consumer Segments & Increased
Exposure Across All Brands
Exceptional offerings for customers who use Vingroup
Card
Facilities, Services & Benefits for Vingroup Customers
Large landbank in up-and-coming cities in Vietnam, experienced in
development and management of high-end hospitality properties
Amusement parks and family entertainment centers
Retailing, Commerece
– VinMart &VinMart+
– VinPro & VinPro+
– Adayroi
– VinExpress (Logistic)
– VinDS
Healthcare
– Vinmec Int’l
Hospital
– Medical
University
Agriculture
– VinEco
Education
– Vinschool
Real estate
–Vinhomes
–Vincom Center, Vincom
Mega Mall & Vincom Plaza
High-quality retail, entertainment experience
International-standard hospitals
Full continual system from kindergarten through high school
with modern facilities
Quality residential properties and uncompromising services
Own & operate a portfolio of supermarkets and convenience
stores at prime locations in key cities
Electronics retailing
Comrehensive E-commerce
Clean and fresh vegetables & fruits
Specialty retail stores
Credit system consistently applied across Vingroup’s ecosystem
of products and services
First and only card in Vietnam that is able to connect and
integrate advantages and benefits
Points can be redeemed anywhere
Special priorities and benefits for cardholders
Vingroup Card’s and VIP Vingroup Card’s features:
Hospitality &
Entertainment Services
– Vinpearl Resort
– Vinpearl Luxury
– Vinpearl Golf Club
– Vinpearl Land
– Vinpearl Resort & Golf
– Vinpearl Resort & Villas
– Vinpearl Safari

CORPORATE PRESENTATION23(1) Excludes stores in Hanoi
(2) Excludes stores in Ho Chi Minh City
Proven execution capability and capital resources from Vingroup
Leveraging existing supplier relationships and attracting new quality
retailers
Expanding portfolio of shopping malls allows participating brands to
achieve rapid expansion
Relentless focus on quality products and customer service excellence
… Objectives:
Hundreds of retail stores throughout Vietnam in the near term
Seamless online-offline collaboration to deliver quality goods to
customers’ doorstep
5
Key Retail Brands
More Quality Choices for Vietnamese Consumers
Comprehensive E-commerce
Retail network at the end of December 2015
Nation-wide Retail Network
Robust investment in supermarkets, convenience stores, department stores at central locations throughout Vietnam.
Leveraging Vingroup’s financial capacity and relationships with suppliers to build brand equity.
Hanoi
12 VinMart181 VinMart+
4 VinPro5 VinPro+
North Vietnam(1)
6 VinMart3 VinPro
20 VinPro+
Central Vietnam
1 VinMart13 VinMart+
1 VinPro23 VinPro+
South Vietnam(2)
15 VinMart3 VinPro
22 VinPro+
Ho Chi Minh City
12 VinMart114 VinMart+
4 VinPro28 VinPro+
46 VinMart, 308 VinMart+, 15 VinPro, 98 VinPro+ storesVinPro & VinPro+VinMart
& VinMart+VinDS
Vinmart (>3,000 m2
supermarkets) and
Vinmart+ (100–300 m2
convenience stores)
Vinpro (electronics and
appliances)
VinDS (Specialty retail
stores specializing in
cosmetics, shoes,
sportswear, furniture &
household appliances)

CORPORATE PRESENTATION24
Well-recognized Premium Brand Names in Vietnam
(1) In February 2013, Vingroup transferred 100% interest in Vincom Center A Ho Chi Minh City to a real-estate investment company.
As of 31 May 2013, the cash proceeds have been received in full
6
Best Villa Development (Vietnam) for Vinhomes
Riverside
South East Asia Property Awards 2012
Successful in identifying and developing premium
hospitality projects
Hosted large national and international events e.g. Miss
Vietnam World 2008, Miss Universe 2010 and Miss Earth
2010, Miss Vietnam 2014
World-class full-serviced general hospital and clinics at
urban center in Hanoi and Ho Chi Minh city
International standard facility equipped with modern test,
diagnostic and operating facilities Best Retail Developer in Vietnam
Euromoney Real Estate Awards 2012
Euromoney Real Estate Awards 2014
Best Mixed – use Development (Asia) for Vinhomes
Riverside – 2013
Best Retail Development (Vietnam) for Vincom
Mega Mall Royal City - 2014
Asia Pacific Property Awards
Best Developer (Vietnam)
South East Asia Property Awards 2012
South East Asia Property Awards 2014
Educational philosophy behind Vinschool focuses on
the overall development of students from an early
stage in order to develop and shape the future
generations of Vietnam
Best Condominium Development (Vietnam) for
Royal City
South East Asia Property Awards 2013
Leveraging Vingroup’s retail network and experience,
VinEcom aims to focus on first class customer care, and to
create a best-in-class online retail experience in Vietnam
Secured 2 out of the 20 Golden Sites in Vietnam in 2010(1)
Vingroup develops its commercial, retail, residential and
mixed-use properties under the Vincom brand name
Demonstrated ability to sell residential and commercial real
estate even in difficult times in 2010 and 2011
Proven execution skills: Completion of large scale projects
under CBRE’s estimation of construction time
Rapidly expanding supermarket and convenience store
network at central locations in key cities in Vietnam
Wide range of electronics and household appliances
Clean and fresh vegetables and fruits to the mass market
International products and concepts, targeting local consumers
Top 100 ASEAN Companies 2014 by Standard
and Poor’s (S&P)
Region’s Best Borrower 2014 – Vietnam by
FinanceAsia
Vinhomes – the most valuable real estate brand in
Vietnam in 2015
Vincom Retail & Vinpearl – Top 50 most valuable
brands in Vietnam in 2015
Numerous Awards from Independent Media is a
Testimony of the Group’s Brand Name Strong Brands Across Segments

CORPORATE PRESENTATION25
Dong Nai
Retail
GFA(2):
25,785 sqm
Hanoi
Total Retail GFA(2):
481,327 sqm
Well-recognized Premium Brand Names in Vietnam (cont’)6
Vingroup’s brand names are instrumental in securing new sites, achieving premium pricing and attracting global
brand tenants
(1) Tenants for Vincom Center and Vincom Mega Mall in Ho Chi Minh City and Hanoi
(2) GFA as of 31 December 2015
Prime Retail Malls Strategically Located in Key Cities …with a High Quality and Diversified Tenant Base(1)
Ho Chi Minh City
Total Retail GFA(2):
130,622 sqm
Vincom
Mega Mall
Times City
Vincom
Center
Ba Trieu
Vincom
Plaza
Long Bien
Vincom
Mega Mall
Royal City
Ha Long
Retail
GFA(2):
30,777 sqm
Vincom Plaza
Ha Long
Can Tho
Retail
GFA(2):
16,000 sqm
Da Nang
Retail
GFA(2):
34,000 sqm
Hai Phong
Retail
GFA(2):
16,355 sqm
Vincom Plaza
Le Thanh
Tong
Vincom
Center Nguyen
Chi Thanh
Phu Tho
Retail
GFA(2):
22,500 sqm
Vincom Plaza
Viet Tri
Vincom Plaza
Hung Vuong
Vincom
Center
Dong Khoi
Vincom
Plaza
Thu Duc
Vincom
Plaza
Quang Trung
Vincom Plaza
Ngo Quyen
Vincom
Plaza
Bien Hoa
An Giang
Retail
GFA(2):
13,832 sqm
Vincom Plaza
Long Xuyen
Golden sites
Vincom
Mega Mall
Thao Dien

CORPORATE PRESENTATION26
Track Record in Accessing International Capital Markets7
(1) 290.3 mm of US$300 mm CBs were converted into shares by 18 February 2016
More than 1 billion USD raised internationally through 6 pioneering transactions since 2009
Holistic cooperation with local banks, including
facilitation of mortgage financings for customers and
transactional banking services at Vingroup
commercial properties
Good relationship with all leading domestic banks
with repeat loan and bond issuance
Cash & short-term investments sufficient to cover
any near term debt maturities independent of any
new capital raising
Strong cash balance maintained to service working
capital and interest payments
Demonstrated ability to create onshore liquidity
through capital recycling of non-core assets
Strong control over capital expenditures allow flexibility
around liquidity management
Best Capital Markets Deal 2012
Convertible Bonds
Apr & Jul 2012
USD300mm(2)
Best Vietnam Deal 2012
Best Vietnam Deal 2012
Secondary
Placement of
Ordinary Shares
April 2014
USD70mm
International
Syndicated Loan
October 2013
USD150mm
RegS/144A
International Senior
Unsecured Notes
October 2013
USD200mm
Best Vietnam Deal 2013
2013 Real-estate Deal of the Year
Vietnam Capital Markets Deal 2013
Best Vietnam Deal 2013
Best Vietnam Deal 2013
Issuer that matter
May 2013
USD200mm
June 2015
USD100mm
Private Equity
Investment by
February 2016
VND3,000 trln
Domestic Senior
Unsecured Notes,
guaranteed by

CORPORATE PRESENTATION27
Experienced Management Team, Good Corporate Governance and
Strong Sponsor8
Mr. Pham Nhat Vuong
Chairman of the Board of Management
Holds a Bachelors Degree in Geological Economic Engineering, graduated from Moscow Geology University in Russia
Long track record as an entrepreneur both in and out of Vietnam, founded Technocom Limited Company in Ukraine, which was sold to Nestle S.A. in 2010
Established Vinpearl in 2001 and Vincom in 2002
Major shareholder of Vingroup
In 2012, he was recognized as Vietnam’s first billionaire by Forbes Magazine, and continued to maintain this sole position in 2013 and 2014.
Ms. Pham Thuy Hang
Vice Chairwoman
Ms. Vu Tuyet Hang
Vice Chairwoman cum Deputy CEO
Mr. Marc Villiers Townsend(1)
Independent Member
Ms. Pham Thu Huong
Vice Chairwoman
Mr. Le Khac Hiep
Vice Chairman
Mr. Joseph Gagnon(2)
Independent Member
Ms. Nguyen Dieu Linh
Vice Chairwoman cum Deputy CEO
Ms. Mai Huong Noi
Member cum Deputy CEO
Prof. Ling Chung Yee Roy(3)
Independent Member
Board of Management
Ms. Mai Huong Noi
Board member and Deputy CEO
25 years experience
9 years with Vingroup
Mr. Dang Thanh Thuy
Deputy CEO of Vingroup JSC and
General Director of Vinpearl
20 years experience
11 years with Vinpearl
Ms. Tran Thi Khanh Van
Chief Accountant
24 years experience
8 years with Vinpearl
Ms. Nguyen Thi Huyen Tran
Deputy CEO of Vinpearl
18 years with Vingroup
Pro. Nguyen Thanh Liem
CEO Vinmec Times City Int’l
Hospital
39 years experience
2 years with Vinmec
Mr. Nguyen Manh Duc
Chief Accountant
15 years experience
3 years with Vinmec
Ms. Le Thuy Anh
CEO
16 years experience
3 years with Vinmec
Ms. Nguyen Dieu Linh
Vice Chairwoman & Deputy CEO
Over 20 years experience
10 years with Vingroup
Key Executives
Ms. Duong Thi Mai Hoa
CEO
Over 20 years experience
2 years with Vingroup
Ms. Nguyen Thi Diu
Deputy CEO
Over 20 years experience
Joined Vingroup in 2014
Ms. Vu Tuyet Hang
Vice Chairwoman & Deputy CEO
Over 20 years experience
10 years with Vingroup
Mr. Pham Van Khuong
Deputy CEO
Over 28 years experience
12 years with Vingroup
(1) Mr. Marc Villiers Townsend is the Managing Director of CBRE Vietnam
(2) Mr. Joseph Gagnon is a Managing Director of Warburg Pincus
(3) Pro. Ling Chung Yee Roy is the Managing Director of RL Capital Management

CORPORATE PRESENTATION28
E. Financial Overview - VAS
(1) Source: VAS Consolidated Financial Statement for 2015
Based on exchange rate of US$1 = VND 22,540 as of 31 December 2015

CORPORATE PRESENTATION29
(US$ mm)
Debt profile overview
Debt maturity
Average borrowing cost
Source: 2015 VAS Consolidated Financial Statement
As of 19 February 2016, US$290.3mm of CBs have been converted or submitted for
conversion to equity.
11.3% 10.8%9.9% 9.4%
Dec-12 Dec-13 Dec-14 Dec-15
Note: Based on exchange rate of US$1 = VND 22,540 as of 31 December 2015
As of 31 Dec 2015:
• Average debt maturity: 3.6 years
648
342
106
20
26
222
129
1113662
976
491
111
Less than 1 year 1-3 years 3-5 years More than 5 years
Corporate bonds Convertible bond Convertible loan Long-term borrowings Short-term debts

CORPORATE PRESENTATION30
Debt Mix Analysis
Total: VND36,959 Bn (US$1.64Bn)
Diversified Funding Sources(1)
Note:
Based on exchange rate of US$1 = VND 22,540 as of 31 December 2015 (applied to 2015 financials)
(1) Based on VAS Consolidated FS as of 31 December 2015
(2) Including Convertible loan & Loan from Associate
Debt Breakdown(1)
By Currency
By Interest Rate
Domestic bond, 48.6%
International bond, 11.8%
Convertible bond, 6.4%
Bank loans, 30.7%
Others(2), 2.5%
VND, 80.6%
USD, 19.4%
Floating, 78.7%
Fixed, 21.3%

CORPORATE PRESENTATION31
5187
138
177
63
Dec-11 Dec-12 Dec-13 Dec-14 Dec-15
84
184282
401
239
Dec-11 Dec-12 Dec-13 Dec-14 Dec-15
65252
6921,019 933
44
121
176
278 567
109
373
868
1,297
1,500
Dec-11 Dec-12 Dec-13 Dec-14 Dec-15
Sales of properties Recurring income
(US$ mm)
(1) Dec-13 includes fair value adjustment realized when the Group sold
Vincom Center A Ho Chi Minh City
(2) Includes profit after tax of discontinued operations
(US$ mm)
(US$ mm) (US$ mm)
Income Statement Highlights
Revenue
EBITDA(1)
Gross Profit
Profit for the Year(1)(2)
Source: Audited VAS Consolidated Financial Statements for 2011, 2012, 2013, 2014 and Unaudited VAS 2015
Note: CAGR from 2011 to 2015
Based on exchange rate of US$1 = VND 22,540 as of 31December 2015 (applied to 2015 financials)
266
548
Adjustment for sale of Vincom Center A HCMC Adjustment for sale of Vincom Center A HCMC
48
180
332
488 508
Dec-11 Dec-12 Dec-13 Dec-14 Dec-15
200
338

CORPORATE PRESENTATION32
45
62
102
136145
Dec-11 Dec-12 Dec-13 Dec-14 Dec-15
NA
56
75
99
125
Dec-11 Dec-12 Dec-13 Dec-14 Dec-15
65
252
692
1,019933
Dec-11 Dec-12 Dec-13 Dec-14 Dec-15
109
373
867
1,297
1,500
Dec-11 Dec-12 Dec-13 Dec-14 Dec-15
NA
7
14
3134
Dec-11 Dec-12 Dec-13 Dec-14 Dec-15
(US$ mm)
Total Revenue
(US$ mm) (US$ mm)
(US$ mm) (US$ mm)
Rental(1) Sale of Properties
Hospitality & Entertainment Services Healthcare
Revenue Performance
Source: Audited VAS Consolidated Financial Statements for 2011, 2012, 2013, 2014 and Unaudited VAS 2015
Note: CAGR from 2011 to 2015
Based on exchange rate of US$1 = VND 22,540 as of 31 December 2015 (applied to 2015 financials)
(1) Include rental from Group’s Subsidiaries

CORPORATE PRESENTATION33
29 41
58 66 71
65% 67%57%
49% 49%
Dec-11 Dec-12 Dec-13 Dec-14 Dec-15
Gross Margin
(4) (3)
8 9
(63%)
(21%)
25% 28%
Dec-11 Dec-12 Dec-13 Dec-14 Dec-15
Gross Margin
19 34 39
21
34%
46%
40%
17%
Dec-11 Dec-12 Dec-13 Dec-14 Dec-15
Gross Margin
19 126 248
377 373
29%
50%
36% 37%40%
Dec-11 Dec-12 Dec-13 Dec-14 Dec-15
Gross Margin
48
180
332
488508
Dec-11 Dec-12 Dec-13 Dec-14 Dec-15
(US$ mm)
Total Gross Profit
(US$ mm) (%) (US$ mm) (%)
Rental(1) Sale of Properties
Hospitality & Entertainment Services Healthcare
Profitability –Gross Profit and Margin
Source: Audited VAS Consolidated Financial Statements for 2011, 2012, 2013 ,2014 and Unaudited VAS 2015
Note: CAGR from 2011 to 2015
Based on exchange rate of US$1 = VND 22,540 as of 31 December 2015 (applied to 2015 financials)
(1) Include rental from Group’s Subsidiaries
(US$ mm) (%) (US$ mm) (%)

CORPORATE PRESENTATION34
36%
60%
44% 41%
31%
Dec-11 Dec-12 Dec-13 Dec-14 Dec-15
1,676
2,634
3,5754,205
6,480
389 513878
1,2761,662
Dec-11 Dec-12 Dec-13 Dec-14 Dec-15
Total Assets Total Equity
58 76
355 356 339197 183
260 291
541
255 259
616 647
880
Dec-11 Dec-12 Dec-13 Dec-14 Dec-15
Cash and cash eq. ST investments
473
1,030
1,292
1,5321,640
218
771676
885760
Dec-11 Dec-12 Dec-13 Dec-14 Dec-15
(US$ mm)
(In US$m)
(1) Total debt is equal to interest-bearing loans and borrowings, plus financial
liabilities designated as at fair value through profit or loss
(2) Net debt is equal to total debt less cash and cash equivalents and short-term
investments
(US$ mm)
Balance Sheet Highlights
Total Cash and Short-Term Investments
Total Assets & Total Equity
Total Debt(1) and Net Debt(2)
Source: Audited VAS Consolidated Financial Statements for 2011, 2012, 2013, 2014 and Unaudited VAS 2015
Note: Based on exchange rate of US$1 = VND 22,540 as of 30 December 2015 (applied to 2015 financials)
Net Debt(2) / Net Debt + Total Equity

CORPORATE PRESENTATION35
F. Financial Overview - IFRS(1)
(1) Source: IFRS Consolidated Financial Statement for H1/ 2015
Based on exchange rate of US$1 = VND 21,840 as of 30 June 2015

CORPORATE PRESENTATION36
86
487352
144
78
342
151
60
170
973
523
60
Less than 1 year 1-3 years 3-5 years More than 5 years
Corporate bonds Convertible bond Convertible loan Long-term borrowings Short-term debts Total
(US$ mm)
Debt profile overview
Debt maturity
Average borrowing cost
11.6%11.0%
10.0% 9.5%
Dec-12 Dec-13 Dec-14 Jun-15
As of 30 Jun 2015:
• Average debt maturity: 3.8 years
Source: IFRS Interim Consolidated Financial Statement H1 201
Based on exchange rate of US$1 = VND 21,840 as of 30 June 2015 (applied to 2015 financials)

CORPORATE PRESENTATION37
Debt Mix Analysis
Total: VND37,681 Bn (US$1.73Bn)
Diversified Funding Sources(1)
Notes:Based on exchange rate of US$1 = VND 21,840 as of 30 June 2015 (applied to 2015 financials)
(1) As of 30 June 2015
(2) Including Convertible loan & Loan from Associate
Debt Breakdown(1)
By Currency
By Interest Rate
Domestic bond, 42.6%
International bond, 11.1%
Convertible bond, 8.3%
Bank loans, 36.9%
Others(2), 1.1%
VND, 72.3%
USD, 27.7%
Floating, 79.4%
Fixed, 20.6%

CORPORATE PRESENTATION38
53
127
341
507
255207
Dec-11 Dec-12 Dec-13 Dec-14 Jun-14 Jun-15
136 148279
252
181
42
Dec-11 Dec-12 Dec-13 Dec-14 Jun-14 Jun-15
116
230342
473
263
159
Dec-11 Dec-12 Dec-13 Dec-14 Jun-14 Jun-15
64184
6881,017
52135445
121
175
276
124231
109
305
863
1,293
645 585
Dec-11 Dec-12 Dec-13 Dec-14 Jun-14 Jun-15
Sales of properties Recurring income
(US$ mm) (US$ mm)
(US$ mm) (US$ mm)
Income Statement Highlights
Revenue
EBITDA(1)
Gross Profit
Profit for the Year(1)(2)
265
607
8
287
Adjustment for sale of Vincom Center A HCMC Adjustment for sale of Vincom Center A HCMC
(1) EBITDA excludes valuation gains / losses of investment property and investment property under construction
(2) Dec-13 EBITDAs and Profits include fair-value adjustment realised when the Group sold Vincom Center A HCMC
(3) Includes profit after tax of discontinued operations
Source: IFRS Consolidated Financial Statements for 2011, 2012,
2013, H1 2014, 2014 and H1 2015
Note: Based on exchange rate of US$1 = VND 21,840 as of 30 June
2015 (applied to 2015 financials)

CORPORATE PRESENTATION39
NA
56
75
99
5060
Dec-11 Dec-12 Dec-13 Dec-14 Jun-14 Jun-15
4662
102
134
65 70
Dec-11 Dec-12 Dec-13 Dec-14 Jun-14 Jun-15
NA
7
13
31
15 15
Dec-11 Dec-12 Dec-13 Dec-14 Jun-14 Jun-15
64184
688
1,017
521
354
Dec-11 Dec-12 Dec-13 Dec-14 Jun-14 Jun-15
(US$ mm)
Total Revenue
(US$ mm) (US$ mm)
(US$ mm) (US$ mm)
Rental(1) Sale of Properties
Hospitality & Entertainment Services Healthcare
Revenue Performance
Source: IFRS Consolidated Financial Statements for 2011, 2012, 2013, H1 2014, 2014 and H1 2015
Note: Based on exchange rate of US$1 = VND 21,840 as of 30 June 2015 (applied to 2015 financials)
(1) Include rental from Group’s Subsidiaries
109
305
863
1,293
645
585
Dec-11 Dec-12 Dec-13 Dec-14 Jun-14 Jun-15

CORPORATE PRESENTATION40
(US$ mm)
Total Gross Profit
(US$ mm) (%) (US$ mm) (%)
Rental(1) Sale of Properties
Hospitality & Entertainment Services Healthcare
Profitability – Gross Profit and Margin
Source: IFRS Consolidated Financial Statements for 2011, 2012, 2013, H1 2014, 2014 and H1 2015
Note: Based on exchange rate of US$1 = VND 21,840 as of 30 June 2015 (applied to 2015 financials)
(1) Include rental from Group’s Subsidiaries
53
127
341
507
255
207
Dec-11 Dec-12 Dec-13 Dec-14 Jun-14 Jun-15
(US$ mm) (%) (US$ mm) (%)
(4) (3)
84 3
(63%)
(21%)
26%29%
24%
Dec-11 Dec-12 Dec-13 Dec-14 Jun-14 Jun-15
Gross Margin

CORPORATE PRESENTATION41
25%
49%
37% 37% 36%
Dec-11 Dec-12 Dec-13 Dec-14 Jun-15
2,435
3,299
4,0244,612
5,515
783 7651,095
1,521 1,658
Dec-11 Dec-12 Dec-13 Dec-14 Jun-15
Total Assets Total Equity
58 76
354 356 404155 180
258 284
419
213256
612 640
823
Dec-11 Dec-12 Dec-13 Dec-14 Jun-15
Cash and cash eq. ST investments
468
997
1,259
1,550
1,769
256
741647
909 947
Dec-11 Dec-12 Dec-13 Dec-14 Jun-15
(US$ mm)
(In US$m)
(US$ mm)
Balance Sheet Highlights
Total Cash and Short-Term Investments
Total Assets & Total Equity
Total Debt(1) and Net Debt(2)
Net Debt(2) / Net Debt + Total Equity
Source: IFRS Consolidated Financial Statements for 2011, 2012, 2013, H1 2014, 2014 and H1 2015
Note: Based on exchange rate of US$1 = VND 21,840 as of 30 June 2015 (applied to 2015 financials)
(1) Total debt is equal to interest-bearing loans and borrowings, plus financial liabilities designated as at fair value through profit or loss.
(2) Net debt is equal to total debt less cash and cash equivalents and short-term investments

CORPORATE PRESENTATION42
G. Trading Performance

CORPORATE PRESENTATION43
Price VND47,600 as of 31 Jan 2016 10 Day 20 Day 30 Day 1 mth 3 mth 6 mth 12 mth 24 mth 36 mth 48 mth 60 mth
Average daily volume ('000) 2,211 2,202 1,999 2,202 1,359 1,253 1,162 1,267 1,139 943 857
Average daily trading value (VND mm) 105,249 104,669 92,975 104,669 61,995 55,291 49,285 51,833 44,853 36,439 32,652
Average daily trading value (US$'000) 4,669 4,644 4,125 4,644 2,750 2,453 2,187 2,300 1,990 1,617 1,449
Total volume traded (mm) 22.1 44.0 60.0 44.0 87.0 160.4 288.1 629.5 846.3 942.3 1,066.0
% of total shares outstanding 1.2% 2.4% 3.2% 2.4% 4.7% 8.6% 15.4% 33.7% 45.3% 50.4% 57.1%
% of free float 2.6% 5.1% 7.0% 5.1% 10.1% 18.6% 33.5% 73.2% 98.4% 109.6% 123.9%
Share price
Highest traded price (VND) 49,100 49,100 49,100 49,100 49,100 49,100 49,100 49,100 49,100 49,100 49,100
Lowest traded price (VND) 45,000 45,000 40,000 45,000 40,000 37,900 35,930 32,342 31,807 27,637 25,156
Performance over the period 0.2% 0.2% 19.0% 4.2% 4.6% 10.4% 24.8% 16.4% 32.9% 33.1% 59.2%
Index outperformance over the period (1) (3.4%) 5.3% 23.0% 10.0% 14.8% 22.6% 30.1% 18.4% 20.1% (6.4%) 52.4%
Average closing price (VND) 47,820 47,820 46,210 47,820 44,658 43,484 41,657 40,106 38,482 36,853 36,414
Volume weighted average price (VND) 47,599 47,530 46,510 47,530 45,602 44,124 42,420 40,925 39,379 38,632 38,103
Market cap as of 31 Jan 2016 (US$ mm) 3,945.2
Total number of shares (mm) 1,868.2
Share Price Performance over the Last 12 Months
Source: Bloomberg as of 31 January 2016.
(1) Performance against the VN Index.
32,000
37,000
42,000
47,000
52,000
0.0
1.0
2.0
3.0
4.0
5.0
6.0
7.0
8.0
Jan-16Dec-15Nov-15Sep-15Aug-15Jun-15May-15Mar-15Feb-15
Sh
are
Pri
ce (
VN
D)
Vo
lum
e (m
)
Vingroup Share Volume Vingroup Share Price VN Index rebased

CORPORATE PRESENTATION44
This presentation may contain forward-looking statements that involve risks and uncertainties. Actual future performance,
outcomes, and results may differ materially from those expressed in forward-looking statements as a result of a number of
risks, uncertainties and assumptions. Representative examples of these factors include (without limitation) general industry
and economic conditions, interest rate trends, cost of capital and capital availability, cost of construction, availability of real
estate properties and land, competition from other companies and venues for the sale/distribution of goods and services, shifts
in customer demands, customers and partners, changes in operation expenses, including employee wages, benefits and
training, governmental and public policy changes and the continued availability of financing in the amounts and the terms
necessary to support future business. You are cautioned not to place undue reliance on these forward-looking statements,
which are based on current view of management on future events.
Disclaimer

CORPORATE PRESENTATION45
Vingroup JSC
Vingroup Office Tower, Vinhomes Riverside Eco-Urban Area
Long Bien District, Hanoi, Vietnam
Tel: +84 (4) 3974 9999 ext. 759
Fax: +84 (4) 3974 8888
Website: http://www.vingroup.net
E-mail: [email protected]
Investor Relations Department