From The Debt Desk - JM Financial The Debt Desk Key data and events ... The target for Fiscal...
20
Transcript of From The Debt Desk - JM Financial The Debt Desk Key data and events ... The target for Fiscal...

2
Details as on February 28, 2013
From The Debt DeskKey data and events – February, 2013.
WPI Inflation: The provisional inflation for the month of January, 2013 was 6.62% as against 7.18% in December, 2012.
IIP: The provisional Index of Industrial Production (IIP) for the month of Dec, 2012 was at (0.6%) as against revised IIP of (0.8%) in the month of Nov, 2012.
Forex reserves: The Forex Reserves as on Feb, 2013 was at USD 291.92 billion as against USD 295.75 billion as on Jan, 2013.
Domestic Liquidity: Liquidity remained tight as RBI received average daily bids of around INR 1,14,000 crores during the month in the daily LAF repo auction.
Fixed Income and Currency data:
Indian 10 year government bond: Government bond yield ended flat as compared to last month at around 7.90%. Government announced a fiscal deficit of 4.8% of GDP for FY’14 and gross borrowing of INR 6,29,000 crores for FY’14.
Indian 5 year corporate Bond yield ended lower on back of fall in government bond yields. 5-year AAA bond yield ended higher at 8.90% as compared to 8.80% in the last month on account of supply.
3 Month Certificate of Deposit ended higher at 9.25% as compared to 8.75% in view of tight liquidity and impending supply pressures.
12 Month Certificate of Deposit ended higher at 9.25% as compared to 9.05% in view of tight liquidity and impending supply pressures.
USD/INR: The local currency depreciated sharply by about 3% to end the month at 54.66 as against the US dollar. INR depreciated sharply after the announcement of the union budget.
Global data:
10 year US bond yield ended lower at 1.87% as compared to 2.01% in the previous month, on assurance by the Federal Reserve to continue Quantitative easing.
Brent Crude ended lower at $110 per barrel as against $116 in the previous month due to risk off environment.
Source: RBI WSS & Bloomberg
Monthly Market Update by JM Financial Mutual Fund
Market Update - Equity
Market Update - Derivatives
ECoNoMy
Dec IIP disappointed the market at -0.6%. The primary factor contributing to this contraction was a 4% decline in mining. Capital goods and consumer goods contracted. 9M FY’13 industrial growth stood at 0.7%. The 3Q FY’13 GDP growth was much weaker than expected at 4.5%. WPI Jan at 6.6% surprised positively, coming in lower than expectations which were above 7%. The much-awaited Union Budget drew a mixed reaction. While the buget seemed grounded in reality, investors expectations on jump starting reforms and the investment demand were not met in any significant way. The government managed to restrain the fiscal deficit number for FY’13 at an impressive 5.2%. The target for Fiscal deficit at 4.8% for FY’14 is in line with bringing a discipline to government spending in the current global economic scenario. The FY’14 divestment target has been set at Rs. 558bn of which Rs. 140bn is expected to be raised from stake sales in non-government companies (Specified Undertaking of the Unit Trust of India (SUUTI) stakes, Hindustan Zinc and Bharat Aluminum Company (BALCO)).
SToCK MaRKET
Indian equities had a weak month and Nifty underperformed most global indices in Feb. Nifty fell down by 5.7% and Sensex by 5.2% during the month as compared to 3% fall of Hang Seng. While capital markets had a muted start in Jan, there were 10 deals totaling $3.7bn in Feb. FII inflows continued to be strong for most part of the month barring the Budget day sell-off – net buyers to the tune of $4.1bn. This took the YTD buying to $8.2bn. DIIs remained firmly footed on the other side of the trade, net sellers of $1.6bn during Feb taking the YTD tally to $4.9bn. Among the DIIs, Insurance companies again emerged as the biggest sellers ($1.4bn) while the Mutual Funds were net sellers of around $244mn.
The February expiry level of the Nifty index was around 5.7% lower than that of the January level. On the last day of February series, market-wide rollovers stood at ~66% which was lower than the 75% rollovers seen on the last day of the January series. The March series started with market wide future open interest of Rs. 361 bn as against Rs. 422 bn seen at the start of the February expiry. Nifty rollover on the last day stood at ~54% as against ~64% seen in the last expiry. Rollover in stock futures was at 73% as against the three month average of 80%. Lack of long roll participation kept the roll levels under pressure. The energy sector saw higher rollover activity (86%) in this expiry as compared to their three-month average whereas rolls in cement (69%) names lagged the average. Volatility in the markets is expected to help in churning the arbitrage portfolio and generate good returns.Source: Bloomberg and JM aMC Research

3
Details as on February 28, 2013
ASSET AllocATion by SEcTor
JM Equity Fund(An Open-Ended Growth Scheme)
SnAPSHoTinvESTMEnT objEcTivE : To provide optimum capital growth and
appreciation.FUnD MAnAgEr : Sanjay chhabaria
(Managing this fund since December, 2007 & more than 12 yrs of experience in fund management & equity research)
incEPTion@ : 1st April, 1995nAv DETAilS : Growth Option: 33.6789
Dividend Option: 13.7091(Direct)-Growth Option: 33.7148(Direct)-Dividend Option: 13.7301
(In `)
corPUS (Oct 12 - Dec 12) : Qtly - AAUM (`) : 41.05 CroresPorTFolio TUrnovEr rATio
: 0.0159
PorTFolio issuer % to nAvICICI Bank 8.87Housing Development Finance 8.25ITC 7.57Tata Consultancy Service 7.40Larsen & Toubro 7.17HDFC Bank 6.06Infosys 4.27Tata Motors 4.08Reliance Industries 3.98Oil & Natural Gas Corp 3.66State Bank Of India 3.58Maruti Udyog 3.44LIC Housing Finance 3.13Dr Reddy's Lab 3.07Associated Cement Companies 2.65Yes Bank 2.58Bharti Airtel 2.43Mahindra & Mahindra 2.16Tata Iron & Steel 2.09Equity less than 2% of corpus 12.08Total Equity Holdings 98.52cblo & others* 1.48Total Assets 100.00
JM Basic Fund(An Open-Ended Sector Scheme)
SnAPSHoTinvESTMEnT objEcTivE
: To provide capital appreciation to its Unitholders through judicious deployment of the corpus of the Scheme in sectors categorized under “basic industry” in the normal parlance and in context of the Indian economy, including but not limited to, energy, petrochemicals, oil & gas, power generation & distribution and electrical equipment suppliers, metals and building material. The fund would continue to remain open-ended with a sector focus.
FUnD MAnAgEr : Asit bhandarkar(Managing this fund since December, 2006 & total 9 yrs of experience in fund management & equity research).
incEPTion@ : 2nd June, 1997nAv DETAilS : Growth Option: 12.6569
Dividend Option: 8.8378(Direct)-Growth Option: 12.6616(Direct)-Dividend Option: 8.8456
(In `)
corPUS (Oct 12 - Dec 12)
: Qtly - AAUM (`) : 209.03 Crores
PorTFolio TUrnovEr rATio
: 0.0179
riSK rEPorTScheme name beta Sharpe Std. Dev.JM Equity Fund - Growth Option 1.07 (0.22) 19.43
Source: Mutual Funds India Explorernote: Standard Deviation & Sharpe are calculated on Annualised basis using 3 years history of monthly returns (using daily frequency). Risk Free rate assumed to be 8.13% (91 day Treasury Bill yield as on Feb 28, 2013) for calculation of Sharpe Ratio.
PErForMAncE (%) Kindly Refer Page No. 9
PorTFolioissuer % to nAvTata Motors 8.94Larsen & Toubro 7.94ICICI Bank 6.59Housing Development Finance 6.51HDFC Bank 4.51Oil & Natural Gas Corp 4.28Associated Cement Companies 4.26State Bank of India 3.85Thermax 3.81Yes Bank 3.69Bharti Airtel 3.69Crompton Greaves 3.52Power Finance Corporation 3.33L&T Finance Holdings 3.31Infrastructure Development Finance Company 2.94Maruti Udyog 2.90Mahindra & Mahindra Financial Services 2.48JSW Steel 2.46Mahindra & Mahindra 2.41Jai Prakash Associates 2.21LIC Housing Finance 2.06AXIS Bank 2.01Equity less than 2% of corpus 10.70Total Equity Holdings 98.40cblo & others* 1.60Total Assets 100.00
PErForMAncE (%) Kindly Refer Page No. 9
riSK rEPorTScheme name beta Sharpe Std. Dev.
JM Basic Fund - Growth Option 1.26 (0.58) 24.40
Source: Mutual Funds India Explorernote: Standard Deviation & Sharpe are calculated on Annualised basis using 3 years history of monthly returns (using daily frequency). Risk Free rate assumed to be 8.13% (91 day Treasury Bill yield as on Feb 28, 2013) for calculation of Sharpe Ratio.
ASSET AllocATion by SEcTor
SnAPSHoTinvESTMEnT objEcTivE : To provide capital appreciation by
investing in equity and equity related securities using a combination of strategies.
FUnD MAnAgEr : Sanjay chhabaria(Managing this fund since February, 2009 & more than 12 years of experience in fund management & equity research).
incEPTion@ : 23rd September, 2008nAv DETAilS : Growth Option: 12.2478
Dividend Option: 11.3911(Direct)-Growth Option: 12.2491(Direct)-Dividend Option: 11.3985
(In `)
corPUS (Oct 12 - Dec 12) : Qtly - AAUM (`) : 199.63 CroresPorTFolio TUrnovEr rATio
: 0.0116
JM Multi Strategy Fund (An Open-Ended Equity Oriented Scheme)
PorTFolioissuer % to nAvICICI Bank 10.58$
Larsen & Toubro 9.55Housing Development Finance 8.95Tata Motors 5.54HDFC Bank 4.93Tata Consultancy Service 4.86Associated Cement Companies 4.04Eicher Motors 3.99Mahindra & Mahindra Financial Services 3.88Maruti Udyog 3.87State Bank Of India 3.46LIC Housing Finance 3.16Gujarat Ambuja Cements 3.07Dr Reddy's Lab 2.86Mahindra & Mahindra 2.55Infrastructure Development Finance Company 2.46Bharti Airtel 2.46Yes Bank 2.28L&T Finance Holdings 2.25Crompton Greaves 2.24HCL Technologies 2.22Oil & Natural Gas Corp 2.18Equity less than 2% of corpus 7.31Total Equity Holdings 98.69cblo & others* 1.31Total Assets 100.00
$ increase over 10% on account of market movements/change in net assets of the scheme.
PErForMAncE (%) Kindly Refer Page No. 9
Total Equity: 98.52%0.01%
0.99%1.58%
2.02%2.09%
2.43%3.08%
3.66%3.85%3.98%
7.17%10.61%10.66%
11.68%13.63%
21.09%
Mineral/MiningNon Ferrous Metals
Industrial Capital GoodsPower
Ferrous MetalsTelecom-ServicesPharmaceuticals
OilCement
Petroleum ProductsConstruction Project
Consumer Non DurablesAuto
SoftwareFinance
Banks
Total Equity: 98.40%
0.11%0.18%
1.24%1.50%1.80%
3.69%3.76%
4.25%4.26%4.28%
7.94%7.96%
16.16%20.62%20.65%
Petroleum ProductsIndustrial Products
PharmaceuticalsAuto Ancillaries
Non Ferrous MetalsTelecom-Services
ConstructionFerrous Metals
CementOil
Construction ProjectIndustrial Capital Goods
AutoFinance
Banks
4
Details as on February 28, 2013
ASSET AllocATion by SEcTor
PErForMAncE (%) Kindly Refer Page No. 9
SnAPSHoTinvESTMEnT objEcTivE : To provide long-term growth by
i nve s t i n g p re d o m i n a nt l y i n a concentrated portfolio of equity / equity related instruments
FUnD MAnAgEr : Asit bhandarkar(Managing this fund since February, 2009 & total 9 yrs of experience in fund management & equity research).
incEPTion@ : 5th March, 2008nAv DETAilS(In `)
: Growth Option: 3.5677Dividend Option: 3.5676(Direct)-Growth Option: 3.5700(Direct)-Dividend Option: 3.5425
corPUS (Oct 12 - Dec 12) : Qtly - AAUM (`) : 51.18 CroresPorTFolio TUrnovEr rATio
: 0.0259
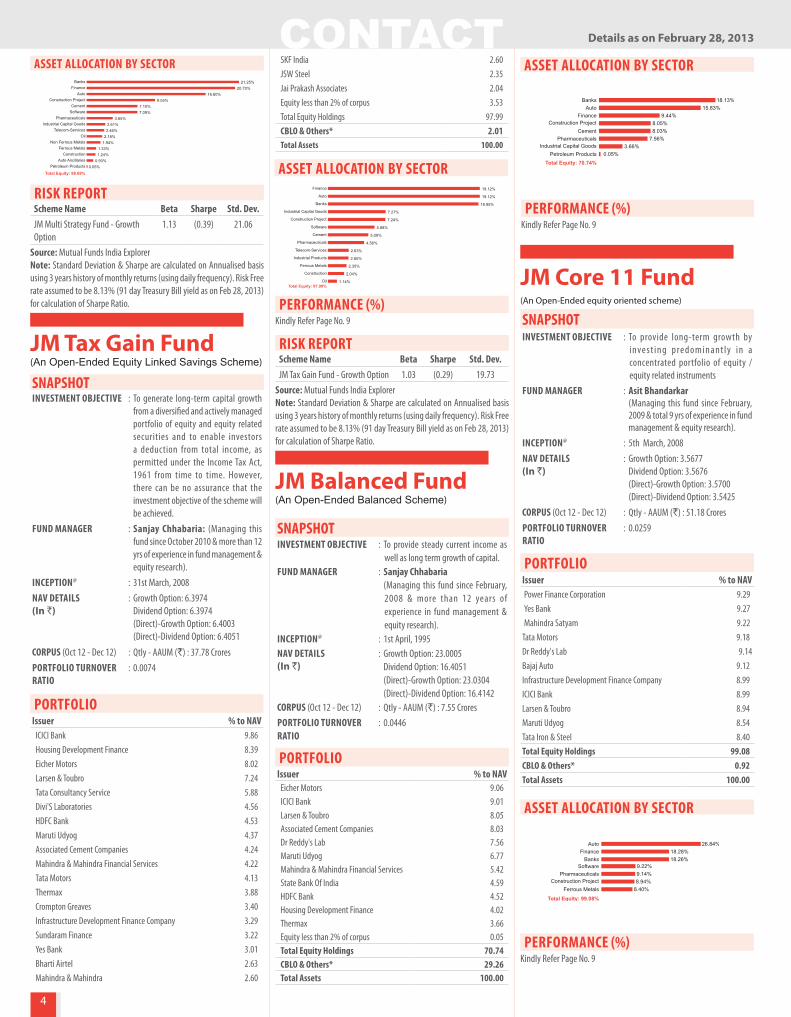
PorTFolio issuer % to nAvPower Finance Corporation 9.29Yes Bank 9.27Mahindra Satyam 9.22
Tata Motors 9.18Dr Reddy's Lab 9.14Bajaj Auto 9.12Infrastructure Development Finance Company 8.99ICICI Bank 8.99Larsen & Toubro 8.94Maruti Udyog 8.54Tata Iron & Steel 8.40Total Equity Holdings 99.08cblo & others* 0.92Total Assets 100.00
JM Core 11 Fund (An Open-Ended equity oriented scheme)
PErForMAncE (%) Kindly Refer Page No. 9
ASSET AllocATion by SEcTor
ASSET AllocATion by SEcTor
ASSET AllocATion by SEcTor
PErForMAncE (%) Kindly Refer Page No. 9
SnAPSHoTinvESTMEnT objEcTivE : To generate long-term capital growth
from a diversified and actively managed portfolio of equity and equity related securities and to enable investors a deduction from total income, as permitted under the Income Tax Act, 1961 from time to time. However, there can be no assurance that the investment objective of the scheme will be achieved.
FUnD MAnAgEr : Sanjay chhabaria: (Managing this fund since October 2010 & more than 12 yrs of experience in fund management & equity research).
incEPTion@ : 31st March, 2008nAv DETAilS(In `)
: Growth Option: 6.3974Dividend Option: 6.3974(Direct)-Growth Option: 6.4003(Direct)-Dividend Option: 6.4051
corPUS (Oct 12 - Dec 12) : Qtly - AAUM (`) : 37.78 CroresPorTFolio TUrnovEr rATio
: 0.0074
JM Tax Gain Fund (An Open-Ended Equity Linked Savings Scheme)
SnAPSHoTinvESTMEnT objEcTivE : To provide steady current income as
well as long term growth of capital.FUnD MAnAgEr : Sanjay chhabaria
(Managing this fund since February, 2008 & more than 12 years of experience in fund management & equity research).
incEPTion@ : 1st April, 1995nAv DETAilS(In `)
: Growth Option: 23.0005Dividend Option: 16.4051(Direct)-Growth Option: 23.0304(Direct)-Dividend Option: 16.4142
corPUS (Oct 12 - Dec 12) : Qtly - AAUM (`) : 7.55 CroresPorTFolio TUrnovEr rATio
: 0.0446
PorTFolio issuer % to nAv
Eicher Motors 9.06ICICI Bank 9.01Larsen & Toubro 8.05Associated Cement Companies 8.03Dr Reddy's Lab 7.56Maruti Udyog 6.77Mahindra & Mahindra Financial Services 5.42State Bank Of India 4.59HDFC Bank 4.52Housing Development Finance 4.02Thermax 3.66Equity less than 2% of corpus 0.05Total Equity Holdings 70.74cblo & others* 29.26Total Assets 100.00
JM Balanced Fund (An Open-Ended Balanced Scheme)
riSK rEPorTScheme name beta Sharpe Std. Dev.JM Tax Gain Fund - Growth Option 1.03 (0.29) 19.73
Source: Mutual Funds India Explorernote: Standard Deviation & Sharpe are calculated on Annualised basis using 3 years history of monthly returns (using daily frequency). Risk Free rate assumed to be 8.13% (91 day Treasury Bill yield as on Feb 28, 2013) for calculation of Sharpe Ratio.
riSK rEPorT Scheme name beta Sharpe Std. Dev.JM Multi Strategy Fund - Growth Option
1.13 (0.39) 21.06
Source: Mutual Funds India Explorernote: Standard Deviation & Sharpe are calculated on Annualised basis using 3 years history of monthly returns (using daily frequency). Risk Free rate assumed to be 8.13% (91 day Treasury Bill yield as on Feb 28, 2013) for calculation of Sharpe Ratio.
PorTFolio issuer % to nAv
ICICI Bank 9.86Housing Development Finance 8.39Eicher Motors 8.02Larsen & Toubro 7.24Tata Consultancy Service 5.88Divi'S Laboratories 4.56HDFC Bank 4.53Maruti Udyog 4.37Associated Cement Companies 4.24Mahindra & Mahindra Financial Services 4.22Tata Motors 4.13Thermax 3.88Crompton Greaves 3.40Infrastructure Development Finance Company 3.29Sundaram Finance 3.22Yes Bank 3.01Bharti Airtel 2.63Mahindra & Mahindra 2.60
SKF India 2.60JSW Steel 2.35Jai Prakash Associates 2.04Equity less than 2% of corpus 3.53Total Equity Holdings 97.99cblo & others* 2.01Total Assets 100.00
Total Equity: 98.69%0.05%
0.93%1.24%1.33%
1.94%2.18%2.46%2.61%
3.65%7.09%7.10%
9.55%16.60%
20.70%21.25%
Petroleum ProductsAuto Ancillaries
ConstructionFerrous Metals
Non Ferrous MetalsOil
Telecom-ServicesIndustrial Capital Goods
PharmaceuticalsSoftwareCement
Construction ProjectAuto
FinanceBanks
Total Equity: 97.99%1.14%
2.04%
2.35%
2.60%
2.63%
4.56%
5.09%
5.88%
7.24%
7.27%
18.95%
19.12%
19.12%
Oil
Construction
Ferrous Metals
Industrial Products
Telecom-Services
Pharmaceuticals
Cement
Software
Construction Project
Industrial Capital Goods
Banks
Auto
Finance
Total Equity: 70.74%0.05%
3.66%7.56%
8.03%8.05%
9.44%15.83%
18.13%
Petroleum ProductsIndustrial Capital Goods
PharmaceuticalsCement
Construction ProjectFinance
AutoBanks
Total Equity: 99.08%
8.40%8.94%9.14%9.22%
18.26%18.28%
26.84%
Ferrous MetalsConstruction Project
PharmaceuticalsSoftware
BanksFinance
Auto

5
Details as on February 28, 2013
riSK rEPorTScheme name beta Sharpe Std. Dev.JM Core 11 Fund - Growth Option 1.41 (0.19) 27.11
Source: Mutual Funds India Explorernote: Standard Deviation & Sharpe are calculated on Annualised basis using 3 years history of monthly returns (using daily frequency). Risk Free rate assumed to be 8.13% (91 day Treasury Bill yield as on Feb 28, 2013) for calculation of Sharpe Ratio.
ASSET AllocATion by SEcTor
SnAPSHoTinvESTMEnT objEcTivE
: To generate regular income, primarily through investments in fixed income securities so as to make monthly, quarterly and annual dividend distribution, declare bonus in the growth option. The Fund would also aim to achieve capital appreciation through investing a portion of its assets in equity and equity related securities.
FUnD MAnAgEr
: Shalini Tibrewala(Managing this fund since September, 2003 & over 14 years of experience in fund management & financial services sector).
incEPTion@ : 18th September, 2003nAv DETAilS(In `)
: Growth Option: 17.1860Dividend Option-Monthly Dividend: 10.4014Dividend Option-Quarterly Dividend: 12.9497Dividend Option-Annual Dividend: 13.8064(Direct)-Growth Option: 17.2103(Direct)-Dividend Option-Monthly Dividend: 10.4161(Direct)-Dividend Option-Quarterly Dividend: 12.9679(Direct)-Dividend Option-Annual Dividend: 13.8259
corPUS (Oct 12 - Dec 12)
: Qtly - AAUM (`) : 5.49 Crores
PorTFolio issuer % to nAv ratingAssociated Cement Companies 3.54HDFC Bank 4.58Larsen & Toubro 4.54Total Equity Holdings 12.66Money Market instruments 19.45commercial PaperTata Teleservices 19.45 CARE A1+corporate Debt 3.32Britannia Industries 3.32 CRISIL AAATotal Debt Holdings 22.77cblo & others* 64.57Total Assets 100.00
JM MIP Fund (An Open-Ended Monthly Income Fund with no assured return. Monthly Income is not assured and is subject to the availability of the distributable surplus.)
PErForMAncE (%) Kindly Refer Page No. 10
PorTFolio STATiSTicSCurrent Yield 8.08%Duration 0.0164 yearsAverage Maturity 0.0165 years
SnAPSHoTinvESTMEnT objEcTivE : To generate income through arbitrage
opportunities emerging out of mis-pricing between the cash market and the derivatives market and through deployment of surplus cash in fixed income instruments.
FUnD MAnAgEr : chaitanya choksi(Managing this fund since Feb 1, 2011 and has around 10 years of work experience in the field of equity research and capital markets.)
incEPTion@ : 18th July, 2006nAv DETAilS(In `)
: Dividend Option: 10.5136Growth Option: 16.2097(Direct)-Dividend Option: 10.5184(Direct)-Growth Option: 16.2173
corPUS (Oct 12 - Dec 12) : Qtly - AAUM (`) : 22.95 CroresPorTFolio TUrnovEr rATio
: 0.0905
JM arbitrage advantage Fund(An Open-Ended Equity Oriented Interval Scheme)
PorTFolio
issuer
Market value
(` in lacs)
% to nAv
Market value (` in lacs) Futures
banks 290.72 15.37 (293.27)Andhra Bank 10.92 0.58Andhra Bank - Futures (11.02)Dena Bank 56.77 3.00Dena Bank - Futures (57.31)Indian Overseas Bank 19.47 1.03Indian Overseas Bank - Futures (19.70)Karnataka Bank 16.79 0.89Karnataka Bank - Futures (16.96)Punjab National Bank 150.19 7.94Punjab National Bank - Futures (151.38)UCO Bank 36.58 1.93UCO Bank - Futures (36.90)cement 162.57 8.60 (164.00)Grasim Industries 162.57 8.60Grasim Industries - Futures (164.00)construction 16.38 0.87 (16.58)IVRCL Infrastructure & Projects 16.38 0.87IVRCL Infrastructure & Projects - Futures
(16.58)
consumer non Durable 128.81 6.81 (130.04)United Spirits 128.81 6.81United Spirits - Futures (130.04)
gas 23.00 1.22 (23.21)Indraprastha Gas 23.00 1.22Indraprastha Gas - Futures (23.21)Hotels 19.44 1.03 (19.67)Indian Hotels Co 19.44 1.03Indian Hotels Co - Futures (19.67)non Ferrous Metals 17.80 0.94 (17.95)Hindalco Industries 17.80 0.94Hindalco Industries - Futures (17.95)Pesticides 118.12 6.24 (119.14)United Phosphorous 118.12 6.24United Phosphorous - Futures (119.14)Petroleum Products 50.87 2.69 (51.31)Reliance Industries 50.87 2.69Reliance Industries - Futures (51.31)Pharmaceuticals 41.83 2.21 (42.22)Aurobindo Pharma 41.83 2.21Aurobindo Pharma - Futures (42.22)Power 193.16 10.21 (193.75)National Hydroelec Power Corporation
146.07 7.72
National Hydroelec Power Corporation - Futures
(146.34)
PTC India 47.09 2.49PTC India - Futures (47.41)retailing 133.91 7.08 (135.28)Pantaloon Retail (India) 133.91 7.08Pantaloon Retail (India) - Futures
(135.28)
Software 42.18 2.23 (42.63)I-Flex Solutions 42.18 2.23I-Flex Solutions - Futures (42.63)Total Equity Holdings 1238.79 65.50 (1249.05)Fixed Deposit 475.00 25.12HDFC Bank 75.00 3.97Yes Bank 400.00 21.15Total Debt Holdings 475.00 25.12cblo & others* 177.40 9.38Total Assets 1891.19 100.00
note: Nifty Futures that are sold is a complete hedge against the purchase of Nifty Basket.
ASSET AllocATion by SEcTor
PErForMAncE (%) Kindly Refer Page No. 9
Although classified under Equity category, Risk ratios are not calculated for JM Arbitrage Advantage Fund as the scheme is benchmarked to CLFI.
3.32%3.54%4.54%4.58%
19.45%64.57%
Corporate DebtAssociated Cement Companies
HDFC BankLarsen & Toubro
Money Market InstrumentsCBLO & Others*
Total Equity: 65.50%0.87%0.94%1.03%1.22%
2.21%2.23%
2.69%6.25%
6.81%7.08%
8.60%10.21%
15.37%
ConstructionNon Ferrous Metals
HotelsGas
PharmaceuticalsSoftware
Petroleum ProductsPesticides
Consumer Non DurableRetailingCement
PowerBanks

6
Details as on February 28, 2013
SnAPSHoTinvESTMEnT objEcTivE
: To provide income by way of dividend (dividend plans) and capital gains (growth plan) through investing in debt and money market instruments.
FUnD MAnAgEr
: Shalini Tibrewala(Managing this fund since December, 1997 & over 14 years of experience in fund management & financial services sector).
incEPTion@ : growth option: 31st December, 1997Weekly Dividend option: 31st December, 1997Daily Dividend option: 2nd July, 2001Quarterly Dividend option.: 23rd Sept, 2003bonus option: 17th August, 2002institutional Plan - growth: 4th April, 2003institutional Plan - WDo: 4th April, 2003institutional Plan - DDo: 28th July, 2003Super institutional Plan - growth:19th May, 2004.Super institutional Plan - DDo:19th May, 2004.Super institutional Plan - WDo: 19th May, 2004.
nAv DETAilS(In `)
: Growth Option: 31.7417Weekly Dividend Option: 11.0086Daily Dividend Option: 10.4302 Bonus Option: 10.1639Quarterly Dividend Option: 17.9661(Direct)-Growth Option: 31.7468(Direct)-Weekly Dividend Option: 11.0112(Direct)-Daily Dividend Option: 10.4302 (Direct)-Bonus Option: 10.1654(Direct)-Quarterly Dividend Option: 17.9681institutional Plan: Growth Option: 19.1753Weekly Dividend Option: 10.7607Daily Dividend Option: 10.0159Super institutional Plan: Growth Option: 18.2552Weekly Dividend Option: 10.1548Daily Dividend Option: 10.0165
corPUS (Oct 12 - Dec 12)
: Qtly - AAUM (`) : 5144.36 Crores
JM High Liquidity Fund(An Open - Ended Liquid Scheme)
PorTFolio issuer % to nAv ratingMoney Market instruments 83.12
certificate of Deposits
Andhra Bank 0.92 CARE A1+
Bank of Maharashtra 5.98 CRISIL A1+
Canara Bank 3.41 CRISIL A1+
ICICI Bank 1.38 ICRA A1+
IDBI Bank 1.38 CRISIL A1+
Indusind Bank 1.37 CRISIL A1+
ING Vysya Bank 2.31 CRISIL A1+
Karur Vysya Bank 0.92 CRISIL A1+
Oriental Bank of Commerce 3.22 CRISIL A1+
Punjab National Bank 9.66 CARE A1+
South Indian Bank 1.01 CARE A1+
State Bank of Patiala 1.38 ICRA A1+
commercial Paper
Aditya Birla Finance 1.14 ICRA A1+
Alkem Laboratories 3.68 CRISIL A1+
Berger Paints 1.84 CRISIL A1+
Blue Star 0.92 CARE A1+
Century Textiles & Industries 3.67 CARE A1+
Chambal Fertilisers & Chemicals 0.46 CRISIL A1+
First Blue Home Finance 0.92 CRISIL A1+
HCL Infosystems 2.28 ICRA A1+
Hindustan Petroleum Corporation 0.92 CRISIL A1+
Housing Development & Finance Corp
0.09 ICRA A1+
India Infoline Finance 2.29 ICRA A1+
Indian Oil Corporation 1.38 ICRA A1+
Jindal Saw 0.46 CARE A1+
JM Money Manager Fund - Regular Plan(An Open - Ended Debt Scheme)
ASSET AllocATion
PErForMAncE (%) Kindly Refer Page No. 10
PorTFolio STATiSTicSCurrent Yield 8.45%Duration 0.0398 yearsAverage Maturity 0.0398 years
SnAPSHoTinvESTMEnT objEcTivE
: To generate stable long term returns with low risk strategy and capital appreciation/accretion through investments in debt instruments and related securities besides preservation of capital.
FUnD MAnAgEr : vikas Agrawal(Managing this fund since July, 2011 & has total 9 years of experience in fixed income market).
incEPTion@ : regular Plan - growth: 27th Sept, 2006regular Plan - DDo: 27th Sept, 2006regular Plan - WDo: 26th July, 2007regular Plan - FDo: 26th Sept, 2008
nAv DETAilS(In `)
: regular Plan - Growth Option: 16.1774Daily Dividend Option: 10.0350Weekly Dividend Option: 10.6136Fortnightly Dividend Option: 10.2392(Direct)-Growth Option: 16.1853(Direct)-Daily Dividend Option: 10.0350(Direct)-Weekly Dividend Option: 10.6293(Direct)-Fortnightly Dividend Option: 10.2644
corPUS (Oct 12 - Dec 12)
: Qtly - AAUM (`) : 187.29 Crores
ASSET AllocATion
PErForMAncE (%) Kindly Refer Page No. 10
PorTFolio STATiSTicS Current Yield 9.41%Duration 0.0652yearsAverage Maturity 0.0652 years
JM Money Manager Fund - Super Plan(An Open - Ended Debt Scheme)
SnAPSHoTinvESTMEnT objEcTivE
: To generate stable long term returns with low risk strategy and capital appreciation/ accretion through investments in debt instruments and related securities besides preservation of capital.
FUnD MAnAgEr : vikas Agrawal(Managing this fund since July, 2011 & has total 9 years of experience in fixed income market).
incEPTion@ : Super Plan - growth: 27th Sept, 2006Super Plan - DDo: 27th Sept, 2006Super Plan - WDo: 12th October, 2007Super Plan - FDo: 2nd April, 2008
nAv DETAilS (in `)
: Growth Option: 16.6277Daily Dividend Option: 10.0090Weekly Dividend Option: 10.6462Fortnightly Dividend Option: 10.2882(Direct)-Growth Option: 16.6303(Direct)-Daily Dividend Option: 10.0090(Direct)-Weekly Dividend Option: 10.6575(Direct)-Fortnightly Dividend Option: 10.2988
corPUS (Oct 12 - Dec 12)
: Qtly - AAUM (`) : 223.01 Crores
PorTFolio issuer % to nAv ratingMoney Market instruments 89.58certificate of DepositsBank of Baroda 2.92 ICRA A1+Central Bank of India 14.59 CARE A1+IDBI Bank 14.49 CRISIL A1+Punjab National Bank 14.55 CARE A1+commercial PaperCholamandalam Investment & Finance Company 5.20 ICRA A1+
India Infoline Finance 14.59 ICRA A1+RHC Holding 8.69 ICRA A1+ (SO)Tata Teleservices 14.55 CARE A1+Total Debt Holdings 89.58cblo & others* 10.42Total Assets 100.00
Jindal Steel & Power 2.75 ICRA A1+
Kotak Mahindra Prime 1.29 CRISIL A1+
Madras Cements 1.84 ICRA A1+
Magma Fincorp 0.92 CARE A1+
Morgan Stanley India Capital 0.28 IND A1+
Nirma 3.23 CRISIL A1+
Orient Paper & Industries 0.92 ICRA A1+
Paharpur Cooling Towers 0.46 CRISIL A1+
Redington India 1.84 ICRA A1+
Religare Finvest 0.92 ICRA A1+
Shapoorji Pallonji & Company 1.82 ICRA A1+
Srei Equipment Finance 0.92 ICRA A1+
Supreme Industries 0.74 CRISIL A1+
Tata Teleservices 8.90 CARE A1+
Vardhman Textiles 3.30 CRISIL A1+
Treasury bills 0.07
364 Days T- Bill 0.07 GOI SOV
Total Debt Holdings 83.19
cblo & others* 16.81
Total Assets 100.00
PorTFolio issuer % to nAv ratingMoney Market instruments 78.02certificate of DepositsCanara Bank 10.14 CRISIL A1+ING Vysya Bank 10.27 CRISIL A1+Punjab National Bank 10.24 CARE A1+commercial PaperCholamandalam Investment & Finance Company 6.51 ICRA A1+
HCL Infosystems 10.17 ICRA A1+India Infoline Finance 10.27 ICRA A1+RHC Holding 10.19 ICRA A1+ (SO)Tata Teleservices 10.23 CARE A1+Total Debt Holdings 78.02cblo & others* 21.98 Total Assets 100.00
83.12%
Treasury Bills
Money Market Instruments
16.81%CBLO & Others*
0.07%
21.98%
78.02%
CBLO & Others*
Money Market Instruments

7
Details as on February 28, 2013
ASSET AllocATion
PErForMAncE (%) Kindly Refer Page No. 10
PorTFolio STATiSTicSCurrent Yield 8.83%Duration 0.0389 yearsAverage Maturity 0.0389 years
JM Money Manager Fund - Super Plus Plan(An Open - Ended Debt Scheme)
SnAPSHoTinvESTMEnT objEcTivE
: To generate stable long term returns with low risk strategy and capital appreciation/accretion through investments in debt instruments and related securities besides preservation of capital.
FUnD MAnAgEr : Shalini Tibrewala(Managing this fund since September, 2006 & has over 14 years of experience in fund management & financial services sector).
incEPTion@ : Super Plus Plan - growth: 27th Sept, 2006Super Plus Plan - DDo: 27th Sept, 2006Super Plus Plan - WDo: 16th July, 2007Super Plus Plan - FDo: 12th July, 2007
nAv DETAilS(In `)
: Growth Option: 16.5032Daily Dividend Option: 10.0060Weekly Dividend Option: 10.6425Fortnightly Dividend Option: 10.3396(Direct)-Growth Option: 16.5058(Direct)-Daily Dividend Option: 10.0060(Direct)-Weekly Dividend Option: 10.6570(Direct)-Fortnightly Dividend Option: 10.3547
corPUS (Oct 12 - Dec 12)
: Qtly - AAUM (`) : 1016.06 Crores
ASSET AllocATion
PErForMAncE (%) Kindly Refer Page No. 10
PorTFolio STATiSTicSCurrent Yield 8.95%Duration 0.0630 yearsAverage Maturity 0.0638 years
PorTFolio issuer % to nAv ratingMoney Market instruments 90.60certificate of DepositsAndhra Bank 2.34 CARE A1+Bank of India 4.66 CRISIL A1+Bank of Maharashtra 7.00 CRISIL A1+Indian Bank 4.67 IND A1+Punjab National Bank 7.00 CARE A1+Ratnakar Bank 4.63 ICRA A1+State Bank of Patiala 9.30 ICRA A1+commercial PaperAlembic Pharmaceuticals 3.72 CRISIL A1+India Infoline Finance 9.34 ICRA A1+India Infoline Finance 2.32 ICRA A1+Madras Cements 4.67 ICRA A1+Religare Finvest 4.67 ICRA A1+RHC Holding 5.56 ICRA A1+ (SO)Tata Teleservices 13.84 CARE A1+Usha Martin 2.33 CARE A1+Vedanta Aluminium 2.33 CRISIL A1+ (SO)Vodafone India 2.22 CRISIL A1+
JM Floater Long Term Fund(An Open-Ended Income Scheme)(w.e.f. December 28, 2012, the Scheme name has been changed from JM Floater Fund - Long Term Plan)
SnAPSHoTinvESTMEnT objEcTivE
: To provide regular income and capital appreciation through investment in floating rate debt instruments, fixed rate debt instruments swapped for floating rate returns and also fixed rate instruments and money market instruments.
FUnD MAnAgEr : Shalini Tibrewala(Managing this fund since March, 2006 & has over 14 years of experience in fund management & financial services sector).
incEPTion@ : growth : 25th June, 2003Dividend : 25th June, 2003Daily Dividend option: 22nd May, 2007Weekly Dividend option: 22nd May, 2007Premium Plan - growth: 13th October, 2004Premium Plan - Dividend: 13th October, 2004Premium Plan - DDo: 15th May, 2007Premium Plan - WDo: 18th May, 2007
nAv DETAilS(In `)
: Growth Option: 17.8388 Dividend Option: 17.9004Daily Dividend Option: 10.0031 Wkly Dividend Option: 10.5504(Direct)-Growth Option: 17.8451 (Direct)-Dividend Option: 17.9067(Direct)-Daily Dividend Option: 10.0041 (Direct)-Wkly Dividend Option: 10.5637
Premium Plan - Growth Option: 17.2251Dividend Option: 10.3521 Daily Dividend Option: 10.0031 Wkly Dividend Option: 10.5860
corPUS (Oct 12 - Dec 12)
: Qtly - AAUM (`) : 0.42 Crores
PErForMAncE (%) Kindly Refer Page No. 10
ASSET AllocATion
PorTFolio issuer % to nAv ratingcblo & others* 100.00Total Assets 100.00
PorTFolio STATiSTicSCurrent Yield 7.71%Duration 0.0027 years
Average Maturity 0.0027 years
JM Floater Short Term Fund(An Open-Ended Liquid Scheme)(w.e.f. December 28, 2012, the Scheme name has been changed from JM Floater Fund - Short Term Plan)
SnAPSHoTinvESTMEnT objEcTivE
: To provide regular income and capital appreciation through investment in floating rate debt instruments, fixed rate debt instruments swapped for floating rate returns and also fixed rate instruments and money market instruments.
FUnD MAnAgEr : Shalini Tibrewala(Managing this fund since September, 2006 & over 14 years of experience in fund management & financial services sector).
incEPTion@ : 25th June, 2003
nAv DETAilS(In `)
: Growth Option : 18.2612Daily Dividend Option : 10.0883(Direct)-Growth Option : 18.2664(Direct)-Daily Dividend Option : 10.0890
corPUS (Oct 12 - Dec 12)
: Qtly - AAUM (`) : 1.73 Crores
PorTFolioissuer % to nAv ratingcblo & others* 100.00Total Assets 100.00
ASSET AllocATion
PErForMAncE (%) Kindly Refer Page No. 10
PorTFolio STATiSTicSCurrent Yield 7.71%Duration 0.0027 YearsAvg. Maturity 0.0027 Years
corporate Debt 0.93Rural Electrification Corporation 0.93 CRISIL AAATreasury bills 0.18364 Days T- Bill 0.18 GOI SOVTotal Debt Holdings 91.71cblo & others* 8.29Total Assets 100.00
10.42%
89.58%CBLO & Others*
Money Market Instruments
0.93%
8.29%
90.60%
Treasury Bills
CBLO & Others*
Corporate Debt
Money Market Instruments
0.19%
100.00%CBLO & Others*
100.00%CBLO & Others*

8
Details as on February 28, 2013
JM Short Term Fund(An Open-Ended Income Scheme)
SnAPSHoTinvESTMEnT objEcTivE
: To generate regular returns and high level of liquidity with low risk strategy and capital appreciation / accretion through investment in debt instruments and related securities besides preservation of capital.
FUnD MAnAgEr : girish Hisaria(Managing this fund since July 2009 & has total 7 years of experience in Fixed Income Markets).
incEPTion@ : regular Plan - growth: 24th June, 2002regular Plan - Dividend: 24th June, 2002regular Plan - DDo: 31st March, 2011growth: 4th April, 2003Dividend: 4th April, 2003Daily Dividend option: 6th April, 2011
nAv DETAilS(In `)
: Growth Option: 16.6656Dividend Option: 10.5578Daily Dividend Option: 10.0425(Direct)-Growth Option: 16.6695(Direct)-Dividend Option: 10.5860(Direct)-Daily Dividend Option: 10.0425regular Plan - Growth Option: 22.9425Dividend Option: 11.6290Daily Dividend Option: 10.0343
corPUS (Oct 12 - Dec 12)
: Qtly - AAUM (`) : 242.24 Crores
ASSET AllocATion
PorTFolio issuer % to nAv ratingMoney Market instruments 52.69certificate of DepositsING Vysya Bank 12.06 CRISIL A1+
commercial PaperAditya Birla Finance 4.82 ICRA A1+India Infoline Finance 12.07 ICRA A1+Power Finance Corporation 11.70 CRISIL A1+Tata Teleservices 12.04 CARE A1+corporate Debt 21.86Bajaj Finance 4.83 ICRA AA+Hindalco Industries 4.92 CRISIL AA+Power Finance Corporation 2.41 CRISIL AAAReliance Gas Transportation Infrastructure
2.48 CRISIL AAA
Shriram Transport Finance Company 2.42 CARE AA+Sundaram BNP Paribas Home Finance 4.80 CARE AA+Treasury bills 0.96364 Days T- Bill 0.96 GOI SOVTotal Debt Holdings 75.51cblo & others* 24.49Total Assets 100.00
PorTFolio STATiSTicSCurrent Yield 9.10%Duration 0.9525 YearsAvg. Maturity 1.2588 Years
JM Income Fund(An Open-Ended Income Scheme)
SnAPSHoTinvESTMEnT objEcTivE : To generate stable long term returns with
low risk strategy and capital appreciation / accretion through investment in debt instruments and related securities besides preservation of capital.
FUnD MAnAgEr : girish Hisaria(Managing this fund since July 2009 & has total 7 years of experience in Fixed Income Markets).
incEPTion@ : growth option: 1st April, 1995Quarterly Dividend option: 1st April, 1995bonus option: 18th March, 2002
nAv DETAilS (In `) : Growth Option : 34.7575Quarterly Dividend Option : 12.2970Bonus Option : 14.2196(Direct)-Growth Option : 34.7854(Direct)-Quarterly Dividend Option: 12.3144(Direct)-Bonus Option : 14.2397
corPUS (Oct 12 - Dec 12) : Qtly - AAUM (`) : 9.89 Crores
PorTFolio issuer % to nAv ratingMoney Market instruments 30.05
certificate of Deposits
AXIS Bank 8.65 CRISIL A1+
Canara Bank 4.12 CRISIL A1+
Vijaya Bank 8.64 CARE A1+
Yes Bank 8.64 ICRA A1+
government Securities 21.228.30% GOI 2042 21.22 GOI SOV
Total Debt Holdings 51.27cblo & others* 48.73Total Assets 100.00
ASSET AllocATion
PErForMAncE (%) Kindly Refer Page No. 9
PorTFolio STATiSTicSCurrent Yield 7.92%Duration 3.1964 YearsAvg. Maturity 8.2633 Years
ASSET AllocATion
JM G-Sec Fund(An Open-Ended Dedicated Gilt Scheme)
SnAPSHoTinvESTMEnT objEcTivE
: To provide ultimate level of safety to its unitholders through investments in sovereign securities issued by the Central and State Government.
FUnD MAnAgEr : girish Hisaria(Managing this fund since July 2009 & has total 7 years of experience in Fixed Income Markets).
incEPTion@ : growth option : 29th September, 1999Quarterly Dividend option : 29th September, 1999bonus option : 30th November, 2002
nAv DETAilS (In `) : Growth Option : 37.4953Quarterly Dividend Option : 17.6137Bonus Option : 18.2342(Direct)-Growth Option : 37.5336(Direct)-Quarterly Dividend Option: 17.6283(Direct)-Bonus Option : 18.2588
corPUS (Oct 12 - Dec 12)
: Qtly - AAUM (`) : 22.12 Crores
PorTFolio issuer % to nAv rating
government Securities 32.62
8.30% GOI 2042 32.62 GOI SOV
Treasury bills 8.45
364 Days T- Bill 8.45 GOI SOV
Total Debt Holdings 41.07
cblo & others* 58.93
Total Assets 100.00
PErForMAncE (%) Kindly Refer Page No. 9
PorTFolio STATiSTicSCurrent Yield 7.96%Duration 6.4510 YearsAvg. Maturity 16.7609 Years
(*) Others may include net receivables / payables, cash, cash equivalents, stocks in transition and other instruments such as warrants, convertibles etc.
PErForMAncE (%) Kindly Refer Page No. 9
21.86%
24.49%CBLO & Others*
Money Market Instruments
0.96%
Corporate Debt
52.69%
Treasury Bills
48.73%
21.22%
Money Market InstrumentsCBLO & Others*
30.05%
Government Securities
8.45%
58.93%CBLO & Others*
Government Securities 32.62%Treasury Bills
9
Details as on February 28, 2013
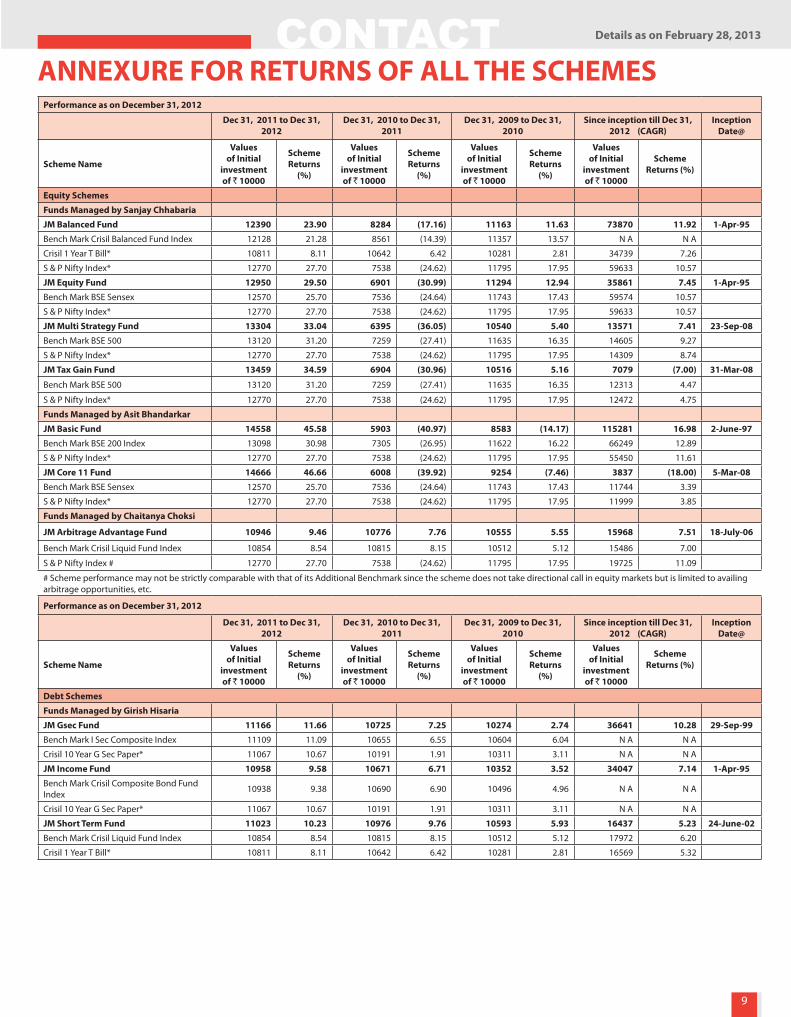
aNNEXURE FoR RETURNS oF aLL THE SCHEMESPerformance as on December 31, 2012
Dec 31, 2011 to Dec 31, 2012
Dec 31, 2010 to Dec 31, 2011
Dec 31, 2009 to Dec 31, 2010
Since inception till Dec 31, 2012 (CaGR)
Inception Date@
Scheme Name
Values of Initial
investment of ` 10000
SchemeReturns
(%)
Values of Initial
investment of ` 10000
SchemeReturns
(%)
Values of Initial
investment of ` 10000
SchemeReturns
(%)
Values of Initial
investment of ` 10000
SchemeReturns (%)
Equity Schemes
Funds Managed by Sanjay Chhabaria
JM Balanced Fund 12390 23.90 8284 (17.16) 11163 11.63 73870 11.92 1-apr-95
Bench Mark Crisil Balanced Fund Index 12128 21.28 8561 (14.39) 11357 13.57 N A N A
Crisil 1 Year T Bill* 10811 8.11 10642 6.42 10281 2.81 34739 7.26
S & P Nifty Index* 12770 27.70 7538 (24.62) 11795 17.95 59633 10.57
JM Equity Fund 12950 29.50 6901 (30.99) 11294 12.94 35861 7.45 1-apr-95
Bench Mark BSE Sensex 12570 25.70 7536 (24.64) 11743 17.43 59574 10.57
S & P Nifty Index* 12770 27.70 7538 (24.62) 11795 17.95 59633 10.57
JM Multi Strategy Fund 13304 33.04 6395 (36.05) 10540 5.40 13571 7.41 23-Sep-08
Bench Mark BSE 500 13120 31.20 7259 (27.41) 11635 16.35 14605 9.27
S & P Nifty Index* 12770 27.70 7538 (24.62) 11795 17.95 14309 8.74
JM Tax Gain Fund 13459 34.59 6904 (30.96) 10516 5.16 7079 (7.00) 31-Mar-08
Bench Mark BSE 500 13120 31.20 7259 (27.41) 11635 16.35 12313 4.47
S & P Nifty Index* 12770 27.70 7538 (24.62) 11795 17.95 12472 4.75
Funds Managed by asit Bhandarkar
JM Basic Fund 14558 45.58 5903 (40.97) 8583 (14.17) 115281 16.98 2-June-97
Bench Mark BSE 200 Index 13098 30.98 7305 (26.95) 11622 16.22 66249 12.89
S & P Nifty Index* 12770 27.70 7538 (24.62) 11795 17.95 55450 11.61
JM Core 11 Fund 14666 46.66 6008 (39.92) 9254 (7.46) 3837 (18.00) 5-Mar-08
Bench Mark BSE Sensex 12570 25.70 7536 (24.64) 11743 17.43 11744 3.39
S & P Nifty Index* 12770 27.70 7538 (24.62) 11795 17.95 11999 3.85
Funds Managed by Chaitanya Choksi
JM arbitrage advantage Fund 10946 9.46 10776 7.76 10555 5.55 15968 7.51 18-July-06
Bench Mark Crisil Liquid Fund Index 10854 8.54 10815 8.15 10512 5.12 15486 7.00
S & P Nifty Index # 12770 27.70 7538 (24.62) 11795 17.95 19725 11.09
# Scheme performance may not be strictly comparable with that of its Additional Benchmark since the scheme does not take directional call in equity markets but is limited to availing arbitrage opportunities, etc.
Performance as on December 31, 2012
Dec 31, 2011 to Dec 31, 2012
Dec 31, 2010 to Dec 31, 2011
Dec 31, 2009 to Dec 31, 2010
Since inception till Dec 31, 2012 (CaGR)
Inception Date@
Scheme Name
Values of Initial
investment of ` 10000
SchemeReturns
(%)
Values of Initial
investment of ` 10000
SchemeReturns
(%)
Values of Initial
investment of ` 10000
SchemeReturns
(%)
Values of Initial
investment of ` 10000
SchemeReturns (%)
Debt Schemes
Funds Managed by Girish Hisaria
JM Gsec Fund 11166 11.66 10725 7.25 10274 2.74 36641 10.28 29-Sep-99
Bench Mark I Sec Composite Index 11109 11.09 10655 6.55 10604 6.04 N A N A
Crisil 10 Year G Sec Paper* 11067 10.67 10191 1.91 10311 3.11 N A N A
JM Income Fund 10958 9.58 10671 6.71 10352 3.52 34047 7.14 1-apr-95
Bench Mark Crisil Composite Bond Fund Index 10938 9.38 10690 6.90 10496 4.96 N A N A
Crisil 10 Year G Sec Paper* 11067 10.67 10191 1.91 10311 3.11 N A N A
JM Short Term Fund 11023 10.23 10976 9.76 10593 5.93 16437 5.23 24-June-02
Bench Mark Crisil Liquid Fund Index 10854 8.54 10815 8.15 10512 5.12 17972 6.20
Crisil 1 Year T Bill* 10811 8.11 10642 6.42 10281 2.81 16569 5.32

10
Details as on February 28, 2013
aNNEXURE FoR RETURNS oF aLL THE SCHEMES
Performance for Liquid Schemes Simple annualised Returns (%)
Scheme Name 7 Days 15 Days 1 mth 3 mths 6 mths Inception Date@
Funds Managed by Shalini TibrewalaJM High Liquidity Fund 8.61 8.55 8.48 8.53 8.83 31-Dec-97Bench Mark Crisil Liquid Fund Index 7.68 7.67 7.65 7.63 7.76Crisil 1 Year T Bill* 9.79 5.78 8.10 7.42 7.81JM Floater Short Term Fund 7.38 7.44 7.40 7.40 7.49 25-June-03Bench Mark Crisil Liquid Fund Index 7.68 7.67 7.65 7.63 7.76Crisil 1 Year T Bill* 9.79 5.78 8.10 7.42 7.81
*Additional Benchmark @ Inception Date is considered as the date of first time allotment of units.
Past performance may or may not be sustained in future and the same may not necessarily provide the basis for comparison with other investment. Absolute returns are computed on investments of `10,000. Returns are computed on Compounded Annual Growth Rate (CAGR) basis. Load is not considered for computation of returns. Growth Option has been considered for calculating the performance of the above mentioned schemes.
Mutual Fund investments are subject to market risks, read all scheme related documents carefully.
Dec 31, 2011 to Dec 31, 2012
Dec 31, 2010 to Dec 31, 2011
Dec 31, 2009 to Dec 31, 2010
Since inception till Dec 31, 2012 (CaGR)
Inception Date@
Scheme Name
Values of Initial
investment of ` 10000
SchemeReturns
(%)
Values of Initial
investment of ` 10000
SchemeReturns
(%)
Values of Initial
investment of ` 10000
SchemeReturns
(%)
Values of Initial
investment of ` 10000
SchemeReturns (%)
Funds Managed by Vikas agrawal
JM Money Manager Fund Regular Plan 11022 10.22 10975 9.75 10599 5.99 15947 7.73 27-Sep-06
Bench Mark Crisil Liquid Fund Index 10854 8.54 10815 8.15 10512 5.12 15322 7.05
Crisil 1 Year T Bill* 10811 8.11 10642 6.42 10281 2.81 14124 5.67
JM Money Manager Fund Super Plan 11019 10.19 10965 9.65 10650 6.50 16405 8.22 27-Sep-06
Bench Mark Crisil Liquid Fund Index 10854 8.54 10815 8.15 10512 5.12 15322 7.05
Crisil 1 Year T Bill* 10811 8.11 10642 6.42 10281 2.81 14124 5.67
Funds Managed by Shalini Tibrewala
JM Floater Long Term Fund 10794 7.94 10813 8.13 10524 5.24 17636 6.14 25-June-03
Bench Mark Crisil Liquid Fund Index 10854 8.54 10815 8.15 10512 5.12 17778 6.23
Crisil 1 Year T Bill* 10811 8.11 10642 6.42 10281 2.81 16347 5.29
JM MIP Fund 11125 11.25 10267 2.67 10414 4.14 17320 6.09 18-Sep-03
Bench Mark Crisil MIP Blended Index 11212 12.12 10172 1.72 10700 7.00 19968 7.73
S & P Nifty Index* 12770 27.70 7538 (24.62) 11795 17.95 45342 17.66
Crisil 1 Year T Bill* 10811 8.11 10642 6.42 10281 2.81 16122 5.27
JM Money Manager Fund Super Plus Plan 11008 10.08 10923 9.23 10548 5.48 16279 8.09 27-Sep-06
Bench Mark Crisil Liquid Fund Index 10854 8.54 10815 8.15 10512 5.12 15322 7.05
Crisil 1 Year T Bill* 10811 8.11 10642 6.42 10281 2.81 14124 5.67
Performance for Liquid Schemes
Dec 31, 2011 to Dec 31, 2012
Dec 31, 2010 to Dec 31, 2011
Dec 31, 2009 to Dec 31, 2010
Since inception till Dec 31, 2012 (CaGR)
Inception Date@
Scheme Name
Values of Initial
investment of ` 10000
SchemeReturns
(%)
Values of Initial
investment of ` 10000
SchemeReturns
(%)
Values of Initial
investment of ` 10000
SchemeReturns
(%)
Values of Initial
investment of ` 10000
SchemeReturns (%)
Funds Managed by Shalini Tibrewala
JM High Liquidity Fund 10958 9.58 10897 8.97 10549 5.49 31313 7.90 31-Dec-97
Bench Mark Crisil Liquid Fund Index 10854 8.54 10817 8.17 10512 5.12 N A N A
Crisil 1 Year T Bill* 10811 8.11 10645 6.45 10281 2.81 25425 6.41
JM Floater Short Term Fund 10872 8.72 10764 7.64 10512 5.12 18053 6.40 25-June-03
Bench Mark Crisil Liquid Fund Index 10854 8.54 10817 8.17 10512 5.12 17778 6.23Crisil 1 Year T Bill* 10811 8.11 10645 6.45 10281 2.81 16347 5.29

11
Details as on February 28, 2013
to the bonus units allotted. However, the total value of units held by the investor on the record date would remain the same.
jM Money Manager FundFinancial
year PlanDividend
FyTD*(` per unit)
FY 2012-13$ Regular Plan - Daily Dividend option 0.8426Regular Plan (Direct)-Daily Dividend option 0.1426Regular Plan - Weekly Dividend option 0.8519Regular Plan (Direct) Weekly Dividend option 0.0585Regular Plan - Fortnightly Dividend option 0.8594Regular Plan (Direct)-Fortnightly Dividend option
0.1156
Super Plan - Daily Dividend option 0.8640Super Plan (Direct)-Daily Dividend option 0.1338Super Plan - Weekly Dividend option 0.8473Super Plan (Direct) Weekly Dividend option 0.0577Super Plan - Fortnightly Dividend option 0.8591Super Plan (Direct) Fortnightly Dividend option 0.0564Super Plus Plan - Daily Dividend option 0.8501Super Plus Plan (Direct)-Daily Dividend option 0.1355Super Plus Plan - Weekly Dividend option 0.8393Super Plus Plan (Direct) Weekly Dividend option 0.0555Super Plus Plan - Fortnightly Dividend option 0.8535Super Plus Plan (Direct)-Fortnightly Dividend option
0.1203
FY 2011-12$ Regular Plan - Daily Dividend option 0.9680Regular Plan - Weekly Dividend option 0.8560Regular Plan - Fortnightly Dividend option 0.9048Super Plan - Daily Dividend option 0.9545Super Plan - Weekly Dividend option 0.8455Super Plan - Fortnightly Dividend option 0.8965Super Plus Plan - Daily Dividend option 0.9240Super Plus Plan - Weekly Dividend option 0.8190Super Plus Plan - Fortnightly Dividend option 0.8730
FY 2010-11$ Regular Plan - Daily Dividend option 0.6856Regular Plan - Weekly Dividend option 0.6038Regular Plan - Fortnightly Dividend option 0.6383Super Plan - Daily Dividend option 0.7006Super Plan - Weekly Dividend option 0.6158Super Plan - Fortnightly Dividend option 0.6573Super Plus Plan - Daily Dividend option 0.6251Super Plus Plan - Weekly Dividend option 0.5509Super Plus Plan - Fortnightly Dividend option 0.5877
After payment of dividend, the NAV falls to the extent of payout and distribution taxes wherever applicable. Past performance may or may not be sustained in future. The face value per unit is `10/-. $ Includes Dividend Distribution Tax.
jM Floater long Term Fund (w.e.f. December 28, 2012, the Scheme name has been changed to JM Floater Long Term Fund)
Financial year Plan Dividend FyTD*(` per unit)
FY 2012-13$ Dividend option -Daily Dividend option 0.6718(Direct) Daily Dividend option 0.0568Weekly Dividend option 0.6589(Direct) Weekly Dividend option 0.0488Premium Plan - Dividend option 0.6997Premium Plan - Weekly Dividend option 0.6700Premium Plan - Daily Dividend Option 0.6800
FY 2011-12$ Regular Plan - Dividend option -Regular Plan - Daily Dividend option 0.8030Regular Plan - Weekly Dividend option 0.7154Premium Plan - Dividend option 0.7804Premium Plan - Weekly Dividend option 0.7262Premium Plan - Daily Dividend Option 0.8130
FY 2010-11$ Regular Plan - Dividend option -Regular Plan - Daily Dividend option 0.5950Regular Plan - Weekly Dividend option 0.5182Premium Plan - Dividend option 0.5665Premium Plan - Weekly Dividend option 0.5284Premium Plan - Daily Dividend Option 0.6052
After payment of dividend, the NAV falls to the extent of payout and distribution taxes wherever applicable. Past performance may or may not be sustained in future.
jM Equity FundFinancial year record Date Dividend (` per unit)FY 2012-13 NIL -FY 2011-12 NIL -FY 2010-11 NIL -
After payment of dividend, the NAV falls to the extent of payout and distribution taxes wherever applicable. Past performance may or may not be sustained in future. The face value per unit is ` 10/-.
jM basic FundFinancial year record Date Dividend (` per unit)FY 2012-13 NIL -FY 2011-12 NIL -FY 2010-11 NIL -
After payment of dividend, the NAV falls to the extent of payout and distribution taxes wherever applicable. Past performance may or may not be sustained in future. The face value per unit is ` 10/-
jM balanced FundFinancial year record Date Dividend (` per unit)DividendFY 2012-13 NIL -FY 2011-12 NIL -FY 2010-11 NIL -
After payment of dividend, the NAV falls to the extent of payout and distribution taxes wherever applicable. Past performance may or may not be sustained in future. The face value per unit is `10/-.
jM Multi Strategy FundFinancial year record Date Dividend (` per unit)DividendFY 2012-13 NIL -FY 2011-12 NIL -FY 2010-11 NIL -
After payment of dividend, the NAV falls to the extent of payout and distribution taxes wherever applicable. Past performance may or may not be sustained in future. The face value per unit is ` 10/-.
jM Tax gain FundFinancial year record Date Dividend (` per unit)DividendFY 2012-13 NIL -FY 2011-12 NIL -FY 2010-11 NIL -
After payment of dividend, the NAV falls to the extent of payout and distribution taxes wherever applicable. Past performance may or may not be sustained in future. The face value per unit is ` 10/-.
jM core 11 FundFinancial year record Date Dividend (` per unit)DividendFY 2012-13 NIL -FY 2011-12 NIL -FY 2010-11 NIL -
After payment of dividend, the NAV falls to the extent of payout and distribution taxes wherever applicable. Past performance may or may not be sustained in future. The face value per unit is ` 10/-.
jM MiP FundjM MiP Fund - Dividend option - Monthly Dividend
Financial year record Date Dividend (` per unit)FY 2012-13 $ 1-Feb-13 0.0500
1-Jan-13 0.05003-Dec-12 0.05001-Nov-12 0.05001-Oct-12 0.05003-Sep-12 0.05001-Aug-12 0.05003-Jul-12 0.05001-Jun-12 0.05002-May-12 0.05003-Apr-12 0.0500
FY 2011-12 $ 1-Mar-12 0.05001-Feb-12 0.0500
Jan-12 NIL1-Dec-11 0.05001-Nov-11 0.0500
Oct-11 NIL2-Sep-11 0.0500Aug-11 NIL4-Jul-11 0.04001-Jun-11 0.0500
DIVIDEND/BoNUS HISToRy (for past 3 years)2-May-11 0.05005-Apr-11 0.0500
FY 2010-11 $ March - 11 NILFeb - 11 NILJan - 11 NIL
1-Dec-10 0.05001-Nov-10 0.05001-Oct-10 0.05001-Sep-10 0.05002-Aug-10 0.05002-Jul-10 0.05001-Jun-10 0.05003-May-10 0.05005-Apr-10 0.0500
jM MiP Fund - Dividend option - Quarterly DividendFinancial year record Date Dividend (` per unit)
FY 2012-13 $ - -FY 2011-12 $ - -FY 2010-11 $ - -
jM MiP Fund - Dividend option - Annual DividendFinancial year record Date Dividend (` per unit)
FY 2012-13$ NIL -FY 2011-12$ NIL -FY 2010-11$ NIL -
After payment of dividend, the NAV falls to the extent of payout and distribution taxes wherever applicable. Past performance may or may not be sustained in future. The face value per unit is ` 10/-.$ Includes Dividend Distribution Tax.
jM Arbitrage Advantage FundFinancial year record Date Dividend (` per unit)DividendFY 2012-13 7-Jan-13 0.250
24-Sep-12 0.22527-Jun-12 0.20
FY 2011-12 21-Mar-12 0.20021-Dec-11 0.16021-Sep-11 0.16024-Jun-11 0.175
FY 2010-11 16-Mar-11 0.17527-Dec-10 0.17521-Sep-10 0.1216-Jun-10 0.08
After payment of dividend, the NAV falls to the extent of payout and distribution taxes wherever applicable. Past performance may or may not be sustained in future. The face value per unit is `10/-
jM High liquidity FundFinancial
year Plan Dividend FyTD*(` per unit)
FY 2012-13$ Weekly Dividend Option 0.8380(Direct)-Weekly Dividend Option 0.1410Daily Dividend Option 0.8486(Direct)-Daily Dividend Option 0.1434Quarterly Dividend Option -Inst. Plan - Weekly Dividend option 0.8242Inst. Plan - Daily Dividend option 0.8171Super Inst. Plan - Weekly Div. option 0.7823Super Inst. Plan - Daily Div. option 0.8251
FY 2011-12$ Regular Plan - Weekly Dividend Option 0.8290Regular Plan - Daily Dividend Option 0.9338Regular Plan - Quarterly Dividend Option -Inst. Plan - Weekly Dividend option 0.8161Inst. Plan - Daily Dividend option 0.9039Super Inst. Plan - Weekly Div. option 0.5613Super Inst. Plan - Daily Div. option 0.9116
FY 2010-11$ Regular Plan - Weekly Dividend Option 0.5849Regular Plan - Daily Dividend Option 0.6665Regular Plan - Quarterly Dividend Option -Inst. Plan - Weekly Dividend option 0.5713Inst. Plan - Daily Dividend option 0.6403Super Inst. Plan - Weekly Div. option 0.2032Super Inst. Plan - Daily Div. option 0.6400
*bonus option : 64 : 100 on 14/01/2013
After payment of dividend, the NAV falls to the extent of payout and distribution taxes wherever applicable. Past performance may or may not be sustained in future. The face value per unit is `10/-. $ Includes Dividend Distribution Tax
* Pursuant to allotment of units, the NAV of the Scheme/Option falls in proportion

JM EQUITy SCHEMES aT a GLaNCE
Introduction of no Entry Load and treatment of Exit Load.In accordance with the requirements specified by the SEBI circular no. SEBI/IMD/CIR No.4/168230/09 dated June 30, 2009, no entry load will be charged for fresh purchase / additional purchase / switch-in transactions accepted by the Fund with effect from August 1, 2009. Similarly, no entry load will be charged with respect to applications for fresh registrations under Systematic Investment Plan/Systematic Transfer Plan accepted by the Fund with effect from August 1, 2009.Also, in compliance with SEBI Circular no. SEBI / IMD / CIR No. 7 /173650 / 2009 dated August 17, 2009, parity among all classes of unit holders in terms of charging exit load shall be made applicable at the portfolio level with effect from August 24, 2009.
Load Structure:
Entry Load: NIL for all Open-ended Equity Schemes.
Exit Load: As mentioned in the table hereunder:Minimum criteria for Investment & RedemptionPurchase : ` 5000/- for normal transactions other than through SIP/STP in all schemes. `500/- or in multiples of `500/- each in JM Tax Gain Fund.Additional Purchase : ` 1,000/- or any amount thereafter in all schemes except JM Tax Gain Fund.Repurchase : Minimum redemption from existing Unit Accounts for normal transactions other than through STP/SWP would bea) ` 500 and any amount thereafter ORb) 50 units or any number of units there after subject to keeping a minimum balance of 500 units or ` 5000/- whichever is less.c) for all the units in the folio for the respective plan if the available balance is less than ` 500/- or less than 50 units on the day of submission of valid redemption
request.
Reckoner and Default optionsIn case an investor fails to specify his preference of Options/Sub-Options, in the below mentioned schemes, the default Options/ Sub-Options would be as under :
EQUITy SCHEMES
Currently available facilitiesSr. no.
Schemes Allotment Date
Plan Options Sub Options Default Option
Default Sub Option
Exit Load @@@
Lock-in Peri-ods @@@
Redemption Time#
1 JM - Arbitrage Advantage Fund
July 18, 2006
Dividend Payout / Reinvestment Growth Reinvestment
0.50% 30 Days T+3 (*) Business Days
Growth
(Direct)Dividend Payout /
Reinvestment Growth ReinvestmentGrowth
2 JM Balanced Fund April 1, 1995
Dividend Payout / Reinvestment Growth Reinvestment
1.00% 365 Days T+3 Business Days
Growth
(Direct)Dividend Payout /
Reinvestment Growth ReinvestmentGrowth
3 JM Basic Fund June 2, 1997
Dividend Payout / Reinvestment Growth Reinvestment
1.00% 365 Days T+3 Business Days
Growth
(Direct)Dividend Payout /
Reinvestment Growth ReinvestmentGrowth
4 JM Core 11 Fund March 5, 2008
Dividend Payout / Reinvestment Growth Reinvestment
1.00% 365 Days T+3 Business Days
Growth
(Direct)Dividend Payout /
Reinvestment Growth ReinvestmentGrowth
The face value per unit is `10/-. $ Includes Dividend Distribution Tax.
jM Floater Short Term Fund (w.e.f. December 28, 2012, the Scheme name has been changed to JM Floater Short Term Fund)
Financial year Plan
Dividend FyTD*
(` per unit)FY 2012-13$ Daily Dividend Option 0.7472
(Direct ) Daily Dividend Option 0.0613FY 2011-12$ Daily Dividend Option 0.7877FY 2010-11$ Daily Dividend Option 0.5733
After payment of dividend, the NAV falls to the extent of payout and distribution taxes wherever applicable. Past performance may or may not be sustained in future. The face value per unit is `10/-. $ Includes Dividend Distribution Tax
jM Short Term FundFinancial year Plan Dividend FyTD*
(` per unit)FY 2012-13$ Regular - Dividend Option 0.9545
Regular - Daily Dividend Option 0.8160Dividend Option 0.8898(Direct)-Dividend Option 0.1049Daily Dividend Option 0.8318(Direct)-Daily Dividend Option 0.1284
FY 2011-12$ Regular Plan - Dividend Option 0.9954Inst. Plan - Dividend Option 0.9295Regular Plan - Daily Dividend Option 0.9314Inst. Plan - Daily Dividend Option 0.9401
FY 2010-11$ Regular Plan - Dividend Option 0.6807Inst. Plan - Dividend Option 0.6516
After payment of dividend, the NAV falls to the extent of payout and distribution taxes wherever applicable. Past performance may or may not be sustained in future. The face value per unit is ` 10/-. $ Includes Dividend Distribution Tax.
jM income FundQuarterly Dividend Option (` per unit)
FY 2012-13$ -
FY 2011-12$ -FY 2010-11$ -
After payment of dividend, the NAV falls to the extent of payout and distribution taxes wherever applicable. Past performance may or may not be sustained in future. The face value per unit is `10/-. $ Includes Dividend Distribution Tax.
jM g-Sec FundQuarterly Dividend Option (` per unit)
FY 2012-13$ -FY 2011-12$ -FY 2010-11$ 0.25
After payment of dividend, the NAV falls to the extent of payout and distribution taxes wherever applicable. Past performance may or may not be sustained in future. The face value per unit is `10/-. $ Includes Dividend Distribution Tax.*FyTD: Financial year to Date

5 JM Equity Fund April 1,1995
Dividend Payout / Reinvestment Growth Reinvestment
1.00% 365 Days T+3 Business Days
Growth
(Direct)Dividend Payout /
Reinvestment Growth ReinvestmentGrowth
6 JM Multi Strategy Fund
September 23, 2008
Dividend Payout / Reinvestment Growth Reinvestment
1.00% 365 Days T+3 Business Days
Growth
(Direct)Dividend Payout /
Reinvestment Growth ReinvestmentGrowth
7 JM Tax Gain Fund March 31,2008
Dividend PayoutGrowth
Payout NIL && T+3 Business Days
Growth
(Direct)Dividend Payout
GrowthGrowth
&& JM Tax Gain Fund :- The scheme falls in the ELSS category and is eligible for tax benefits under section 80C of Income Tax Act. There is a lock-in period of 3 years under the Scheme.# AMC would adhere to the aforesaid service standards for redemption payments on best efforts basis under normal circumstances subject to the overall 10 business days as stipulated by SEBI.*JM - arbitrage advantage Fund: The redemption shall be in terms of Interval Period defined hereinbelow.
Redemption request can be submitted to the official point of acceptance on any business day till 3.00 pm. All redemption requests received till Friday (in case such Friday is a holiday then the last business day) of the week preceding the interval period, would be processed at the NAV of the Interval Period. The Interval period will be the settlement Thursday (the settlement day for derivatives segment in the NSE which is currently last Thursday of the month) or any day which is declared as the settlement day for Derivatives segment by the NSE.
Illustrative Example: Interval Cycle Cut-off for for redemption / switch-out requests applicable NaV for redemption / switch-outFor Nov-Dec 2010 All redemptions / switch-out requests received till 24.12.2010 before 3 p.m. NAV of 30.12.2010 For Dec - Jan 2011 All redemptions / switch-out requests received after 3 p.m. on 24.12.2010 till 3.00 pm 21.01.2011 NAV of 27.01.2011
It is clarified that the cut-off timings will also be applicable to investments made through “sweepmode”.
@@@ The exit load shown in the above table are applicable for allotment of units for investment made through fresh purchases/switch-in/shift-in or through respective SIP/STP/SWP Instalments out of the fresh registration effected during the period when above exit load rates are applicable. The exit load are subject to change at any time. Hence, all Investors are advised to check the current exit load from the nearest Investor Service Centers before investment.
Load structure :
a) Exit load on intra-scheme redemptions/switch outs :
No exit load shall be charged for any switch of investments between Existing Plan (whether the investments were made before or after the Effective Date i.e. 01.01.2013) and Direct Plan within the same scheme (within the same Portfolio). The same procedure will be applicable for switches between various options of Existing Plan and/or Direct Plan (at Portfolio Level).
The applicable exit load, if any, will be charged for redemptions/ switch outs of the scheme (i.e. at portfolio level) before the completion of the stipulated load/ lock-in period. The stipulated load/ lock-in period will be reckoned from the date of allotment of units for a particular transaction in the scheme (i.e. at portfolio level) till the date of redemption / switch out from that scheme (at Portfolio Level), irrespective of the number of intra-scheme switches by the investor between the aforementioned two dates (e.g. switches between plans/sub-plans/options/sub-options within the scheme having the same portfolio). The extant provisions of applicability of load on redemptions/ switches from one Scheme to another will continue to be applicable.
However, Government levies e.g. STT (wherever applicable) will continue to be deducted for every intra-scheme and inter-scheme switch-out/redemption transactions.
B) In case of Intra & Inter equity switches: (including SIP/STP):
No exit load for inter and intra equity switches except in case of (i) switches by SIP/STP investors within 24 months (for cases registered from 4.1.2008 up to 2.10.2008) and within 12 months (for cases registered upto 3.1.2008) of respective SIP/STP installments (ii) switches by STP investors (for cases registered w.e.f. 3.10.2008) within 24 months of respective STP installments (iii) switches by SIP investors (for cases registered w.e.f. 3.10.2008) within 12 months of respective SIP installments (iv) switches to / from JM Arbitrage Advantage Fund to any equity schemes.
However, Government levies eg. STT (wherever applicable) will continue to be deducted for every intra-scheme and inter-scheme switch-out/redemption transactions.
The above details are subject to provisions laid down in the respective Scheme Information Documents and addenda issued from time to time.

JM DEBT SCHEMES aT a GLaNCELoad Structure:
Entry Load: NIL for all Open-ended Debt & Liquid Schemes.
Exit Load: As mentioned in the table hereunder:
Minimum Investment amount: ` 5000/- and any amount thereafter.
additional Purchase amount:: ` 1000/- and any amount thereafter.
Reckoner and Default options:
DEBT SCHEMES
Plan(s) / option(s) available for fresh subscription
Sr. no. Schemes
Default
Plans options Sub options Default Plan Default option Default Sub option
Exit load @@@
lock-in Peri-ods @@@ redemption Time#
1 JM Floater Short Term Fund
Daily Dividend Reinvestment - Daily Dividend Reinvestment
NIL NIL T+1 Business DayGrowth
(Direct)Daily Dividend Reinvestment - Daily Dividend Reinvestment
Growth
2 JM Floater Long Term Fund
Daily Dividend Reinvestment
Daily Dividend Reinvestment
NIL NIL T+1 Business Day
Weekly Dividend
Dividend Reinvestment / Payout*
Growth
(Direct)
Daily Dividend Reinvestment
Daily Dividend ReinvestmentWeekly Dividend
Dividend Reinvestment / Payout*
Growth
3 JM G Sec Fund
Quarterly Dividend
Payout* / Reinvestment
- Growth Reinvestment
NIL NIL T+1 Business Day
Growth
Bonus Principal units
(Direct)
Quarterly Dividend
Payout* / Reinvestment
- Growth ReinvestmentGrowth
Bonus Principal units
4 JM High Liquidity Fund
Daily Dividend Reinvestment
Daily Dividend Reinvestment
NIL NIL T+1 Business Day
Weekly Dividend Reinvestment / Payout*
Quarterly Dividend
Payout* / Reinvestment
Growth
Bonus Principal units
(Direct)
Daily Dividend Reinvestment
Daily Dividend Reinvestment
Weekly Dividend Reinvestment / Payout*
Quarterly Dividend
Payout* / Reinvestment
Growth
Bonus Principal units
5 JM Income Fund
-
Quarterly Dividend
Payout* / Reinvestment
Growth Dividend Reinvestment
1.00% 365 Days T+1 Business Day
Growth
Bonus Principal units
(Direct)
Quarterly Dividend
Payout* / Reinvestment
Growth Dividend ReinvestmentGrowth
Bonus Principal units

Plan(s) / option(s) available for fresh subscription
Sr. no. Schemes
Default
Plans options Sub options Default Plan Default option Default Sub option
Exit load @@@
lock-in Peri-ods @@@ redemption Time#
6 JM MIP Fund
-
Dividend-Monthly Dividend
Payout* / Reinvestment - Monthly
Dividend Payout*
0.50% 182 Days T+2 Business Day
Dividend-Quarterly Dividend
Dividend-Annual Dividend
Growth
(Direct)
Dividend-Monthly Dividend
Payout* / Reinvestment Monthly
Dividend Payout*
Dividend-Quarterly Dividend
Dividend-Annual Dividend
Growth
7 JM Money Manager Fund
Regular
Daily Dividend
Reinvestment
Super Plus Daily Dividend Reinvestment
0.25% 45 Days
T+1 Business Day
Weekly Dividend
Fortnightly Dividend
Growth
(Direct)
Daily Dividend
Reinvestment
Weekly Dividend
Fortnightly Dividend
Growth
Super
Daily Dividend
Reinvestment
0.10% 30 Days
Weekly Dividend
Fortnightly Dividend
Growth
(Direct)
Daily Dividend
Reinvestment
Weekly Dividend
Fortnightly Dividend
Growth
Super Plus
Daily Dividend
Reinvestment
NIL NIL
Weekly Dividend
Fortnightly Dividend
Growth
(Direct)
Daily Dividend
Reinvestment
Weekly Dividend
Fortnightly Dividend
Growth

Plan(s) / option(s) available for fresh subscription
Sr. no. Schemes
Default
Plans options Sub options Default Plan Default option Default Sub option
Exit load @@@
lock-in Peri-ods @@@ redemption Time#
8 JM Short Term Fund
Daily Dividend Reinvestment
Growth Dividend Reinvestment 0.25% 30 Days T+1
Business Days
Dividend Payout* / Reinvestment
Growth
(Direct)
Daily Dividend Reinvestment
Dividend Payout* / Reinvestment
Growth
# AMC would adhere to the aforesaid service standards for redemption payments on best efforts basis under normal circumstances subject to the overall 10 business days as stipulated by SEBI.
@@@ The exit load shown in the above table are applicable for allotment of units for investment made through fresh purchases/switch-in/shift-in or through respective SIP/STP/SWP Instalments out of the fresh registration effected during the period when above exit load rates are applicable. The exit load are subject to change at any time. Hence, all Investors are advised to check the current exit load from the nearest Investor Service Centers before investment.
In case, the investor does not mention the name of the Plan/ Option/ Sub-option/or wherever there is an ambiguity in choice of Plan/ Option/ Sub-option opted for purchase/ switch application(s), the AMC/ Registrar may allot the units as per default Plans/ Options/ Sub-options, if no clarification letter is provided by the investor on the transaction date. However, in case of fresh purchase application, the AMC/ Registrar at its discretion may allot the units based on the Plan/ Option/ Sub-option appearing on the respective payment instrument.
In case, there is complete ambiguity regarding the Plans/ Options/ Sub-options, the application will be treated as invalid and will be summarily rejected.
In case of purchase transactions, where there is a mismatch in the amounts on the Transaction Slip / Application Form and the payment instrument / credit received, the AMC may at its discretion allot the units for the lesser of the two amounts and refund / utilize the excess, if any, for any other transaction submitted by the same investor, subject to the fulfillment of other regulatory requirements for the fresh transaction.
INTRoDUCTIoN oF DIRECT PLaN FoR INVESTING DIRECTLy WITH THE MUTUaL FUND (aPPLICaTIoNS NoT RoUTED THRoUGH DISTRIBUToRS) (w.e.f. Jan 1, 2013)
Investors subscribing under Direct Plan of a Scheme will have to indicate “Direct Plan” against the Scheme name in the application form/ transaction slip e.g. “JM Equity Fund (Direct)”.
Investors may also indicate “Direct” in the ARN column of the application form/ transaction slip. However, in case Distributor/ Sub-broker code/ Employee UIN is mentioned in the application form, but “Direct Plan” is indicated against the Scheme name or in any other place or in any manner whatsoever in the Application Form/ transaction slip, the Distributor/ Sub-broker code/ Employee UIN will be ignored and the application will be processed under Direct Plan.
Further, where application is received for Existing Plan without Distributor code or “Direct” is mentioned in the ARN Column, the application will be processed under the Direct Plan.
Note: Dividend/Bonus shall be declared at the discretion of the Trustee subject to the availability of distributable surplus as compiled in accordance with SEBI (Mutual Funds) Regulations, 1996.
*No dividend under Dividend Plan shall be distributed in cash even for those unitholders who have opted for payout where such dividend on a single payout is less than `100/-.
Consequently, such dividend (less than `100/-) shall be compulsorily re-invested except under JM Tax Gain Fund as there is no dividend reinvestment option under the scheme.
As per SEBI Circular no. CIR/IMD/DF/21/2012 dated September 13, 2012, with effect from October 1, 2012, fresh subscriptions (including SIPs/Switches) shall be accepted under only one plan of JM High Liquidity Fund, JM Floater Long Term Fund and JM Short Term Fund (herein referred as surviving plan) and not in any other plans (suspended plans). Any subscriptions received under the suspended plans of the aforesaid schemes, will be processed under their surviving plans.
Further, w.e.f. December 28, 2012, the fresh subscription under JM MIP Fund - Growth Option - Capital Appreciation Withdrawal & JM MIP Fund - Growth Option - Fixed Amount Withdrawal has been suspended till further notice.

The suspended plans as mentioned in the below table will continue till the existing investors remain invested in the plans.
Plan(s) / option(s) not available for fresh subscription
Sr. no. Type of Scheme Schemes Plans options Suspended w.e.f Minimum investment amount
1 Liquid JM High Liquidity Fund
Institutional PlanDaily Dividend
October 1, 2012
` 1,00,00,000/-Weekly DividendGrowth
Super Institutional Plan
Daily Dividend` 5,00,00,000/-Weekly Dividend
Growth
2
Debt
JM Short Term Fund Regular PlanDividend
` 5000/-Daily DividendGrowth
3JM Floater Long Term Fund (Earlier known as JM Floater Fund - Long Term Plan)
Premium Plan
Daily Dividend
` 5000/-Weekly Dividend
Dividend
Growth
4 JM MIP Fund Growth
Capital Appreciation Withdrawal
December 28, 2012 ` 5000/-Fixed Amount
Withdrawal
The cases registered for Systematic Investment Plans (SIPs), Systematic Transfer Plans (STPs), Dividend Reinvestment Facilities prior to October 1, 2012 in the Suspended Plan will be processed if their due dates are falling upto October 31, 2012. From November 1, 2012, all Systematic Investment Plans (SIPs), Systematic Transfer Plans (STPs), Dividend Reinvestment Facilities of the Suspended Plans will automatically stand discontinued. However, the investor may opt for investment in Surviving Plan or any other scheme of JM Financial Mutual Fund by registering for fresh SIPs/STPs/ Dividend Reinvestment.
With respect to the re-investment of dividend, effective from November 01, 2012:
1. Dividend accrued (if any) under any Dividend Option (Dividend Re-investment being its sub – option) of the suspended plans are being re-invested in the corresponding options under the surviving plans of the respective Schemes, if such dividend per folio, per occasion is upto Rs. 2000/-. In such scenario, the same folio number will have units in two plans, i.e. units created till October 31, 2012 in suspended plans and units created from November 01, 2012 in the surviving plans. Investors are requested to mention the specific plan/option while submitting any transaction requests.
In case, such dividend is more than Rs. 2000/- per folio, per occasion, the same is being considered for dividend payout.
2. Kindly note that for the above re-investment of dividend in surviving plans, the minimum investment amount criteria/lock – in period/load structure applicable for purchases/switch – in under the surviving plans is not applicable. However, the minimum redemption amount/units criteria under the surviving plans is applicable.
All investors are requested to note that the following schemes are being renamed as under:
Sr. No. Existing Name Revised Name
1 JM High Liquidity Fund – Regular Plan JM High Liquidity Fund
2 JM Floater Fund – Long Term Plan JM Floater Long Term Fund
3 JM Short Term Fund – Institutional Plan JM Short Term Fund
4 JM Floater Fund - Short Term Plan JM Floater Short Term Fund
5 JM G-Sec Fund - Regular Plan JM G-Sec Fund
All other terms and conditions of the aforesaid schemes remain unchanged.

NOTICE DATED fEbRuARy 27, 2013 (Ref No. 27/2012-13)
Notice is hereby given that in accordance with the SEBI Circular No. CIR/IMD/DF/21/2012 dated September 13, 2012 and AMFI Circular No. 135/BP/33/2012-13 dated December 31, 2012, all the Asset Management Companies / Mutual Funds are directed to capture the Employee Unique Identification Number (EUIN) i.e. unique identity number of the employee/relationship manager/sales person of the distributor (Sales Person) who interacts with the investors for the purpose of selling the mutual fund products, in addition to the AMFI Registration Number (ARN) of the distributor.
In accordance with the aforesaid circulars, in case transactions are routed through the distributor, investors are requested to mention the valid ARN code, Sub – Broker code and the EUIN on the transaction slip(s)/application form(s). Investors are requested to note that JM Financial Asset Management Private Limited (the “AMC”) has made the necessary provisions in the transaction slip(s)/application form(s) i.e. separate spaces for Sub – Broker ARN Code and EUIN, in addition to the Distributor ARN code, have been provided.
In case the EUIN space is left blank, investors are requested to confirm that it is an “execution – only” transaction.
All the investors are requested to use the updated transaction slip(s)/applications forms(s).
NOTICE Cum ADDENDum DATED mARCh 3, 2013 (Ref No. 28/2012-13)
ThIS NOTICE - Cum - ADDENDum SETS OuT ThE ChANGES TO bE mADE IN ThE COmbINED SChEmE INfORmATION DOCumENT (“SID”) AND COmbINED KEy INfORmATION mEmORANDum (“KIm”) Of ALL ThE NON LIQuID SChEmES (EQuITy, DEbT ETC) Of Jm fINANCIAL muTuAL fuND (ThE “muTuAL fuND”)
SEBI vide its Circular No. CIR/IMD/DF/21/2012 dated September 13, 2012 had brought in uniformity in the applicability of Net Asset Value (NAV) among all the schemes of the Mutual Fund. Association of Mutual Funds in India (AMFI) vide its Circular No. 135/BP/35/2012-13 dated February 18, 2013 has prescribed Best Practice Guidelines for aggregating the split transactions and recommended a uniform process to be followed for NAV applicability.
Accordingly, w.e.f. March 4, 2013, all transactions, as per the conditions given below, will be aggregated and closing NAV of the day on which funds are available for utilization will be applied, provided the aggregated amount of the investment is Rs. 2 lacs and above.
a. All transactions are received on the same business day (as per cut off timing and time stamping rules). Transactions received after the cut-off timing will be deemed to have been received on the next business day and aggregated accordingly.
b. Aggregation of transactions shall be applicable for all open ended non liquid schemes of the Mutual Fund as set out above.
c. Transactions shall include purchases, additional purchases, but will exclude Switches, Systematic Investment Plan (SIP)/ Systematic Transfer Plan (STP) transactions.
d. Aggregations will be done on the basis of investor/s PAN. In case of joint holding, transactions with similar holding structures will be aggregated, similar to the principle applied for compilation of Consolidated Account Statement (CAS).
e. All transactions will be aggregated where investor holding pattern is same as stated above, irrespective of whether the amount of the individual transaction is above or below Rs 2 lacs.
f. Only transactions in the same scheme (at portfolio level) will be clubbed. This will include transactions at option level (Dividend, Growth and Direct).
g. Transactions in the name of minor received through guardian will not be aggregated with the transaction in the name of same guardian.
This notice – cum – addendum shall form an integral part of the SID and KIM of the above mentioned schemes of the Mutual Fund. All other terms and conditions of the SID and KIM remain unchanged.
noTicE / ADDEnDUM