
FROM QUALITY TO SERVICE TO SUCCESS - … Pharma MNE Wholesale ... Separate strategy-driven...
42
FROM QUALITY TO SERVICE TO SUCCESS Belgrade, 31/03/2014
-
Upload
vuongkhanh -
Category
Documents
-
view
214 -
download
2
Transcript of FROM QUALITY TO SERVICE TO SUCCESS - … Pharma MNE Wholesale ... Separate strategy-driven...

FROM QUALITY TO SERVICE TO SUCCESS
Belgrade, 31/03/2014

Agenda
1. Outline of the PHOENIX Group
2. PHOENIX Group in the Balkans
3. What makes a successful company ?
4. The invisible Edge : innovation
5. The invisible Edge: cost efficiency
6. The invisible Edge: winning business model
7. What does a business leader do?
2

1. OUTLINE OF THE PHOENIX
GROUP

PHOENIX Group at a glance
4
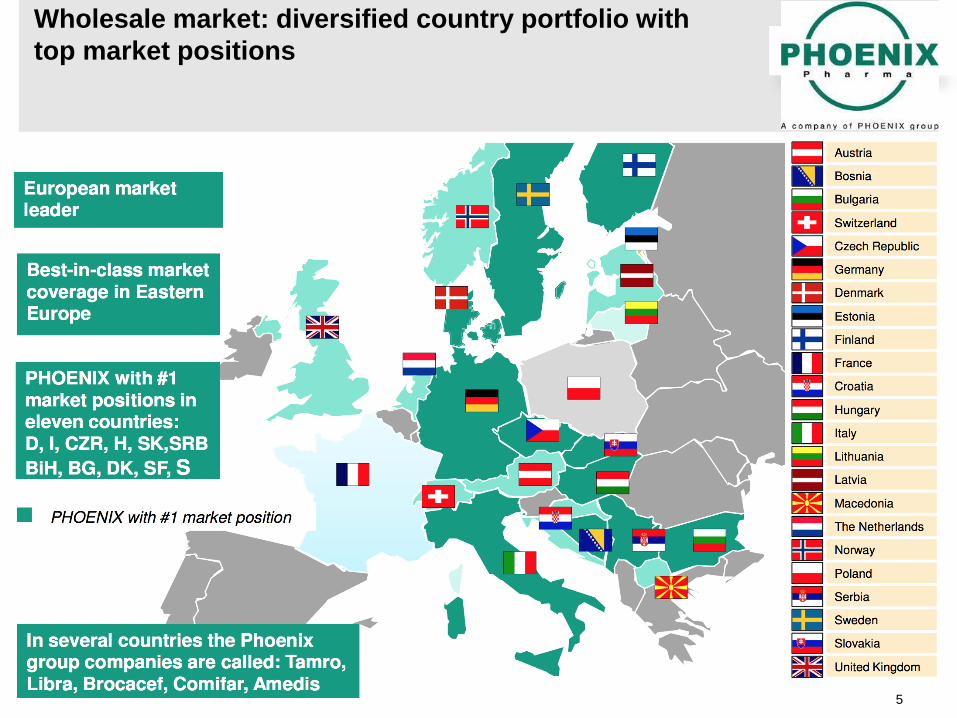
Wholesale market: diversified country portfolio with
top market positions
5
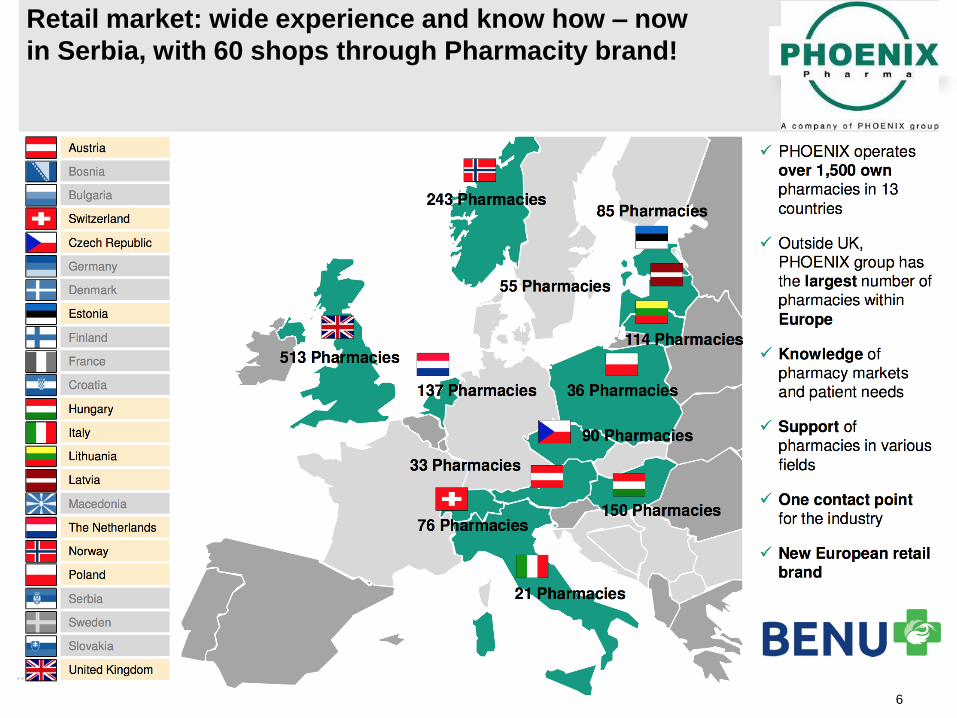
Retail market: wide experience and know how – now
in Serbia, with 60 shops through Pharmacity brand!
6

2. PHOENIX GROUP IN THE
BALKANS

Balkan group corporate development timeline - From Wholesale regional leader to Pharma services regional
leader to starting our retail operations
2014
Retail
Serbia
transmed
Balkan
region
2008 2009 2010 2011 2012
Acquisition
PHOENIX
Serbia
Acquisition
Evropa Lek
Serbia
Acquisition
PHOENIX
Macedonia and
Libra Serbia
Acquisition
PHOENIX
Bosnia
Open
Evropa Lek
Bosnia &
Macedonia
Open
Evropa Lek
Kosovo and
Montenegro
Acquisition
InoPharm
Merger
Bomil
Farm
subsidiary
Wholesale
carve out
Evropa Lek
Asset
acquisition
Zdravlje
Trade
Merger
Libra
Serbia to
Evropa Lek
Trf Macedonia
from Serbia to
PHOENIX Pib
Austria
transmed
Serbia
2013
Open
Evropa Lek
Albania
Merge Bulgarian
activities to
become Balkan
group
8

PHOENIX Pharma MAC
PHOENIX Beteiligung
PHOENIX Pharma BG
Libra pharma
PHOENIX PiB Austria
PHOENIX Pharma BiH PHOENIX Pharma SRB BENU
EL Pharma BiH
EL Pharma ALB
EL Pharma KOS
EL Pharma MAC
EL Pharma SRB
EL Pharma MNE
Wholesale
Pharma services Retail
Balkan group corporate structure
- Thirteen companies managed through three holding companies
9
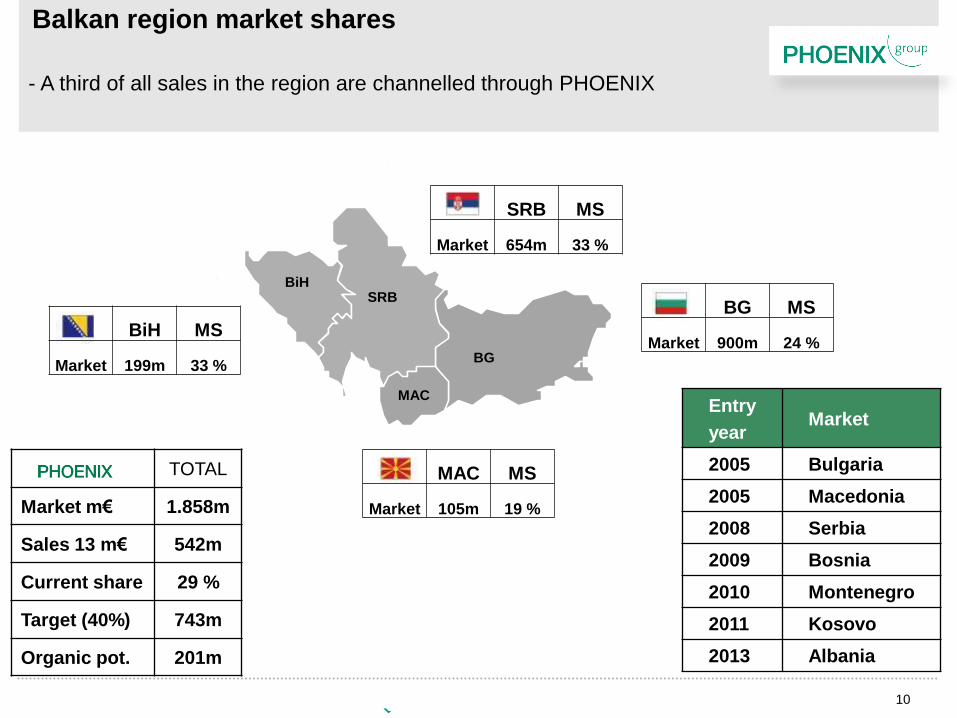
Balkan region market shares
BiH SRB
BG
MAC
TOTAL
Market m€ 1.858m
Sales 13 m€ 542m
Current share 29 %
Target (40%) 743m
Organic pot. 201m
- A third of all sales in the region are channelled through PHOENIX
Entry
year Market
2005 Bulgaria
2005 Macedonia
2008 Serbia
2009 Bosnia
2010 Montenegro
2011 Kosovo
2013 Albania
BiH MS
Market 199m 33 %
SRB MS
Market 654m 33 %
MAC MS
Market 105m 19 %
BG MS
Market 900m 24 %
10

Creating Sustainable profitable growth
MAT Net sales development
11

3. WHAT MAKES A
SUCCESSFUL COMPANY ?

Increased penetration in sales
channels through regional focus
Remain the No1 market leader
Strategy Improving the quality of our
assortment through selective
partnerships with suppliers
Objective
Develop beyond supply to demand
services
Investment in the development of our
people and our processes
Keep your strategy simple and easy to communicate
13

STRATEGY: Increased penetration in sales channels - Sales channel strategic focus
2012 2013 2014
Grow aggressively Private
pharmacies State pharmacies
Private pharmacies
Grow selectively State pharmacies Private pharmacies
State pharmacies
Maintain
aggressively Hospitals
Maintain selectively Hospitals
Hospitals
Divest/ exit Wholesalers
Question mark
14

Brand Portfolio
Balkan Region
Wholesaler - Bosnia
- Macedonia
- Serbia
- Bulgaria (rebrand)
Loyalty program - Bosnia
- Serbia
- Macedonia
- Bulgaria
Retail - Serbia
Transport Services - Serbia
- Macedonia
- Bosnia
Pharma Services - Bosnia
- Macedonia
- Serbia
- Montenegro
- Kosovo
- Albania
- Bulgaria (Libra Pharma)
Develop a winning brand portfolio
- The Brand portfolio Balkan Region
PHABIS - Serbia
- Bulgaria
- Bosnia
- Macedonia
15

Develop long term plans
- Long-term planning - Development Graphs
16

4. THE INVISIBLE EDGE:
INNOVATION

Introducing a B to C marketing concept in order to
change the pharmacy market in the Balkan
BETTER PHARMACY
BETTER SERVICE
BETTER BUY
BETTER BUSINESS
BETTER HEALTHCARE
BETTER LIFE
SIMPLY BETTER…
18

Shaping markets takes dedication and planning - easy when it is your destiny…..
COVERAGE
IT SYSTEM and VISUAL IDENTITY
CATEGORY MANAGEMENT AND LOYALTY CARDS
LAYOUT AND PHARMACY INTERIOR
19

Changing the market will create long term rewards
- Loyalty of both consumers and customers….
from
to
20

Bolja komunikacija
Smanjenje troškova
Povećanje produktivnosti
Zaposleni
Upravnik
Vlasnik
Stvaramo lojalne kupce
EduPharma A K A D E M I J A
Know-how is key to affecting change
21

Changing our approach and collaboration with suppliers
PHOENIX
current position
Transactional Relational
Trading Field selling KAM/category Mngt ECR Partnership
Pricing & trade
terms
Generate volume Conditional rebates Enhance margin Direct product profitability
X
Collaboration Price negotiation only Ad-hoc Win-Lose Planned mutual benefit Open-book
X
Delivery Direct to consignee Direct import Consignment stock
Regional consignment
stock
X
Relationship Buyer/seller only
Buyer/seller & activity
planning (only)
Multi functional planning &
execution of activity
Multi-level and cross
functional management
X
Information
sharing
None/little Some shared research and
top line sales information
Limited EDI in transactions
and sales information only
Seamless EDI and EPOS
interfaces and shared
access
X
Business Planning No/little coordination
Separate strategy-driven
approaches
Jointly activity planning &
sharing of performance
analyses
Joint strategy, planning,
execution & measurement
full ECR scorecard
X
22

segment strategy Imp 1 (by Q113) Imp 2 (by Q313) Plan (by Q114)
Optimize
demand
Efficient use of market data New customer
classification Market analiysis
Efficient promotions (number and type for category
growth)
Promo planning system Efficient promotional
analysis
High innovation capacity
Efficient transaction every day (flow of info, goods,
money) TELEMARKETING TELEMARKETING TELEMARKETING
Tools to create customer loyalty BETTY BETTY BETTY
Efficient introductions Internet training Field force advance
Secure
Supply
High innovation capacity
Stable product quality every day Product category
analysis
Efficient assortment
analysis
Reduction of SKU’s per
category
Fast and accurate customer complaint handling Customer complaints
manage
Efficient assortment (right SKU’s for consumer
demand)
Out of stocks analysis
and reduction
SKU for efficient
promotions
Align strategy
Understanding and alignment with top 10 suppliers
Pricing strategy which stimulates good behavior Pricing strategy
Understanding and alignment with top 10
customers
Customer profitability
analysis
Customer training
platform
Enable the
team
Decision mapping to make business building
proposals
SharePoint platform
for data sharing
High market knowledge (customers, competitors) Stakeholder organ
mapping with platform
Financial analysis within
platform
Knowledge of best industry practices
Creating an innovation process…
….creativity and innovation momentum is achieved….
23

5. THE INVISIBLE EDGE: COST
EFFICIENCY

Productivity reporting
- Not a dirty word – the way winning economies measure performance
72,18
LE 76,53
62,08
BJ 69,71 69,77
SJ 73,28
71,70
SK 74,43
60,84
NS 62,40
72,16
BG 77,38
64,81
BIH 71,17
69,08
SRB 72,99
68,47
BMS Group 72,78
72,78
15
20
25
30
35
40
45
50
55
60
65
70
75
80
85
90
0 5.000 10.000 15.000 20.000 25.000 30.000 35.000 40.000
[lin
es
/ho
urs]
[lines / days]
25

Using tools to measure financial performance
- budgets...forecasts...variance analysis....
-938.812
-689.933
-361.798
-105.993
-34.269
-30.763
-77.854
BU 2014/15
Transport
Lease
Marketing
Other
F2 2013/14
YE 2012/13
Comments
Transport: transmed
effect (items below
EBITDA line transfered
to transport expenses)
Marketing: 57 MRSD
Betty effect
Lease: Leskovac
bulding effect (sold and
leased back)
Other: Fx
compensation from
suppliers not budgeted
26

Credit management as a core tool
- A sale is not a sale until it is cashed in…
Please insert 4 field diagram
27

Balance sheet reporting – focus on NWC
- the best way to optimize business performance
PY 2013/14 BU 2014/15 AC 2014/15 AC - BU PY 2013/14 BU 2014/15 AC 2014/15 AC - BU
Index Index
Inventories before stock provisions 16.431 20.392 18.107 -2.285 88,8 16.551 21.449 17.945 -3.504 83,7
Stock days 45,16 52,78 46,01 -6,77 87,2 45,49 55,52 45,60 -9,92 82,1
Gross trade receivables incl. notes 52.330 52.758 60.866 8.108 115,4 52.028 52.709 59.346 6.638 112,6
Sold under ABS / Factoring (off balance)
Total trade receivables before ABS / Factoring 52.330 52.758 60.866 8.108 115,4 52.028 52.709 59.346 6.638 112,6
Debtor days 143,84 136,56 154,66 18,10 113,3 143,01 136,43 150,80 14,36 110,5
Trade payables ST 39.267 42.634 43.776 1.142 102,7 39.672 42.510 43.043 534 101,3
Creditor days 107,94 110,36 111,23 0,88 100,8 109,05 110,03 109,37 -0,66 99,4
Net Working Capital 29.494 30.516 35.197 4.681 115,3 28.907 31.648 34.248 2.600 108,2
NWC days 81,07 78,99 89,43 10,45 113,2 79,46 81,92 87,02 5,10 106,2
Turnover w/o turnover service fees/other 21.828 23.180 23.613 433 101,9 21.828 23.180 23.613 433 101,9
* Calculated as average of AC 1302 to AC 1307 + F1 1310 + F1 1401
End of period Average
28

Investment analysis – where do i put my money? - Return on Capital Employment
Year to Date
AC 2013/14 BU 2014/15 AC 2014/15 AC - BU
Index
EBIT 368 976 616 -360 63,1
Intangible Assets (including Goodwill*) 11.101 10.443 10.475 33 100,3
Property, plant and equipment 2.515 3.749 3.594 -156 95,9
Participations
Tax claims income taxes LT
Non-financial fixed assets 13.615 14.192 14.069 -123 99,1
Inventories 16.447 21.421 17.852 -3.569 83,3
Trade receivables total 51.563 52.140 58.688 6.549 112,6
Prepaid expenses 444 954 835 -119 87,5
Other assets 2.150 2.061 742 -1.319 36,0
Tax claims - income taxes
Interest free current assets 70.603 76.574 78.116 1.542 102,0
Sold under ABS / Factoring (off balance)
Considered assets 84.218 90.766 92.185 1.419 101,6
Provisions for taxes
Other current provisions 42 48 55 8 115,8
Other provisions LT
Accruals for personnel costs LT
Non-current interest free liabilities
Trade payables ST 39.672 42.510 43.043 534 101,3
Other liabilities ST 2.343 734 1.212 479 165,2
Other liabilities LT
Deductible positions 42.056 43.291 44.310 1.020 102,4
Capital employed * 42.162 47.475 47.875 400 100,8
ROCE 5,24% 12,33% 7,72% -4,61% 62,6
* on Subgroup and higher level
** Average calculation of the respective periods
29

6. THE INVISIBLE EDGE:
WINNING BUSINESS MODEL

In order to create a sustainable competitive advantage we
need to develop BENU’s positioning as a
National pharmacy chain
Market leader in retailer formats pharmacy segment
Market leader as local neighborhood pharmacy
How?
Through acquisition of the chains which dominate retailing
format segment
Through acquisition of two chains already well positioned
as local neighborhood pharmacies, then through selective
add-ons
5
2
2
10
2 9 4 2
11
25
2
14 3
Total
shops
Market
total 7 8 3 13 10 15 3 2 61 (100%)
Celsius 6 7 1 14 (23%)
Pharmacity 1 4 7 12 (20%)
Leut SI 1 5 2 1 9 (15%)
Primax 3 3 ( 5%)
Total
(BENU) 6 7 1 7 6 7 3 1 38 (62%)
Pharmacity
Oaza zdravlja
Celsius
Primax
Leut SI
Our pharmacy strategy
- Building a national retail chain through selected acquisitions to create a
sustainable leadership position
Retailer
Pharmacy
31

Pharmacity is growing on strong pace, plenty of potential remains within retailer formats 18 pharmacies opened from June 30th
Contract with the Delthaize taken over from Celsius pharmacy chain, delivering 11 pharmacies and expansion plan
DIS is continuing expansion throughout Serbia, Pharmacity is following on preferred partnership basis
Delivering our strategy
- Focusing on the retail segment – growing and winning segment
Our flagship pharmacy in Delta City shopping mall With potential to become a 1mn EUR pharmacy in 2014
Pilot project with METRO initiated in July Potential for 8 additional pharmacies in 2014
Total
Market total 10 8 3 34 23 15 5 10 11 119
Pharmacity Oct 5 6 1 4 10 2 28 (24%)
32
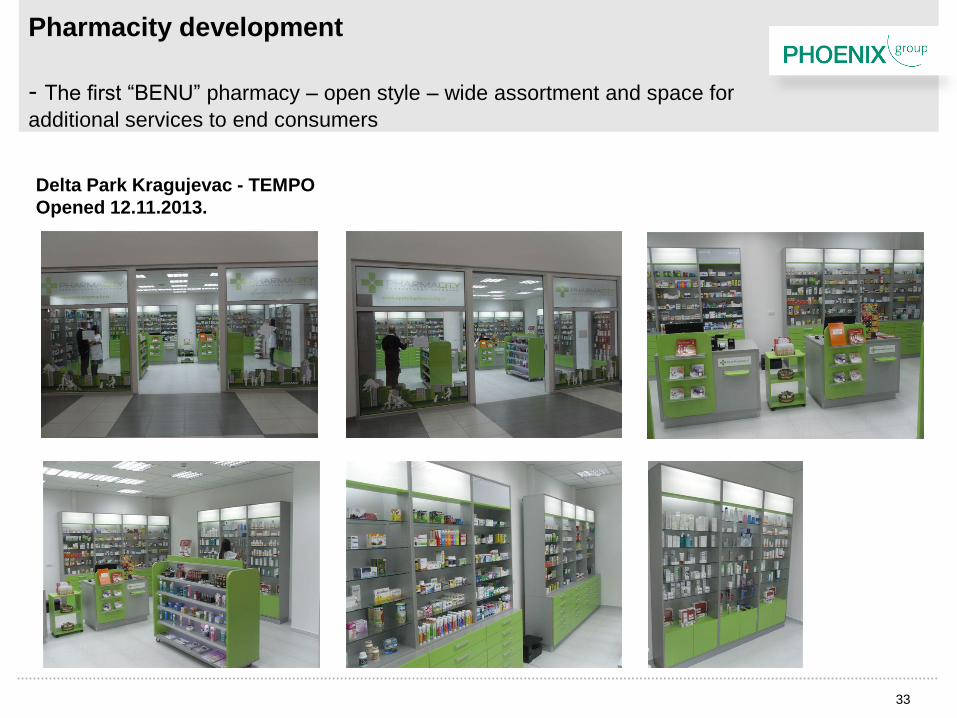
Pharmacity development
- The first “BENU” pharmacy – open style – wide assortment and space for
additional services to end consumers
Delta Park Kragujevac - TEMPO
Opened 12.11.2013.
33

The widest service offer in the market
- We continue to develop our services in each market
SALES SUPPORT
SOLUTIONS
PRE-WHOLESALE
SOLUTIONS
REGULATORY
AFFAIRS
MARKETING
FIELD FORCE
INTERVENTION
IMPORT
CONSIGNMENT
CLINICAL TRIALS
LOGISTICS
LABELLING
DISTRIBUTION
SRB BIH BG
SRB
SRB BIH MAK
KOS MAK
BIH
BG
MNE SRB
SRB MNE
MAK KOS
BG BIH MAK SRB
BIH
SRB
SRB
MNE BG
BIH MAK
MAK
MNE BG
BIH KOS
MAK
34

The business model is based on a new business
stream and cross selling services to current clients
SALES SUPPORT
SOLUTIONS
PRE-WHOLESALE
SOLUTIONS
REGULATORY
AFFAIRS
MARKETING
FIELD FORCE
INTERVENTION
IMPORT
CONSIGNMENT
CLINICAL TRIALS
LOGISTICS
LABELLING
DISTRIBUTION
35
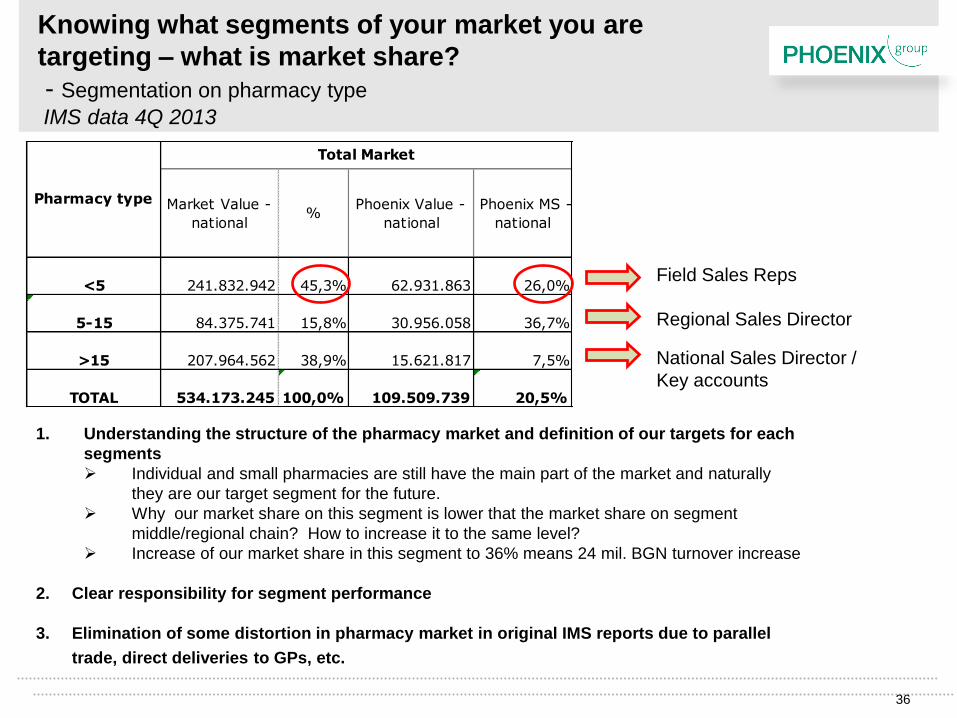
Knowing what segments of your market you are
targeting – what is market share?
- Segmentation on pharmacy type
IMS data 4Q 2013
Market Value -
national%
Phoenix Value -
national
Phoenix MS -
national
<5 241.832.942 45,3% 62.931.863 26,0%
5-15 84.375.741 15,8% 30.956.058 36,7%
>15 207.964.562 38,9% 15.621.817 7,5%
TOTAL 534.173.245 100,0% 109.509.739 20,5%
Pharmacy type
Total Market
1. Understanding the structure of the pharmacy market and definition of our targets for each
segments
Individual and small pharmacies are still have the main part of the market and naturally
they are our target segment for the future.
Why our market share on this segment is lower that the market share on segment
middle/regional chain? How to increase it to the same level?
Increase of our market share in this segment to 36% means 24 mil. BGN turnover increase
2. Clear responsibility for segment performance
3. Elimination of some distortion in pharmacy market in original IMS reports due to parallel
trade, direct deliveries to GPs, etc.
Field Sales Reps
Regional Sales Director
National Sales Director /
Key accounts
36

7. WHAT DOES A BUSINESS
LEADER DO?

The life of a CEO……
38

The life of a CEO……
.......is far too busy.......
39

So we have to set priorities……
50% of time is
spent on
Operational
Strategy
50% of time is
spent on
Organizationa
l Strategy
40

Organizational strategy…..
- How to implement your winning best practice....
Our people
How are they
organized?
How are they
developed?
What
opportunities do
they have?
Where are they
placed?
Have they the
right training?
Do they have
what they need?
41

THANK YOU


![MNE Det[1]](https://static.fdocuments.us/doc/165x107/577d2e0a1a28ab4e1eaea763/mne-det1.jpg)