Flow Complex Joachim Giesen Friedrich-Schiller-Universität Jena.

Friedrich Schiller University Jena Faculty of Biology and Pharmacy
Max Planck Institute for Chemical Ecology
Department of Bioorganic Chemistry
Regulation of extracellular superoxide dismutases in the
leaf beetle Phaedon cochleariae after treatment with the
entomopathogenic fungus Metarhizium anisopliae
Bachelor thesis to obtain the academic degree
Bachelor of Science
submitted by
Priska Elisabeth Streicher
born 11th June 1991 in Leipzig
Jena, March 2015

Supervisors:
Prof. Dr. Wilhelm Boland (Max Planck Institute for Chemical Ecology)
Dr. Antje Burse (Max Planck Institute for Chemical Ecology)
i
Table of contents
I List of Figures ........................................................................................................... iv
II List of Formulas ...................................................................................................... iv
III List of Abbreviations and Symbols ......................................................................... v
1 Introduction ............................................................................................................... 1
1.1 Superoxide dismutase ......................................................................................... 1
1.2 Extracellular Cu,Zn-SODs ................................................................................. 2
1.3 Insect immune response to pathogens ................................................................ 4
2 Aim of the bachelor thesis......................................................................................... 5
3 Material and methods ................................................................................................ 6
3.1 Biological methods ............................................................................................. 6
3.1.1 Breeding of P. cochleariae .......................................................................... 6
3.1.2 Dissection of P. cochleariae larvae ............................................................. 6
3.1.3 Induction of RNAi in P. cochleariae larvae ................................................ 7
3.2 Mycological methods ......................................................................................... 7
3.2.1 Cultivation and harvesting of M. anisopliae conidia ................................... 7
3.2.2 Infection of P. cochleariae with M. anisopliae ........................................... 7
3.3 Molecular methods ............................................................................................. 8
3.3.1 Total RNA isolation and DNase I digestion ................................................ 8
3.3.2 Complementary DNA synthesis .................................................................. 9
3.3.3 Quantitative real-time PCR .......................................................................... 9
3.3.4 Synthesis of dsRNA for RNAi .................................................................. 10
3.3.5 Membrane protein extraction ..................................................................... 11
ii
3.4 Protein analysis ................................................................................................. 11
3.4.1 Protein quantitation .................................................................................... 11
3.4.1.1 BCA protein assay .............................................................................. 11
3.4.1.2 UV-measurement ................................................................................ 12
3.4.2 SOD activity determination ....................................................................... 13
3.4.2.1 Preparation of samples ........................................................................ 13
3.4.2.2 SOD-assay ........................................................................................... 13
3.4.3 Polyacrylamide gel electrophoresis (SDS-PAGE) .................................... 14
3.4.4 Western blot ............................................................................................... 15
3.4.5. In gel digestion of proteins ....................................................................... 15
3.4.6 TCA precipitation of proteins .................................................................... 16
3.5 Proteome analysis ............................................................................................. 16
3.6 Statistics ............................................................................................................ 16
4 Results ..................................................................................................................... 17
4.1 Examinations of Cu,Zn-SODs in untreated P. cochleariae larvae ................... 17
4.1.1 Relative expression in several tissues ........................................................ 17
4.1.2 SOD activity after membrane protein isolation of several tissues ............. 18
4.1.3 Proteomics of different tissues and haemolymph ...................................... 19
4.2 Activity of overexpressed Cu,Zn-SODs ........................................................... 20
4.3 Cu,Zn-SODs in P. cochleariae larvae infected by M. anisopliae .................... 20
4.3.1 Relative expression after varying time of fungal exposure ....................... 20
4.3.2 Relative expression in several tissues 2 days after infection ..................... 22
4.4 Extracellular SODs after RNAi in infected P. cochleariae larvae ................... 22
4.4.1 Silenced SOD3.1 via RNAi ....................................................................... 23
4.4.2 Effects of RNAi of extracellular SOD isozymes in infected P. cochleariae
larvae ................................................................................................................... 25
iii
5 Discussion and Conclusions .................................................................................... 28
5.1 Complex Cu,Zn-sod expression and SOD activity in tissues of juvenile
P. cochleariae ......................................................................................................... 28
5.2 Extracellular SODs in the haemolymph ........................................................... 29
5.3 SOD defence reaction to parasitization by M. anisopliae ................................ 30
5.3.1 Effects on transcriptional level .................................................................. 31
5.3.2 Effects on SOD protein activity ................................................................. 31
6 Future directions...................................................................................................... 33
7 Summary ................................................................................................................. 34
8 Zusammenfassung ................................................................................................... 35
A References ................................................................................................................ a
B Supplement ............................................................................................................... d
List of used materials ............................................................................................ d
Buffer recipes ........................................................................................................ h
Primer sequences ................................................................................................... i
Pictures of larvae and their breeding ..................................................................... j
Pupation rate of P. cochleariae after 5 days in comparison ................................. k
SOD inhibition curve ............................................................................................ k
Comparison between untreated and dsRNA injected group ................................. k
Proteome analysis .................................................................................................. l
Cu,Zn-SOD allignment ......................................................................................... n
Western blot of overexpressed SODs ................................................................... n
C Acknowledgement .................................................................................................... o
D Declaration of authorship ......................................................................................... p
iv
I List of Figures
Figure 1: Structure of a Cu,Zn-SOD dimer .................................................................. 3
Figure 2: Diagram of the encapsulation of a parasitoid wasp egg ............................... 4
Figure 3: qPCR program in CFX Manager Software................................................... 9
Figure 4: Schematic reaction of BCA protein assay .................................................. 12
Figure 5: Principle of the SOD Assay Kit .................................................................. 13
Figure 6: expression level of sod’s in several tissues of juvenile P. cochleariae ...... 18
Figure 7: SOD activity in cytosol- and membrane-fraction of fat body and
Malpighian tubules ..................................................................................................... 19
Figure 8: SOD activity of overexpressed protein from P. cochleariae...................... 20
Figure 9: expression level of sod’s in whole P. cochleariae larvae 1 to 6 days after
infection with M. anisopliae ...................................................................................... 21
Figure 10: expression level of sod’s in several tissues of P. cochleariae 2 days after
infection with M. anisopliae ...................................................................................... 22
Figure 11: Immunoblotting experiment after RNAi .................................................. 24
Figure 12: Impact of RNAi and infection to SOD activity in haemolymph .............. 24
Figure 13: SOD activity in several tissues after RNA interference ........................... 26
II List of Formulas Formula 1: Calculation of RNA concentration……………………………….…...….8
Formula 2: Calculation of dsRNA concentration…………………………….….….10
Formula 3: Calculation of SOD activity…………………………………..…….......14

v
III List of Abbreviations and Symbols * significant difference between 2 groups
~ similar
Δ deviation
λ wavelength
A absorption
BCA bicinchoninic acid
BLAST Basic Local Alignment Search Tool
bp base pair oft nucleobases
BSA bovine serum albumin
cDNA complementary DNA
Cq quantification cycle
C-terminus carboxy-terminus
DNA desoxyribonucleic acid
DNase deoxyribonuclease
dsRNA double-stranded RNA
GFP green fluorescent protein
HRP horseradish peroxidase
i infected larvae
kDa kilo Dalton
M Molar mass
Mn manganese
mRNA messenger RNA
NADPH reduced nicotinamide adenine dinucleotide phosphate
NCBI National Center for Biotechnology Information
ni non-infected larvae
Nox NADPH oxidase
N-terminus amino-terminus

vi
P significance
PAGE polyacrylamide gel electrophoresis
PCR polymerase chain reaction
qPCR quantitative real-time PCR
RNA ribonucleic acid
RNAi RNA interference
RNase ribonuclease
ROS reactive oxygen species
rpm revolutions per minute
SD standard deviation
SDS sodium dodecyl sulphate
SOD superoxide dismutase
Taq Thermus aquaticus
TCA 2,4,6-Trichloroanisole
U unit
UV-radiation ultraviolet radiation
WST-1 Dojindo’s highly water-soluble tetrazolium salt
XO xanthine oxidase
1
1 Introduction
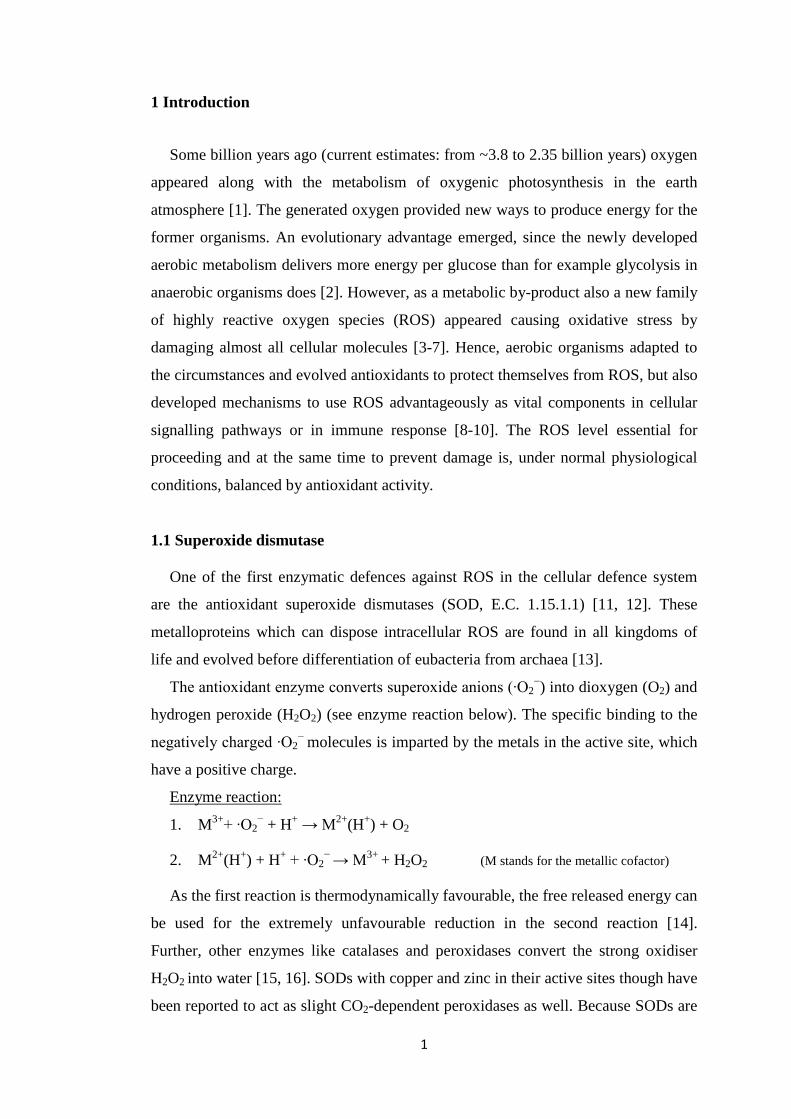
Some billion years ago (current estimates: from ~3.8 to 2.35 billion years) oxygen
appeared along with the metabolism of oxygenic photosynthesis in the earth
atmosphere [1]. The generated oxygen provided new ways to produce energy for the
former organisms. An evolutionary advantage emerged, since the newly developed
aerobic metabolism delivers more energy per glucose than for example glycolysis in
anaerobic organisms does [2]. However, as a metabolic by-product also a new family
of highly reactive oxygen species (ROS) appeared causing oxidative stress by
damaging almost all cellular molecules [3-7]. Hence, aerobic organisms adapted to
the circumstances and evolved antioxidants to protect themselves from ROS, but also
developed mechanisms to use ROS advantageously as vital components in cellular
signalling pathways or in immune response [8-10]. The ROS level essential for
proceeding and at the same time to prevent damage is, under normal physiological
conditions, balanced by antioxidant activity.
1.1 Superoxide dismutase
One of the first enzymatic defences against ROS in the cellular defence system
are the antioxidant superoxide dismutases (SOD, E.C. 1.15.1.1) [11, 12]. These
metalloproteins which can dispose intracellular ROS are found in all kingdoms of
life and evolved before differentiation of eubacteria from archaea [13].
The antioxidant enzyme converts superoxide anions (∙O2−) into dioxygen (O2) and
hydrogen peroxide (H2O2) (see enzyme reaction below). The specific binding to the
negatively charged ∙O2− molecules is imparted by the metals in the active site, which
have a positive charge.
Enzyme reaction:
1. M3++ ∙O2− + H+ → M2+(H+) + O2
2. M2+(H+) + H+ + ∙O2− → M3+ + H2O2 (M stands for the metallic cofactor)
As the first reaction is thermodynamically favourable, the free released energy can
be used for the extremely unfavourable reduction in the second reaction [14].
Further, other enzymes like catalases and peroxidases convert the strong oxidiser
H2O2 into water [15, 16]. SODs with copper and zinc in their active sites though have
been reported to act as slight CO2-dependent peroxidases as well. Because SODs are
2
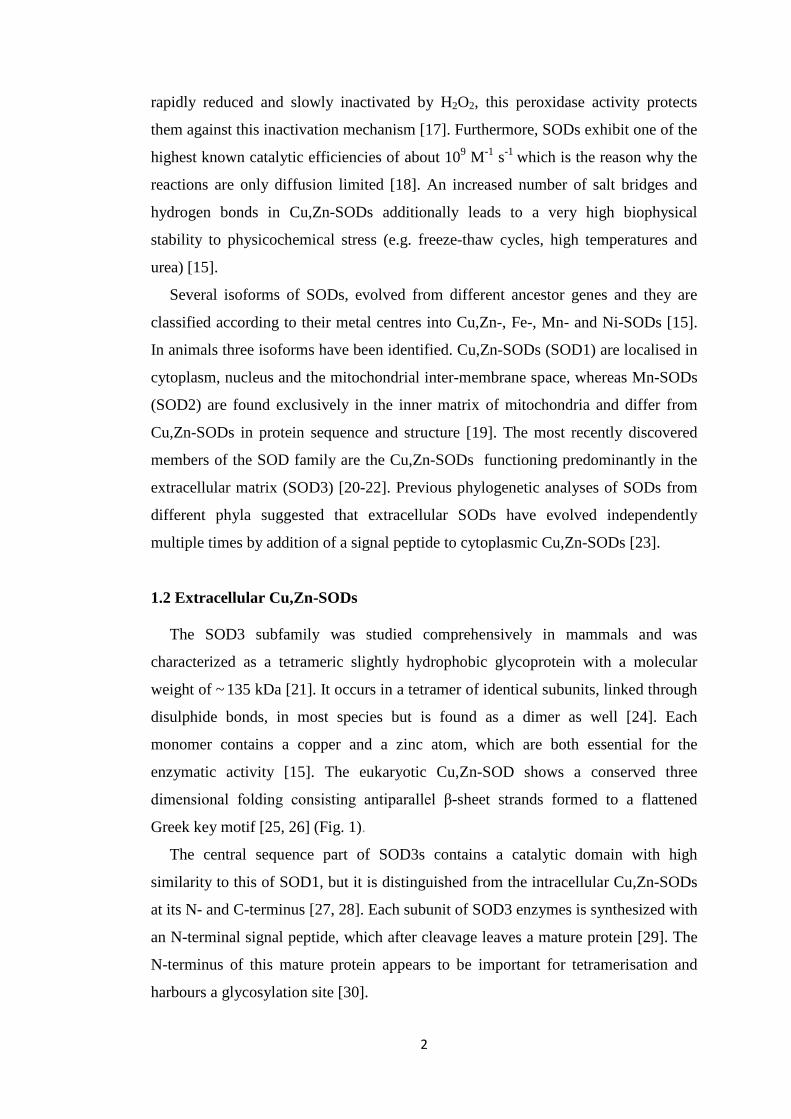
rapidly reduced and slowly inactivated by H2O2, this peroxidase activity protects
them against this inactivation mechanism [17]. Furthermore, SODs exhibit one of the
highest known catalytic efficiencies of about 109 M-1 s-1 which is the reason why the
reactions are only diffusion limited [18]. An increased number of salt bridges and
hydrogen bonds in Cu,Zn-SODs additionally leads to a very high biophysical
stability to physicochemical stress (e.g. freeze-thaw cycles, high temperatures and
urea) [15].
Several isoforms of SODs, evolved from different ancestor genes and they are
classified according to their metal centres into Cu,Zn-, Fe-, Mn- and Ni-SODs [15].
In animals three isoforms have been identified. Cu,Zn-SODs (SOD1) are localised in
cytoplasm, nucleus and the mitochondrial inter-membrane space, whereas Mn-SODs
(SOD2) are found exclusively in the inner matrix of mitochondria and differ from
Cu,Zn-SODs in protein sequence and structure [19]. The most recently discovered
members of the SOD family are the Cu,Zn-SODs functioning predominantly in the
extracellular matrix (SOD3) [20-22]. Previous phylogenetic analyses of SODs from
different phyla suggested that extracellular SODs have evolved independently
multiple times by addition of a signal peptide to cytoplasmic Cu,Zn-SODs [23].
1.2 Extracellular Cu,Zn-SODs
The SOD3 subfamily was studied comprehensively in mammals and was
characterized as a tetrameric slightly hydrophobic glycoprotein with a molecular
weight of ~ 135 kDa [21]. It occurs in a tetramer of identical subunits, linked through
disulphide bonds, in most species but is found as a dimer as well [24]. Each
monomer contains a copper and a zinc atom, which are both essential for the
enzymatic activity [15]. The eukaryotic Cu,Zn-SOD shows a conserved three
dimensional folding consisting antiparallel β-sheet strands formed to a flattened
Greek key motif [25, 26] (Fig. 1).
The central sequence part of SOD3s contains a catalytic domain with high
similarity to this of SOD1, but it is distinguished from the intracellular Cu,Zn-SODs
at its N- and C-terminus [27, 28]. Each subunit of SOD3 enzymes is synthesized with
an N-terminal signal peptide, which after cleavage leaves a mature protein [29]. The
N-terminus of this mature protein appears to be important for tetramerisation and
harbours a glycosylation site [30].

3
The C-terminal region is highly rich in positively charged amino acid residues
[31] and involved in extracellular matrix binding. It anchors to heparan sulphate
proteoglycans like collagen type1 or fibulin-5, located on cell surfaces and in the
connective tissue matrix [32, 33]. This domain can be cleaved proteolytically, and
hence, facilitate the transport in the inside of the nucleus [34] or the entrance of the
protein to extracellular fluids [31, 35], where it may protect the tissues against
antioxidants.
Figure 1: Structure of a Cu,Zn-SOD dimer: Cu,Zn-SODs have monomers with ~ 150 amino acids
and mostly appear as dimers, Cu ion is illustrated in green and Zn in black in the coloured monomer
[14].
Changes in the activity of SOD3 of human have been shown to contribute to
pathogenesis of a number of diseases, especially in tissues with essential high levels
of SOD3 expression [22]. For example, the risk of ischemic heart disease has been
shown to increase with a decreased tissue antioxidant level, caused by a natural
mutation in the extracellular matrix-binding region of SOD3 [36]. Also the
pathogenesis of diabetes occurred due to changes in SOD3 activity, through a lower
binding to the endothelial surface [20]. Then, there is a controversial hypothesis
which says that an increased Cu,Zn-SOD may lead to an increased chance of mothers
having a Down syndrome child [16]. Furthermore, recent research on Cu,Zn-SODs
indicate a relationship between a misfolded Cu,Zn-SOD and familial amyotrophic
lateral sclerosis [37, 38]. As in humans, also in insects a crucial role of extracellular
SODs can be suggested. Especially in the immune system of the insects SOD3 is
mentioned.
4
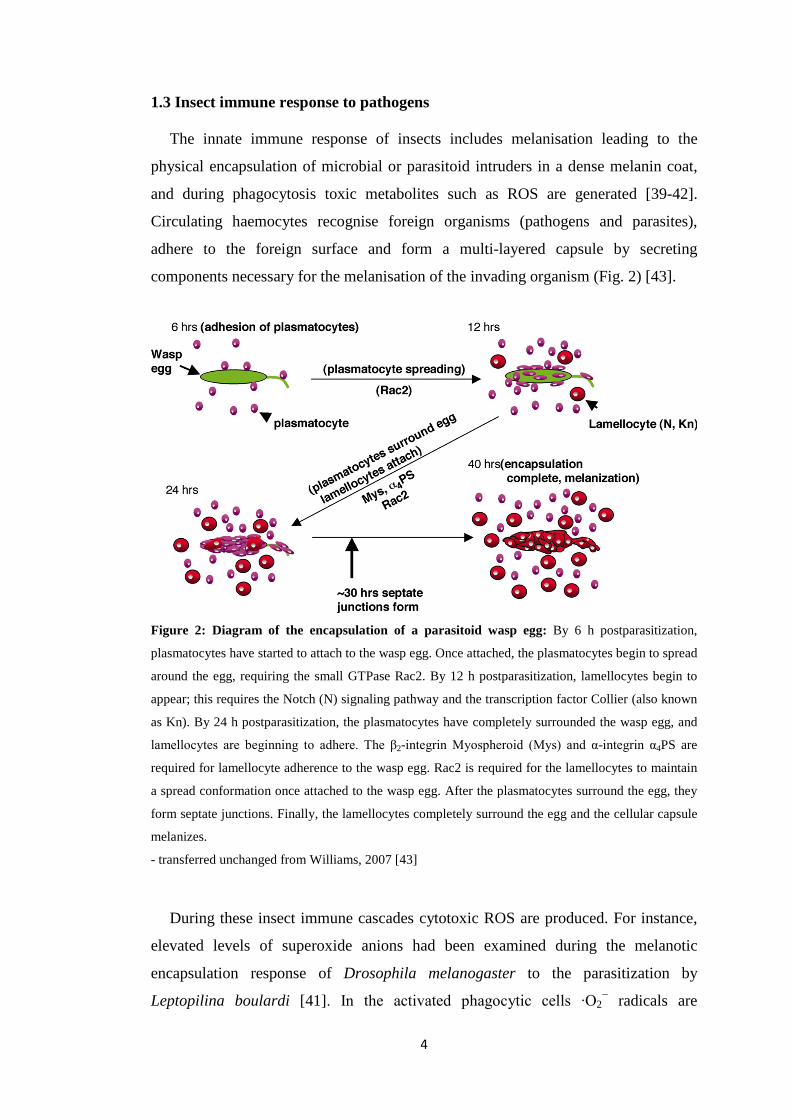
1.3 Insect immune response to pathogens
The innate immune response of insects includes melanisation leading to the
physical encapsulation of microbial or parasitoid intruders in a dense melanin coat,
and during phagocytosis toxic metabolites such as ROS are generated [39-42].
Circulating haemocytes recognise foreign organisms (pathogens and parasites),
adhere to the foreign surface and form a multi-layered capsule by secreting
components necessary for the melanisation of the invading organism (Fig. 2) [43].
Figure 2: Diagram of the encapsulation of a parasitoid wasp egg: By 6 h postparasitization,
plasmatocytes have started to attach to the wasp egg. Once attached, the plasmatocytes begin to spread
around the egg, requiring the small GTPase Rac2. By 12 h postparasitization, lamellocytes begin to
appear; this requires the Notch (N) signaling pathway and the transcription factor Collier (also known
as Kn). By 24 h postparasitization, the plasmatocytes have completely surrounded the wasp egg, and
lamellocytes are beginning to adhere. The β2-integrin Myospheroid (Mys) and α-integrin α4PS are
required for lamellocyte adherence to the wasp egg. Rac2 is required for the lamellocytes to maintain
a spread conformation once attached to the wasp egg. After the plasmatocytes surround the egg, they
form septate junctions. Finally, the lamellocytes completely surround the egg and the cellular capsule
melanizes.
- transferred unchanged from Williams, 2007 [43]
During these insect immune cascades cytotoxic ROS are produced. For instance,
elevated levels of superoxide anions had been examined during the melanotic
encapsulation response of Drosophila melanogaster to the parasitization by
Leptopilina boulardi [41]. In the activated phagocytic cells ∙O2− radicals are

5
produced via plasma membrane NADPH oxidase (Nox) [44]. In context to this Nox
mediated signal cascades stands the H2O2 production, which also indicates a role of
SODs as a mediator between Nox and H2O2 signals in the immune response of
insects [45].
Although SOD3 has been conserved among metazoans, the first functional
evidence for a SOD3 in insects has not been reported before the 21th century [28].
And still, the understanding of the function of extracellular SOD variants in insects is
incomplete and only few examples have been published to date.
The Drosophila melanogaster SOD3 was reported in 2011 to exhibit a protective
effect against oxidative stress caused by UV-radiation and an impact to life span
regulation [46]. In the same year Colinet et al. discovered that parasitoid wasps also
produce extracellular Zn,Cu-SODs and even inject them within the venom while
oviposition. [27]. The extracellular SODs are suggested to act as a virulence factor to
counteract the host immune response. The exogenous SODs interfere most likely
with the hosts’ ROS formation and increase the survival rate of the parasitoid eggs in
the host. Hence a function of extracellular Cu,Zn-SOD in the protection against
oxidative stress and thus, in immune response of insects, can be suggested.
2 Aim of the bachelor thesis
The first insect described to have three SOD3 isozymes is the leaf beetle Phaedon
chochleariae [47]. This work focuses on the role of SOD3s and their regulation, with
regards on the larval pathogen response of this Chrysomelina species. Therefor
expression level in different tissues is to be assigned by utilizing quantitative real-
time polymerase chain reaction (qPCR). SOD activity shall be examined in vitro and
in vivo in different tissues and haemolymph by protein activity assays. Furthermore,
the defence reaction is to be explored by exposing the larvae to the
entomopathogenic fungus Metarhizium anisopliae and subsequently, the
involvement and importance of each SOD3s in the immune response shall be
detected by preceding RNA interference (RNAi). By proteomics further conclusions
about extracellular SODs in the larvae should be achieved.

6
3 Material and methods
All used material is listed in the supplement.
3.1 Biological methods
3.1.1 Breeding of P. cochleariae
P. cochleariae were lab-reared on fresh Chinese cabbage (Brassica rapa
chinensis) in a light/dark cycle of 16 h light with 14°C ± 1°C and 8 h darkness at
12°C ± 1°C. Adults and eggs were separated and larvae were grouped with regard to
their day of hatching (pictures in the supplement). Before pupation the larvae are
going through three instars.
3.1.2 Dissection of P. cochleariae larvae
Dissection of the larvae was done under a Carl Zeiss stereomicroscope.
Haemolymph was extracted by twitching off a leg and absorbing the fluid with a
glass capillary (inner diameter of 0.5 mm). Head, fat body, Malpighian tubules, gut
and defence glands were dissected using tweezers and dissection scissors purchased
from Fine Science Tools. To prevent the drying-out of the tissues, dissection was
performed in 0.9% NaCl-solution. Mostly third-instar larvae were dissected.
For protein analyses tissues were stored snap-frozen at - 80°C. Haemolymph was
kept in Ringer´s solution (recipe in the supplement), centrifuged 5 min at 5,000 rpm
and 4°C to pelletize the haemocytes. The supernatant was checked for cells under a
Carl Zeiss Axioskope and the cell-free haemolymph was stored at - 20°C overnight.
Tissues for qPCR were stored in Lysis Buffer [RNAqueous-Micro Kit] with
ExpressArt NucleoGuard at - 20°C until needed. For whole larvae samples, larvae
where snap-frozen in liquid nitrogen, pestled with see sand in Lysis Buffer with
NucleoGuard. After centrifugation the supernatant was stored at - 20°C until needed.
7
3.1.3 Induction of RNAi in P. cochleariae larvae
RNAi is a version of endogenous gen regulation. Injected double-stranded RNA
(dsRNA) binds to the complementary RNA and leads to degrading of the target
RNA. Hence, the synthesis of the corresponding protein gets inhibited [48].
Injection of dsRNA was carried out on early second-instar larvae of 2 – 3 mm
length (approx. 9 days after hatching). 100 ng of dsRNA was injected dorso-median
in the gap between pro- and mesothorax into the haemocoel of the larvae with a
Nano2010 injector and self-prepared glass needles driven by a micromanipulator.
During the procedure the larvae were kept calm on ice.
3.2 Mycological methods
3.2.1 Cultivation and harvesting of M. anisopliae conidia
The entomopathogenic fungus M. anisopliae was maintained and harvested from
liquid culture (Potato-Dextrose Broth, 200 ml in a 500 ml Erlenmeyer flask), which
was incubated at room temperature for several months without shaking. The culture
with sufficient conidia was agitated with a 10 cm magnetic stirring bar at 4°C over
night. Fine gauze was then used to separate the mycelium from the supernatant
containing the conidia. The supernatant was centrifuged for 10 min at 10,300 rpm
and 4°C and washed twice with approx. 20 ml of 0.1% aqueous Tween-20 solution
by centrifuging under the same conditions. The pellet of conidia was diluted in 10 ml
of 0.1% aqueous Tween-20 solution. Using the Neubauer improved haemocytometer,
the concentration of conidia was determined and adjusted to 106 conidia/ml
afterwards.
3.2.2 Infection of P. cochleariae with M. anisopliae
To expose the larvae to the fungi they were dabbed on lab tissue to remove the
defence secretions first and then submerged in 1 ml of well mixed 106 conidia
suspension, which mimics the natural way of infection [49]. After 30 sec the
suspension was poured on filter paper to let the larvae air dry for 1 min After
infection the larvae were kept on Chinese cabbage in small plastic pots at room
temperature to allow the fungus to develop. To eliminate a difference in the results
caused by the stress of the procedure between uninfected and infected larvae a

8
control group was generated. The control group larvae were also submerged in 0.1%
aqueous Tween-20 solution, but without conidia and stored at room temperature the
same way.
Infection was performed 5 days after RNAi and after 2 days of exposure
dissection of the larvae was done. In a later experiment larvae were dissected only 4
days after infection to check if more SOD protein is built after some more days of
exposure. Since the larvae begin to pupate after less than a week when they are kept
at room temperature (table in the supplement), the distance between RNAi and
infection had to be reduced to 2 days for these experiments.
3.3 Molecular methods
3.3.1 Total RNA isolation and DNase I digestion
The tissues of several (mostly 3) larvae were pooled in a 1.5 ml tube with 100 µl
Lysis Solution (RNAqueous Mikro Kit) and 1 µl ExpressArt NucleoGuard, a
universal nuclease and RNase inhibitor. RNA isolation procedure, DNase I treatment
and DNA inactivation were conducted according to the manual of the RNAqueous
Mikro Kit. The concentration and purity of isolated RNA was measured at λ = 260
and 280 nm with a NanoVue spectrophotometer against nuclease free water. The
purity of the RNA can be calculated by building the quotient of A260 and A280. To
estimate the RNA concentration following formula was used:
c(RNA) = A260 × 40 µg/ml. Formula 1: Calculation of RNA concentration
The quality of RNA was determined with a RNA Nano Chip and Agilent 2100
Bioanalyzer.

9
3.3.2 Complementary DNA synthesis
To obtain the template for quantitative PCR (qPCR), complementary DNA
(cDNA) was reverse transcribed from the isolated RNA by using SuperScript III
enzyme and oligo(dT)20 primer (50 µM) (SuperScript III Reverse Transcriptase Kit)
according to the manufacturer’s instruction. The reaction contained up to 5 µg of
RNA and was incubated for 2 h at 50°C. Enzyme reaction was inactivated by heating
the reaction at 70°C for 15 min subsequently. Formed cDNA was stored at - 20°C
until needed.
3.3.3 Quantitative real-time PCR
qPCR was done to assess the expression levels of the extracellular SODs in the
different larval tissues of P. cochleariae. In a PCR DNA is amplified in vitro. To
quantify the mRNA/cDNA through a qPCR, a fluorescent dye is added additionally
to the reaction. SYBR green, which was used as fluorescent dye intercalates with the
built double-stranded DNA. Accordingly, there is a linear correlation between the
fluorescence and the DNA amount. The CFX96 Real-Time System thermal cycler
contains sensors to measure the fluorescence at each PCR cycle (Figure 3: “Plate
Read”).
Figure 3: qPCR program in CFX Manager Software: After the initial denaturing at 95°C, 40
cycles of the denaturing, hybridisation and elongation with appropriate temperatures were conducted.
The thermal cycler measures the absorbance after each cycle (Plate Read) to quantify the relative
expression level. At the end a melt curve is generated by heating the samples from 65 to 95°C and
measuring the absorbance after each 0.05°C increment.

10
Besides the three extracellular Cu,Zn-SODs (SOD3.1, SOD3.2 and SOD3.3) also
the intracellular Cu,Zn-SOD (SOD1.1) were examined in terms of their expression
level. The household genes rps3 and rpl6 (coding for ribosomal proteins) were
chosen as reference genes to normalise the PCRs for the amount of present cDNA
template.
In a 25 µl-PCR reaction 12.5 µl SYBR Premix ExTaq II (containing buffer
solution, magnesium ions, Taq DNA polymerase, dNTPs and the fluorescent dye
SYBR-Green) 1 µl of each primer (10 µM) and 1µl of cDNA template were
combined in double distilled RNase free water. Primers were designed by René R.
Gretscher using primer3PLUS: http://www.bioinformatics.nl/cgi-
bin/primer3plus/primer3plus.cgi [50] and sequences can be found in the supplement.
For each biological replicate three technical replicates were performed. Gene
expression was estimated and analysed with CFX Manager Software.
3.3.4 Synthesis of dsRNA for RNAi
Template DNA, which was constructed by René R. Gretscher using pIB-plasmids
and T7-polymerase [50], was used to generate dsRNA. The synthesis of dsRNA was
made from the PCR fragment (primer sequences in the supplement) corresponding to
the instructions of the MEGAscript RNAi Kit. To get higher yields, the incubation
time of the linear template DNA with the T7 Enzyme Mix and NTPs was extended to
8 hours at 37°C. Instead of the provided Elution Solution, 3 × 50 µl double-distilled
water was used to elute the dsRNA. The water was preheated to 65°C. After applying
the first 50 µl of water to the filter cartridge, the closed tube incubated for 1 hour in a
heat block at 50°C. Second and third incubation time was approx. 10 min The
concentration of the dsRNA was measured spectrophotometrically with a NanoVue
spectrophotometer and adjusted to 1 µg/µl with injection buffer (recipe in the
supplement). The concentration was calculated with following equation:
c(dsRNA) = A260 × 45 mg/ml. Formula 2: Calculation of dsRNA concentration
11
The quality of dsRNA was checked by TAE-agarose-electrophoresis with the
resulting dsRNA size of 238bp for PcSOD1.1, 193bp for PcSOD3.1, 508bp for
PcSOD3.2 and 172bp for PcSOD3.3 respectively. Green fluorescent protein (GFP)
dsRNA shows a length of 523bp.
3.3.5 Membrane protein extraction
With the Native Membrane Protein Extraction Kit membrane proteins can be
extracted under mild non-denaturing conditions.
To fat body and Malpighian tubules of 6 larvae 500 µl Wash Buffer (Native
Membrane Protein Extraction Kit) was added. Tissue samples were then centrifuged
for 10 min at 5,000 rpm. The supernatant was discarded and the pellets stored at
- 20°C overnight. Further proceeding was done after the instructions 7.3.6 Frozen
tissue. Briefly, the pellet was snap frozen in liquid nitrogen and crushed in a
precooled homogenizer, like recommended in the manual. Since there was a little
amount of tissue per probe, only ¼ volumes of the reagents were used.
3.4 Protein analysis
3.4.1 Protein quantitation
3.4.1.1 BCA protein assay
To assess the protein concentration a BCA protein assay (Pierce BCA Protein
Assay Kit), was conducted after the given instructions. Bovine serum albumin (BSA)
standards were used and diluted for a working range from 20 to 2,000 µg/ml. The
assays were measured in a Spectra Max 250 microplate reader at 562 nm after 30
min incubation time at 37°C.

12
Figure 4: Schematic reaction of BCA protein assay: Step 1: reduction of Cu2+ with protein, Step 2: chelation of cuprous ion and two molecules of BCA. - Illustrations from Pierce BCA Protein Assay Kit manual
Principally, the assay works in two steps.
First, the reduction of Cu2+ to Cu1+ is taking
place which is also known as the Biuret reaction.
In an alkaline environment, copper and protein
form a chelate. Then the reaction of
Bicinchoninic acid (BCA) with the developed
cuprous cation from the first step follows and a
chelate of two BCA molecules with one cuprous
ion occurs (Fig. 4). The intense purple-coloured
and water-soluble BCA/copper-complex shows
a strong linear absorbance with the increase of
protein concentration at a wavelength of 562 nm. The presence of the amino acids
tryptophan, tyrosine and cysteine, and the number of the peptide bonds are
responsible for the intensity of the colour. As the peptide backbone also contributes
to the colour formation, this method exhibits less protein-to-protein variation than
Coomassie dye-binding methods [51].
3.4.1.2 UV-measurement
1 µl of the sample solution was applied to the NanoVue spectrophotometer and
measured at λ = 280 nm. The concentration of total protein was determined by
subtracting the absorbance value of the medium in which the tissue was dissolved
from the absorbance of the probe.
For that method much less of a sample is needed, which is advantageous for
working with samples with little volume. Hence, although many disruptive factors,
like nucleic acids, buffer solutions or distinct colour in the sample can adulterate the
results of spectrophotometric measurements, UV-measurements were chosen for
most examinations.

13
3.4.2 SOD activity determination
3.4.2.1 Preparation of samples
Samples were prepared as described in 3.2.2. Here the haemolymph of 4 - 10
larvae was added to 50 µl of Ringer´s solution. After centrifugation and cell-check,
the supernatant was stored at -20°C. Snap frozen tissues (2 per sample) were also
placed into 50 µl Ringer´s solution with 0.5 µl Protease-Inhibitor-Mix and grinded
with a sterile pestle. After centrifugation at 4°C and 5,000 rpm for 10 min the
supernatant was transferred into a new reaction tube and stored at - 20°C. The protein
concentration was measured spectrophotometrically (see 6.5.1.2) and diluted to the
needed concentration with Ringer´s solution.
3.4.2.2 SOD-assay
To determine the SOD activity in a probe the 19160 SOD Determination Kit was
used. A very suitable SOD assaying is possible by utilising the Dojindo’s highly
water-soluble tetrazolium salt, WST-1. The reduction of oxygen by the enzyme
xanthine oxidase (XO) is linearly related to the XO-activity. WST-1, however,
reduces the formed superoxide anions and produces a water-soluble yellow formazan
dye simultaneously. The SOD inhibits this reaction, as shown in Figure 5. Since the
absorbance at 440 nm is proportional to the amount of superoxide anions, the
inhibition rate of SODs in the probe can be determined by a colorimetric method.
Figure 5: Principle of the SOD Assay Kit: a) reactions involved after addition of XO enzyme, b) structure of WST-1, c) absorption spectrum of WST-1 formazan at 440 nm - illustrations from Sigma-Aldrich SOD Assay Kit manual.

14
The SOD activity (inhibition rate) was calculated with the following equation:
Formula 3: Calculation of
SOD activity
„A” describes the measured absorbance at 450 nm. All samples contain WST
working solution. Blank 1 additionally contains XO enzyme working solution and
water instead of protein solution. Blank 3 contains the same, but instead of the
enzyme working solution it contains dilution buffer. In case of visible colour of the
sample solution, blank 2 needed to be set up additionally. Blank 2 contains the
sample protein solution but no enzyme solution, so the colour of the sample solution
can be subtracted of the total absorbance. The SOD standard inhibition curve was
determined according to the manual with bovine erythrocyte SOD (15000 U/ml) and
an incubation time of 20 min.
3.4.3 Polyacrylamide gel electrophoresis (SDS-PAGE)
To check the presence and the amount of SOD-proteins the wells of a protein gel
(BIO-RAD Mini-PROTEAN TGX) were filled with protein samples (preparation
similar to 3.5.2.1). Therefor 5 × SDS loading buffer (recipe in the supplement) was
applied to a solution with a definite amount (25 or 75 µg) of total protein and heated
at 95°C for 5 min Sodium dodecyl sulphate (SDS) is an anionic detergent which
denatures and linearizes proteins and grants a negative charge to the proteins.
Embedded into a tank containing running buffer (recipe in the supplement) with an
electric field the proteins in the gel can migrate from the negative charged electrode
towards the positive electrode. Small proteins migrate faster through the gel pores
than larger ones. After running the gel 20 min at 220 V it was ready to use for further
processing. As a marker 2 µl of Precision Plus Protein Dual Colour Standards was
applied in one slot.
A staining for one hour with Roti-Blue quick was performed to view the bands of
stained protein. The band for SODs should appear at the size of ca. 18 kD.
15
3.4.4 Western blot
A Western blot is used as a method to detect a specific protein after gel
electrophoresis. Briefly, the proteins were transferred with the Trans-Blot Turbo
Transfer System from the gel to a Trans-Blot Turbo Transfer Pack membrane. After
blocking with 5% Non Fat Dry Milk (NFDM) in TBS-T (recipe in supplement) for 2
hours the membrane was probed with the Homo sapiens SOD1 rabbit polyclonal
antibody (1:1000) in 2.5% NFDM in TBS-T at 4°C overnight on a rotating roll
mixer. Colinet et al. already showed in their paper from 2011 [27], that the antibody
against human SOD1 also binds to insect SODs. The membrane was washed with
TBS-T 3 times for 10 min and reblocked with 10% NFDM in TBS-T at room
temperature. Afterwards the membrane got incubated with a goat anti-rabbit IgG
horseradish peroxidase (HRP) conjugate (1:25000) in 2.5% NFDM in TBS-T for one
hour and washed again as described above. Chemiluminescence signal detection was
performed by pouring chemiluminescent Pierce ECL Western Blotting Substrate
over the membrane which reacts with the HRP, and picturing the luminescence on a
sensitive CL-XPosure film.
3.4.5. In gel digestion of proteins
P. cochleariae was researched in relation to its proteome. For the analysis, protein
solution of Malpighian tubules, fat body (soluble and membrane fraction) and
haemolymph from the size 5 kD to 25 kD where cut out (9 pieces each) of a stained
SDS-PAGE gel, loaded with 20 µg total protein. Further processing like destaining,
digestion and mass spectrometric analyses was conducted by Dr. N. Wielsch and Y.
Hupfer from the proteomics department.
16
3.4.6 TCA precipitation of proteins
For TCA precipitation two replicates were assembled by pooling haemolymph of
2-3 P. cochleariae larvae respectively in 25 µl Ringer´s solution. The protein
solution was kept on ice and Sodium deoxycholate was added to 0.02% final
concentration. After vortexing and adding 10% TCA it was vortexed again and
incubated on ice for 1 hour. Afterwards the probe was centrifuged at maximum speed
and 4°C for 10 min. The supernatant was removed and the pellet was washed twice
with 100% acetone and then air dried. Following shotgun proteomics was conducted
by Dr. N. Wielsch and Y. Hupfer from the proteomics department.
3.5 Proteome analysis
Mass spectrometry data were processed with the software tool ProteinLynx
Global SERVER (PLGS) v.2.5. All yield peptide sequences were dedicated to a
protein by means of the Protein Basic Local Alignment Search Tool (BLAST) on the
National Center for Biotechnology Information (NCBI).
3.6 Statistics
Statistical tests were performed with Excel 2013. Standard deviation (SD) was
calculated to determine the level of statistical dispersion from the average. A two-
tailed test was performed to test the significance between two different groups.
Values were accepted as significant when P ≤ 0.05.

17
4 Results 4.1 Examinations of Cu,Zn-SODs in untreated P. cochleariae larvae
4.1.1 Relative expression in several tissues
Four SODs were examined in qPCR experiments: the dominant cytosolic Cu,Zn-
SOD (SOD1.1) and three extracellular SODs (SOD3.1, SOD3.2, SOD3.3). For my
initial studies I performed qPCR analyses to reveal presence of the four SODs in the
different tissues of third-instar larvae of P. cochleariae. All four cDNA sequences
encode functional proteins which have been assayed as purified recombinant proteins
by Gretscher [47]. To minimise the standard deviation of expression levels the
expression data Gretscher collected for his work were added to my data set. His data
acquisition procedure was comparable to mine.
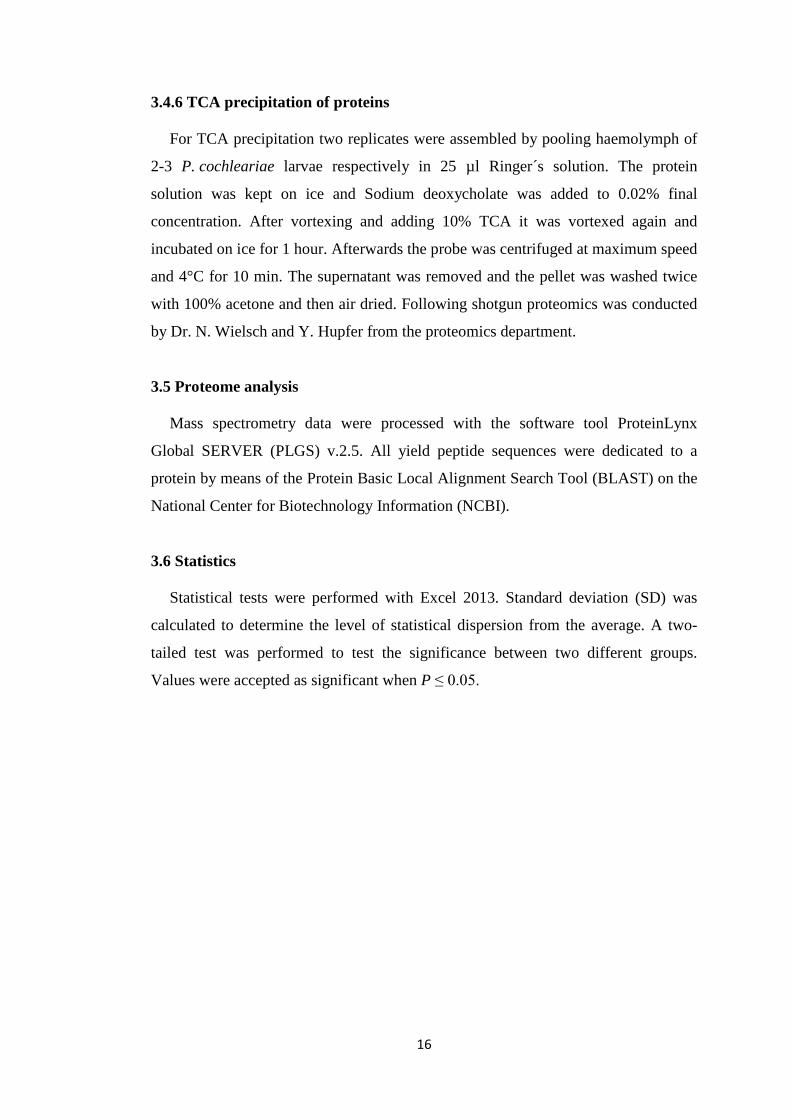
Visibly in Figure 6, the three extracellular SODs are differently expressed in the
tested tissues. In the glands, for example, sod3.1 showed a high relative expression
level (ΔCq-value ≈ 30) compared to the other sod genes. In fat body, gut and head
sod3.1 appeared to be dominantly expressed as well. In fat body tissue additionally
sod3.2 exhibited a high expression level. Malpighian tubules showed a relatively
high expression of sod3.3. As sod1.1 exhibited a comparable expression level (ΔCq-
value between 0.1 and 0.4) in every tested tissue, it seems to play a role in every
tissue.
The expression level of the sod’s was also measured in haemolymph, since Arbi et
al. adjudged the SOD in haemocytes of insects to take an active part in pathogen
defence [52]. Extracellular SODs are likely to be secreted into the haemocoel to
protect all tissues against oxidative stress. Consequently sod3 RNA may be present
in haemocytes as well. The results show that haemocytes indeed express extracellular
SODs but the standard deviation of the data is very high (ΔCq-value ± SD(sod3.1) =
0.77 ± 0.91).
18
Figure 6: expression level of sod’s in several tissues of juvenile P. cochleariae: Tissues of 3 larvae
were pooled for one sample. 4-12 biological replicates were examined. Reference genes were rps3 and
rpl6.
4.1.2 SOD activity after membrane protein isolation of several tissues
Not only the RNA, coding for the SODs, is available in those tissues, in vivo
experiments also allocated functionality for each SOD isozyme [47]. To determine
SOD activity in the tissues the SOD Determination Kit was used. An inhibition curve
was performed with bovine erythrocyte SOD to observe the perfect incubation time
with a good linearity of the slope (Inhibition curve in the supplement).
From human is known that extracellular SODs are bound to the extracellular
matrix and the protein can be secreted to protect tissues against antioxidants upon
proteolytic cleavage [27, 28, 34].
02468
rela
tive
expr
essio
n ±
SD
Fat body
sod1.1 sod3.1 sod3.2 sod3.3 0
1020304050
SOD 1.1 SOD 3.1 SOD 3.2 SOD 3.3rela
tive
expr
essio
n ±
SD
Glands
sod1.1 sod3.1 sod3.2 sod3.3
0.000.050.100.150.20
SOD1.1
SOD3.1
SOD3.2
SOD3.3
rela
tive
expr
essio
n ±
SD
Gut
sod1.1 sod3.1 sod3.2 sod3.3 02468
SOD 1.1 SOD 3.1 SOD 3.2 SOD 3.3rela
tive
expr
essio
n ±
SD
Malpighian tubules
sod1.1 sod3.1 sod3.2 sod3.3
0.00.20.40.60.8
SOD 1.1SOD 3.1SOD 3.2SOD 3.3rela
tive
expr
essio
n ±
SD
Head
sod1.1 sod3.1 sod3.2 sod3.3 0.00.51.01.52.0
SOD 1.1SOD 3.1SOD 3.2SOD 3.3rela
tive
expr
essio
n ±
SD
Haemolymph
sod1.1 sod3.1 sod3.2 sod3.3

19
Figure 7: SOD activity in cytosol- and membrane-fraction of fat body and
Malpighian tubules: tissues from 6 larvae were pooled in one probe and
proteins got separated into cytosolic and membrane proteins, protein
measurement was performed with BCA protein assay, 6 µg of total protein was
used.
0
20
40
60
80
100
fat bodycytosol
fat bodymembrane
M. tubulescytosol
M. tubulesmembrane
SOD
activ
ity (%
)
To see, if there is an activity of extracellular SODs in the membrane fraction of
P. cochelariae tissues an isolation of the membrane proteins had to be performed
before assaying the SOD activity. Hence, the cytosolic and membrane fraction of fat
body and Malpighian tubules got separated, followed by protein concentration
determination and SOD activity measurement.
In both tissues an activity in the membrane samples is visible (Fig. 7). However,
activity was higher in the cytosolic fractions compared to the membrane enriched
fraction.
4.1.3 Proteomics of different tissues and haemolymph
In gel digestion and following mass spectrometric analyses were conducted to
identify SODs in the complex protein mixture of fat body, Malpighian tubules and
haemolymph (identified SOD peptides in the supplement). Proteomics revealed that
there is SOD1 in fat body and Malpighian tubules. Even though extracellular SODs
were not detected in those two tissues by mass spectrometry SOD3.1 and SOD3.2
were found in haemolymph. Thus, existence of those extracellular proteins in the
haemolymph could be shown.
20
0
20
40
60
80
100
SOD1.1 SOD3.1 SOD3.2 SOD3.3
SOD
activ
ity (%
)
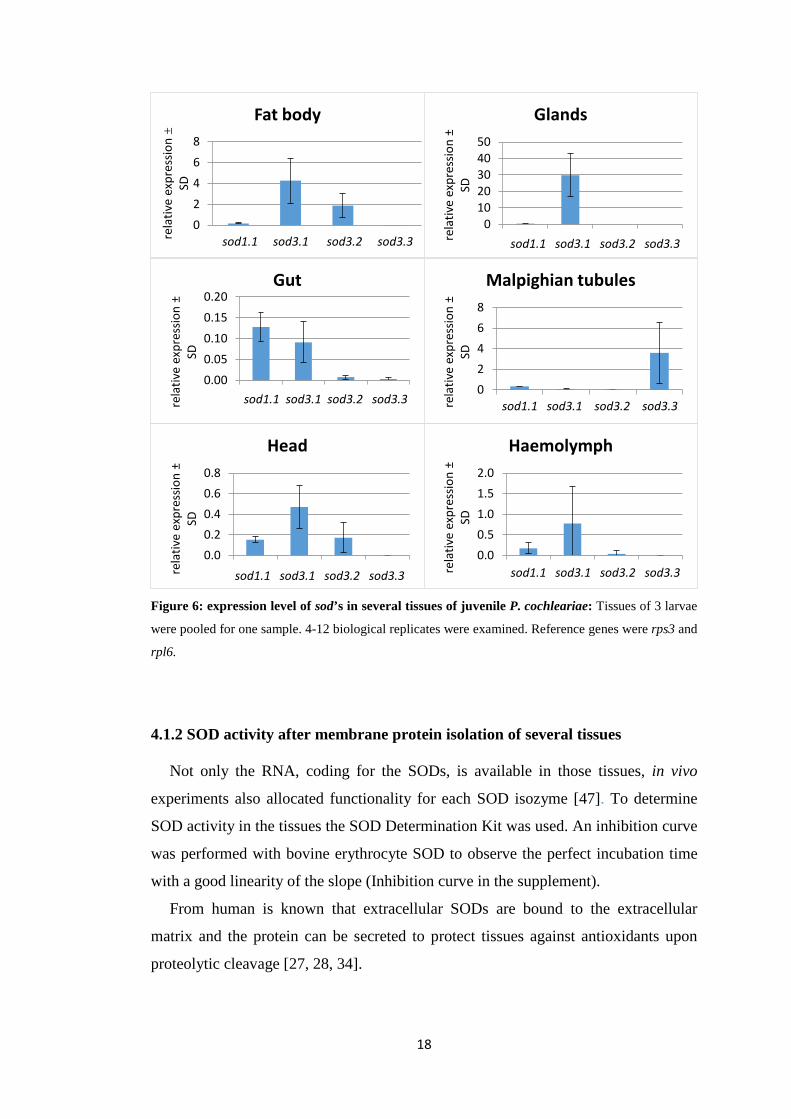
Figure 8: SOD activity of overexpressed protein from P. cochleariae: samples were produced from René R. Gretscher, 4 µg protein was used for activity determination, respectively.
4.2 Activity of overexpressed Cu,Zn-SODs
In order to demonstrate in vitro activity of extracellular Cu,Zn-SODs in
P. cochleariae all enzymes have been expressed heterologously in E. coli and
purified subsequently from René R. Gretscher. The SOD activity assay, conducted
by myself, revealed interesting results. Whereas cellular SOD1.1 and extracellular
SODs 3.1 and 3.3 show a visible activity, SOD3.2 shows an activity by only ~ 1%
(Fig. 8).
4.3 Cu,Zn-SODs in P. cochleariae larvae infected by M. anisopliae
4.3.1 Relative expression after varying time of fungal exposure
Based on the infection experiments by Gretscher [47] demonstrating implication
of extracellular SOD3.1 in the defence against fungal pathogens by using
M. anisopliae, my first intention was to test if the fungal infection causes an
induction of SOD activity on the transcript level of the extracellular SOD3.1,
SOD3.2, SOD3.3 and the cytosolic SOD1.1. Therefore, the effects of infection were
examined first on whole larvae 1 to 6 days after infection of early third-instar larvae
(Fig. 9).
21
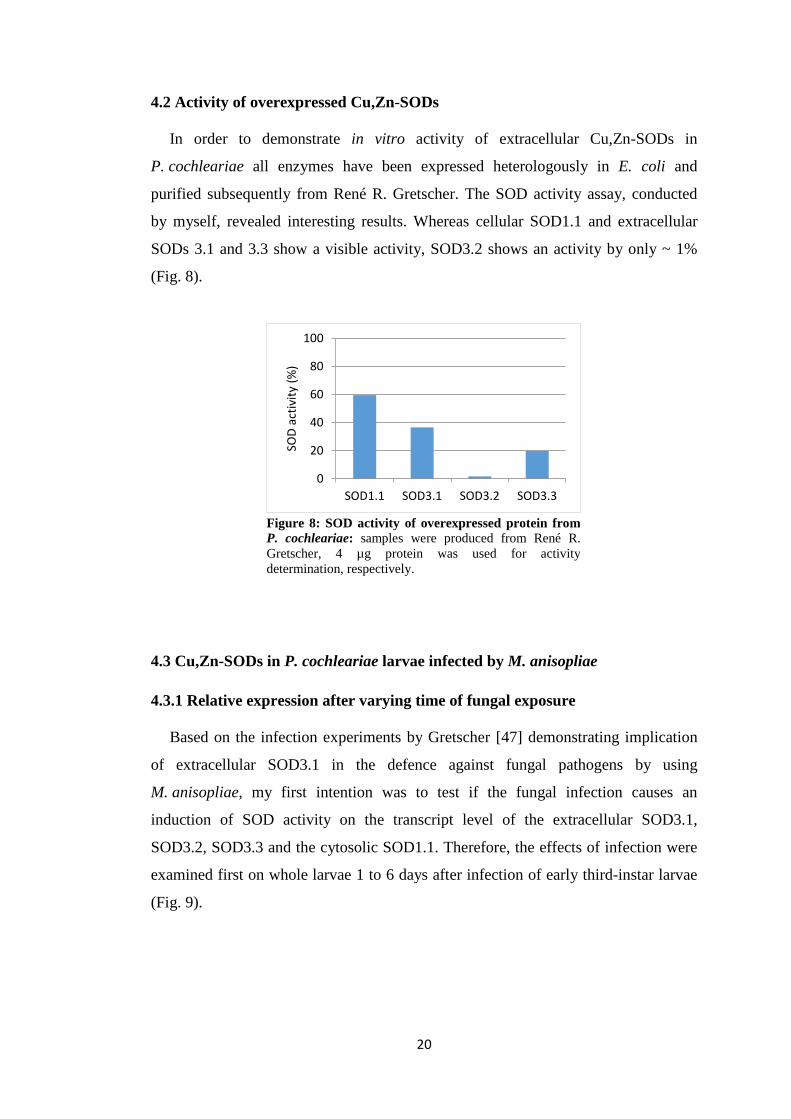
Figure 9: expression level of sod’s in whole P. cochleariae larvae 1
to 6 days after infection with M. anisopliae: uninfected and infected
larvae in comparison, 1 to 6 biological replicates of whole larvae were examined.
* = significantly different to their non-infected group
As can be seen from the graph above a difference in expression levels exists.
Noticeable is that sod’s in infected larvae often show a higher expression than in
uninfected larvae, as expected. From day to day the difference between values of
control and infected group seems to decrease and the standard deviation of the data
increases until the mean value of relative expression in infected larvae on day 6 is
lower in all examined sod’s, beside sod3.3, than the mean expression level of the
control group.
Since there is no statistical significant differences between the non-infected and
infected groups (P > 0.05) except in the results of sod1.1 (P = 0.045) and sod3.2
(P = 0.048) on day 2, further investigation was done with larvae which were exposed
to M. anisopliae for 2 days.
02468
10
SOD 1.1 SOD 3.1 SOD 3.2 SOD 3.3rela
tive
expr
essio
n ±
SD
Day 1
sod1.1 sod3.1 sod3.2 sod3.3 0
2
4
6
8
SOD 1.1 SOD 3.1 SOD 3.2 SOD 3.3rela
tive
expr
essio
n ±
SD
Day 2
*
sod1.1 sod3.1 sod3.2 sod3.3
*
012345
SOD 1.1 SOD 3.1 SOD 3.2 SOD 3.3rela
tive
expr
essio
n ±
SD
Day 3
sod1.1 sod3.1 sod3.2 sod3.3 0
2
4
6
8
SOD 1.1 SOD 3.1 SOD 3.2 SOD 3.3rela
tive
expr
essio
n ±
SD
Day 4
sod1.1 sod3.1 sod3.2 sod3.3
0
2
4
6
8
SOD 1.1 SOD 3.1 SOD 3.2 SOD 3.3
rela
tive
expr
essio
n ±
SD
Day 5
sod1.1 sod3.1 sod3.2 sod3.3 0.0
0.5
1.0
1.5
2.0
SOD 1.1 SOD 3.1 SOD 3.2 SOD 3.3rela
tive
expr
essio
n ±
SD
Day 6
sod1.1 sod3.1 sod3.2 sod3.3

22
0.00.40.81.21.62.0
SOD 1.1 SOD 3.1SOD 3.2SOD 3.3rela
tive
expr
essio
n ±
SD
Malpighian tubules
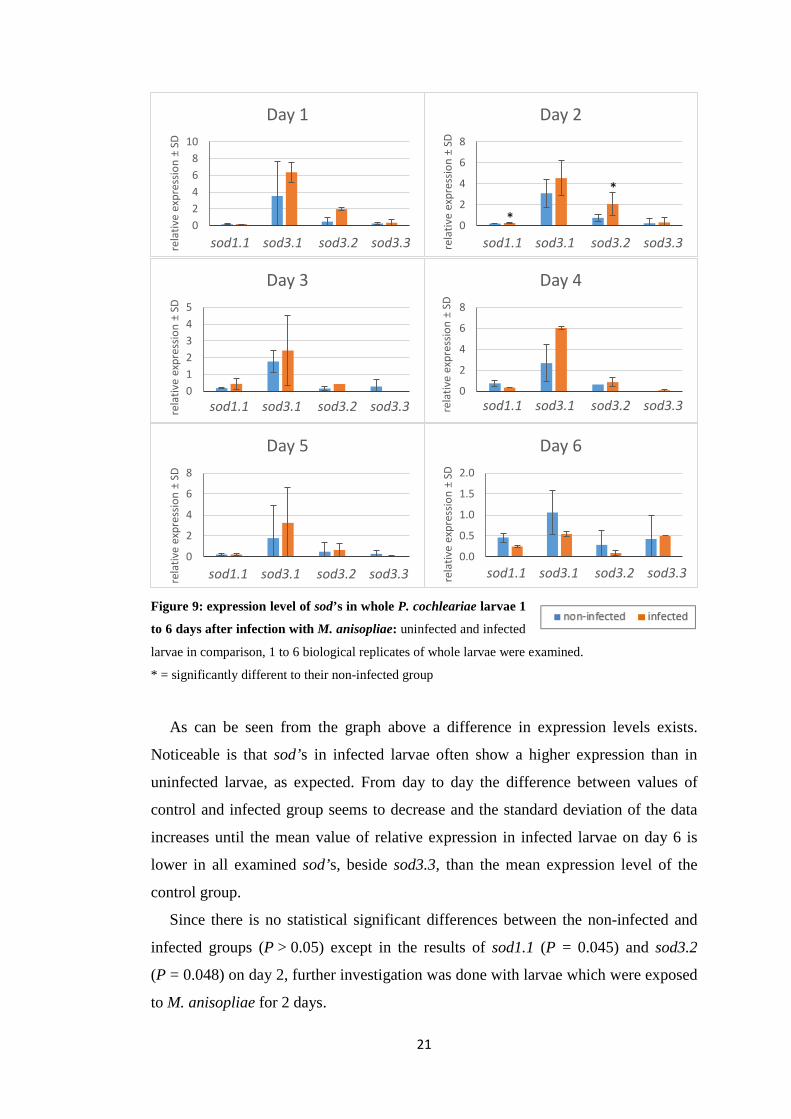
Figure 10: expression level of sod’s in several tissues of P. cochleariae 2 days after infection with
M. anisopliae: Tissues of 3 larvae were pooled for one sample. Whole larva samples contain one
larva. 3 replicates were examined.
* = significantly different to its non-infected group (P = 0.026).
4.3.2 Relative expression in several tissues 2 days after infection
Following these results, expression levels were also tested in tissues 2 days after
infection (Fig. 10). The analysis of the expression level, however, revealed high
standard deviations of the data, so that no significant difference could be detected
between infected and non-infected larvae, except for sod3.1 in the glands where
infected larvae show a significantly lower expression level than uninfected. Even
though the expression level in whole larvae seemingly increases after infection
(Fig. 9), this effect could not be confirmed in the examined tissues.
4.4 Extracellular SODs after RNAi in infected P. cochleariae larvae
To investigate if extracellular SODs actually play a role in defence against the
pathogen in P. cochleariae, as supposed from Gretscher [47], I conducted further
SOD silencing experiments. For example, it has not been clarified before, whether
other SODs can take over the function of a silenced SOD when needed.
0
5
10
15
SOD 1.1 SOD 3.1 SOD 3.2 SOD 3.3rela
tive
expr
essio
n ±
SD
Fat body
0
10
20
30
SOD 1.1 SOD 3.1 SOD 3.2 SOD 3.3rela
tive
expr
essio
n ±
SD
Glands
*
23
4.4.1 Silenced SOD3.1 via RNAi
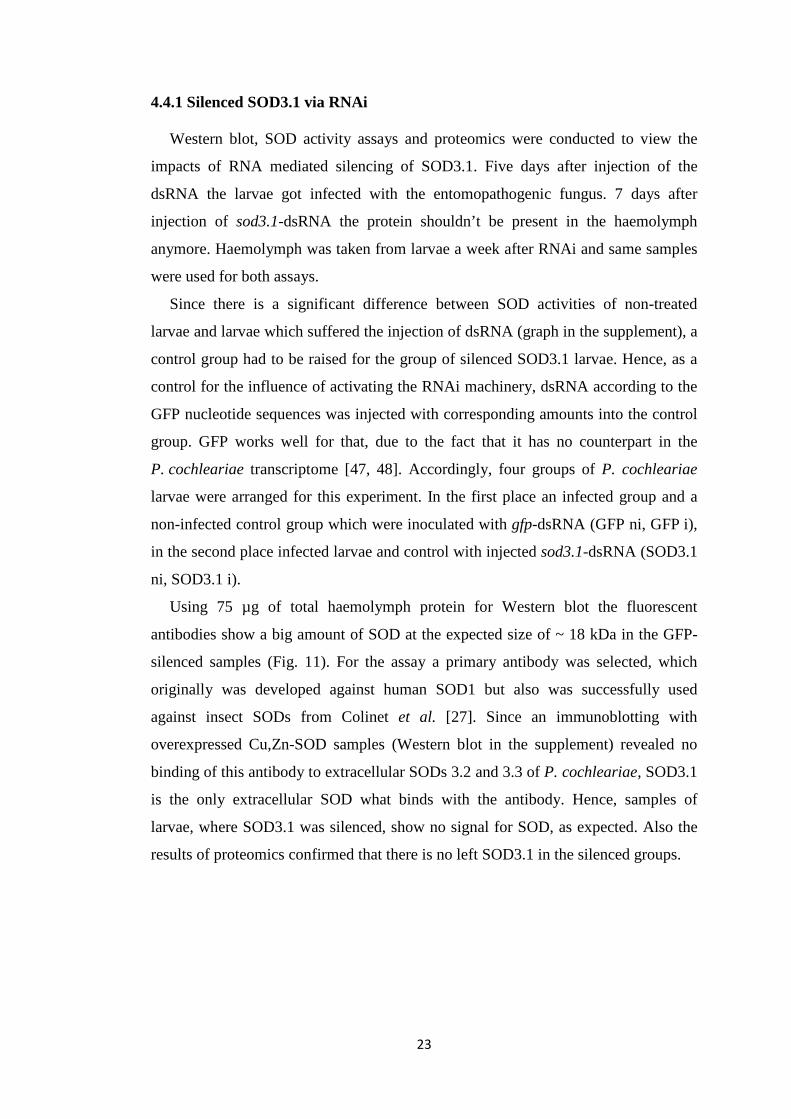
Western blot, SOD activity assays and proteomics were conducted to view the
impacts of RNA mediated silencing of SOD3.1. Five days after injection of the
dsRNA the larvae got infected with the entomopathogenic fungus. 7 days after
injection of sod3.1-dsRNA the protein shouldn’t be present in the haemolymph
anymore. Haemolymph was taken from larvae a week after RNAi and same samples
were used for both assays.
Since there is a significant difference between SOD activities of non-treated
larvae and larvae which suffered the injection of dsRNA (graph in the supplement), a
control group had to be raised for the group of silenced SOD3.1 larvae. Hence, as a
control for the influence of activating the RNAi machinery, dsRNA according to the
GFP nucleotide sequences was injected with corresponding amounts into the control
group. GFP works well for that, due to the fact that it has no counterpart in the
P. cochleariae transcriptome [47, 48]. Accordingly, four groups of P. cochleariae
larvae were arranged for this experiment. In the first place an infected group and a
non-infected control group which were inoculated with gfp-dsRNA (GFP ni, GFP i),
in the second place infected larvae and control with injected sod3.1-dsRNA (SOD3.1
ni, SOD3.1 i).
Using 75 µg of total haemolymph protein for Western blot the fluorescent
antibodies show a big amount of SOD at the expected size of ~ 18 kDa in the GFP-
silenced samples (Fig. 11). For the assay a primary antibody was selected, which
originally was developed against human SOD1 but also was successfully used
against insect SODs from Colinet et al. [27]. Since an immunoblotting with
overexpressed Cu,Zn-SOD samples (Western blot in the supplement) revealed no
binding of this antibody to extracellular SODs 3.2 and 3.3 of P. cochleariae, SOD3.1
is the only extracellular SOD what binds with the antibody. Hence, samples of
larvae, where SOD3.1 was silenced, show no signal for SOD, as expected. Also the
results of proteomics confirmed that there is no left SOD3.1 in the silenced groups.
24
Figure 11: Immunoblotting experiment after RNAi: a) SDS-gel with total haemolymph protein; b)
Western blot of SODs: infection 5 days after injection of dsRNA, dissection 2 days after infection, 75
µg of total haemolymph protein was evenly applied.
a) b)
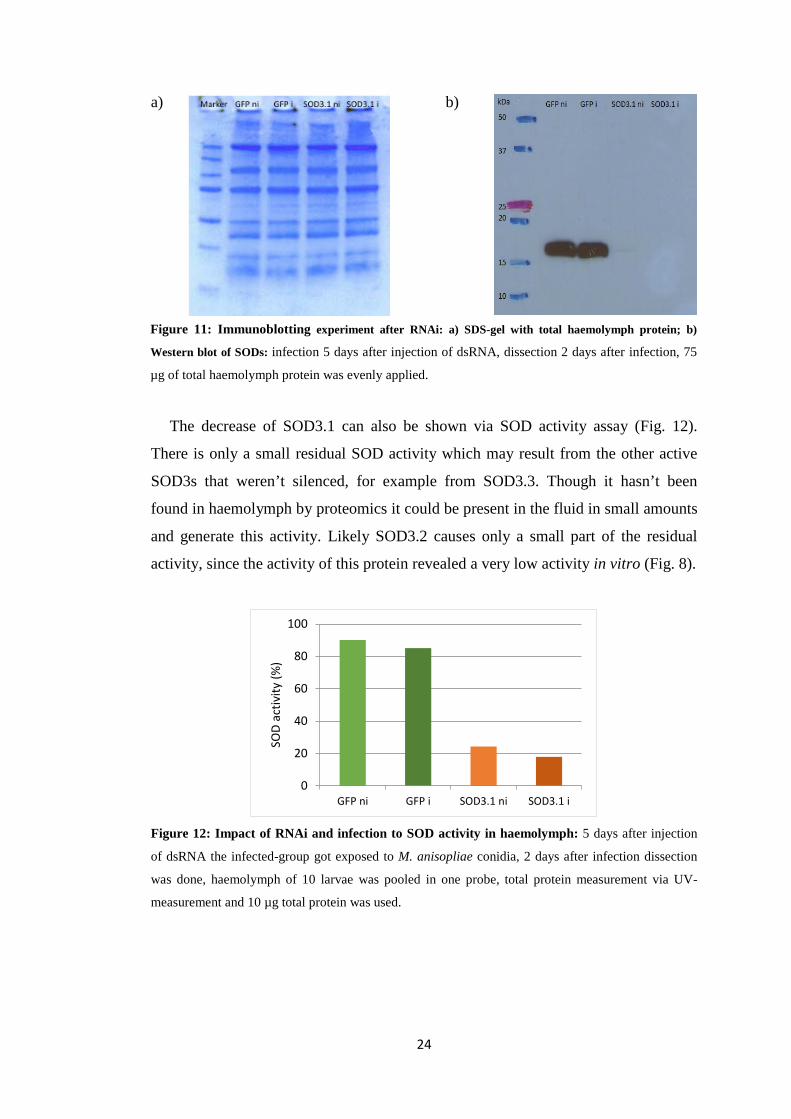
The decrease of SOD3.1 can also be shown via SOD activity assay (Fig. 12).
There is only a small residual SOD activity which may result from the other active
SOD3s that weren’t silenced, for example from SOD3.3. Though it hasn’t been
found in haemolymph by proteomics it could be present in the fluid in small amounts
and generate this activity. Likely SOD3.2 causes only a small part of the residual
activity, since the activity of this protein revealed a very low activity in vitro (Fig. 8).
Figure 12: Impact of RNAi and infection to SOD activity in haemolymph: 5 days after injection
of dsRNA the infected-group got exposed to M. anisopliae conidia, 2 days after infection dissection
was done, haemolymph of 10 larvae was pooled in one probe, total protein measurement via UV-
measurement and 10 µg total protein was used.
0
20
40
60
80
100
GFP ni GFP i SOD3.1 ni SOD3.1 i
SOD
activ
ity (%
)

25
The loss of any SOD signal and protein and the decrease in SOD activity reveals a
successfully executed protein silencing in the course of a week. The difference
between the infected (i) larvae and the non-infected (ni) larvae of each group wasn’t
though statistically distinguishable in both cases (GFP and SOD3.1). Due to the
material decrease of SOD activity after RNAi (Fig. 12) it can be suggested that the
dominant extracellular SOD in P. cochleariae is the SOD3.1.
4.4.2 Effects of RNAi of extracellular SOD isozymes in infected P. cochleariae
larvae
To find out if SOD3.1 is the most important extracellular SOD responsible for the
activity in the haemolymph, the impact of an infection in P. cochleariae larvae on
silenced extracellular SODs was examined in a final experiment. In addition to the 4
groups (GFP ni, GFP i, SOD3.1 ni and SOD3.1 i) arranged in the experiments before,
2 more groups were generated. One group of juvenile P. cochleariae with silenced
sod3.2-RNA (SOD3.2) and one with silenced sod3.3-RNA (SOD3.3). The SOD-
activity was measured in different tissues by activity assay, respectively.
26
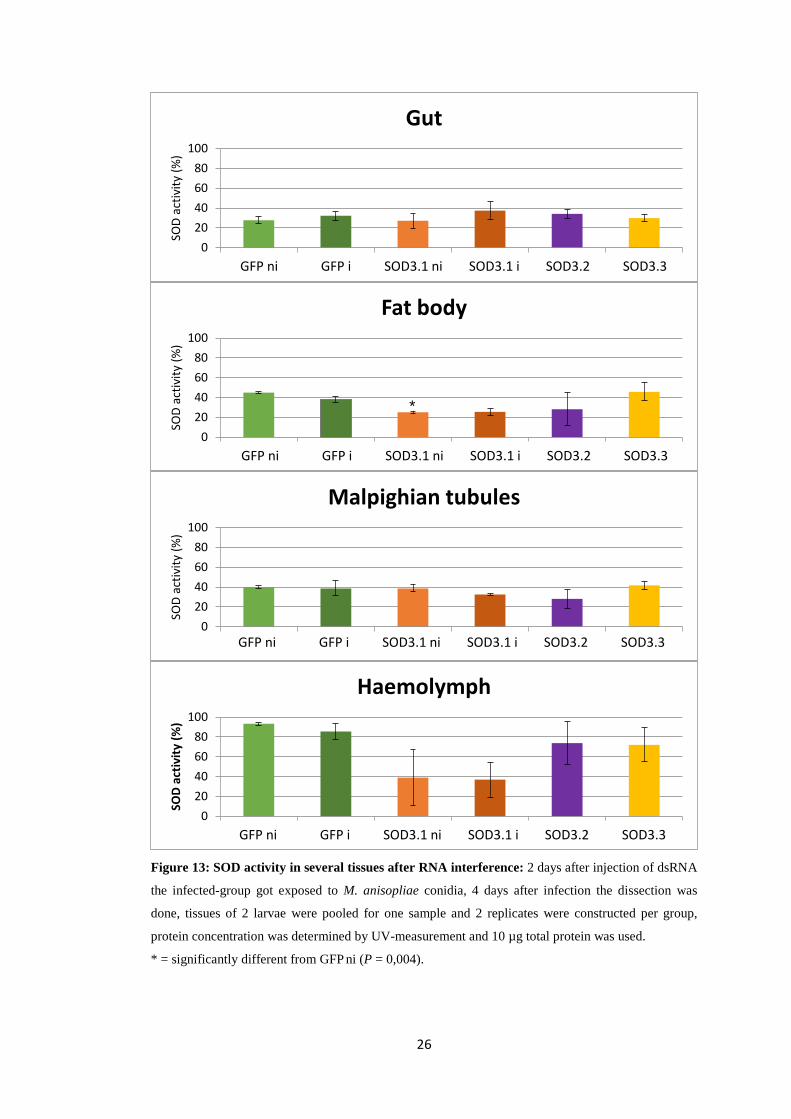
Figure 13: SOD activity in several tissues after RNA interference: 2 days after injection of dsRNA
the infected-group got exposed to M. anisopliae conidia, 4 days after infection the dissection was
done, tissues of 2 larvae were pooled for one sample and 2 replicates were constructed per group,
protein concentration was determined by UV-measurement and 10 µg total protein was used.
* = significantly different from GFP ni (P = 0,004).
020406080
100
GFP c GFP i SOD 3.1 c SOD 3.1 i SOD 3.2 SOD 3.3
SOD
activ
ity (%
)
Gut
GFP ni GFP i SOD3.1 ni SOD3.1 i SOD3.2 SOD3.3
020406080
100
GFP c GFP i SOD 3.1 c SOD 3.1 i SOD 3.2 SOD 3.3
SOD
activ
ity (%
)
Fat body
GFP ni GFP i SOD3.1 ni SOD3.1 i SOD3.2 SOD3.3
020406080
100
GFP c GFP i SOD 3.1 c SOD 3.1 i SOD 3.2 SOD 3.3
SOD
activ
ity (%
)
Malpighian tubules
GFP ni GFP i SOD3.1 ni SOD3.1 i SOD3.2 SOD3.3
020406080
100
GFP c GFP i SOD 3.1 c SOD 3.1 i SOD 3.2 SOD 3.3
SOD
activ
ity (%
)
Haemolymph
GFP ni GFP i SOD3.1 ni SOD3.1 i SOD3.2 SOD3.3
*
27
As shown in Figure 13 the trend in gut-samples is, that the activity in SOD3.1 i
larvae is higher than in uninfected larvae. In the other tissues this effect could not be
shown. There is no big difference between the SOD activities of the three silenced
SOD groups in gut, which leads to the assumption, that the extracellular SODs have
no distinguished activities in the gut. Only in fat body a significant difference
(P = 0,004) between GFP ni - and SOD3.1 ni - SOD activity could be calculated. The
other SOD3s, however, show no decreased SOD activity. In Malpighian tubules no
significant difference could be recognised. Even though in qPCR a high sod3.3
expression was discovered the SOD activity in SOD3.3 larvae seems to be equal or
even higher than in the control. In haemolymph a very high SOD activity (~85 %)
could be shown in larvae which were inoculated with GFP-dsRNA. Whereas activity
is visibly lower in SOD3.1 larvae, SOD3.2 and SOD3.3 don’t show such a big
change in activity.
With regard to the increased time of exposure to the entomopathogenic fungus, no
significant differences in SOD activity could be shown, but a tendency to an elevated
activity is visible (cf. Fig. 12 and 13).

28
5 Discussion and Conclusions
SOD is an enzyme in the cellular defence system in P. cochleariae larvae.
According to previous research [27, 46, 47] extracellular SODs play an important
role in the defence against pathogens in insects, which in this work was examined for
P. cochleariae.
5.1 Complex Cu,Zn-sod expression and SOD activity in tissues of juvenile
P. cochleariae
For the start expression of Cu,Zn-SODs was analysed in P. cochleariae. Zhu et al.
already did that 2014 for the yellow mealworm beetle, Tenebrio molitor and found
an expression of intra- and extracellular Cu,Zn-SODs in cuticle, fat body and
haemocytes in all major developmental stages [53].
My performed qPCR analysis to reveal localisation of all Cu,Zn-SODs also
indicate a complex expression pattern in the P. cochleariae larvae. While the
cytosolic SOD1.1 is expressed in every examined tissue in comparable amounts, the
extracellular SOD3s are not expressed similarly in all tissues.
In glands, for example sod3.1 is expressed solely and especially high. High
expression of extracellular Cu,Zn-sod’s can also be found in fat body (sod3.1 and
3.2) and Malpighian tubules (sod3.3). For the haemocytes no statement was possible
in terms of the expression level of sod’s, but as haemocytes are the main cellular
element in the immune system [28] it is still supposable that haemocytes express
extracellular Cu,Zn-SODs, as it was recorded in T. molitor [53].
It is referred, that expression of sod3 is restricted to a few cell types in divers
tissues in mammals [54]. My results point out that the expression of extracellular
Cu,Zn-sods in P. cochleariae is ubiquitous in the whole larvae. Only sod3.3 is likely
to be expressed tissue specific in Malpighian tubules. The proteins rather
demonstrate a constitutively expression in the larvae and hence, a complex SOD
defence reaction with all parts of their body.
29
5.2 Extracellular SODs in the haemolymph
Studies exist where insect Cu,Zn-SOD activity was examined via recombinant
proteins in transfected or transformed cells [27, 46] in vitro. In my work, besides in
vitro examinations, haemolymph of the living P. cochleariae larva was tested for its
SOD activity and the total protein was analysed by shotgun proteomics.
The activity determination of heterologously expressed P. cochleariae Cu,Zn-
SODs revealed a strongly reduced activity of SOD3.2 compared to the other SODs
what most likely is caused by amino acid exchanges in their active centre. The
histidine which is important for metal cation binding and catalysis got replaced by
proline and asparagine (H85→P85, H102→N102) (alignment in the supplement).
Activity assay though, revealed a high SOD activity in haemolymph. Hence,
although proteomics proved the existence of the extracellular SODs 3.1 and 3.2 in
the fluid (without haemocytes) the shown SOD activity derives most likely only from
SOD3.1.
Jung et al. revealed 2011, that the SOD3 protein from D. melanogaster is secreted
as soon as it is synthesised [46], what could be applied for those in P. cochleariae as
well. The SOD activity demonstrated an activity for the membrane fraction in fat
body and Malpighian tubules. Extracellular SODs though couldn’t be detected by
proteomics, what could be due to very low SOD3 protein concentrations in the
membrane which might have been below the detection limit of the proteome
analysis. It is also possible that the shown activities in the membrane fractions result
from cytosolic SODs which probably occur because of an incomplete membrane
separation by the method used.
Thus, and because the extracellular SOD from P. cochleariae has no matrix-
binding element, it seems most likely that the extracellular variants are not associated
with the membrane but directly excreted into the extracellular fluid, to give an
protection for the whole body of the larvae. The high expression levels in fat body
suggest that synthesis of the SODs 3.1 and 3.2 which occur in the haemolymph
appears in this tissue.
30
Even though expression level of sod3.3 was very high in Malpighian tubules, the
protein couldn’t be found in any examined tissue by proteomics. It could be, that the
sod3.3 mRNA isn’t translated into protein or rather very low concentrations of the
protein exist in the tissues so that it wasn’t detectable by proteomics. It’s also
possible that SOD3.3 is routed directly into the nucleus of the Malpighian tubules
cells to protect genomic DNA and nuclear proteins against antioxidants [34].
Because of a sample preparation which couldn’t break the nucleus the SOD3.3 might
not have been found via proteome analyses. If this is the case, a different sample
preparation should be considered to also gain all nuclear proteins in the sample.
Based on my data I suggest that extracellular SOD3.1 and SOD3.2 are secreted
into the haemolymph and are most likely not attached to the extracellular matrix as
known from the homologous human SOD3s [35]. SOD3.2 though doesn’t show
much activity what points out that this protein hasn’t a crucial role in P. cochleariae
and SOD3.1 is the most important extracellular SOD in the haemolymph.
5.3 SOD defence reaction to parasitization by M. anisopliae
There is evidence that SOD3 plays a crucial role in the immune response of
arthropods like crustacean [55] and insects [27, 46, 53, 56]. During the phagocytosis
of a pathogen by haemocytes ROS is built in insects [39-42] and extracellular SODs
are supposed in those studies to exhibit a protective effect against this oxidative
stress.
Also Gretscher [47] showed, that mortality in P. cochleariae was increased and
pupal weight was reduced after exposure to the entomopathogenic fungus
M. anisopliae, indicating a major role of the extracellular SOD3.1 in the defence
against this fungus. To pursue these results I examined the expression level of the
sods after infection and studied the impact of infection to the SOD activity of SOD-
silenced larvae.

31
5.3.1 Effects on transcriptional level
My qPCR experiments on whole infected larvae revealed the strongest effects two
days after infection with M. anisopliae as the expression levels were elevated in the
infected larvae. Research on different tissues two days after infection with the
entomopathogenous fungus, however, couldn’t prove this effect because the standard
deviation was very high (especially in the tissues of the infected larvae). That every
larva reacts slightly different to the procedure of infection with the fungus is
supposable. In 2 days the defence reaction of each larva might be differently
advanced, so that this variance of the data appears.
As the expression level still is increased in the whole infected larvae, I assume the
larvae exhibit a complex SOD defence reaction with all parts of their body.
5.3.2 Effects on SOD protein activity
According to Gretscher [47] P. cochleariae SOD3.1 is implicated in the defence
against this fungus. To follow these results up I invented SOD silencing experiments,
where SOD3.1, SOD3.2 or SOD3.3 got silenced. That should also clarify the role of
the other extracellular SODs in P. cochleariae in the pathogen defence and show if
SODs are capable to complement the function of a silenced SOD.
Due to RNAi SOD proteins can be silenced, which was important for further
experiments. The procedure of silencing sod3.1 indeed led to nearly no residual SOD
protein in haemolymph (Fig. 11, 12). With the considerable decrease of SOD activity
after RNAi with sod3.1 dsRNA (Fig. 12) it can be suggested, that the dominant
extracellular SOD in P. cochleariae is the SOD3.1. Also, it seems that no other SOD
is inducible after silencing SOD3.1 and fungal challenging of the immune response.
Since SOD3.2 doesn’t show an activity (Fig. 8) the role of this SOD is not
understood to date.
In my experiments SOD activity reflected the results of the qPCR in almost all
groups. Expression levels of SOD3s were low in the gut what explains why there is
no distinguishable difference in the SOD activities of the silenced groups. The
assumption is that extracellular SODs don’t have an active part in the gut.
In fat body a significantly lower SOD activity was shown in SOD3.1 ni-larvae
than in GFP ni-larvae. Also in haemolymph this effect could be exhibited. Thus,
SOD3.1 apparently has a great influence in both, fat body and haemolymph, what

32
can be verified by qPCR results. On the other hand the SOD3.3 group showed no
decrease of SOD activity in fat body, which is evidence that SOD3.3 is not crucial in
this tissue, which confirms the data from the qPCR as well.
In Malpighian tubules the SOD3.3 silenced group showed a slightly higher SOD
activity than the GFP group, although the silenced gene was expressed in a high level
in Malpighian tubules of untreated larvae and a huge decrease of the activity would
have been expected. On one hand is possible that other SODs took over the function
of SOD3.3 and compensate the loss. On the other hand, as described above, it is
more likely that the protein isn’t built in the first place or that it is routed directly into
the nucleus of the cells. When the nucleus couldn’t be broken by the sample
preparation used SOD3.3 might not show its activity in the assay and thus, the little
difference between the activities only derives from natural physiological differences
between the larvae.
Since SOD activity assay only shows activity of SODs in general, research on the
amount of the different SOD3 proteins in the samples should be done by proteomics.
Pilot proteomic analyses did not identify an additional SOD enzyme (for example
SOD3.3) after silencing mentioned SODs and M. anisopliae treatment. This led to
the hypothesis, that the extracellular SOD3.1 is the most important functional
extracellular SOD in the haemolymph of P. cochleariae whose function could´t be
complemented by another SOD.
In the RNAi experiments SOD activity between uninfected and infected larvae
was compared, but no significant difference could be ascertained, although
expression level was shown to be inducible upon fungal infection. It is possible that
differences in protein activity after infection only appear after a few more days, what
remains to be examined.
33
6 Future directions
The results gained in this thesis already deliver a good insight into the role and the
regulation of extracellular SODs in P. cochleariae, but still there are many issues to
handle before a total understanding of the pathogen defence processes regarding
extracellular SODs in the leaf beetle larvae.
For the start an infected group of larvae could be designed also for SOD3.2- and
SOD3.3-silenced larvae, to examine if there are any effects of infection with
M. anisopliae on those SODs. Especially for haemolymph samples, more than the
fluid of 2 larvae should be pooled in one sample to have enough protein for all
required tests.
Although expression of sod’s was induced in whole larvae following
parasitization by M. anisopliae, no significant increase of protein activity from non-
infected to infected larvae could be detected neither after 2 days of exposure nor after
4 days. To see if the induced expression still leads to an increased protein amount it
would be expedient to research the SOD activity after a few more days of exposure.
For this purpose younger larvae would needed to be infected with the fungus, since
the pathogen needs room temperature to develop, but also development of the larvae
proceeds more quickly and pupation seemed to start earlier when they were exposed
to the fungus.
The results also revealed that SOD3.2 shows no activity in vitro. Hence, the
function of this extracellular SOD is not clear and should be examined in future
researches. It would be interesting to find out if the sod3.3 mRNA gets translated
into a protein in the first place and if so, where the protein occurs in the larva.
A great finding is the fact that extracellular SODs get secreted into the
haemolymph and were proven to actually exist in the fluid by proteomics. For better
quantification of the proteins the program should be checked with regard to its ability
to distinguish between the sequences. Then proteomics could reveal the amount of
actual produced protein and disclose the question from which tissue secretion occurs.
To gain a holistic pattern of the sod expression a differential gene expression
analyses between all components of untreated and infected larvae could be conducted
after RNAi of each SOD3s. With the results it will get more clearly in which
physiological processes SODs are involved in the P. cochleariae larvae.

34
7 Summary
Since insects encounter lots of pathogens in nature, they developed strategies to
defend themselves from intruders [57]. Often during the defence reaction of the host
reactive oxygen species are built which, in turn, is highly cytotoxic [39-42, 44]. Here
superoxide dismutases (SODs) serve as a protective enzymes by turning superoxide
anions into harmless compounds [14]. These enzymes are metalloproteins and can be
found in nearly all parts of a cell [19, 22]. A particular role has the extracellular
Cu,Zn-SOD (SOD3) which has a signal peptide and can be secreted into the nucleus
or extracellular fluids [34, 35]. In insects the function of these proteins is not
completely understood and there is only a few examples published to date. Still there
is evidence that SOD3 has a crucial role in the immune response in insects, for
example in the leaf beetle Phaedon cochleariae [47].
Following up the work of Gretscher, the regulation of SOD3s was examined in the
larvae of P. cochleariae following parasitization with the entomopathogenic fungus
Metarhizium anisopliae in vivo.
My studies revealed that sod3s are ubiquitous expressed in the whole larvae and
as Tang et al. 2012 and Zhu et al. 2014 [53, 56] already indicated in other insects, the
expression in the P. cochleariae larvae is inducible upon fungal infection. Since that
induction couldn’t be confirmed in the selected tissues a complex SOD defence
reaction with all parts of the larval body can be suggested.
Furthermore, in this work extracellular SODs could be shown to exist in the
haemolymph of an insect through proteomics for the first time, to my knowledge.
This enzyme is most likely not attached to the extracellular matrix, but secreted as
soon as it is synthesised, as Jung et al. also revealed 2011 for Drosophila
melanogaster [46]. As production site of the secreted SODs fat body is suggested.
From my results I can also assume, that SOD3.1 is the most important functional
SOD3 in the haemolymph of P. cochleariae and that its function is not
complemented by another SOD. The function of SOD3.2 though is not understood to
date since it doesn’t show an activity in vitro. Especially protein quantification by
proteomics and differential expression are now owing and would contribute to a
better understanding of extracellular SODs in the physiology of insects and their
regulation after treatment with pathogens.
35
8 Zusammenfassung
Da Insekten in der Natur vielen Pathogenen ausgesetzt sind, entwickelten sie im
Laufe der Evolution Strategien um sich gegen diese zur Wehr zu setzen [57]. Oft
werden während solchen Abwehrreaktionen jedoch reaktive Sauerstoffspezies
freigesetzt, welche wiederum stark zytotoxisch wirken [39-42, 44].
Superoxiddismutasen (SODs) dienen dann als schützende Enzyme indem sie die
Superoxidanionen in ungefährliche Stoffe umwandeln [14]. Diese Metalloproteine
sind in fast allen Bestandteilen einer Zelle zu finden [19, 22]. Neben den
zytosolischen SODs gibt es auch extrazelluläre Cu,Zn-SODs (SOD3), die durch ein
Signalpeptid in den Zellkern oder ins extrazelluläre Medium sekretiert werden
können [34, 35]. In Insekten ist die Funktion dieser Proteine noch nicht komplett
verstanden. Dennoch gibt es schon Hinweise darauf, dass die SOD3 eine wichtige
Rolle in der Immunantwort von Insekten spielt, wie zum Beispiel in dem Blattkäfer
Phaedon cochleariae [47].
Auf die Arbeit von Gretscher aufbauend, wurde hier die Regulation der SOD3s in
den Larven von P. cochleariae nach Infektion mit dem entomopathogenen Pilz
Metarhizium anisopliae in vivo untersucht.
Meine Untersuchungen enthüllten, dass sod3-Gene universell in der gesamten
Larve exprimiert werden und, wie Tang et al. 2012 und Zhu et al. 2014 [53, 56]
schon für andere Insekten berichteten, die Expression auch in P. cochleariae-Larven
durch eine Pilzinfektion angekurbelt wird. Da dieser Effekt jedoch nicht in
ausgewählten Geweben der Larve bestätigt werden konnte, wird eine komplexe
SOD-Abwehrreaktion über den gesamten larvalen Körper vermutet.
Des Weiteren konnte, meines Wissens nach, zum ersten Mal mit dieser Arbeit
über Proteomik gezeigt werden, dass extrazelluläre SODs in der Hämolymphe eines
Insekts vorhanden sind. Die SOD3.1 spielt dabei die wichtigste Rolle. Das Enzym ist
sehr wahrscheinlich nicht an der extrazellulären Matrix gebunden, sondern wird,
sobald es synthetisiert wurde, von der Zelle sekretiert, wie auch Jung et al 2011 für
Drosophila melanogaster zeigen konnten [46]. Als Produktionsort der sekretierten
SODs ist der Fettkörper wahrscheinlich.
36
Durch meine Ergebnisse kann man annehmen, dass die SOD3.1 die wichtigste
funktionelle SOD3 in der Hämolymphe von P. cochleariae ist und dass deren
Funktion nicht durch eine andere SOD vervollständigt werden kann. Die Funktion
der SOD3.2 bleibt hier unverstanden, da diese in vitro keine Aktivität aufzeigt.
Besonders die Quantifizierung der Proteinmengen durch Proteomik und eine
differentielle Expression stehen noch aus und würden zu einem besseren Verständnis
der extrazellulären SODs in Insekten und deren Regulation nach Behandlung mit
einem Pathogen beisteuern.
a
A References 1. Lyons, T.W., C.T. Reinhard, and N.J. Planavsky, The rise of oxygen in Earth's early
ocean and atmosphere. Nature, 2014. 506(7488): p. 307-15. 2. Berg, J.M., L. Stryer, and J.L. Tymoczko, Stryer Biochemie. 7th ed. 2013, Heidelberg:
Springer-Verlag Berlin Heidelberg. 3. Gerschman, R., et al., Oxygen poisoning and x-irradiation: a mechanism in common.
Science, 1954. 119(3097): p. 623-6. 4. Miller, D.M., G.R. Buettner, and S.D. Aust, Transition metals as catalysts of
"autoxidation" reactions. Free Radic Biol Med, 1990. 8(1): p. 95-108. 5. Nohl, H., Generation of superoxide radicals as byproduct of cellular respiration. Ann
Biol Clin (Paris), 1994. 52(3): p. 199-204. 6. Raymond, J. and D. Segre, The effect of oxygen on biochemical networks and the
evolution of complex life. Science, 2006. 311(5768): p. 1764-7. 7. Valko, M., H. Morris, and M.T. Cronin, Metals, toxicity and oxidative stress. Curr
Med Chem, 2005. 12(10): p. 1161-208. 8. Johnson, F. and C. Giulivi, Superoxide dismutases and their impact upon human
health. Mol Aspects Med, 2005. 26(4-5): p. 340-52. 9. Jomova, K. and M. Valko, Advances in metal-induced oxidative stress and human
disease. Toxicology, 2011. 283(2-3): p. 65-87. 10. Valko, M., et al., Free radicals and antioxidants in normal physiological functions
and human disease. Int J Biochem Cell Biol, 2007. 39(1): p. 44-84. 11. Bannister, J.V., W.H. Bannister, and G. Rotilio, Aspects of the structure, function,
and applications of superoxide dismutase. CRC Crit Rev Biochem, 1987. 22(2): p. 111-80.
12. Fridovich, I., Superoxide Dismutases. Adv in Enzymol Relat Areas Mol Biol, 1987. 58: p. 61-97.
13. Miller, A.F., Superoxide dismutases: ancient enzymes and new insights. FEBS Lett, 2012. 586(5): p. 585-95.
14. Miller, A., Superoxide dismutases: active sites that save, but a protein that kills. Curr Opin Chem Biol., 2004. 8(2): p. 162-8.
15. Bafana, A., et al., The basic and applied aspects of superoxide dismutase. Journal of Molecular Catalysis B: Enzymatic, 2010. 68(2): p. 129-138.
16. Turrens, J.F., Superoxide Dismutase and Catalase, in Comprehensive Toxicology. 2010, Elsevier: Kidlington. p. 219-227.
17. Liochev, S.I. and I. Fridovich, Mechanism of the peroxidase activity of Cu, Zn superoxide dismutase. Free Radic Biol Med, 2010. 48(12): p. 1565-9.
18. Liochev, S.I. and I. Fridovich, The effects of superoxide dismutase on H2O2 formation. Free Radic Biol Med, 2007. 42(10): p. 1465-9.
19. Okado-Matsumoto, A. and I. Fridovich, Subcellular distribution of superoxide dismutases (SOD) in rat liver: Cu,Zn-SOD in mitochondria. J Biol Chem, 2001. 276(42): p. 38388-93.
20. Fattman, C.L., L.M. Schaefer, and T.D. Oury, Extracellular superoxide dismutase in biology and medicine. Free Radic Biol Med, 2003. 35(3): p. 236-56.
21. Marklund, S.L., Extracellular Superoxide Dismutase in Human Tissues and Human Cell Lines. J. Clin. Invest., 1982. 74(4): p. 1398-1403.
22. Nozik-Grayck, E., H.B. Suliman, and C.A. Piantadosi, Extracellular superoxide dismutase. Int J Biochem Cell Biol, 2005. 37(12): p. 2466-71.
23. Landis, G.N. and J. Tower, Superoxide dismutase evolution and life span regulation. Mech Ageing Dev, 2005. 126(3): p. 365-379.
24. Fattman, C.L., et al., Purification and characterization of extracellular superoxide dismutase in mouse lung. Biochem Biophys Res Commun, 2000. 275(2): p. 542-8.
b
25. Perry, J.J., et al., The structural biochemistry of the superoxide dismutases. Biochim Biophys Acta, 2010. 1804(2): p. 245-62.
26. Yogavel, M., et al., Structure of a superoxide dismutase and implications for copper-ion chelation. Acta Crystallogr D Biol Crystallogr, 2008. D64(Pt 8): p. 892-901.
27. Colinet, D., et al., Extracellular superoxide dismutase in insects: characterization, function, and interspecific variation in parasitoid wasp venom. J Biol Chem, 2011. 286(46): p. 40110-21.
28. Parker, J.D., K.M. Parker, and L. Keller, Molecular phylogenetic evidence for an extracellular Cu Zn superoxide dismutase gene in insects. Insect Mol Biol, 2004. 13(6): p. 587-94.
29. Hjalmarsson, K., et al., Isolation and sequence of complementary DNA encoding human extracellular superoxide dismutase. Proc Natl Acad Sci U S A, 1987. 84(18): p. 6340-4.
30. Antonyuk, S.V., et al., The structure of human extracellular copper-zinc superoxide dismutase at 1.7 A resolution: insights into heparin and collagen binding. J Mol Biol, 2009. 388(2): p. 310-26.
31. Sandström, J., et al., The heparin-binding domain of extracellular superoxide dismutase C and formation of variants with reduced heparin affinity. J Biol Chem, 1992. 267(25): p. 18205-9.
32. Nguyen, A.D., et al., Fibulin-5 is a novel binding protein for extracellular superoxide dismutase. Circ Res, 2004. 95(11): p. 1067-74.
33. Petersen, S.V., et al., Extracellular superoxide dismutase (EC-SOD) binds to type i collagen and protects against oxidative fragmentation. J Biol Chem, 2004. 279(14): p. 13705-10.
34. Fujii, M., et al., A novel superoxide dismutase gene encoding membrane-bound and extracellular isoforms by alternative splicing in Caenorhabditis elegans. DNA Res, 1998. 5(1): p. 25-30.
35. Marklund, S.L., Human copper-containing superoxide dismutase of high molecular weight. Proc Natl Acad Sci U S A, 1982. 79(24): p. 7634-8.
36. Juul, K., et al., Genetically reduced antioxidative protection and increased ischemic heart disease risk: The Copenhagen City Heart Study. Circulation, 2004. 109(1): p. 59-65.
37. Potter, S.Z. and J.S. Valentine, The perplexing role of copper-zinc superoxide dismutase in amyotrophic lateral sclerosis (Lou Gehrig's disease). J Biol Inorg Chem, 2003. 8(4): p. 373-80.
38. Valentine, J.S., P.A. Doucette, and S. Zittin Potter, Copper-zinc superoxide dismutase and amyotrophic lateral sclerosis. Annu Rev Biochem, 2005. 74: p. 563-93.
39. Munoz-Munoz, J.L., et al., Generation of hydrogen peroxide in the melanin biosynthesis pathway. Biochim Biophys Acta, 2009. 1794(7): p. 1017-29.
40. Nappi, A.J. and E. Vass, Cytotoxic reactions associated with insect immunity. Adv Exp Med Biol, 2001. 484: p. 329-48.
41. Nappi, A.J., et al., Superoxide anion generation in Drosophila during melanotic encapsulation of parasites. Eur J Cell Biol, 1995. 68(4): p. 450-6.
42. Pereira, L.S., et al., Production of reactive oxygen species by hemocytes from the cattle tick Boophilus microplus. Exp Parasitol, 2001. 99(2): p. 66-72.
43. Williams, M.J., Drosophila hemopoiesis and cellular immunity. J Immunol, 2007. 178(8): p. 4711-6.
44. Nappi, A.J. and B.M. Christensen, Melanogenesis and associated cytotoxic reactions: applications to insect innate immunity. Insect Biochem Mol Biol, 2005. 35(5): p. 443-59.
45. Forman, H.J., M. Maiorino, and F. Ursini, Signaling functions of reactive oxygen species. Biochemistry, 2010. 49(5): p. 835-42.
c
46. Jung, I., T.Y. Kim, and J. Kim-Ha, Identification of Drosophila SOD3 and its protective role against phototoxic damage to cells. FEBS Lett, 2011. 585(12): p. 1973-8.
47. Gretscher, R.R., Molekularbiologische Analyse des chemischen Abwehrsystems bei Blattkäferlarven (Coleoptera:Chrysomelina): In vivo Validierung von Enzymen und Transportproteinen an essentiellen Schnittstellen des Defensiv-Metabolismus mittels RNA interference, in Max-Planck-Institut für Chemische Ökologie, Jena, Abteilung Bioorganische Chemie. 2013, Friedrich-Schiller-Universität: Jena.
48. Clark, D.P. and N. Pazdernik, Biotechnology - Applying the Genetic Revolution. 2009, Burlington, USA: Elsevier Inc.
49. Rostas, M. and M. Hilker, Indirect interactions between a phytopathogenic and an entomopathogenic fungus. Naturwissenschaften, 2003. 90(2): p. 63-7.
50. Gretscher, R.R., et al., Extracellular Superoxide-dismutases take an active part in fitness, oxidative stress and pathogen resistance in juvenile Phaedon cochleariae (Coleoptera: Chrysomelidae: Chrysomelina). M.-P.-I.f.c.e. Department of bioorganic chemistry, Editor. 2013: Jena, Germany.
51. ThermoScientific. BCA Protein Assay Reagent (bicinchoninic acid). 2014 [cited 2014 Oct. 22.]; Available from: http://www.piercenet.com/product/bca-protein-assay.
52. Arbi, M., et al., Hydrogen peroxide is produced by E. coli challenged haemocytes and regulates phagocytosis, in the medfly Ceratitis capitata. The active role of superoxide dismutase. Dev Comp Immunol, 2011. 35(8): p. 865-71.
53. Zhu, J.Y., et al., Parasitization by Scleroderma guani influences expression of superoxide dismutase genes in Tenebrio molitor. Arch Insect Biochem Physiol, 2014. 87(1): p. 40-52.
54. Zelko, I.N., T.J. Mariani, and R.J. Folz, Superoxide dismutase multigene family: a comparison of the CuZn-SOD (SOD1), Mn-SOD (SOD2), and EC-SOD (SOD3) gene structures, evolution, and expression. Free Radic Biol Med, 2002. 33(3): p. 337-49.
55. Johansson, M.W., et al., A cell-surface superoxide dismutase is a binding protein for peroxinectin, a cell-adhesive peroxidase in crayfish. J Cell Sci, 1999. 112 ( Pt 6): p. 917-25.
56. Tang, T., et al., Molecular cloning and expression patterns of copper/zinc superoxide dismutase and manganese superoxide dismutase in Musca domestica. Gene, 2012. 505(2): p. 211-20.
57. Dettner, K. and W. Peters, Lehrbuch der Entomologie. 2nd ed. 2003, Heidelberg: Spektrum Akademischer Verlag.
d
B Supplement List of used materials
Devices
Agilent 2100 Bioanalyzer Agilent technologies, Waldbronn
CFX96 Real-Time System Bio-Rad Laboratories GmbH, München
Electrophoresis Power Supply- EPS 600 Amersham Pharmacia Biotech Inc.,
Piscataway, NJ, USA
Eppendorf centrifuge 5417R Sigma Laborzentrifugen GmbH,
Osterode am Harz
Eppendorf Thermomixer comfort Eppendorf AG, Hamburg
LIM-3P-A Puller List Medical Electronic, Darmstadt
Microscope Axioskop Carl Zeiss Microscopy GmbH, Jena
Mini Protean Tetra Cell Bio-Rad Laboratories GmbH, München
Multi-Axle-Rotating-Mixer RM5 Ingenieurbüro CAT, M. Zipper GmbH,
Staufen
Nano2010 Injector World Precision Instruments Inc.,
Sarasota, FL, USA
NanoVue Spectrophotometer GE Healthcare Europe GmbH, Freiburg
pH-Meter InoLab Wissenschaftlich Technische
Werkstätten, Weilheim
Spectra Max 250 microplate reader Molecular Devices GmbH, Biberach an
der Riss
Trans-Blot Turbo Transfer System Bio-Rad Laboratories GmbH, München
Zoom stereomicroscope Stemi DV4 Carl Zeiss AG, Jena
Organisms
Brassica rapa chinensis purchased at a commercial supermarket
Metarhizium anisopliae DSM-1490, DSMZ, Braunschweig
Phaedon cochleariae – larvae lab-reared in the Max-Planck-Institute
for chemical ecology, Jena
e
Consumables
96-well flat bottom with lid Sarstedt, Inc., Newton, NC, USA
CL-XPosure Film 5x7 inches Thermo Fisher Scientific GmbH, Bonn
Dissecting set Fine Science Tools GmbH, Heidelberg
Glas capillary (Ø inside 0.5 mm) Hirschmann Laborgeräte GmbH & Co.
KG, Eberstadt
Hard-shell PCR plates, 96-well WHT/CLR Bio-Rad Laboratories GmbH, München
Microscope slide & cover glas Carl Roth GmbH & Co. KG, Karlsruhe
Mini-Protean TGX Precast Gels Bio-Rad Laboratories GmbH, München
Multiple Well Plate,
Neubauer improved haemocytometer Brand GmbH & Co. KG, Wertheim
Safe-Lock Tubes 1.5 ml Eppendorf AG, Hamburg
Trans-Blot Turbo Transfer Pack Bio-Rad Laboratories GmbH, München
Commercial kits
19160 SOD Determination Kit Sigma-Aldrich Chemie GmbH,
Steinheim
MEGAscript RNAi Kit Ambion Applied Biosystems, Hamburg
Native Membrane Protein Extraction Kit Calbiochem Proteo Extract, Darmstadt
Pierce BCA Protein Assay Kit Thermo Fisher Scientific GmbH, Bonn
RNA Nano Chip Agilent technologies, Waldbronn
RNAqueous-Micro Kit Ambion Applied Biosystems, Hamburg
SuperScript III Reverse Transcriptase Invitrogen, Darmstadt
f
Chemicals
2,4,6-Trichloroanisole (TCA) Sigma-Aldrich Chemie GmbH,
Steinheim
ß-Mercaptoethanol Sigma-Aldrich Chemie GmbH,
Steinheim
Bromphenol Blue Sigma-Aldrich Chemie GmbH,
Steinheim
Calcium chloride (CaCl2) Merck KGaA, Darmstadt
Dithiothreitol (DTT) Sigma-Aldrich Chemie GmbH,
Steinheim
Ethanol Merck KGaA, Darmstadt
Express Art NucleoGuard AmpTec GmbH, Hamburg
Glycerol Carl Roth GmbH & Co. KG, Karlsruhe
Glycine Serva Elektrophoresis GmbH,
Heidelberg
Hydrogen chloride (HCl) Carl Roth GmbH & Co. KG, Karlsruhe
Magnesium chloride hexahydrate
(MgCl2 x 6H2O) Carl Roth GmbH & Co. KG, Karlsruhe
Monopotassium phosphate (KH2PO4) Carl Roth GmbH & Co. KG, Karlsruhe
Monosodium phosphate (NaH2PO4) Sigma-Aldrich Chemie GmbH,
Steinheim
Non Fat Dry Milk (NFDF) Biomol GmbH, Hamburg
Nucleasse-Free Water Qiagen GmbH, Hilden
Pierce ECL Western Blotting Substrate Thermo Fisher Scientific GmbH, Bonn
Pipes Sigma-Aldrich Chemie GmbH,
Steinheim
Potassium chloride (KCl) Carl Roth GmbH & Co. KG, Karlsruhe
Potassium hydroxide (KOH) Carl Roth GmbH & Co. KG, Karlsruhe
Potato-Dextrose Broth (2% glucose) Sigma-Aldrich Chemie GmbH,
Steinheim
Protease-Inhibitor-Mix HP (100x) Serva Elektrophoresis GmbH,
Heidelberg
Roti-Blue quick Carl Roth GmbH & Co. KG, Karlsruhe
g
Sodium chloride (NaCl) Carl Roth GmbH & Co. KG, Karlsruhe
Sodium deoxycholate Thermo Fisher Scientific GmbH, Bonn
Sodium dodecyl sulfate (SDS) Carl Roth GmbH & Co. KG, Karlsruhe
Sucrose Carl Roth GmbH & Co. KG, Karlsruhe
SYBR Premix ExTaq II Takara Bio Inc., Otsu, Shiga, Japan
Tris(hydroxymethyl)aminomethane (Tris) Serva Elektrophoresis GmbH,
Heidelberg
Tween-20 Carl Roth GmbH & Co. KG, Karlsruhe
Antibodies
1. Rabbit anti-human SOD1 polyclonal IgG Abcam plc, Cambridge, UK
2. Goat anti-rabbit IgG with HRP Sigma-Aldrich Chemie GmbH,
Steinheim
Standards
Bovine erythrocyte SOD standard Sigma-Aldrich Chemie GmbH,
Steinheim
Bovine serum albumin standards (BSA) Serva Elektrophoresis GmbH,
Heidelberg
Precision Plus Protein Dual Color
Standards Bio-Rad Laboratories GmbH, München
Software
Basic local alignment search tool http://blast.ncbi.nlm.nih.gov/
CFX Manager 3.1 Bio-Rad Laboratories GmbH, München
Excel 2013 Microsoft Corporation, Redmond, WA,
USA
ProteinLynx Global SERVER v.2.5 Waters Corporation, Manchester, UK
h
Buffer recipes
2x RNAi injection buffer (pH 7.4): 1.4 mM NaCl
0.07 mM NaH2PO4
0.03 mM KH2PO4
4 mM KCl
In 100 ml Ringer´s solution (pH 7.0): 0,184 g NaCl
0,298 g KCl
0,017 g CaCl2
0,030 g MgCl2 X 6H2O
3,350 g Sucrose
0,605 g Pipes
Sterile filtration
10x SDS-PAGE running buffer (pH 8.6): 3.03% Tris (w/v)
14.4% Glycine (w/v)
1% SDS (w/v)
5x SDS loading buffer: 50% Glycerol (v/v)
30 mM Tris (pH 6.8)
25% ß-mercaptoethanol (v/v)
10% SDS (m/v)
0.002% Bromphenol blue (w/v)
0.1 M DTT
For 1 l 10x TBS (pH 7.6): 24.08 g Tris
80 g NaCl
13 ml 6 M HCl
TBS-T: add 1 ml of Tween-20 to 1 l of 1x TBS

i
Primer sequences
qPCR:
sod1.1 fwd. ATCATGATCTGGGCCACCATGC
rev. ACAACACCAACGGGTGCATTTCC
sod3.1 fwd. AAACATCGTAGCCGACGCAACAG
rev. TGCCGATGATGTTGTGGTTGC
sod3.2 fwd. TCAATGTGAGCGACGCCGAAAC
rev. TGGACCTTTCAATCCCCACAACG
sod3.3 fwd. GCGCGATGCCGTATTCGTCGG
rev. ATTGGATCAGGATGTCTGGCA
rps3 fwd. AAGGCTGTGAAGTTGTGGTATCTGG
rev. ATGGCGGGTGGCAGTGTCTAC
rpl6 fwd. CAAGACAGGATCAGACCTAGAC
rev. CACTCTCTTTCCTTTGTGGGAAC
dsRNA:
sod1.1 fwd. TAATACGACTCACTATAGGGAGACTCCAATGTGGCGAATA
rev. TAATACGACTCACTATAGGGAGATGCCTACAAAAGCAGTT
total length 243
sod3.1 fwd. TAATACGACTCACTATAGGGAGAACATCGTAGCCGACGCA
rev. TAATACGACTCACTATAGGGAGACCGATGACCCCGCAA
total length 193
sod3.2 fwd. TAATACGACTCACTATAGGGAGAGACTCCGCAAGCTATAC
rev. TAATACGACTCACTATAGGGAGACAAGTTTGTAGTAGCCG
total length 508
sod3.3 fwd. TAATACGACTCACTATAGGGAGATCGCGCTCCTGCGTG
rev. TAATACGACTCACTATAGGGAGACATCGAGGCCGACGAAT
total length 172
gfp fwd. TAATACGACTCACTATAGGGAGACCATGGCCAACACTTGT
rev. TAATACGACTCACTATAGGGAGATAATCCCAGCAGCAGTT
total length 523

j
Pictures of larvae and their breeding
Boxes where larvae were kept for rearing
Third-instar P. cochleariae larvae with extended defence glands and in peace, pictures were taken from Dr. S. Frick and Dr. A. Burse
P. cochleariae adults, pictures were taken from T. Faasen (www.koleopterologie.de/gallery/) and Dr. A. Burse

k
0
20
40
60
80
100
GFP ccontrol
SOD
activ
ity (%
)
control GFP
*
Pupation rate of P. cochleariae after 5 days in comparison
All larvae kept at 11 to 15 °C stay larval while at room temperature 3 pupate, more than half of infected larvae pupate when kept at room temperature.
Temperature Cold Room temperature Room temperature + infection
Total number of examined larvae
19 19 19
Still larval after 5 days
19 16 8
Pupated after 5 days 0 3 11
SOD inhibition curve
SOD standard inhibition curve: bovine erythrocyte SOD was used as a standard, 20 min incubation
time.
Comparison between untreated and dsRNA injected group
SOD activity in haemolymph of untreated larvae and larvae which suffered dsRNA injection: 6
days after injection the dissection was done, tissues of 2 larvae were pooled for one sample and 2-3
replicates were constructed per group, protein concentration was determined by UV-measurement and
10 µg total protein was used. * = significantly different from control (P = 0.001)
020406080
100
0.01 0.1 1 10 100 1000
inhi
bitio
n (%
)
SOD concentration (U/ml)
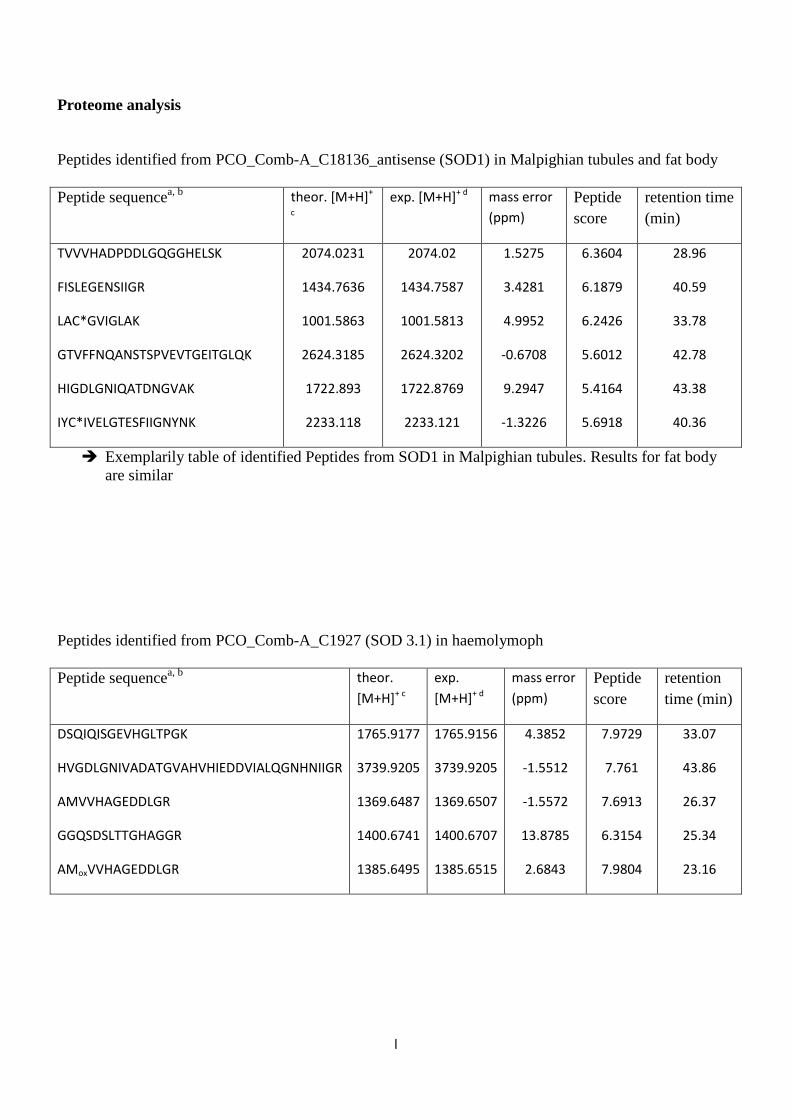
l
Proteome analysis
Peptides identified from PCO_Comb-A_C18136_antisense (SOD1) in Malpighian tubules and fat body Peptide sequencea, b theor. [M+H]+
c exp. [M+H]+ d mass error
(ppm) Peptide score
retention time (min)
TVVVHADPDDLGQGGHELSK
FISLEGENSIIGR
LAC*GVIGLAK
GTVFFNQANSTSPVEVTGEITGLQK
HIGDLGNIQATDNGVAK
IYC*IVELGTESFIIGNYNK
2074.0231
1434.7636
1001.5863
2624.3185
1722.893
2233.118
2074.02
1434.7587
1001.5813
2624.3202
1722.8769
2233.121
1.5275
3.4281
4.9952
-0.6708
9.2947
-1.3226
6.3604
6.1879
6.2426
5.6012
5.4164
5.6918
28.96
40.59
33.78
42.78
43.38
40.36
Exemplarily table of identified Peptides from SOD1 in Malpighian tubules. Results for fat body are similar
Peptides identified from PCO_Comb-A_C1927 (SOD 3.1) in haemolymoph Peptide sequencea, b theor.
[M+H]+ c exp. [M+H]+ d
mass error (ppm)
Peptide score
retention time (min)
DSQIQISGEVHGLTPGK
HVGDLGNIVADATGVAHVHIEDDVIALQGNHNIIGR
AMVVHAGEDDLGR
GGQSDSLTTGHAGGR
AMoxVVHAGEDDLGR
1765.9177
3739.9205
1369.6487
1400.6741
1385.6495
1765.9156
3739.9205
1369.6507
1400.6707
1385.6515
4.3852
-1.5512
-1.5572
13.8785
2.6843
7.9729
7.761
7.6913
6.3154
7.9804
33.07
43.86
26.37
25.34
23.16

m
Peptides identified from PCO-UC_C2881 or PCO_Comb-A_C11450 (SOD 3.2) in haemolymph Peptide sequencea, b theor.
[M+H]+ c exp. [M+H]+
d mass error (ppm)
Peptide score
retention time (min)
NTGDLGNVVGDR
FGVAHIDVVDKR
ITGEIHGIHEGK
GIDGIIGR
GC*IGAGGPFNPHNVR
GNNAESGKTGNSGGR
1216.6014
1355.7344
1290.6637
800.4588
1552.7408
1405.6543
1216.5986
1355.7367
1290.6663
800.46
1552.7418
1405.6495
5.6779
-4.6809
-10.6695
-3.0527
-1.3087
5.7156
7.9112
7.7084
7.5699
7.5104
7.2528
6.1109
28.06
30.36
21.63
31.62
29.52
29.74
a C*, C-carbamidomethylation; Mox, M-oxidation b unique peptides are underlined c theoretical monoisotopic mass of the peptide d calculated monoisotopic mass of the lock-mass corrected peptide ion cluster

n
Cu,Zn-SOD allignment
60 ....|....|....|....|....|....|....|....|....|....|....|....| PcSOD3.1 MFKFAVLAALIT-----ITYAQRSAVVYLFDPSGASGVHGNLTFEQR--DSQIQISGEVH PcSOD3.2 MFKFVVAVVLLSGTYQFCNCDVHSATVRLYDPTGNTEVTGELNFTQV--ENGVRITGEIH PcSOD3.3 MFGFAILAALMG-----LASAQRNAIVSLSDPAGVNGVYGNLSFESG--VASVRIIGEVS PcSOD1 --------------------MPTKAVCVLNG-----EVKGTVFFNQANSTSPVEVTGEIT HsSOD1 --------------------MATKAVCVLKGDG---PVQGIINFEQKESNGPVKVWGSIK 120 ....|....|....|....|....|....|....|....|....|....|....|....| PcSOD3.1 GLTPGKHGFHVHQLGNIGLGCLGTGGHFNPHNKHHGAPTDKERHVGDLGNIVADATGVAH PcSOD3.2 GIHEGKHGGHVHVDADISKGCIGAGGPFNPHNVRHAGPDDEIRNTGDLGNVVGDRFGVAH PcSOD3.3 GLCPGNHGLHIHQYGNIGSGCLATGGHFNPFGMNHGAPYDVDRHVGDLGNIEADEYGIAR PcSOD1 GLQKGLHGFHVHEFGDNTNGCISAGPHFNPRNVEHGGPDHDIRHIGDLGNIQATDNGVAK HsSOD1 GLTEGLHGFHVHEFGDNTAGCTSAGPHFNPLSRKHGGPKDEERHVGDLGNVTADKDGVAD 180 ....|....|....|....|....|....|....|....|....|....|....|....| PcSOD3.1 VHIEDDVIAL-QGNHNIIGRAMVVHAGEDDLGRGGQSDSLTTGHAGGRLACGVIGILTE- PcSOD3.2 IDVVDKRIKLNKGIDGIIGRGFVIHEKEDDLGRGNNAESGKTGNSGGRIACGVIEVLEE- PcSOD3.3 VDIEDYVIGL-LGIDAIMGRGVVVHAGEDDLGRGGQSDSLTTGHAGARLACGVIGVLTDQ PcSOD1 VNIKDKFISL-EGENSIIGRTVVVHADPDDLGQGGHELSKTTGNAGGRLACGVIGLAKI- HsSOD1 VSIEDSVISL-SGDHCIIGRTLVVHEKADDLGKGGNEESTKTGNAGSRLACGVIGIAQ-- Figure X: Multiple sequence alignment of Cu,Zn-SODs from P. cochleariae and H. sapiens: red amino acis residues: metal cation binding and catalysis; yellow residues: cysteines involved in disulfide bridges; green residues: N-glycosylation sites
Western blot of overexpressed SODs
Figure X: Western blot with overexpressed Cu,Zn-SOD samples: 200µg/ml of protein was applied, respectively, antibody doesn’t bind to SOD3.2 and SOD3.3

o
C Acknowledgement I want to thank Prof. Dr. Wilhelm Boland for giving me the opportunity to perform my bachelor thesis at his department and for accepting to be my first examiner.
Special thanks go to Dr. Antje Burse for the opportunity to work on such an interesting topic and for placing her trust into the work I did. Thanks for giving me plenty of good advice regarding the scientific writing of the thesis, for always having an open ear for my questions and helping me in every issues. Thanks for that marvellous supervision!
I also want to thank Dr. René R. Gretscher for providing me his collected data and material to use it in my thesis.
Many thanks to the group members in the lab for helping me with all technical question and for lab support. Special thanks to Toni Krause who familiarised me with the lab works at the Department of Bioorganic Chemistry. He always lent me a helping hand when I needed it.
Great thanks to Dr. Natalie Wielsch and Yvonne Hupfer from the Research Group Mass Spectrometry/Proteomics at the Max Planck Institute for Chemical Ecology for processing my samples and providing me the mass spectrometric data within the shortest possible time.
Thanks also to the Department of Biophysics at the Center for Molecular Biomedicine for providing me the devices for RNA interference. Special thanks to Angela Rossner who introduced me to the procedures and let me feel comfortable in the foreign environment.
Thank you to my family and friends for their constant support and for giving me a valuable balance to the work.

p
D Declaration of authorship Hiermit versichere ich, dass ich die vorliegende Arbeit selbstständig verfasst und
keine anderen als die angegebenen Quellen und Hilfsmittel benutzt habe.
______________________ _____________________________
Ort, Datum Unterschrift der Verfasserin