FREQUENCY SCANNING BASED RADAR SYSTEM Y. … · antenna array is presented. The method is conceived...
22
Progress In Electromagnetics Research, Vol. 132, 275–296, 2012 FREQUENCY SCANNING BASED RADAR SYSTEM Y. ´ Alvarez Lopez * , C. Garc´ ıa, C. V´ azquez, S. Ver-Hoeye, and F. Las-Heras ´ Area de Teor´ ıa de la Se˜ nal y Comunicaciones, Universidad de Oviedo, Edif, Polivalente, Mod. 8, Campus Universitario de Gij´on, E-33203, Gij´ on, Asturias, Spain Abstract—A novel imaging technique based on a frequency scanning antenna array is presented. The method is conceived to provide angular information in range-based radar systems which do not allow mechanical or electronic beam steering. The beam steering is changed with frequency, which requires a novel scattered field data processing scheme/algorithm to recover the SAR image. System features, advantages and limitations are discussed, presenting simulation and measurement results, which show the system capabilities to resolve the range and angular position of the objects. 1. INTRODUCTION The use of microwaves and mm-waves in imaging systems has become very common nowadays due to the advantages of this frequency band as non-ionizing electromagnetic field, the use of mature technology and the capacity to penetrate dielectric bodies. Because of these reasons, electromagnetic inverse techniques are attractive for non- invasive applications in different fields, such as security and defense applications for detecting concealed weapons and buried objects [1, 2], and medical diagnostics [3]. This contribution focuses on the profile reconstruction of metallic objects, which can be of interest for the detection of concealed weapons and buried objects. There are several techniques to deal with the profile reconstruction problem of metallic objects: one is the Linear Sampling Method [4], which determines if a point on the investigation domain belongs to the object-under-test (OUT) or not by solving a linear system of equations. Received 18 July 2012, Accepted 13 September 2012, Scheduled 1 October 2012 * Corresponding author: Yuri ´ Alvarez Lopez ([email protected]).
Transcript of FREQUENCY SCANNING BASED RADAR SYSTEM Y. … · antenna array is presented. The method is conceived...

Progress In Electromagnetics Research, Vol. 132, 275–296, 2012
FREQUENCY SCANNING BASED RADAR SYSTEM
Y. Alvarez Lopez*, C. Garcıa, C. Vazquez, S. Ver-Hoeye,and F. Las-Heras
Area de Teorıa de la Senal y Comunicaciones, Universidad de Oviedo,Edif, Polivalente, Mod. 8, Campus Universitario de Gijon, E-33203,Gijon, Asturias, Spain
Abstract—A novel imaging technique based on a frequency scanningantenna array is presented. The method is conceived to provideangular information in range-based radar systems which do not allowmechanical or electronic beam steering. The beam steering is changedwith frequency, which requires a novel scattered field data processingscheme/algorithm to recover the SAR image. System features,advantages and limitations are discussed, presenting simulation andmeasurement results, which show the system capabilities to resolvethe range and angular position of the objects.
1. INTRODUCTION
The use of microwaves and mm-waves in imaging systems has becomevery common nowadays due to the advantages of this frequency bandas non-ionizing electromagnetic field, the use of mature technologyand the capacity to penetrate dielectric bodies. Because of thesereasons, electromagnetic inverse techniques are attractive for non-invasive applications in different fields, such as security and defenseapplications for detecting concealed weapons and buried objects [1, 2],and medical diagnostics [3].
This contribution focuses on the profile reconstruction of metallicobjects, which can be of interest for the detection of concealed weaponsand buried objects. There are several techniques to deal with theprofile reconstruction problem of metallic objects: one is the LinearSampling Method [4], which determines if a point on the investigationdomain belongs to the object-under-test (OUT) or not by solving alinear system of equations.
Received 18 July 2012, Accepted 13 September 2012, Scheduled 1 October 2012
* Corresponding author: Yuri Alvarez Lopez ([email protected]).

276 Alvarez Lopez et al.
Other group of techniques is based on the so-called inverse sourcemethods [5–9]. In this case, a set of equivalent electric currents isreconstructed in a domain containing the OUT from the scattered fieldsamples. The highest amplitude values of the reconstructed currentscorrespond to the actual OUT profile.
Several techniques are based on an initial guess of the OUTprofile defined in base of some parameters (e.g., Fourier coefficients,splines, etc.). Then, this set of parameters is modified until findingone that satisfies an imposed boundary condition [10, 11]. The maindrawback of these methods is the need of solving a non-linear systemof equations, usually carried out by means of global search techniquesthat minimize a cost function relating the boundary conditions and theprofile parameters. The Contrast Source Inversion (CSI), a well-knownprofile reconstruction technique [12] can be classified in this category.
Finally, Synthetic Aperture Radar (SAR) is one of the mostwidely used radar imaging methods [13–15]. Again, a linear expressionrelating the scattered field acquisition domain and the reconstructiondomain (where the SAR image is formed) is used, allowing the useof a Fast Fourier Transform in the case of canonical domains (planar,cylindrical, spherical), providing fast imaging capabilities. Due to theadvantages of simplicity and fast calculations, this is the reconstructionmethod to be used in this contribution.
Apart from the methods used for processing the information,another classification of inverse techniques comes from the setupconfiguration. In general, accurate profile reconstruction requiresrange (depth) and cross-range (angular position) information. Underthe assumption of mechanically fixed transmitter and receiver in amonostatic configuration, range information is provided by the radarsystem bandwidth. Cross-range information can be achieved: i) Byusing fixed-beam antennas, and placing the OUT on top of a rotaryplatform. ii) By means of beamscanning systems. Sometimes, rotationof the OUT is not possible, thus leaving beamscanning methods asthe only way to gather cross-range information, which is given by theknowledge of the beam steering angle [16, 17].
This contribution analyzes the possibility of obtaining rangeand cross-range information using frequency scanning antenna arrays.Frequency scanning antennas have been widely used for differentapplications [18–21] but hardly for imaging purposes [22]. Here,the idea is to scan the OUT so that the beam steering anglechanges with frequency, illuminating different regions of the OUTfor different frequencies. In consequence, frequency scanning imagingsystems exhibit a trade-off between available range and cross-rangeinformation, which is studied in this contribution.

Progress In Electromagnetics Research, Vol. 132, 2012 277
2. DESCRIPTION OF THE METHOD
The method proposed in this contribution is based on the use ofa frequency scanning antenna array (FSAA). In this configuration,the transmitting and receiving antennas are fixed, and no mechanicalor phaseshifters-based electronically beam steering alteration of theacquisition set-up is allowed.
This type of configuration in which no beam scanning is involvedleads to a range-based radar, providing information in terms of thedistance from the targets to the radar, i.e., range information.
Angular position information is provided by beam steering-based systems. In the case of mechanically rotated antennas (e.g.,primary radars), the main drawback is the cost of the radiofrequencyrotary joint and the mechanical parts maintenance, especially at high
Angular position
Frequency
(range)
p0
f0
f1
fN
f
p1
p p
f2
f
p2
p3
p
…
…
…
…
…
…
…
… … … … … … …Fixed beam
Frequency scanning
Beam scanning
range
OUT
OUT
angular-position
N - 1
N - 2
M - 2 M - 1 M
Figure 1. Analysis of the range and angular position informationavailable depending on the measurement system to be used. Frequencyscanning is an intermediate system in terms of amount of informationprovided.

278 Alvarez Lopez et al.
frequencies. The use of active antenna arrays with electronically-controlled phase shifters is another option, but again the technological(and economical) complexity may limit its deployment [16, 17].
Figure 1 summarizes the concepts of range-based radars (fixedantenna beam) and beam-scanning systems, showing the amount ofinformation provided in each case. It can be observed that beam-scanning systems are the extension of range-based radars for a set ofangular positions (or steering directions). In the case of range-basedradars, the system resolution is given by the frequency bandwidth.Angular resolution of beam scanning systems is determined by theantenna beamwidth.
Frequency scanning is an intermediate technique between beamscanning methods that provide good range and angular resolution andthe use of an antenna with a constant beam direction, which onlyprovides range resolution. The frequency scanning systems provide atrade-off between angular and range resolution, as shown in Figure 2.
The problem of the frequency scanning is intrinsic to the techniqueas the bandwidth for a fixed steering angle is zero (see Figure 1), or,in other words, changing the frequency modifies the beam steering.
To deal with this drawback, several solutions have been proposed.One is the traditional SAR processing [13–15]: the SAR image atevery frequency is formed using the scattered field information. Tocombine the SAR images at every frequency, each one is multiplied bythe conjugate of the incident field of the array (which also changes withfrequency), then all the contributions are added [2, 23]. This techniquehas been tested, obtaining typically a blurred SAR image where thescatterers could not be clearly distinguished. In consequence, this kind
(a) (b)
Figure 2. Resolution cells when using (a) frequency scanning antennaarray, (b) horn antenna (or any other kind of fixed beam antenna).

Progress In Electromagnetics Research, Vol. 132, 2012 279
OUT
∆BW1
S1
S2
S3
S4
S5
S '6
OUT
∆BW2
∆BW3
∆BW4
∆BW5
∆BW6
'
'
'
''
Figure 3. Subdivision of the frequency scanning bandwidth infrequency windows (∆BWn), each one having associated an angularregion S′n of the reconstruction domain.
of processing was discarded.A second approach is based on a windowing technique. The
method works under the assumption that, for a given frequency window∆BW , the OUT region illuminated by the beam is assumed to bethe same (it is considered that the beam position variation is smallwithin ∆BW ). In consequence, the whole frequency bandwidth ofthe FSAA is divided into several ∆BWn windows, that are associatedwith angular regions (S′n) defined on the reconstruction domain (seeFigure 3).
The profile reconstruction for every n-th frequency window ∆BWn
is performed by using the traditional SAR imaging: a SAR image isretrieved in the entire reconstruction domain (not only in the currentS′n) using the scattered field information belonging to the ∆BWn
frequency window. If the angular region S′n associated with the∆BWn frequency window is small enough, SAR image blurring dueto the displacement of the beam steering inside the ∆BWn frequencybandwidth is negligible in that S′n domain.
Frequency scanning imaging requires the knowledge of the FSAAbeam steering characteristics. An accurate way to determine itsbehavior is by measuring the antenna array radiation pattern in thefrequency bandwidth, and calculating the beam steering angle for everyfrequency. Once the relationship between frequency and beam steeringangle is known, it is possible to define the angular regions S′n associatedwith every ∆BWn.

280 Alvarez Lopez et al.
The SAR image reflectivity on each angular region S′n is then givenby:
ρnrec
(~r′q
)=
[M∑
m=1
Emeas (fm, ~r) ej〈Einc(fm,~r′q)〉ejk0R
]·W (~r′q)
fm ∈ ∆BWn W(~r′q
)=
1 ~r′q ∈ S′n
0 ~r′q /∈ S′nR =
∣∣~r − ~r′q∣∣ ,
(1)
where Emeas (fm, ~r) is the measured or simulated scattered field(copolar component) observed at the point defined by the positionvector ~r at the frequency fm. k0 is the wavenumber, k0 = 2π/λ.M is the number of discrete frequencies within the interval ∆BWn.〈Einc(fm, ~r′q)〉 is the phase of the incident electric field radiated bythe FSAA, evaluated in the reconstruction domain point definedby the vector ~r′q. R is the distance between the position of thetransmitting/receiving antennas (~r) and the reconstruction domainpoints (~r′q). And ρn
rec(~r′q) is the reflectivity on the ~r′q point associated
with the ∆BWn frequency window. A window function, W (~r′q),
2 m
30 cm
2 m
E inc
E scatt
de
dZ
in
x
y
Figure 4. Upper plot: evaluation scheme of the frequency scanningantenna array (FSAA) imaging capabilities. Lower plot: basic layoutof the FSAA.

Progress In Electromagnetics Research, Vol. 132, 2012 281
is introduced to define the angular region S′n associated with thecorresponding frequency window ∆BWn, so that the reflectivity valuesretrieved outside the current angular region are discarded.
Thus, the trade-off between range and cross-range accuracydepends on the frequency window bandwidth. Small ∆BW givesaccurate angular position, but poor range resolution, and vice-versa.
3. RADAR SYSTEM EVALUATION
In order to analyze the frequency scanning imaging features, atheoretical frequency scanning array is used as transmitting antenna,assuming an omnidirectional antenna receiver. The array works inthe 26 to 34 GHz frequency band. FSAA elements, emitting withTE polarization, are separated de = 9 mm (de = 0.9λ at the centerfrequency of 30 GHz). The parameter d defines the series feed linelength, that determines the FSAA phaseshift [24]. Figure 4 representsthe proposed simulation test bed, in which detection capabilities of theFSAA are tested for different parameters: number of FSAA elements(N), series feed line length (d), and frequency window bandwidth(∆BW ).
The first step is the definition of the frequency — beam steeringangle relationship. FSAA radiation pattern is evaluated from 26 to
Fre
qu
en
cy (
ran
ge
), in
GH
z
Normalized amplitude (dB)
Distance (cross-range), in m
Figure 5. Normalized electric field (amplitude, in dB) radiated by thefrequency scanning antenna array at different frequencies and distancesalong a line placed 2m away from the Tx/Rx. N = 15, de = 0.9λ,d = 1.2λ.

282 Alvarez Lopez et al.
34GHz in 50 MHz steps. Figure 5 represents the frequency-distancerelationship evaluated along a line placed 2 m away from the Tx/Rxantennas, which are placed in the position x = 0, y = +2 m (seeFigure 4). Simulation FSAA parameters are N = 15, de = 0.9λ, d =1.2λ. A phase correction is applied to have a broadside configuration at30GHz. The same analysis can be done for different FSAA parameters,obtaining different frequency-distance plots. Obviously, the FSAAbeam steering is given by the maximum amplitude of the pattern(white color in Figure 5). From the results depicted in Figure 5, it is
x axis (m)
x axis (m)
x axis (m)
y a
xis
(m
)y a
xis
(m
)y a
xis
(m
)
Norm
aliz
ed a
mplit
ude (
dB
)
(a)
(b)
(c)
Figure 6. SAR image when the FSAA elements are (a) N = 3,(b) N = 9, (c) N = 15. For all the cases, de = 0.9λ, d = 1.2λ,∆BW = 400 MHz.
Progress In Electromagnetics Research, Vol. 132, 2012 283
also possible to extract the cross-range resolution: assuming a −10 dBbeamwidth criterion, the cross-range resolution is 20 cm at the centerfrequency (30 GHz), meaning that 2 objects separated more than 20 cmin cross-range could be distinguished.
The next step is the definition of the reconstruction domain. A100× 40 cm domain is defined, enclosing two metallic flat plates whichare chosen to evaluate the FSAA imaging system detection capabilities.The metallic plates are 6 cm wide in x axis, and 20 cm long in the zaxis (perpendicular to the reconstruction domain). Physical Opticscode is used to synthesize the scattered field data (forward problem).A comparison with a commercial MoM has been performed, findingnegligible discrepancies between the results provided by both methods.
First, imaging capabilities for different number of FSAA elementsare tested. Figure 6 shows the reconstructed SAR images for N = 3,N = 9 and N = 15 elements, with de = 0.9λ, d = 1.2λ, ∆BW =400MHz. In the first case (Figure 6(a)), the wide beamwidth ofthe FSAA antenna does not provide enough angular resolution todistinguish the two metallic bars, while FSAA with N = 9 and N = 15do. It must be remarked that secondary lobes of the FSAA mayproduce echoes in the retrieved SAR image, as observed in Figure 6(c),so just increasing the number of FSAA elements does not ensure betterresolution.
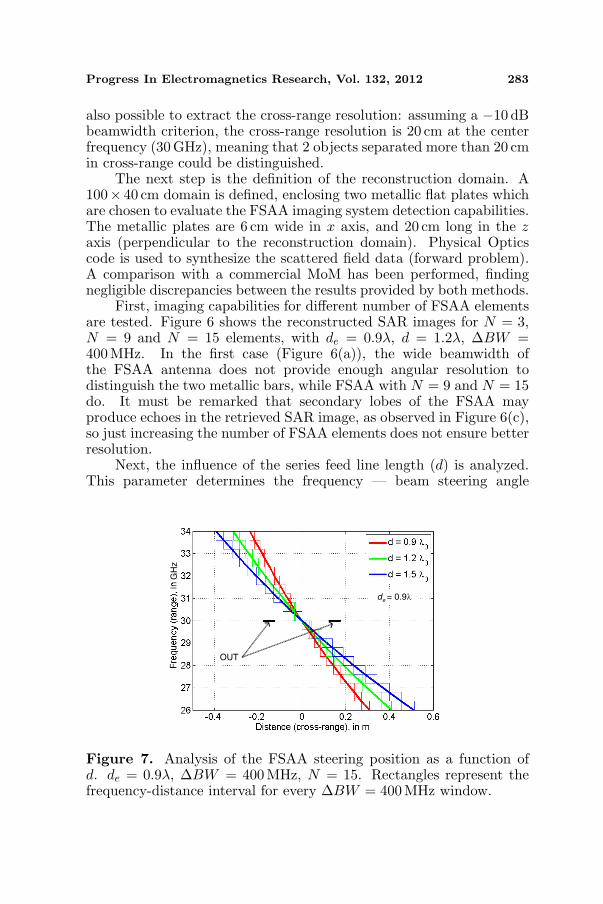
Next, the influence of the series feed line length (d) is analyzed.This parameter determines the frequency — beam steering angle
e
OUT
GH
z
d = 0.9λ
Figure 7. Analysis of the FSAA steering position as a function ofd. de = 0.9λ, ∆BW = 400 MHz, N = 15. Rectangles represent thefrequency-distance interval for every ∆BW = 400 MHz window.

284 Alvarez Lopez et al.
x axis (m)
x axis (m)
x axis (m)
y a
xis
(m
)y a
xis
(m
)y a
xis
(m
)
Norm
aliz
ed a
mplit
ude (
dB
)
(a)
(b)
(c)
Figure 8. SAR image when the phaseshift is given by (a) d = 0.9λ,(b) d = 1.2λ, (c) d = 1.5λ. For all the cases, N = 15 elements,de = 0.9λ, ∆BW = 400MHz.
relationship, as depicted in Figure 7. Longer feed line length increasesthe cross-range sweep margin, but also widens the S′n regions for agiven ∆BWn.
Figure 8 represents the reconstructed SAR images for different dvalues. N = 15 elements FSAA is considered. It can be observedthat the detection capabilities are not significantly distorted. Themost significant effect is the variation in the S′n regions width, so thatthe overall scanning region at y = 0 m goes from 45 cm (Figure 8(a),d = 0.9λ) to 85 cm (Figure 8(c), d = 1.5λ).

Progress In Electromagnetics Research, Vol. 132, 2012 285
Fre
qu
en
cy (
ran
ge),
in
GH
z
Distance (cross-range), in m
e
OUT
d = 0.9λd = 1.2λ
BW = 0.4 GHz
BW = 1.2 GHz
Figure 9. Analysis of the FSAA steering position as a function ofthe resolution window (∆BW = 400 MHz and ∆BW = 1.2GHz).d = 1.2λ. de = 0.9λ, N = 15.
Finally, the influence of the frequency window bandwidth ∆BW isanalyzed. For this purpose, N = 15, d = 1.2λ parameters are chosen.Figure 9 represents the FSAA steering position vs. frequency togetherwith the division in ∆BW = 400 MHz and ∆BW = 1200 MHz,resulting in 20 and 6 angular regions respectively. SAR image resultsare depicted in Figure 10. In this case, the influence of the ∆BWin the range and cross-range resolution is clearly visible: a windowof ∆BW = 400 MHz provides reasonable x-axis distance resolution,allowing the identification of the two metallic bars. However, theposition determination along y-axis (range) is not well-defined at all. Ifa wider ∆BW is chosen, range resolution is improved (see Figures 10(b)and (c)), but at the expense of loosing cross-range resolution. Thisfact can be observed in Figure 10(c), where the angular position ofthe two plates cannot be clearly distinguished. In addition, it must beremembered that increasing the ∆BW may yield a degradation of theretrieved SAR image, as the assumption of invariant beam illuminationwithin ∆BW becomes not valid.
4. MEASUREMENT RESULTS
Once the FSAA for imaging purposes has been tested with simulations,a practical case based on measurements is presented. For this purpose,

286 Alvarez Lopez et al.
x axis (m)
x axis (m)
x axis (m)
y a
xis
(m
)y a
xis
(m
)y a
xis
(m
)
No
rma
lize
d a
mp
litu
de
(d
B)
(a)
(b)
(c)
Figure 10. SAR image for different frequency window bandwidth: (a)∆BW = 400 MHz, (b) ∆BW = 1200MHz, (c) ∆BW = 1600MHz.For all the case, d = 1.2λ. de = 0.9λ, N = 15.
an existing manufactured FSAA has been used [24].The FSAA parameters are N = 10, de = 11.6mm, d = 2λg0 , where
λg0 is the guided wavelength at the center frequency f = 16.6GHz [24].TE polarization is considered, being Ex the copolar component. TheFSAA radiation pattern has been measured at the spherical range inanechoic chamber of the University of Oviedo, from 15 to 18 GHz, in50MHz steps. Figure 11 represents the steering angle as a function ofthe frequency.
From the results plotted in Figure 11 it is observed that the

Progress In Electromagnetics Research, Vol. 132, 2012 287
Normalized amplitude (dB)
Figure 11. Normalized electric field in dB radiated by the FSAA atdifferent frequencies and steering angles.
angular margin covered by the manufactured FSAA is 40 degrees. Thatmeans 70 cm cross-range at 1m distance. The cross-range resolutioncan be extrapolated from the antenna −10 dB beamwidth, which isapproximately 15 degrees (26 cm at 1 m). That means that the FSAAimaging system would be able to distinguish two objects separatedmore than 26 cm.
In order to provide a comparison, FSAA imaging capabilities arecompared with the SAR image results provided by a radar systemformed by two horn antennas. It is important to remark that, in allcases, the transmitter and receiver are fixed.
The FSAA and horn antenna used as transmitters are character-ized by means of an equivalent magnetic currents distribution [25–27].The Ex field component radiated on the XY plane is plotted in Fig-ure 12 (f = 18GHz).
As a first example, a metallic bar placed at (x; y) = (0.3; 1.5)mwith respect to the transmitting antenna is chosen. The bar is 2 mhigh in order to provide translation symmetry along z-axis, so that 2Dapproximation can be considered accurate enough. The measurementsetup is shown in Figure 13.
The scattered field is always acquired using a horn as receivingantenna. The field is acquired in the 15 to 18 GHz frequencyband, sampled each 50 MHz. Reconstruction results are depicted inFigure 15(a). In the case of using a horn antenna as transmitter,only range information is available (for representation purposes, the

288 Alvarez Lopez et al.
No
rma
lize
d a
mp
litu
de
(d
B)
(a)
(b)
Figure 12. Electric field (Ex component, normalized amplitude indB) radiated by (a) FSAA and (b) horn antenna. f = 18GHz.
2D SAR image is plotted as an arc, Figure 15(a)), that is, the bar isplaced 1.5m away from the transmitter, but no information about theangular position can be extracted.
Next step is the use of the FSAA antenna as transmitter.Figure 15(b) shows the SAR image when a frequency window of∆BW = 300MHz is considered. Now, the SAR image not onlyprovides range information, but also angular position, correspondingto the true placement of the metallic bar. Another echo is observedin the plot, on the right of the main spot. This is mainly due to theFSAA secondary lobes, which can be clearly appreciated in Figure 12.
Second, a more challenging example has been tested. Anothermetallic bar has been added, placed at (x; y) = (−0.2; 1.5) m, that is,

Progress In Electromagnetics Research, Vol. 132, 2012 289
150 cm
30 cm
x
y
z
Transmitting frequency
scanning antenna array
Receiving horn antenna
Metallic bar
Transmittinghorn antenna
Figure 13. Scattered field measurement setup using the FSAA astransmitter and a horn antenna as receiver, when the metallic bar isplaced at the position depicted in Figure 14. The upper left pictureshows the measurement setup when two horn antennas are used.
Figure 14. Measured electric field (Ex component, amplitude indBV/m).
at the same distance from the Tx/Rx antennas. The scattered fieldshave been collected again from 15 to 18 GHz in 50MHz steps. Figure 14represents the measured scattered fields for this case and the previousone, including a situation in which no objects are present: the latter

290 Alvarez Lopez et al.
No
rma
lize
d a
mp
litu
de
(d
B)
- -
x = 0.3 m
y = 1.5 m
y = 1.5 m
y = 1.5 m y = 1.5 m
x = 0.3 m x = -0.2 mx = -0.2 mx = 0.3 m
x = 0.3 m
- -
x = 0.3 m x = -0.2 m x = -0.2 mx = 0.3 m
y = 1.5 m
y = 1.2 m
y = 1.5 m
y = 1.2 m
y = 1.5 m
y = 1.2 m
y = 1.5 m
y = 1.2 m
y = 2.1 m
x = 0.3 m x = -0.2 mx = 0.3 m x = -0.2 m
- -
- -
y = 2.1 m
(a) (b)
(c) (d)
(e) (f)
(g) (h)

Progress In Electromagnetics Research, Vol. 132, 2012 291
Figure 15. Retrieved SAR image (normalized amplitude, in dB).Black rectangles indicate the placement of the metallic bars and theplate. Coordinate system is referred to the FSAA position. (a), (c),(e), (g) Using a horn antenna as transmitter. (b), (d), (f), (h) Usingthe FSAA as transmitter, with ∆BW = 300MHz window. (a), (b)One metallic bar placed at x = 0.3m, y = 1.5m. (c), (d) Two metallicbars placed at the same distance in y-axis. (e), (f) Two metallic barsplaced at different distance in y-axis. (g), (h) Two metallic bars and aplate placed at y = 2.1m.
is intended to give an idea of the measurement setup dynamic range.Results are depicted in Figures 15(c), (d). The first case,
Figure 15(c) corresponds to the use of the horn antenna as atransmitter. The range position of the bars is clearly identified(∼ 1.5m). When the FSAA is introduced, also the angular position isresolved. In order to remark the range-angular position trade-off of theFSAA imaging system, Figures 16(a)–(c) show the results for frequencywindows of ∆BW = 200 MHz, 300 MHz, and 500 MHz. As expected,a narrow frequency window provides higher angular resolution, and awide window improves range estimation. Combination of both imageswill improve the position estimation accuracy.
Two more configurations have been analyzed: the first one isdepicted in Figures 15(e), (f). In this case, the two metallic bars areplaced at different range and cross-range positions, so the reflectivitylevels are different due to the field attenuation with the distance (asthis parameter is not taken into account in Equation (1)). Again,when transmitting with the horn antenna, only range informationis provided, identifying two objects at distances of 1.2m and 1.5mrespectively (Figure 15(e)). By introducing the FSAA, the cross-rangeposition is also estimated (Figure 15(f)).
The last case consists on a metallic plate of 2.5 m along x axis and1m along z axis (height) placed behind the two metallic bars, in theplane y = 2.1 m (see Figure 17). The goal is to analyze the influence ofa strong scatterer in the imaging system. The use of the horn antennaas a transmitter allows identifying the range position of the 3 scatterers(Figure 15(g)). The metallic plate distance corresponds to the pointshaving specular reflection with respect to the Tx/Rx. FSAA resultsalso provide a rough guess of the metallic plate shape (a line parallelto the x axis). However, only the points close to the specular reflectionexhibit high reflectivity values (Figure 15(h)). Also the shadow due tothe metallic bar placed at (x, y) = (−0.2, 1.5)m can be observed inthe reconstructed SAR image.

292 Alvarez Lopez et al.
No
rma
lize
d a
mp
litu
de
(d
B)
y = 1.5 m
x = 0.3 m
x = -0.2 m
(a)
(b)
(c)
x = 0.3 m
x = 0.3 m
y = 1.5 m
y = 1.5 m
x = -0.2 m
x = -0.2 m
Figure 16. Retrieved SAR image (normalized amplitude, indB). Black rectangles indicate the placement of the metallic bars.Coordinate system is referred to the FSAA position. (a) 200 MHzwindow. (b) 300 MHz window. (c) 500 MHz window.

Progress In Electromagnetics Research, Vol. 132, 2012 293
Figure 17. Two metallic bars placed at (x, y) = (0.3, 1.2) and (−0.2,1.5)m, together with a metallic plate at y = 2.1m.
5. CONCLUSIONS
A study of the FSAA imaging system features has been presented.The technique is conceived as a low-cost solution to obtain angularinformation of the target in range-based systems in which the antennabeam cannot be steered, either mechanically or using electronicvariable phase shifting networks. A detailed analysis of the mainparameters (number of antenna array elements, element phase shift,and frequency window bandwidth) influencing the range and cross-range resolution has been carried out, supported by simulation andmeasurement examples. Experimental results also confirm the systemcapacity to estimate the range and cross-range position of severalmetallic objects. Further work is devoted to improve FSAA features,aiming to extend system capabilities not only for objects detection,but also for shape reconstruction.
ACKNOWLEDGMENT
Manuscript received June 30, 2012. This work has beensupported by the “Ministerio de Ciencia e Innovacion” ofSpain/FEDER under projects CONSOLIDER-INGENIO CSD2008-00068 (TERASENSE), TEC2011-24492/TEC (iSCAT), IPT-2011-0951-390000 (TECNIGRAF), and under PhD grant BES-2009-024060;by PCTI Asturias under projects EQUIP08-06, FC09-COF09-12,EQUIP10-31, and PC10-06 (FLEXANT).

294 Alvarez Lopez et al.
REFERENCES
1. Sheen, D. M., D. L. McMakin, and T. E. Hall, “Three-dimensionalmillimeter-wave imaging for concealed weapon detection,” IEEETransactions on Microwave Theory and Techniques, Vol. 49, No. 9,1581–1592, Sep. 2001.
2. Martinez-Lorenzo, J. A., C. M. Rappaport, and F. Quivira,“Physical Limitations on detecting tunnels using underground-focusing spotlight synthetic aperture radar,” IEEE Transactionson Geoscience and Remote Sensing, Vol. 49, No. 1, 65–70,Jan. 2011.
3. Bond, E. J., X. Li, S. C. Hagness, and B. D. Van Veen, “Microwaveimaging via space-time beamforming for early detection ofbreast cancer,” IEEE Transactions on Antennas and Propagation,Vol. 51, No. 8, 1690–1705, Aug. 2003.
4. Colton, D. and A. Kirsch, “A simple method for solving inversescattering problems in the resonance region,” Inverse Problems,Vol. 12, No. 4, 383–393, Aug. 1996.
5. Alvarez Lopez, Y., A. Domınguez-Casas, C. Garcıa-Gonzalez, andF. Las-Heras, “Geometry reconstruction of metallic bodies usingthe sources reconstruction method,” IEEE Antennas and WirelessPropagation Letters, Vol. 9, 1197–1200, 2010.
6. Pastorino, M., A. Massa, and S. Caorsi, “A microwaveinverse scattering technique for image reconstruction based on agenetic algorithm,” IEEE Transactions on Instrumentation andMeasurement, Vol. 49, No. 3, 573–578, Jun. 2000.
7. Bozza, G., C. Estatico, M. Pastorino, and A. Randazzo, “Aninexact newton method for microwave reconstruction of strongscatterers,” IEEE Antennas and Wireless Propagation Letters,Vol. 5, No. 1, 61–64, Dec. 2006.
8. Lin, C.-Y. and Y.-W. Kiang, “Inverse scattering for conductors bythe equivalent source method,” IEEE Transactions on Antennasand Propagation, Vol. 44, No. 3, 310–316, Mar. 1996.
9. Caorsi, S., G. L. Gragnani, and M. Pastorino, “Two-dimensionalmicrowave imaging by a numerical inverse scattering solution,”IEEE Transactions on Microwave Theory and Techniques, Vol. 38,No. 8, 981–980, Aug. 1990.
10. Cayoren, M., I. Akduman, A. Yapar, and L. Crocco, “A newalgorithm for the shape reconstruction of perfectly conductingobjects,” Inverse Problems, Vol. 23, No. 3, 1087–1100, Jun. 2007.
11. Farmahini-Farahani, M., R. Faraji-Dana, and M. Shahabadi,“Fast and accurate cascaded particle swarm gradient optimization

Progress In Electromagnetics Research, Vol. 132, 2012 295
method for solving 2-D inverse scattering problems,” AppliedComputational Electromagnetics Society, Vol. 24, No. 5, 2009.
12. Van den Berg, P. M. and R. E. Kleinman, “A contrast sourceinversion method,” Inverse Problems, Vol. 13, No. 6, 1607–1620,Dec. 1997.
13. LaHaie, I. J., “Overview of an image-based technique for predict-ing far-field radar cross section from near-field measurements,”IEEE Antennas and Propagation Magazine, Vol. 45, No. 6, 159–169, Dec. 2003.
14. Broquetas, A., J. Palau, L. Jofre, and A. Cardama, “Sphericalwave near-field imaging and radar cross-section measurement,”IEEE Transactions on Antennas and Propagation, Vol. 46, No. 5,730–735, May 1998.
15. Lopez-Sanchez, J. M. and J. Fortuny-Guasch, “3-D radarimaging using range migration techniques,” IEEE Transactionson Antennas and Propagation, Vol. 48, No. 5, 728–737, May 2000.
16. Llombart, N., R. J. Dengler, and K. B. Cooper, “Terahertzantenna system for a near-video-rate radar imager,” IEEEAntennas and Propagation Magazine, Vol. 52, No. 5, 252–259,Oct. 2010.
17. Tran, H., F. Gumbmann, J. Weinzierl, and L.-P. Schmidt, “A fastscanning w-band system for advanced millimetre-wave short rangeimaging applications,” 3rd European Radar Conference, EuRAD2006, 146–149, 2006.
18. Ranzani, L., N. Ehsan, and Z. Popoviac, “G-band frequency-scanned antenna arrays,” IEEE 2010 Antennas and PropagationSociety International Symposium, 1–4, Toronto, Canada, 2010.
19. Hilburn, J. and F. Prestwood, “K band frequency-scanned waveg-uide array,” IEEE Transactions on Antennas and Propagation,Vol. 22, No. 2, 340–341, Mar. 1974.
20. Danielsen, M. and R. Jorgensen, “Frequency scanning microstripantennas,” IEEE Transactions on Antennas and Propagation,Vol. 27, No. 2, 146–150, 1979.
21. Ranzani, L., N. Ehsan, and Z. Popoviac, “G-band frequency-scanned antenna arrays,” IEEE 2010 Antennas and PropagationSociety International Symposium, 1–4, Toronto, Canada, Jul. 11–17, 2010.
22. Mayer, W., M. Wetzel, and W. Menzel, “A novel direct-imagingradar sensor with frequency scanned antenna,” IEEE MTT-SInternational Microwave Symposium Digest, Vol. 3, 1941–1944,Philadelphia, U.S., Jun. 8–13, 2003.

296 Alvarez Lopez et al.
23. Alvarez, Y., J. A. Martınez, F. Las-Heras, and C. M. Rappaport,“An inverse fast multipole method for geometry reconstructionusing scattered field information,” IEEE Transactions onAntennas and Propagation, Vol. 60, No. 7, 3351–3360, Jul. 2012.
24. Vazquez, C., S. Ver-Hoeye, M. Fernandez, L. F. Herran, andF. Las-Heras, “Frequency scanning probe for microwave imaging,”IEEE 2010 Antennas and Propagation Society InternationalSymposium, 1–4, Toronto, Canada, 2010.
25. Alvarez, Y., F. Las-Heras, and M. R. Pino, “Reconstruction ofequivalent currents distribution over arbitrary three-dimensionalsurfaces based on integral equation algorithms,” IEEE Trans-actions on Antennas and Propagation, Vol. 54, 3460–3468,Dec. 2007.
26. Alvarez, Y., F. Las-Heras, M. R. Pino, and T. K. Sarkar,“An improved super-resolution sources reconstruction method,”IEEE Transactions on Instrumentation and Measurement, Vol. 58,No. 11, 3855–3866, Nov. 2009.
27. Quijano, J. L. A. and G. Vecchi, “Field and source equivalencein source reconstruction on 3D surfaces,” Progress In Electromag-netics Research, Vol. 103, 67–100, 2010.