Fremont County Code Enforcement Yearly Report · Fremont County Code Enforcement Yearly Report. ......
25
Fremont County Code Enforcement Yearly Report 4/19/2016 CODE ENFORCEMENT YEARLY REPORT 1 Prepared by: [Name] Prepared by: Robert Sapp and Sean Garrett
-
Upload
trinhduong -
Category
Documents
-
view
216 -
download
1
Transcript of Fremont County Code Enforcement Yearly Report · Fremont County Code Enforcement Yearly Report. ......

Fremont CountyCode Enforcement
Yearly Report
4/19/2016 CODE ENFORCEMENT YEARLY REPORT 1
Prepared by: [Name]
Prepared by: Robert Sapp and Sean Garrett

AgendaAddresses
Inspections
Zoning Violations
Helping Hands Project
Clean up projects
Special Mobile Machinery
2016 Projected Goals
2
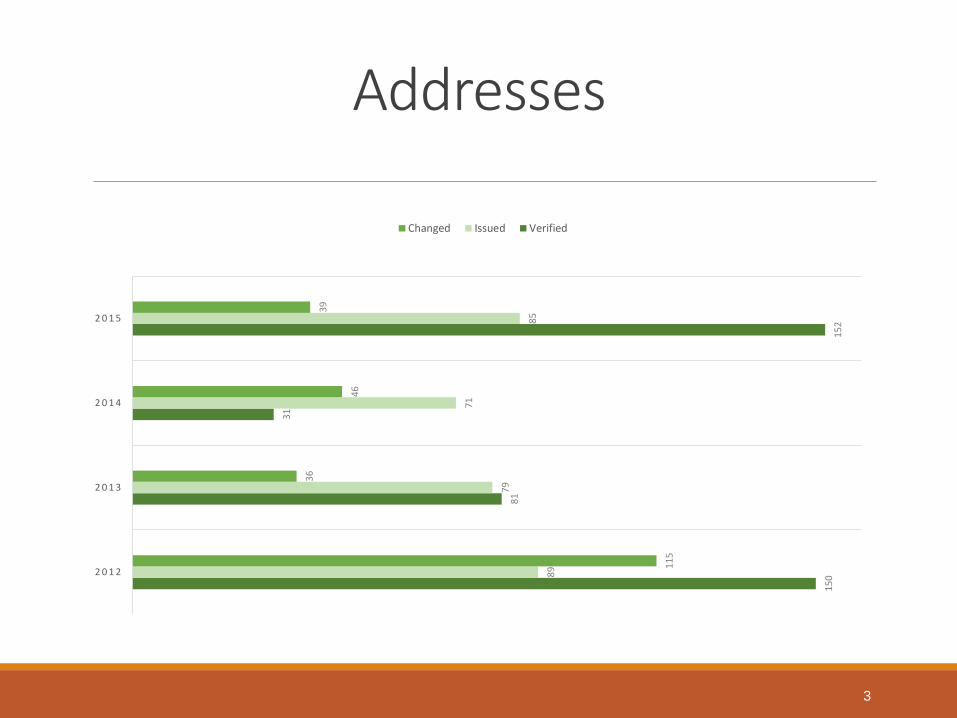
Addresses
3
150
81
31
152
89
79
71
85
115
36
46
39
2 0 1 2
2 0 1 3
2 0 1 4
2 0 1 5
Changed Issued Verified
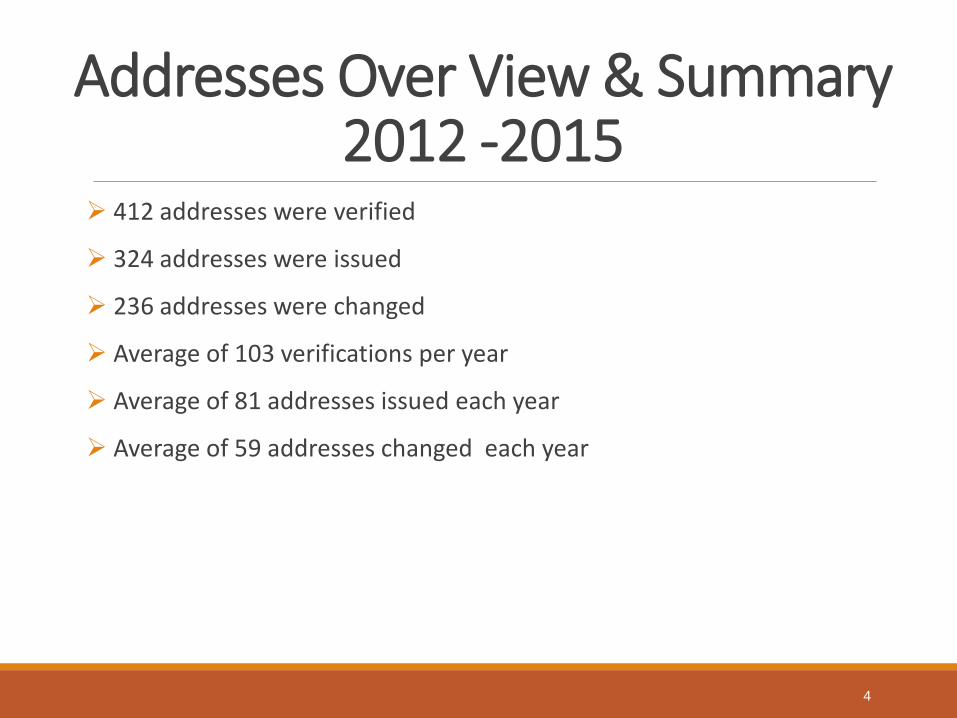
Addresses Over View & Summary2012 -2015
412 addresses were verified
324 addresses were issued
236 addresses were changed
Average of 103 verifications per year
Average of 81 addresses issued each year
Average of 59 addresses changed each year
4
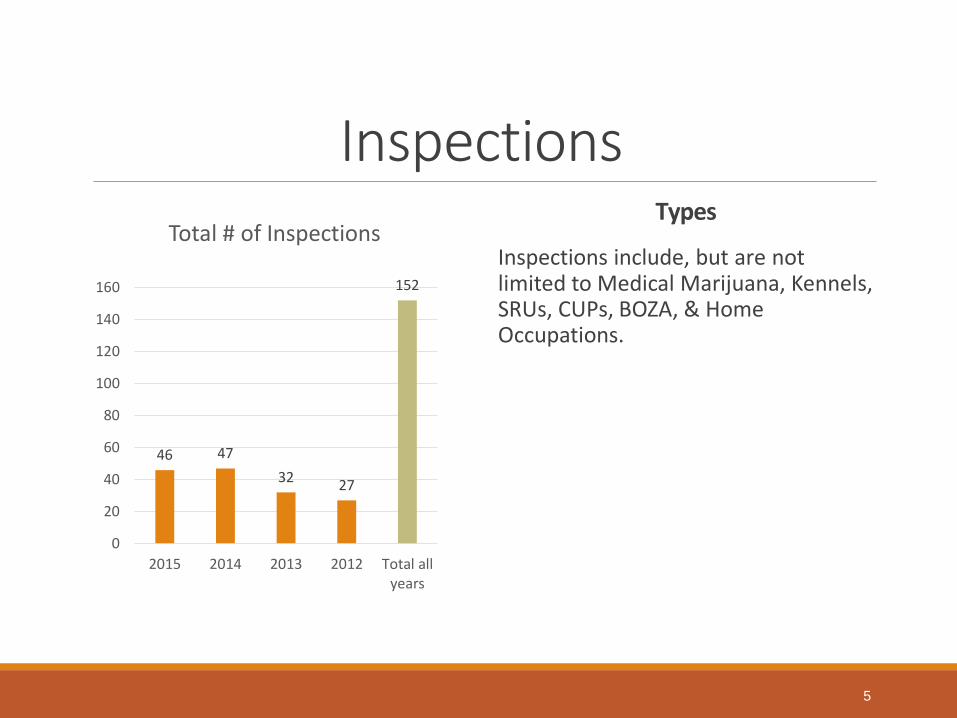
InspectionsTypes
Inspections include, but are not limited to Medical Marijuana, Kennels, SRUs, CUPs, BOZA, & Home Occupations.
5
46 4732 27
152
0
20
40
60
80
100
120
140
160
2015 2014 2013 2012 Total allyears
Total # of Inspections
Zoning Violations
6
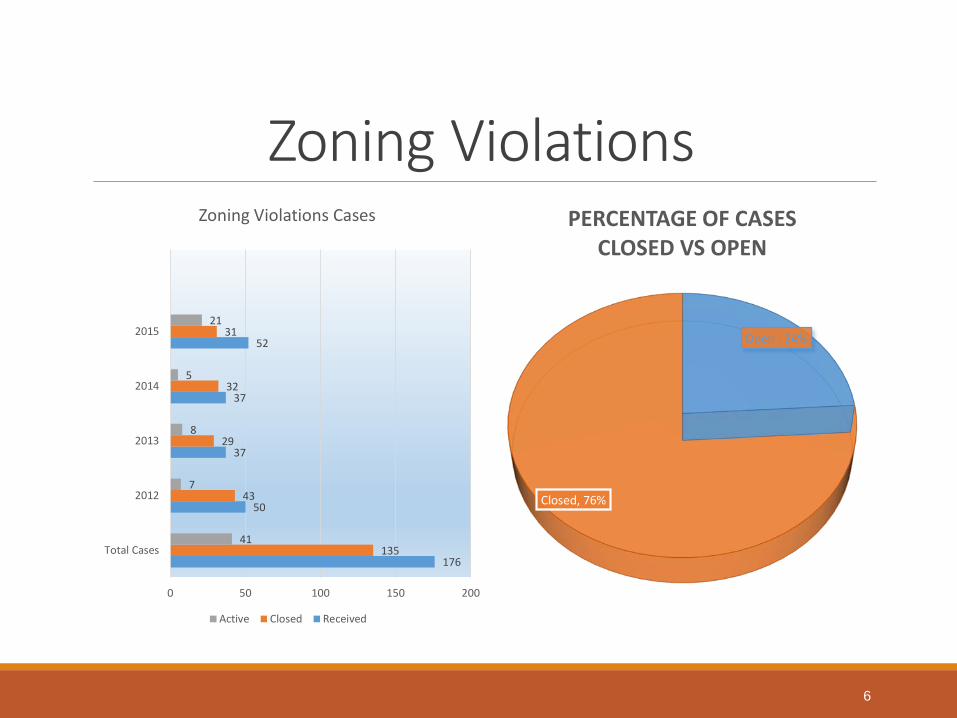
176
50
37
37
52
135
43
29
32
31
41
7
8
5
21
0 50 100 150 200
Total Cases
2012
2013
2014
2015
Zoning Violations Cases
Active Closed Received
Open , 24%
Closed, 76%
PERCENTAGE OF CASESCLOSED VS OPEN

Zoning Violations by area
7
21
01
0
13
3 3
8
2
7
0 0 0
17
4
0
12
0
15
0 0 0
76
1
12
0
13
0 01
10
6
0
24
00
5
10
15
20
25
30
Violations By Area
2012 2013 2014 2015
56
01
1
47
94
56
2
Total Violations 2012 - 2015By Area
Canon Coal Creek Coaldale
Colorado Springs Cotopaxi Florence
Howard Penrose Salida
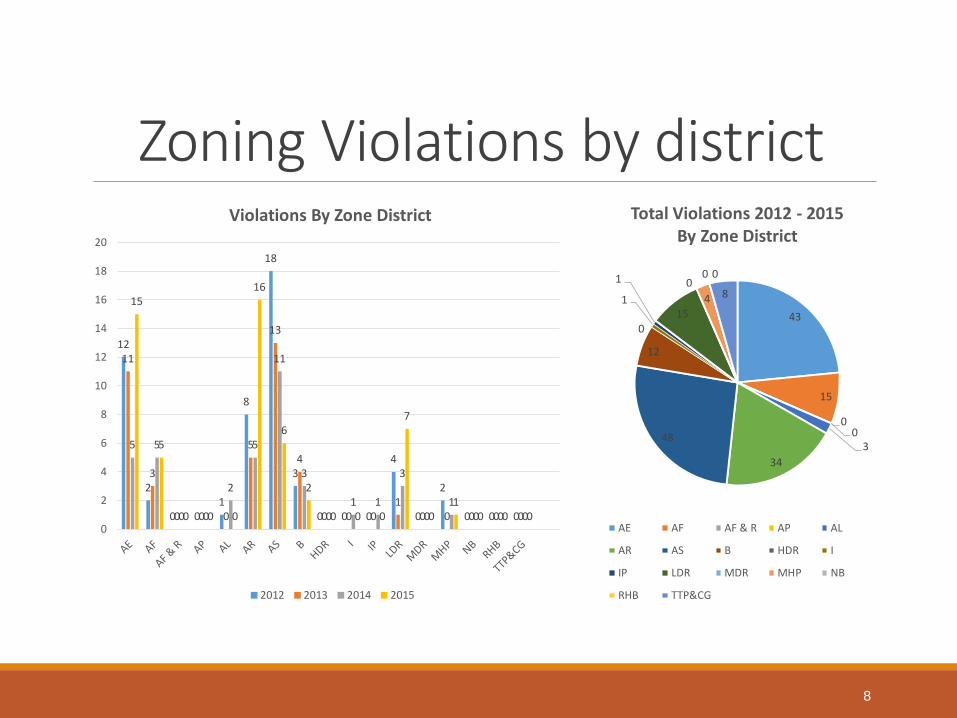
Zoning Violations by district
8
12
2
0 01
8
18
3
0 0 0
4
0
2
0 0 0
11
3
0 0 0
5
13
4
0 0 01
0 0 0 0 0
5 5
0 0
2
5
11
3
01 1
3
01
0 0 0
15
5
0 0 0
16
6
2
0 0 0
7
01
0 0 00
2
4
6
8
10
12
14
16
18
20
Violations By Zone District
2012 2013 2014 2015
43
15
00
334
48
12
0
1
1
15
04
0 0
8
Total Violations 2012 - 2015By Zone District
AE AF AF & R AP AL
AR AS B HDR I
IP LDR MDR MHP NB
RHB TTP&CG
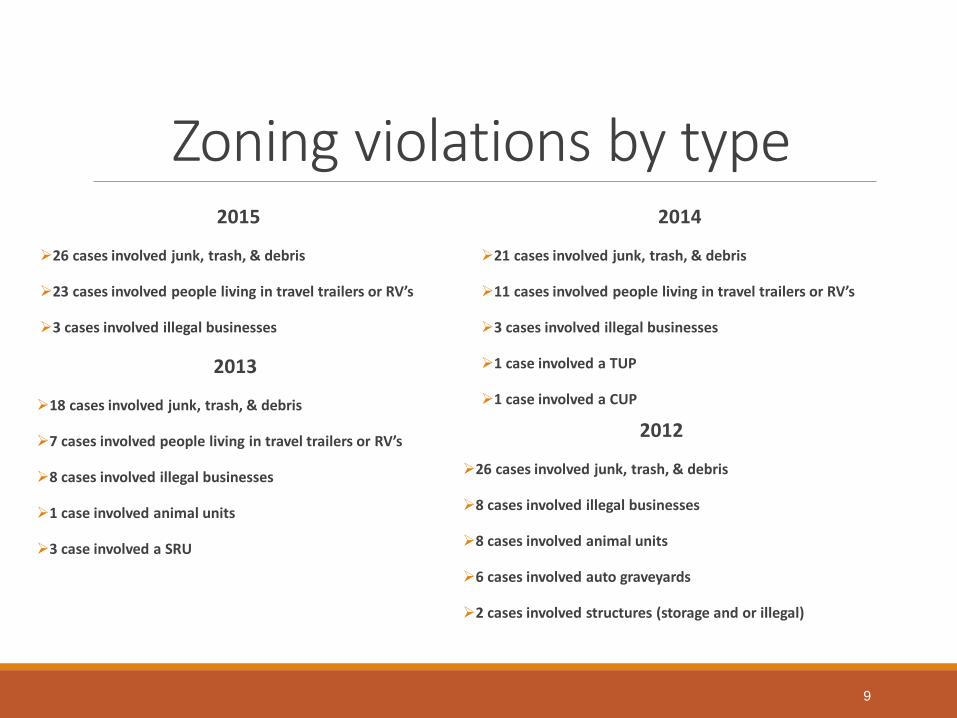
Zoning violations by type2015
26 cases involved junk, trash, & debris
23 cases involved people living in travel trailers or RV’s
3 cases involved illegal businesses
9
2014
21 cases involved junk, trash, & debris
11 cases involved people living in travel trailers or RV’s
3 cases involved illegal businesses
1 case involved a TUP
1 case involved a CUP
2013
18 cases involved junk, trash, & debris
7 cases involved people living in travel trailers or RV’s
8 cases involved illegal businesses
1 case involved animal units
3 case involved a SRU
2012
26 cases involved junk, trash, & debris
8 cases involved illegal businesses
8 cases involved animal units
6 cases involved auto graveyards
2 cases involved structures (storage and or illegal)
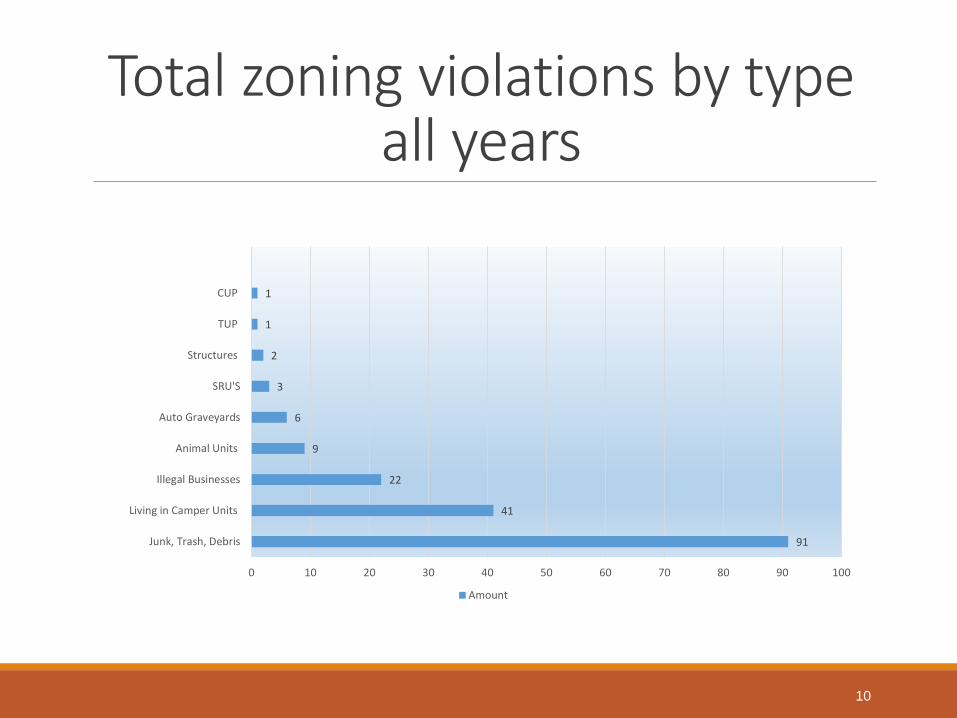
Total zoning violations by type all years
10
91
41
22
9
6
3
2
1
1
0 10 20 30 40 50 60 70 80 90 100
Junk, Trash, Debris
Living in Camper Units
Illegal Businesses
Animal Units
Auto Graveyards
SRU'S
Structures
TUP
CUP
Amount

Site Visits
208148 148
200
704
0
100
200
300
400
500
600
700
800
2015 2014 2013 2012 Total Allyears
2015 2014 2013 2012 Total All years
Figures are based on conducting four (4) site visits per case.
11
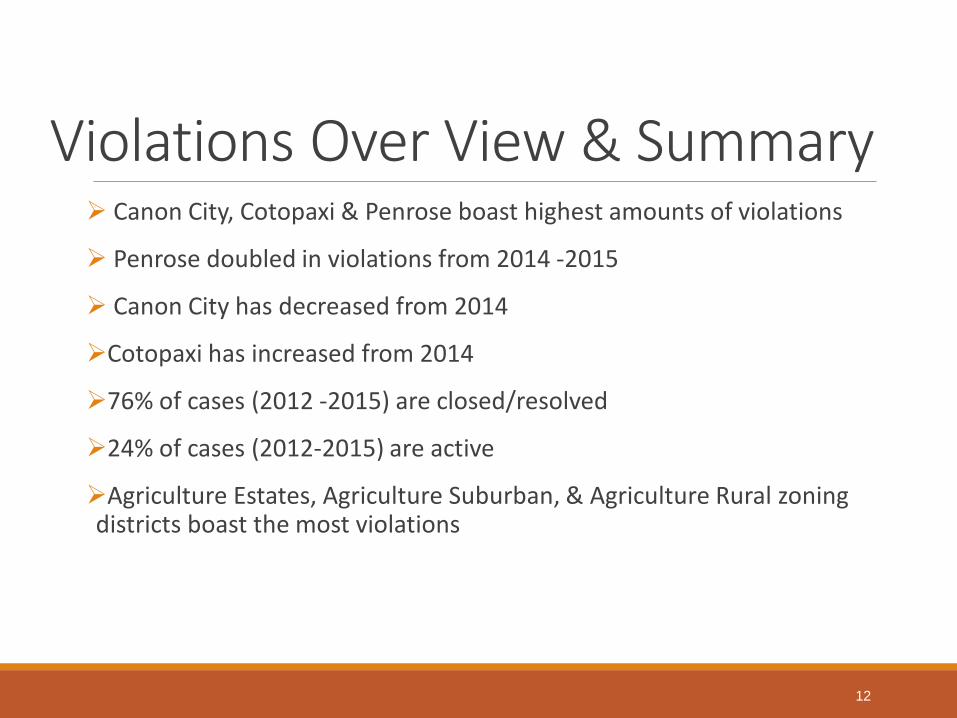
Violations Over View & Summary Canon City, Cotopaxi & Penrose boast highest amounts of violations
Penrose doubled in violations from 2014 -2015
Canon City has decreased from 2014
Cotopaxi has increased from 2014
76% of cases (2012 -2015) are closed/resolved
24% of cases (2012-2015) are active
Agriculture Estates, Agriculture Suburban, & Agriculture Rural zoning districts boast the most violations
12
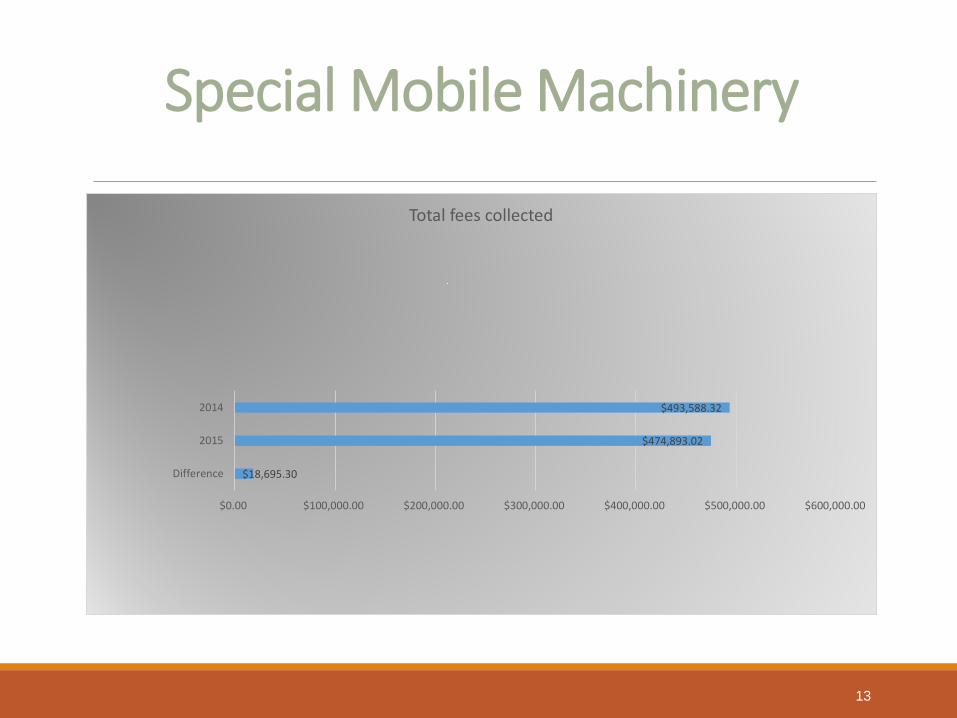
Special Mobile Machinery
13
$18,695.30
$474,893.02
$493,588.32
$0.00 $100,000.00 $200,000.00 $300,000.00 $400,000.00 $500,000.00 $600,000.00
Difference
2015
2014
Total fees collected
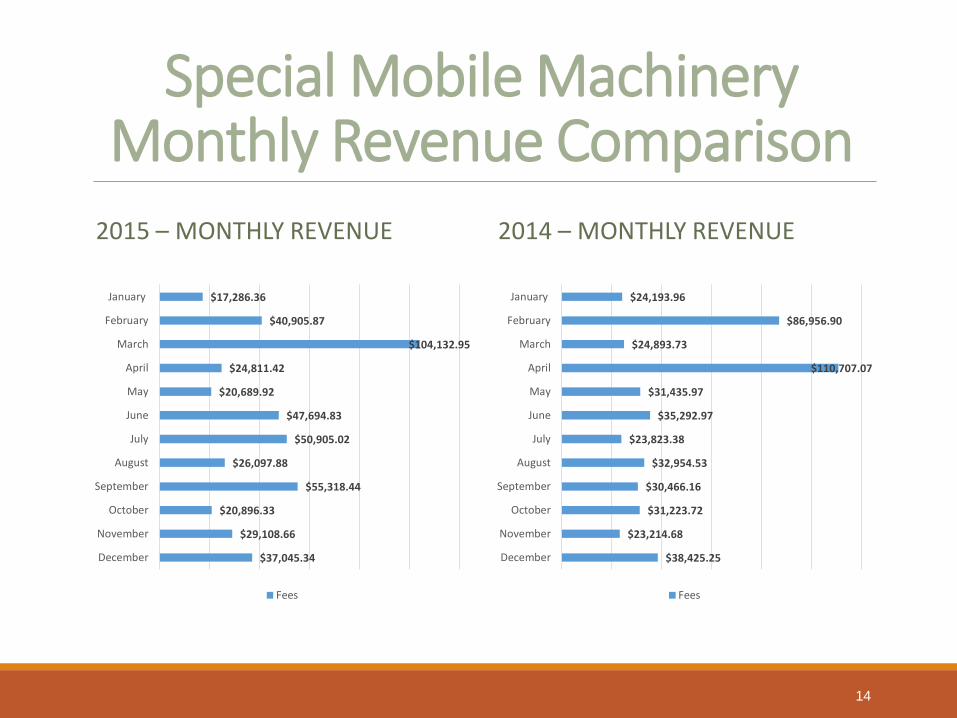
Special Mobile Machinery Monthly Revenue Comparison
2015 – MONTHLY REVENUE 2014 – MONTHLY REVENUE
14
$37,045.34
$29,108.66
$20,896.33
$55,318.44
$26,097.88
$50,905.02
$47,694.83
$20,689.92
$24,811.42
$104,132.95
$40,905.87
$17,286.36
December
November
October
September
August
July
June
May
April
March
February
January
Fees
$38,425.25
$23,214.68
$31,223.72
$30,466.16
$32,954.53
$23,823.38
$35,292.97
$31,435.97
$110,707.07
$24,893.73
$86,956.90
$24,193.96
December
November
October
September
August
July
June
May
April
March
February
January
Fees
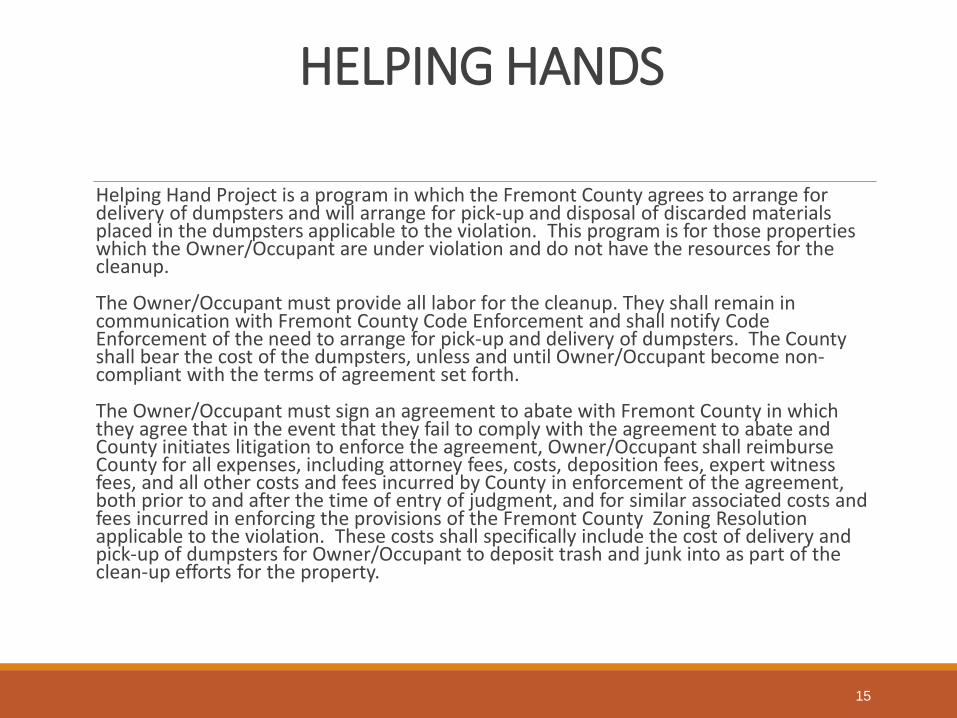
HELPING HANDS
Helping Hand Project is a program in which the Fremont County agrees to arrange for delivery of dumpsters and will arrange for pick-up and disposal of discarded materials placed in the dumpsters applicable to the violation. This program is for those properties which the Owner/Occupant are under violation and do not have the resources for the cleanup.
The Owner/Occupant must provide all labor for the cleanup. They shall remain in communication with Fremont County Code Enforcement and shall notify Code Enforcement of the need to arrange for pick-up and delivery of dumpsters. The County shall bear the cost of the dumpsters, unless and until Owner/Occupant become non-compliant with the terms of agreement set forth.
The Owner/Occupant must sign an agreement to abate with Fremont County in which they agree that in the event that they fail to comply with the agreement to abate and County initiates litigation to enforce the agreement, Owner/Occupant shall reimburse County for all expenses, including attorney fees, costs, deposition fees, expert witness fees, and all other costs and fees incurred by County in enforcement of the agreement, both prior to and after the time of entry of judgment, and for similar associated costs and fees incurred in enforcing the provisions of the Fremont County Zoning Resolution applicable to the violation. These costs shall specifically include the cost of delivery and pick-up of dumpsters for Owner/Occupant to deposit trash and junk into as part of the clean-up efforts for the property.
15

HELPING HANDS RECIEPENTS CASE
#NAME ADDRESS AREA # OF
DUMBSTERS00-021 Eggleston 904 Fremont County Road 12 Cotopaxi 5
08-037 Vendetti/Wilson 673 Fremont County Rd 11A Canon City 7
08-051 Daniels 1567 M. Street Penrose 9
08-087 Wilks 88 CR. 227 Canon City 1
10-039 Hamilton 776 R. Path Colorado Acres 1
12-014 Cain 416 Fremont County Rd 119 Florence 4
12-020 Montana 91 Spring Hill Lane Cotopaxi 2
14-003 Javernick Vacant Property Canon City 10
14-024 Relich 1517 Poplar Ave Canon City 3
15-011 Wilson 1227 Pennsylvania Ave Canon City 2
15-019 Chandler CRK CO 2228 Fremont County Road 79 Florence 2
15-031 Barlow 1048 Moore Drive Florence 2
Total Dumpsters Provided 48
16
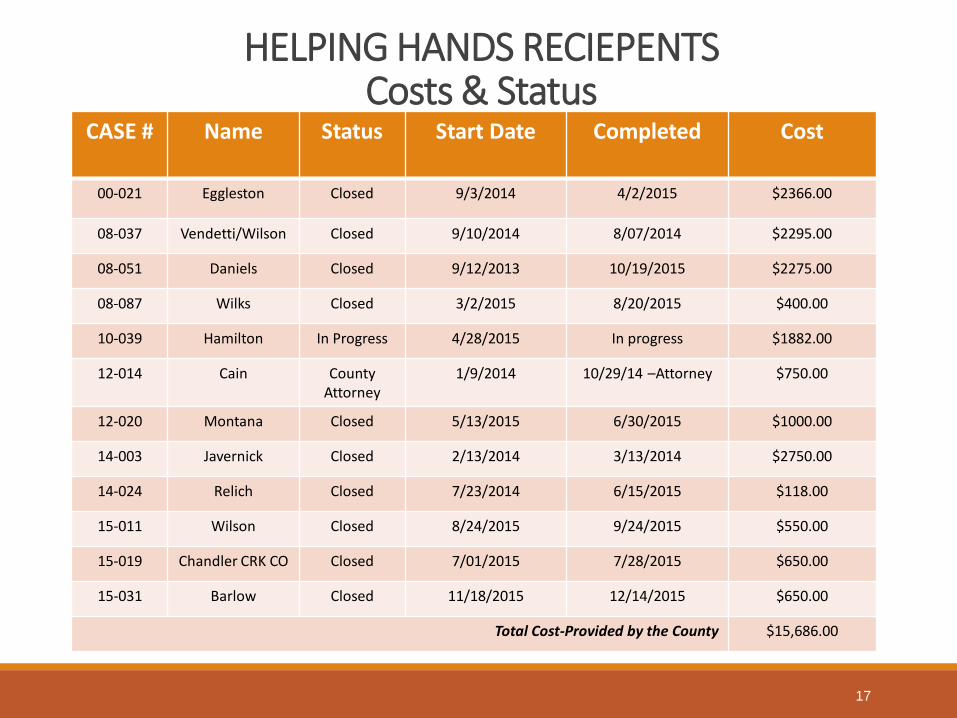
HELPING HANDS RECIEPENTS Costs & Status
CASE # Name Status Start Date Completed Cost
00-021 Eggleston Closed 9/3/2014 4/2/2015 $2366.00
08-037 Vendetti/Wilson Closed 9/10/2014 8/07/2014 $2295.00
08-051 Daniels Closed 9/12/2013 10/19/2015 $2275.00
08-087 Wilks Closed 3/2/2015 8/20/2015 $400.00
10-039 Hamilton In Progress 4/28/2015 In progress $1882.00
12-014 Cain County Attorney
1/9/2014 10/29/14 –Attorney $750.00
12-020 Montana Closed 5/13/2015 6/30/2015 $1000.00
14-003 Javernick Closed 2/13/2014 3/13/2014 $2750.00
14-024 Relich Closed 7/23/2014 6/15/2015 $118.00
15-011 Wilson Closed 8/24/2015 9/24/2015 $550.00
15-019 Chandler CRK CO Closed 7/01/2015 7/28/2015 $650.00
15-031 Barlow Closed 11/18/2015 12/14/2015 $650.00
Total Cost-Provided by the County $15,686.00
17

Helping Hands Projects15-011 1227 Pennsylvania
BEFORE
18
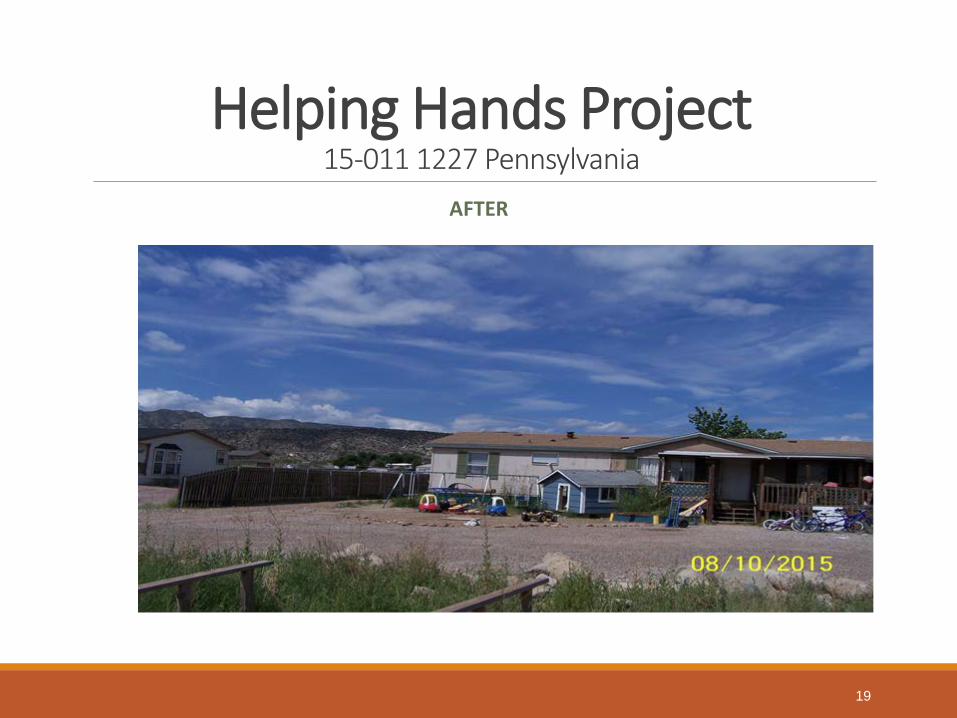
Helping Hands Project15-011 1227 Pennsylvania
AFTER
19
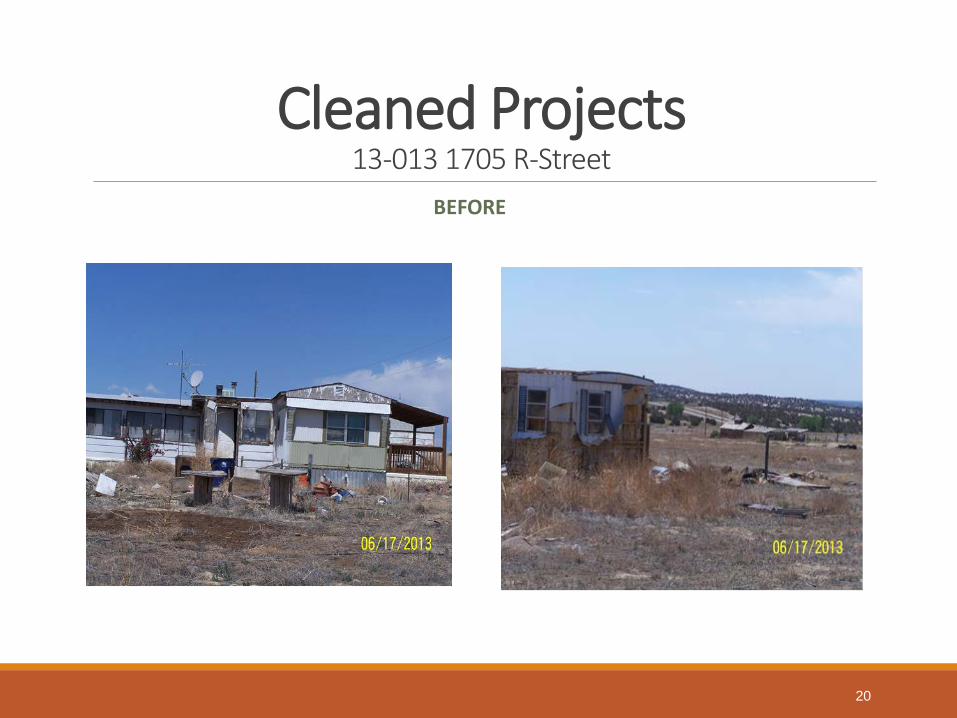
Cleaned Projects13-013 1705 R-Street
BEFORE
20
Cleaned Projects13-013 1705 R-Street
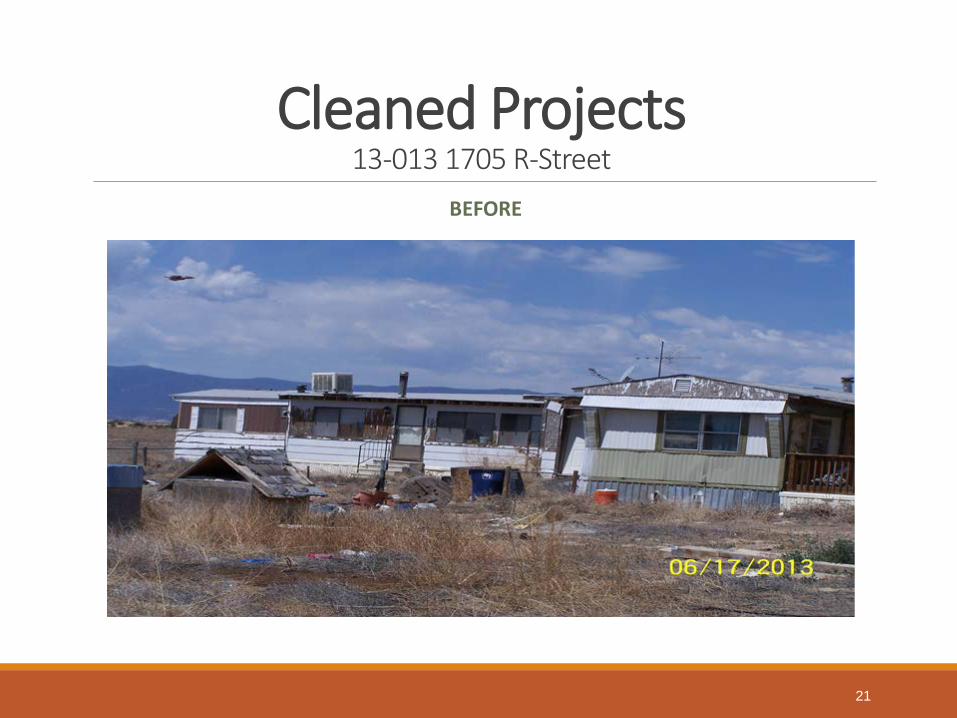
BEFORE
21

Cleaned Projects13-013 1705 R-Street
AFTER
22
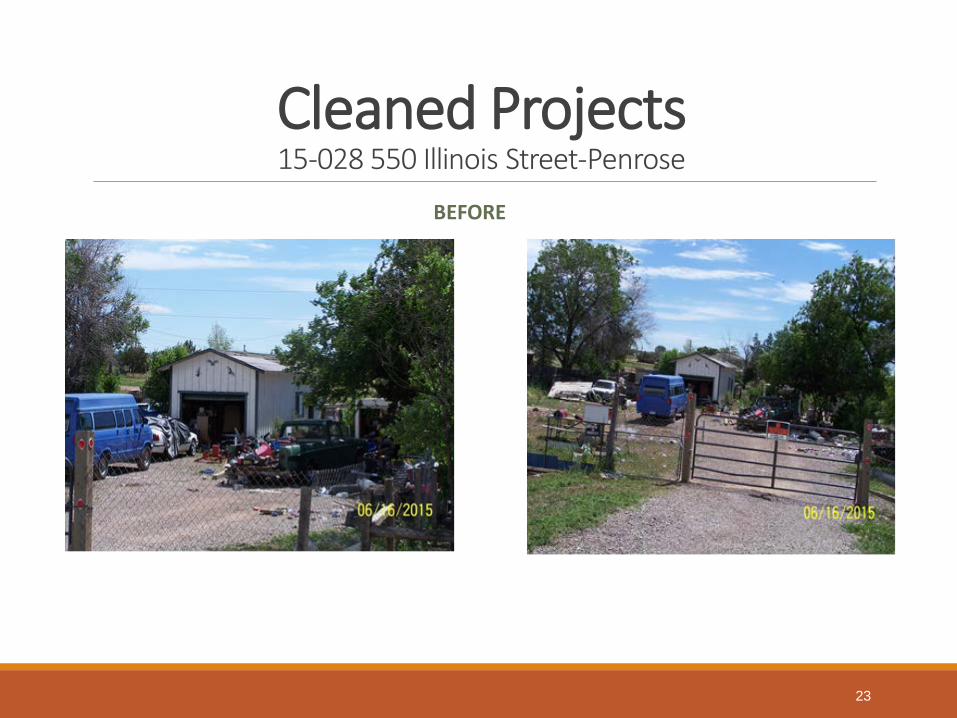
Cleaned Projects15-028 550 Illinois Street-Penrose
BEFORE
23

Cleaned Projects15-028 550 Illinois Street-Penrose
AFTER
24

Projected 2016 Goals Zoning
Violations ◦ Close 70% of cases
opened◦ Close 70% of revolving
cases ◦ Increase community
involvement with helping hands projects
◦ Create strategy to deal with MMJ complaints
Special Mobile Machinery
◦ Create an efficient tracking spreadsheet
◦ Focus on delinquent entities
◦ Increase awareness
25