Free Trade Area Agreements
34
Industrializaon through trade in North Africa in the context of the Connental Free Trade Area and Mega Trade Agreements
Transcript of Free Trade Area Agreements
Industrialization through trade
in North Africa in the context of the Continental Free Trade Area and Mega Trade
Agreements

Industrialization through trade
in North Africa in the context of the Continental Free Trade Area and Mega Trade
Agreements
To order copies of Industrialization through trade in North Africa in the context of the Continental Free Trade Area and Mega Trade Agreements, please contact:
Publications SectionEconomic Commission for AfricaMenelik II Avenue P.O. Box 3001Addis Ababa, Ethiopia
Tel: +251 11 544-9900Fax: +251 11 551-4416E-mail: [email protected]: www.uneca.org
© 2017 Economic Commission for AfricaAddis Ababa, EthiopiaAll rights reservedFirst printing August 2017
Material in this publication may be freely quoted or reprinted. Acknowledgement is requested, together with a copy of the publication.
Designed and printed by the ECA Printing and Publishing Unit. ISO 14001:2004 certified.Cover photos: © Shutterstock.com
iii
Table of Contents
I. Introduction 1
II. StateofmanufacturingproductioninNorthAfricancountries 3A. Industrial production 3B. Relative industrial performance 5
III. Economic impacts of implemented reforms 9A. Impact of different scenarios on exports 9B. Sectoral analysis: change in trade by main sector 10
IV. Conclusionsandrecommendations 18
Annex1:Modelusedanddescriptionoftradereforms 20A. Main model assumptions, data requirements, and geographic and sectoral decomposition 20B. Trade reforms 20
Annex2:Geographicdecompositiondeterminedforthemodellingexercise 22
Annex3:Sectoraldecompositiondeterminedforthemodellingexercise 23
Annex4:Changesinbilateraltrade,followingtheCFTAreforms (withouttradefacilitationmeasures),percent,2020 24
References 25

v
AbbreviationsCFTA Continental Free Trade Agreement
ECA Economic Commission for Africa
Euromed Euro-Mediterranean partnership
FTA free trade agreement
GAFTA Greater Arab Free Trade Area
GDP gross domestic product
GTAP Global Trade Analysis Project
MIRAGE Modelling International Relationships in Applied General Equilibrium
MVA manufacturing value added
UNIDO United Nations Industrial Development Organization
WTO World Trade Organization
vi
PrefaceThe structural transformation of the African continent, which includes measures of environmental sustainability and harmonious and inclusive social and human development, gives a central role to the economic transformation. This latter can be promoted by policies and voluntary programmes that enable improved economic productivity, attract productive investments and cope with macroeconomic instabilities. Within this framework, the industrial sector, in particular the manufacturing production sector, constitutes an effective lever by virtue of its mechanism for the dissemination of knowledge to the other sectors of the economy.
Actually, the manufacturing sector has been the main driving force of economic growth in many developing countries and particularly for the emerging countries in Asia. Similarly, several works, oriented toward empirical analysis, report the importance of the manufacturing sector to the development process, and in turn the need for an efficient industrial policy. The works on industry in the United States of America in the 1980s by authors such as Johnson (1984), Norton (1986), Cohen and Zysman (1987) and Thompson (1989), are also worth mentioning. As an example, the mining technologies are of limited interest to most of the other sectors of the economy. Thus, the benefits of the learning associated with the extraction of natural resources are likely to be much more limited than those associated with the manufacturing sector, which explains why the natural resources-dependant economies remain “dual” economies.
Such a large quantity of research works have pointed out the link between regional integration and economic growth. Trade contributes to industrial development by expanding the opportunities for national production, stimulating competition and competitiveness and raising national income. The establishment of a continental free trade area, for which negotiations are underway, will promote intra-African trade and multiply economic opportunities. Using a computable general equilibrium model type, this publication considers the effects of setting a continental free trade area on North African economies, and records positive notes on industrial development. Additional estimates in terms of the expected effects of the Greater Arab Free Trade Area (GAFTA) and trade facilitation measures are also produced.
The present publication is the result of an analysis previously presented at an experts meeting on the topic held in Rabat, Morocco, on 1 and 2 March 2016. The meeting took place within the framework of the 2016 meeting of the Intergovernmental Committee of Experts. The participants have enriched the present publication by their comments and observations, which have been integrated in the present version. The final publication should be useful to public policymakers, researchers and private sector actors, as a basis for advocacy to conceive and implement proactive industrial policies combined with selective trade policies, and which takes into account the industrial structures at the national level, to enable member States to take advantage of the continental dynamics in progress.
1
I. Introduction
1 As captured in manufacturing value added (MVA) per capita.
Industrialization in North Africa is imperative for countries of the subregion, given its past history of development and the aspirations of the population. A structural transformation of North African countries requires substantial development of their industrial sector in an adverse global context that restricts the emergence of new industrialized countries.
Although North Africa can claim the continent’s highest level of industrial production,1 such a level represents merely one tenth of its annual production. Time has not played in favour of North African countries; they experienced deindustrialization as the industrial sector grew at a slower pace than the overall economy. North Africa failed to stimulate its industrial sector enough for it to become a driving force of change and structural transformation.
A comparative analysis of the 2008–2013 time period, provided in the second chapter of the present publication, shows that per capita industrial production is growing at the slowest pace in the entire African continent. If this current trend is not reversed in coming years, countries of the subregion will be caught up and overtaken by their closest neighbours and will have missed an opportunity to exploit their admittedly small comparative advantage in favour of substantial and coherent industrial development.
Moreover, almost half of North African countries’ manufacturing value added (MVA) is produced by resource-based activities. Medium- and high-technology industries represent only 23 per cent of industrial production. This affects North Africa’s role in the global market, as 60 per cent of exports are made up of primary commodities.
To face this challenge, countries of the subregion must design and implement coherent and proactive industrial policies. These must be aligned with national development plans to make them participate in such development, and to capitalize on existing synergies.
By enabling engagement in global and regional value chains, foreign trade is an important tool which can support and boost industrial production. Participating in such chains would improve productivity in the industrial sector by introducing technology, developing supplier networks and improving skills. Admittedly, multilateral negotiations within the World Trade Organization (WTO) do pose some challenges to countries that wish to join the club of industrialized countries, but they also offer significant margins that such countries can benefit from through proactive industrial policies combined with selective trade policies. Countries that seek to industrialize their economies must take advantage of rising production costs in industrialized countries to attract a significant portion of industrial relocation flows.
Furthermore, current negotiations for the creation of a Continental Free Trade Agreement (CFTA) by 2017 are a vital opportunity to promote African integration, the facilitation of intra-African trade and industrial development in the continent. North Africa is part of this process and stands to benefit from it. The static and dynamic effects that CFTA is expected to produce should promote the development of trade, economies of scale through increased market size, and stronger competition and competitiveness.
The project is ambitious and aspires to build a group of African countries with a population of more than 1 billion people and a gross domestic product (GDP) of more than $3 trillion (2014). The Economic Commission for Africa (ECA) forecasts that intra-African trade could grow by more than 52 per cent ($35 trillion) by 2022.
Countries and regional economic communities, including the Arab Maghreb Union, should continue to play a central role in tracing the outline of this continental project. Creating a tripartite free trade area between the Common Market for Eastern and Southern Africa, the Southern African Development Community and

2
the East African Community is a first step that could catalyze more. This initiative involves 26 African countries, 56 per cent of the African population and more than half of the continent’s GDP.
The present publication provides a prospective analysis of the expected benefits of CFTA for North African countries, and identifies the tools and channels available to the subregion to make CFTA a stepping stone toward industrial development and the structural transformation of North African economies. In addition to this analysis, other regional integration projects are also examined, such as the Greater Arab Free
Trade Area (GAFTA) and the Euro-Mediterranean partnership (Euromed) project.
The present publication is a synthesis of a first version of a paper prepared by S. Mevel (ECA), J. Moll de Alba (United Nations Industrial Development Organization (UNIDO)) and N. Oulmane (ECA), “Optimal regional trade integration schemes and trade facilitation in North Africa: Towards a pro-industrialization policy strategy”.
3
II. StateofmanufacturingproductioninNorthAfricancountries2
2 Ms. Shoreh Mirzaei Yeganeh, UNIDO’s Statistics Unit, compiled the data used in chapter II.
This chapter examines the current industrial production growth and structure of North African countries in comparison to other country groups. It then compares the relative industrial performance of North Africa with other main regions.
A. Industrial production
Between 2008 and 2013, the share of Africa’s population to total world population increased from 14.4 per cent to 15.5 per cent, growing faster than its share in world MVA, which increased moderately to reach 1.5 per cent in 2013. The share of Africa’s MVA in total MVA of developing countries, which increased their share in world MVA, declined from 5 per cent in 2008 to 4.2 per cent in 2013. During the same period, the share of North Africa’s population as a percentage of world population grew from 0.28 to 0.29 per cent, while its share in world MVA stagnated at 0.53 per cent. Developed countries, with a combined population of 17 per cent, held more than 64.5 per cent of global industrial production in 2013.
In line with the overall trend in Africa, the North Africa region exhibited a significant slowdown of its already comparatively moderate average MVA growth rate, from 4.18 per cent during 2003–2008 to 1.67 per cent in 2008–2013. This compares with West Africa, which only accounted for 10.66 per cent of Africa’s MVA, but managed to increase its average annual MVA growth rate from 3.67 per cent to 5.24 per cent during the same period; or with East Africa’s annual MVA growth rate, which remained close to 5 per cent, but only accounted for 4.05 per cent of Africa’s total MVA. Despite the decline in developing countries and in China, their average annual growth rates remained at comparatively much higher levels, i.e. 5.51 per cent and 8.37
per cent, respectively, during the period 2008–2013.
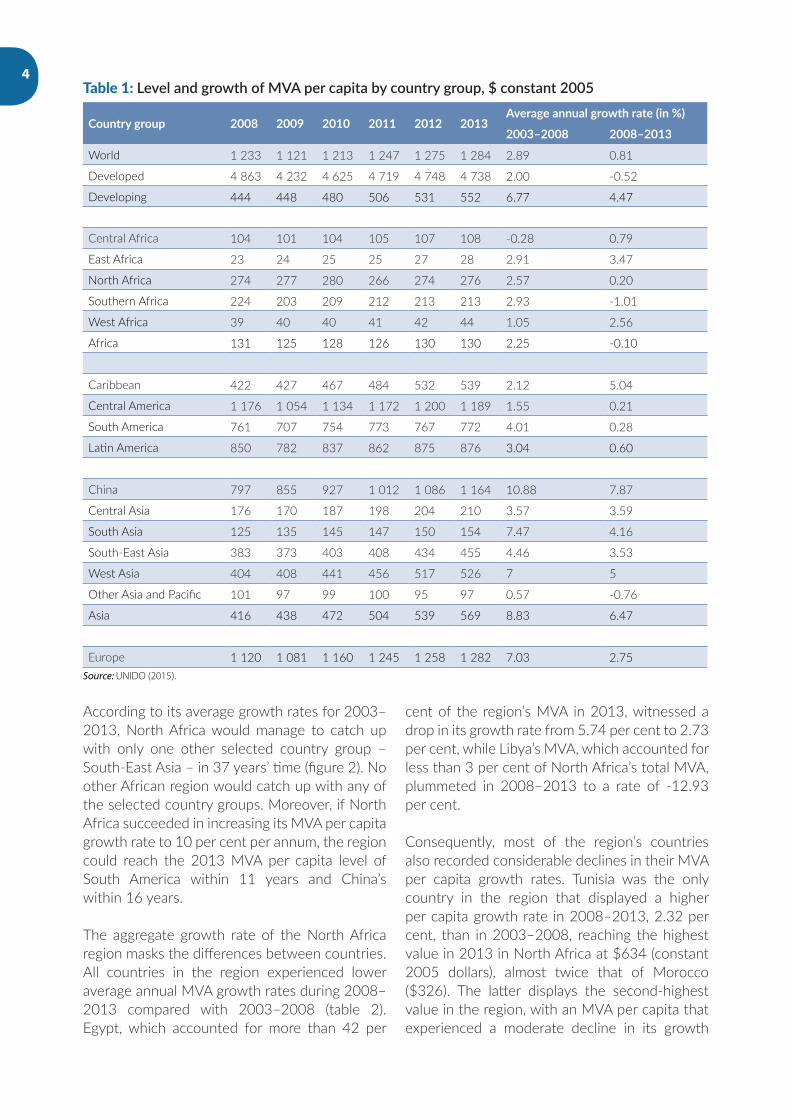
Low and stagnant levels of MVA explain Africa’s low level of MVA per capita at constant 2005 $130 in 2013 (table 1). This is 36 times less than that of developed countries and more than four times less than developing countries’ MVA per capita. Despite the North Africa region recording the highest MVA per capita among Africa’s regions in 2013 with $276 (constant 2005 dollars), followed closely by Southern Africa with $213, its MVA per capita is comparatively lower than that of other country groups, e.g. 17 times lower than that of developed countries and more than four times lower than the MVA per capita of Central America.
The situation in the North Africa region looks comparatively worse, considering both its limited industrial fabric and its growing population. MVA per capita increased marginally by 0.2 per cent during 2008–2013 to reach $276 in 2013, compared with 2.57 per cent growth in 2003–2008 (table 1). Despite significantly lower levels of MVA per capita, West Africa increased its MVA per capita to 2.56 per cent during 2008–2013, to reach $42, and East Africa recorded an average annual growth rate of 3.47 per cent, recording $28 in 2013. The marginal increase of $2 in North Africa’s MVA per capita compares with an increase of nearly $108 during the period 2008–2013 in developing countries, which reached a value of $552 (constant 2005 dollars) in 2013 or with China, which recorded an impressive increase of $367, reaching a per capita MVA of $1,164.
Despite registering the highest MVA per capita in Africa, the North Africa region not only continues to lag far behind other world country groups, but the existing gap is also increasing, due to the region’s marginal increase in 2008–2013.
4
According to its average growth rates for 2003–2013, North Africa would manage to catch up with only one other selected country group – South-East Asia – in 37 years’ time (figure 2). No other African region would catch up with any of the selected country groups. Moreover, if North Africa succeeded in increasing its MVA per capita growth rate to 10 per cent per annum, the region could reach the 2013 MVA per capita level of South America within 11 years and China’s within 16 years.
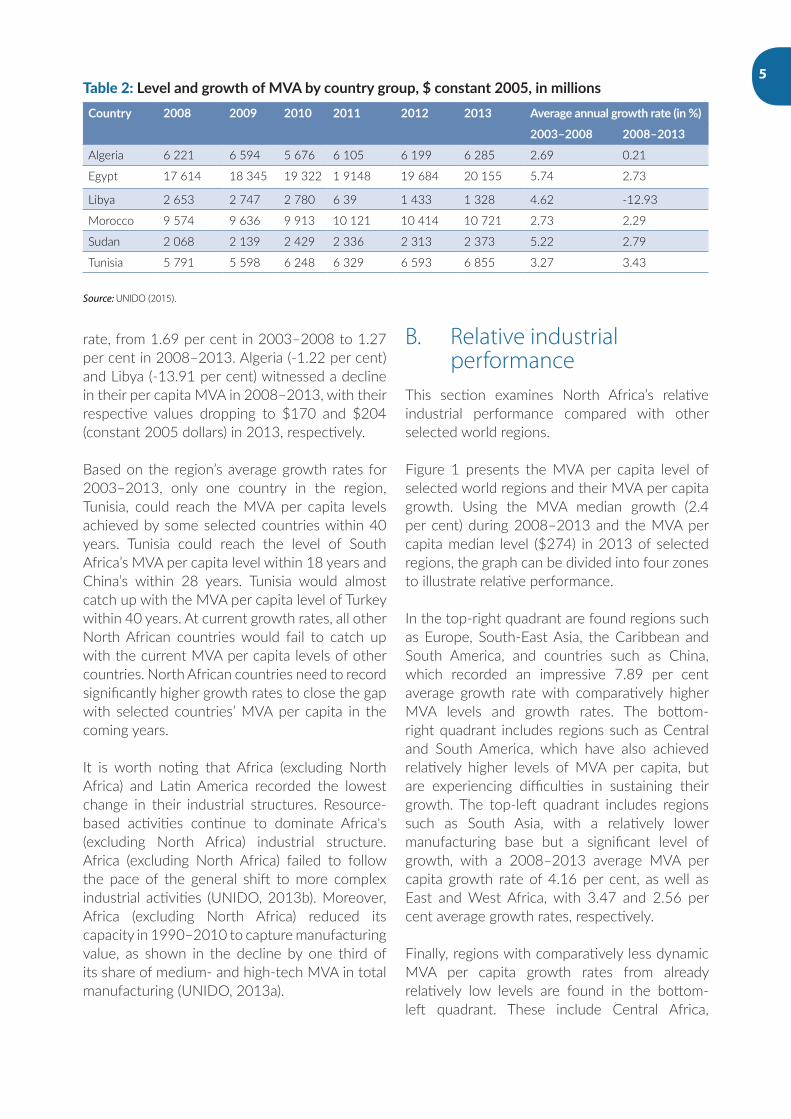
The aggregate growth rate of the North Africa region masks the differences between countries. All countries in the region experienced lower average annual MVA growth rates during 2008–2013 compared with 2003–2008 (table 2). Egypt, which accounted for more than 42 per
cent of the region’s MVA in 2013, witnessed a drop in its growth rate from 5.74 per cent to 2.73 per cent, while Libya’s MVA, which accounted for less than 3 per cent of North Africa’s total MVA, plummeted in 2008–2013 to a rate of -12.93 per cent.
Consequently, most of the region’s countries also recorded considerable declines in their MVA per capita growth rates. Tunisia was the only country in the region that displayed a higher per capita growth rate in 2008–2013, 2.32 per cent, than in 2003–2008, reaching the highest value in 2013 in North Africa at $634 (constant 2005 dollars), almost twice that of Morocco ($326). The latter displays the second-highest value in the region, with an MVA per capita that experienced a moderate decline in its growth
Table 1: Level and growth of MVA per capita by country group, $ constant 2005
Country group 2008 2009 2010 2011 2012 2013Averageannualgrowthrate(in%)
2003–2008 2008–2013
World 1 233 1 121 1 213 1 247 1 275 1 284 2.89 0.81
Developed 4 863 4 232 4 625 4 719 4 748 4 738 2.00 -0.52
Developing 444 448 480 506 531 552 6.77 4.47
Central Africa 104 101 104 105 107 108 -0.28 0.79
East Africa 23 24 25 25 27 28 2.91 3.47
North Africa 274 277 280 266 274 276 2.57 0.20
Southern Africa 224 203 209 212 213 213 2.93 -1.01
West Africa 39 40 40 41 42 44 1.05 2.56
Africa 131 125 128 126 130 130 2.25 -0.10
Caribbean 422 427 467 484 532 539 2.12 5.04
Central America 1 176 1 054 1 134 1 172 1 200 1 189 1.55 0.21
South America 761 707 754 773 767 772 4.01 0.28
Latin America 850 782 837 862 875 876 3.04 0.60
China 797 855 927 1 012 1 086 1 164 10.88 7.87
Central Asia 176 170 187 198 204 210 3.57 3.59
South Asia 125 135 145 147 150 154 7.47 4.16
South-East Asia 383 373 403 408 434 455 4.46 3.53
West Asia 404 408 441 456 517 526 7 5
Other Asia and Pacific 101 97 99 100 95 97 0.57 -0.76
Asia 416 438 472 504 539 569 8.83 6.47
Europe 1 120 1 081 1 160 1 245 1 258 1 282 7.03 2.75Source: UNIDO (2015).
5
rate, from 1.69 per cent in 2003–2008 to 1.27 per cent in 2008–2013. Algeria (-1.22 per cent) and Libya (-13.91 per cent) witnessed a decline in their per capita MVA in 2008–2013, with their respective values dropping to $170 and $204 (constant 2005 dollars) in 2013, respectively.
Based on the region’s average growth rates for 2003–2013, only one country in the region, Tunisia, could reach the MVA per capita levels achieved by some selected countries within 40 years. Tunisia could reach the level of South Africa’s MVA per capita level within 18 years and China’s within 28 years. Tunisia would almost catch up with the MVA per capita level of Turkey within 40 years. At current growth rates, all other North African countries would fail to catch up with the current MVA per capita levels of other countries. North African countries need to record significantly higher growth rates to close the gap with selected countries’ MVA per capita in the coming years.
It is worth noting that Africa (excluding North Africa) and Latin America recorded the lowest change in their industrial structures. Resource-based activities continue to dominate Africa's (excluding North Africa) industrial structure. Africa (excluding North Africa) failed to follow the pace of the general shift to more complex industrial activities (UNIDO, 2013b). Moreover, Africa (excluding North Africa) reduced its capacity in 1990–2010 to capture manufacturing value, as shown in the decline by one third of its share of medium- and high-tech MVA in total manufacturing (UNIDO, 2013a).
B. Relative industrial performance
This section examines North Africa’s relative industrial performance compared with other selected world regions.
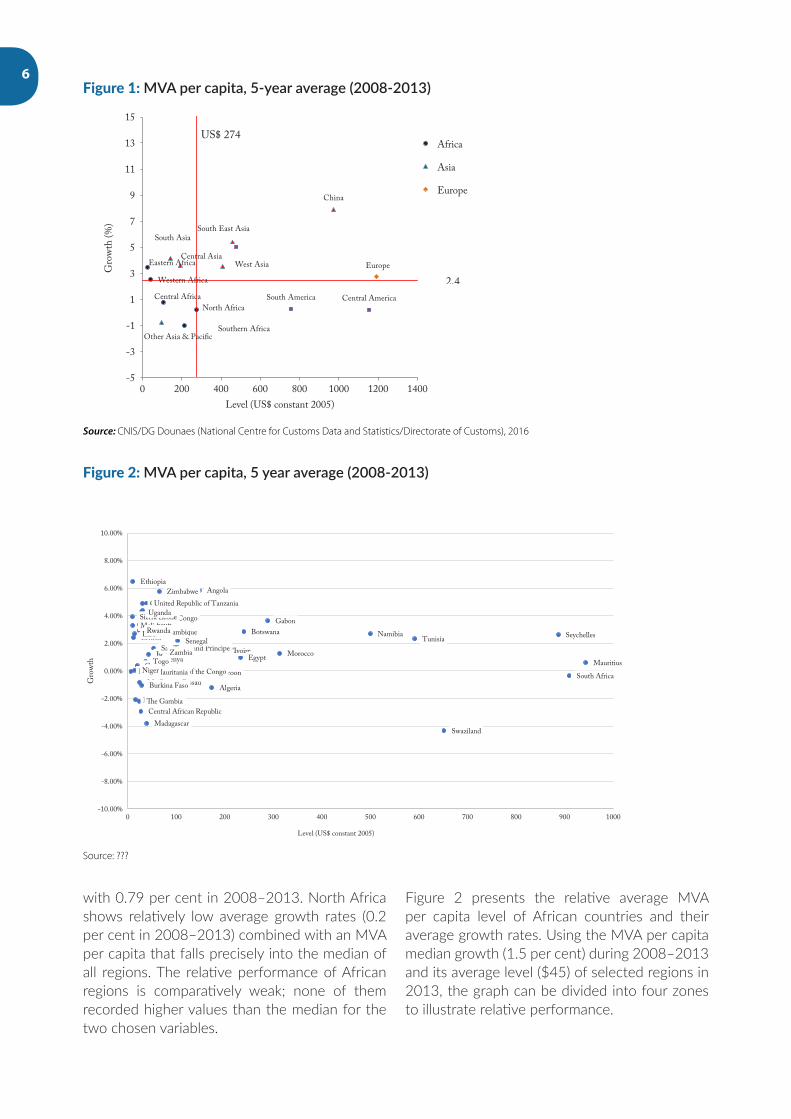
Figure 1 presents the MVA per capita level of selected world regions and their MVA per capita growth. Using the MVA median growth (2.4 per cent) during 2008–2013 and the MVA per capita median level ($274) in 2013 of selected regions, the graph can be divided into four zones to illustrate relative performance.
In the top-right quadrant are found regions such as Europe, South-East Asia, the Caribbean and South America, and countries such as China, which recorded an impressive 7.89 per cent average growth rate with comparatively higher MVA levels and growth rates. The bottom-right quadrant includes regions such as Central and South America, which have also achieved relatively higher levels of MVA per capita, but are experiencing difficulties in sustaining their growth. The top-left quadrant includes regions such as South Asia, with a relatively lower manufacturing base but a significant level of growth, with a 2008–2013 average MVA per capita growth rate of 4.16 per cent, as well as East and West Africa, with 3.47 and 2.56 per cent average growth rates, respectively.
Finally, regions with comparatively less dynamic MVA per capita growth rates from already relatively low levels are found in the bottom-left quadrant. These include Central Africa,
Table 2: LevelandgrowthofMVAbycountrygroup,$constant2005,inmillionsCountry 2008 2009 2010 2011 2012 2013 Averageannualgrowthrate(in%)
2003–2008 2008–2013
Algeria 6 221 6 594 5 676 6 105 6 199 6 285 2.69 0.21
Egypt 17 614 18 345 19 322 1 9148 19 684 20 155 5.74 2.73
Libya 2 653 2 747 2 780 6 39 1 433 1 328 4.62 -12.93
Morocco 9 574 9 636 9 913 10 121 10 414 10 721 2.73 2.29
Sudan 2 068 2 139 2 429 2 336 2 313 2 373 5.22 2.79
Tunisia 5 791 5 598 6 248 6 329 6 593 6 855 3.27 3.43
Source: UNIDO (2015).
6
with 0.79 per cent in 2008–2013. North Africa shows relatively low average growth rates (0.2 per cent in 2008–2013) combined with an MVA per capita that falls precisely into the median of all regions. The relative performance of African regions is comparatively weak; none of them recorded higher values than the median for the two chosen variables.
Figure 2 presents the relative average MVA per capita level of African countries and their average growth rates. Using the MVA per capita median growth (1.5 per cent) during 2008–2013 and its average level ($45) of selected regions in 2013, the graph can be divided into four zones to illustrate relative performance.
Figure 1: MVA per capita, 5-year average (2008-2013)
Western Africa
Southern Africa
North Africa
Eastern Africa
Central Africa
Other Asia & Pacific
West Asia
South East AsiaSouth Asia
Central Asia
China
South America Central America
Europe
-5
-3
-1
1
3
5
7
9
11
13
15
0 200 400 600 800 1000 1200 1400
Gro
wth
(%)
Level (US$ constant 2005)
Africa
Asia
Europe
2,4
US$ 274
Source: CNIS/DG Dounaes (National Centre for Customs Data and Statistics/Directorate of Customs), 2016
Figure 2: MVA per capita, 5 year average (2008-2013)
Algeria
Angola
Botswana
Burundi
Cameroon
Central African Republic
Chad
Comoros
Congo
Democratic Rep of the Congo
Benin
Ethiopia
Eritrea
Djibouti Gabon
�e Gambia
Ghana
Guinea
Côte d'IvoireKenya
Lesotho
Liberia
Madagascar
Malawi
Mali
MauritaniaMauritius
Morocco
Mozambique Namibia
Niger
Nigeria
Guinea-Bissau
Rwanda
Sao Tome and PrincipeSenegal
Seychelles
Sierra Leone
South Africa
Zimbabwe
Swaziland
Togo
Tunisia
Uganda
Egypt
United Republic of Tanzania
Burkina Faso
Zambia
-10.00%
-8.00%
-6.00%
-4.00%
-2.00%
0.00%
2.00%
4.00%
6.00%
8.00%
10.00%
0 100 200 300 400 500 600 700 800 900 1000
Gro
wth
Level (US$ constant 2005)
Source: ???
7
In the top-right quadrant are countries that recorded comparatively higher MVA levels and growth rates (relative to other African countries). Only one North African country is included in this group, Tunisia, with $592.42 average MVA per capita and 2.32 per cent average growth rate. In this group, the growth rates recorded by Angola (5.84 per cent) and Zimbabwe (5.76 per cent) were remarkable, even if their MVA per capita levels were not among the highest in this quadrant. Seychelles, with $896.96, displayed the highest average MVA per capita in this group coupled with a significant average growth rate of 2.62 per cent.
The bottom-right quadrant includes countries that achieved relatively higher levels of MVA per capita, but experienced difficulties in sustaining their growth. Five North African countries – Morocco, Egypt, Algeria, the Sudan and Libya – are included in this group, but they displayed significant differences in terms of their 2008–2013 average MVAs per capita, ranging from $313 in Morocco, with the highest level in this quadrant, to $63 in the Sudan, with the lowest. Their average growth rates during 2008–2013 varied from 1.27 per cent in Morocco to -1.21 per cent in Algeria. The two countries with the highest MVA per capita levels – Mauritius at $944 and South Africa at $909 – fall into this quadrant. Among this group, Swaziland, with -4.34 per cent, recorded the worst growth rate. Libya belongs to this group as well (albeit not displayed in the figure), with an average growth rate of -13.90 per cent.
The top-left quadrant includes countries with a relatively lower manufacturing base but a significant level of growth, and includes Ethiopia, Chad, the United Republic of Tanzania and Nigeria. Ethiopia recorded the highest average growth rate, with 6.48 per cent during 2008–2013, followed by the United Republic of Tanzania with 4.91 per cent.
Finally, in the bottom-left quadrant, are countries with a declining MVA per capita from already relatively low levels, such as Burkina Faso, the Gambia and Burundi.
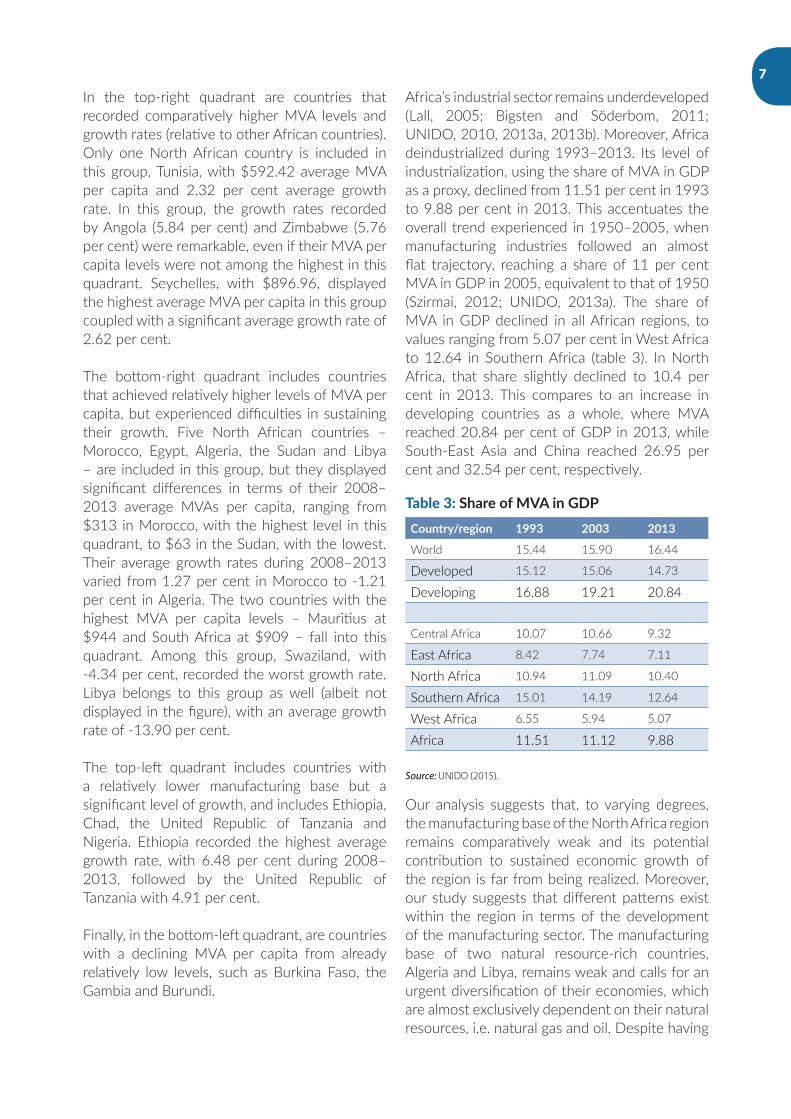
Africa’s industrial sector remains underdeveloped (Lall, 2005; Bigsten and Söderbom, 2011; UNIDO, 2010, 2013a, 2013b). Moreover, Africa deindustrialized during 1993–2013. Its level of industrialization, using the share of MVA in GDP as a proxy, declined from 11.51 per cent in 1993 to 9.88 per cent in 2013. This accentuates the overall trend experienced in 1950–2005, when manufacturing industries followed an almost flat trajectory, reaching a share of 11 per cent MVA in GDP in 2005, equivalent to that of 1950 (Szirmai, 2012; UNIDO, 2013a). The share of MVA in GDP declined in all African regions, to values ranging from 5.07 per cent in West Africa to 12.64 in Southern Africa (table 3). In North Africa, that share slightly declined to 10.4 per cent in 2013. This compares to an increase in developing countries as a whole, where MVA reached 20.84 per cent of GDP in 2013, while South-East Asia and China reached 26.95 per cent and 32.54 per cent, respectively.
Table 3: ShareofMVAinGDPCountry/region 1993 2003 2013
World 15.44 15.90 16.44
Developed 15.12 15.06 14.73
Developing 16.88 19.21 20.84
Central Africa 10.07 10.66 9.32
East Africa 8.42 7.74 7.11
North Africa 10.94 11.09 10.40
Southern Africa 15.01 14.19 12.64
West Africa 6.55 5.94 5.07
Africa 11.51 11.12 9.88
Source: UNIDO (2015).
Our analysis suggests that, to varying degrees, the manufacturing base of the North Africa region remains comparatively weak and its potential contribution to sustained economic growth of the region is far from being realized. Moreover, our study suggests that different patterns exist within the region in terms of the development of the manufacturing sector. The manufacturing base of two natural resource-rich countries, Algeria and Libya, remains weak and calls for an urgent diversification of their economies, which are almost exclusively dependent on their natural resources, i.e. natural gas and oil. Despite having
8
a relatively larger manufacturing base, the second group of countries – Tunisia, Egypt and Morocco – have witnessed a stagnation or decline in the contribution of their manufacturing sector to their economic growth over recent years due, among other reasons, to the political and social changes, and to their strong dependence on a handful of markets which have suffered a severe downturn. This has exacerbated the trend of previous years, when North Africa’s industrial sector failed to keep pace with the world’s most dynamic developing regions. With regard to international trade, North Africa continues to play a minor role at the global level, particularly in manufactured trade. Primary exports, which are exposed to the volatility of world prices, continue to lead North Africa’s export structure (Moll de Alba, 2014). The benefits of past commodity booms and regional economic growth have not been exploited to push forward the necessary structural transformation of the region. Moreover, North African manufactured exports are dominated by resource-based and low-technology products, and concentrate on a limited number of products and markets, thereby increasing their vulnerability to external shocks.
Given these facts, North African countries are implementing several reforms to accelerate the diversification of their economies. Against that context, regional trade agreements may constitute a key instrument to raise the participation of North African countries in global trade. The positive growth prospects of the African continent may convert CFTA into a chief opportunity, ex-ante, for North African countries to expand their manufactured exports based on the continent’s rapid urbanization and demographic evolution (Ref ERA, 2014). This assumption needs to be assessed to measure to what extent such trade reforms would play a pivotal role in the re-industrialization of North African countries. Besides CFTA, North African countries are embarked on two other major regional integration processes: GAFTA, with the countries of the League of Arab States; and the Euromed process with the European Union.
9
III. Economic impacts of implemented reforms
A. Impact of different scenarios on exports
1. With only CFTA in place
Global trends
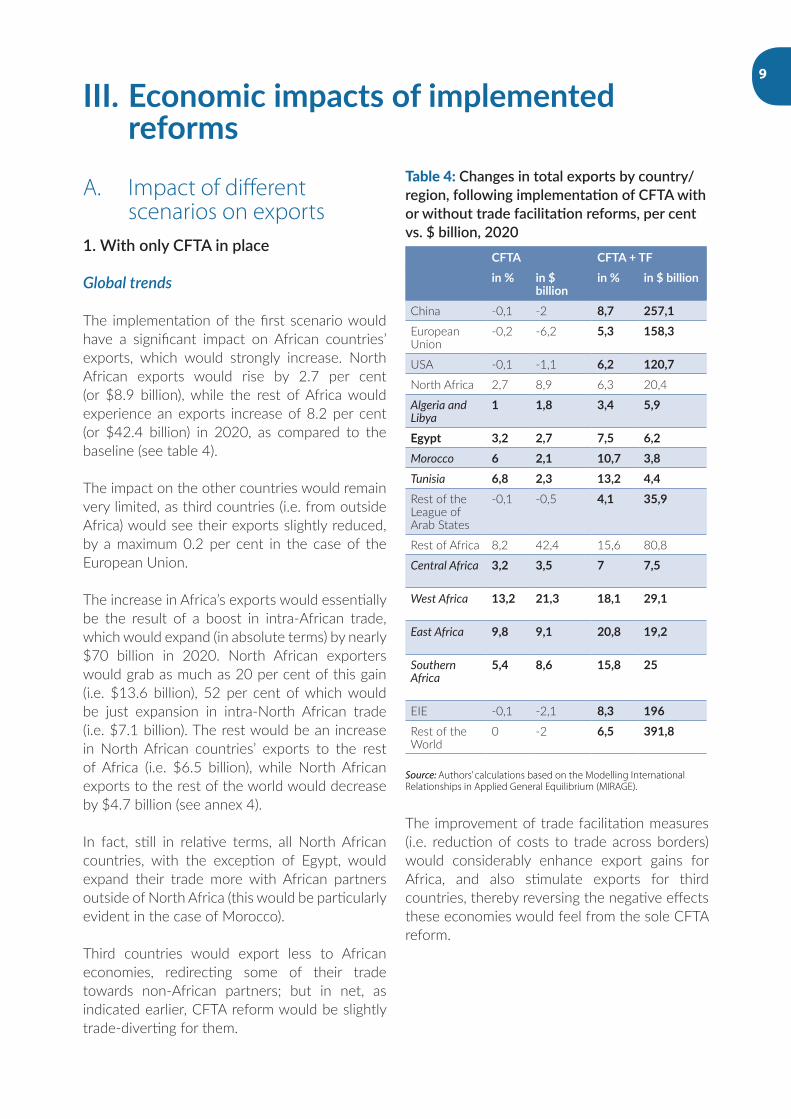
The implementation of the first scenario would have a significant impact on African countries’ exports, which would strongly increase. North African exports would rise by 2.7 per cent (or $8.9 billion), while the rest of Africa would experience an exports increase of 8.2 per cent (or $42.4 billion) in 2020, as compared to the baseline (see table 4).
The impact on the other countries would remain very limited, as third countries (i.e. from outside Africa) would see their exports slightly reduced, by a maximum 0.2 per cent in the case of the European Union.
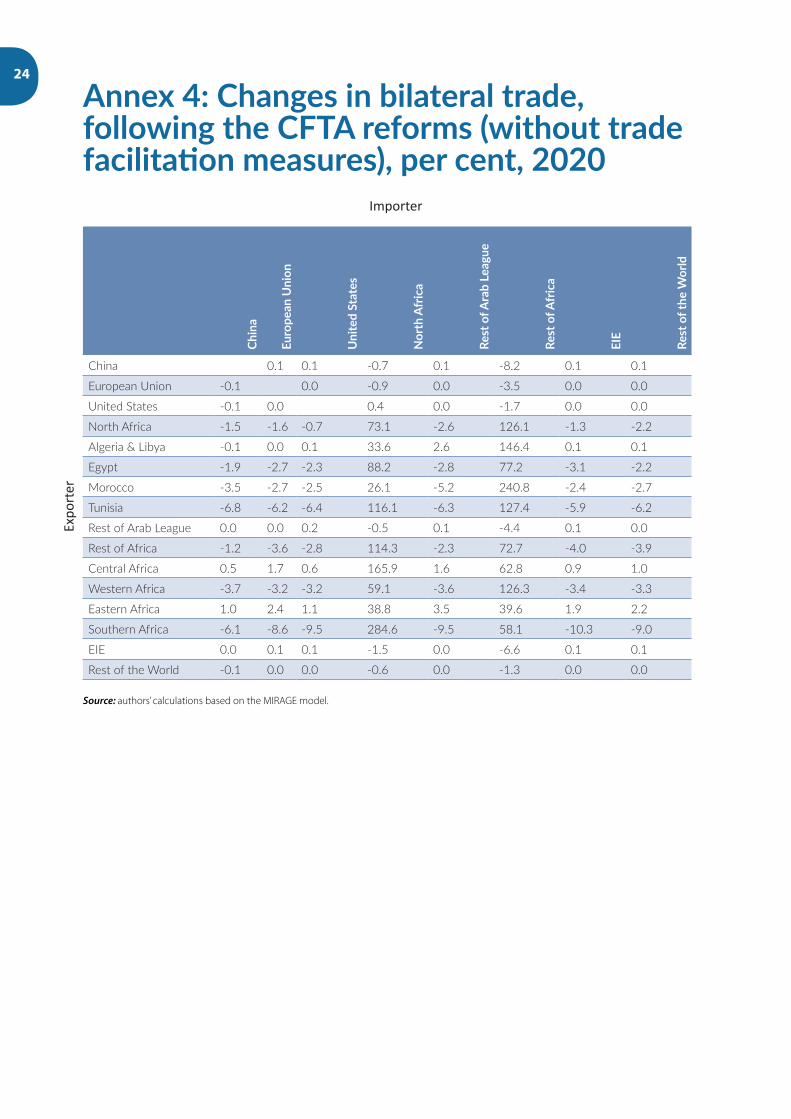
The increase in Africa’s exports would essentially be the result of a boost in intra-African trade, which would expand (in absolute terms) by nearly $70 billion in 2020. North African exporters would grab as much as 20 per cent of this gain (i.e. $13.6 billion), 52 per cent of which would be just expansion in intra-North African trade (i.e. $7.1 billion). The rest would be an increase in North African countries’ exports to the rest of Africa (i.e. $6.5 billion), while North African exports to the rest of the world would decrease by $4.7 billion (see annex 4).
In fact, still in relative terms, all North African countries, with the exception of Egypt, would expand their trade more with African partners outside of North Africa (this would be particularly evident in the case of Morocco).
Third countries would export less to African economies, redirecting some of their trade towards non-African partners; but in net, as indicated earlier, CFTA reform would be slightly trade-diverting for them.
Table 4: Changes in total exports by country/region, following implementation of CFTA with or without trade facilitation reforms, per cent vs. $ billion, 2020
CFTA CFTA+TFin% in$
billion in% in$billion
China -0,1 -2 8,7 257,1European Union
-0,2 -6,2 5,3 158,3
USA -0,1 -1,1 6,2 120,7North Africa 2,7 8,9 6,3 20,4
Algeria and Libya
1 1,8 3,4 5,9
Egypt 3,2 2,7 7,5 6,2Morocco 6 2,1 10,7 3,8Tunisia 6,8 2,3 13,2 4,4Rest of the League of Arab States
-0,1 -0,5 4,1 35,9
Rest of Africa 8,2 42,4 15,6 80,8
Central Africa 3,2 3,5 7 7,5
West Africa 13,2 21,3 18,1 29,1
East Africa 9,8 9,1 20,8 19,2
Southern Africa
5,4 8,6 15,8 25
EIE -0,1 -2,1 8,3 196Rest of the World
0 -2 6,5 391,8
Source: Authors’ calculations based on the Modelling International Relationships in Applied General Equilibrium (MIRAGE).
The improvement of trade facilitation measures (i.e. reduction of costs to trade across borders) would considerably enhance export gains for Africa, and also stimulate exports for third countries, thereby reversing the negative effects these economies would feel from the sole CFTA reform.
%
-0.2
-0.1
-1.1 6.22.78.96.320.41.01.83.45.93.22.77.56.26.02.110.7 3.86.82.313.2 4.4-0.1-0.5 4.135.9 8.242.415.680.83.23.57.07.513.2
10
B. Sectoral analysis: change in trade by main sector
As the main change in exports following CFTA implementation concerns trade within the continent, we focus our analysis on the changes in intra-African trade and intra-North African trade by main sectors.
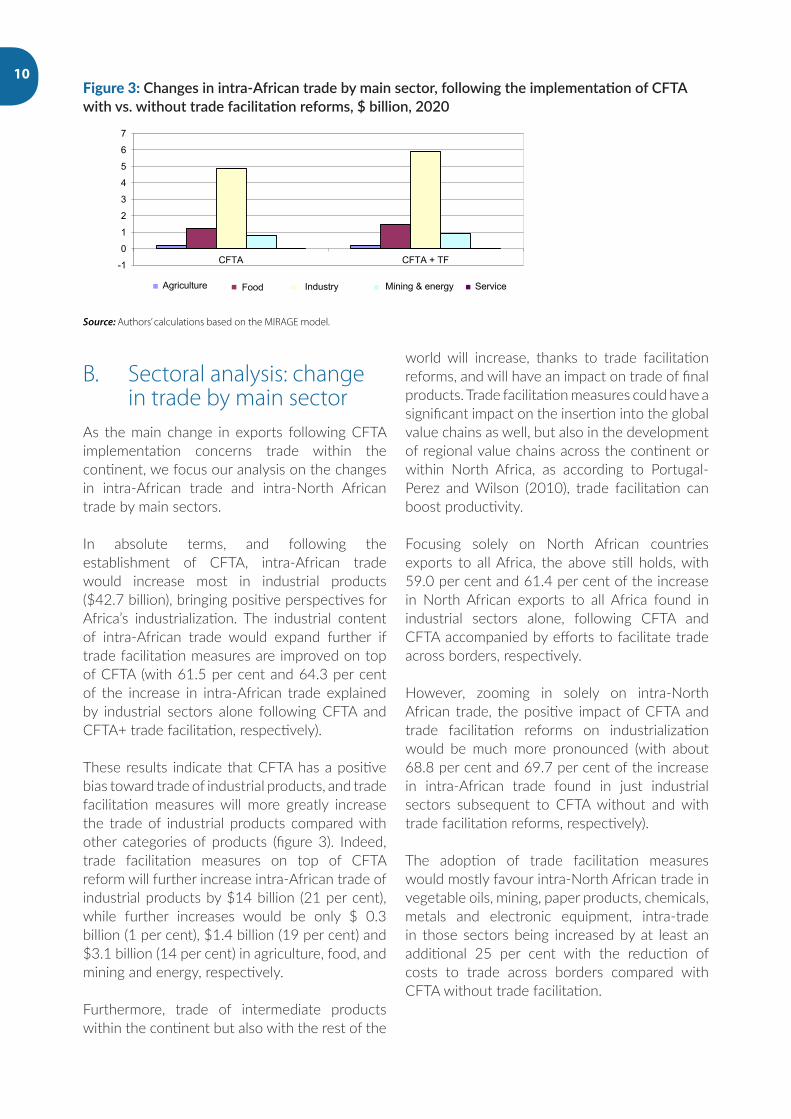
In absolute terms, and following the establishment of CFTA, intra-African trade would increase most in industrial products ($42.7 billion), bringing positive perspectives for Africa’s industrialization. The industrial content of intra-African trade would expand further if trade facilitation measures are improved on top of CFTA (with 61.5 per cent and 64.3 per cent of the increase in intra-African trade explained by industrial sectors alone following CFTA and CFTA+ trade facilitation, respectively).
These results indicate that CFTA has a positive bias toward trade of industrial products, and trade facilitation measures will more greatly increase the trade of industrial products compared with other categories of products (figure 3). Indeed, trade facilitation measures on top of CFTA reform will further increase intra-African trade of industrial products by $14 billion (21 per cent), while further increases would be only $ 0.3 billion (1 per cent), $1.4 billion (19 per cent) and $3.1 billion (14 per cent) in agriculture, food, and mining and energy, respectively.
Furthermore, trade of intermediate products within the continent but also with the rest of the
world will increase, thanks to trade facilitation reforms, and will have an impact on trade of final products. Trade facilitation measures could have a significant impact on the insertion into the global value chains as well, but also in the development of regional value chains across the continent or within North Africa, as according to Portugal-Perez and Wilson (2010), trade facilitation can boost productivity.
Focusing solely on North African countries exports to all Africa, the above still holds, with 59.0 per cent and 61.4 per cent of the increase in North African exports to all Africa found in industrial sectors alone, following CFTA and CFTA accompanied by efforts to facilitate trade across borders, respectively.
However, zooming in solely on intra-North African trade, the positive impact of CFTA and trade facilitation reforms on industrialization would be much more pronounced (with about 68.8 per cent and 69.7 per cent of the increase in intra-African trade found in just industrial sectors subsequent to CFTA without and with trade facilitation reforms, respectively).
The adoption of trade facilitation measures would mostly favour intra-North African trade in vegetable oils, mining, paper products, chemicals, metals and electronic equipment, intra-trade in those sectors being increased by at least an additional 25 per cent with the reduction of costs to trade across borders compared with CFTA without trade facilitation.
Figure 3: Changes in intra-African trade by main sector, following the implementation of CFTA with vs. without trade facilitation reforms, $ billion, 2020
-1
0
1
2
3
4
5
6
7
CFTA CFTA + TF
Agriculture Food Industry Mining & energy Service
Source: Authors’ calculations based on the MIRAGE model.
11
2. If a Pan-Arab free trade agreement is in place on top of CFTA
a. Changes at the global level
The second set of scenarios implies an additional free trade agreement (FTA) with League of Arab States countries on top of CFTA. Against this context, the significant increase in intra-African trade, thanks to CFTA, is complemented by a substantial increase in intra-League of Arab States trade (i.e. North Africa plus the rest of the League of Arab States), which would expand (in absolute terms) by nearly $15 billion in 2020. Export benefits for North African countries alone would expand by an additional $3.8 billion compared with having only CFTA in place (i.e. $12.7 billion with both a Pan-Arab FTA and CFTA versus $8.9 billion with only CFTA). Countries from the rest of the League of Arab States would pass from a net trade diversion situation under CFTA alone to net trade creation if a Pan-Arab FTA is established in parallel with CFTA reform.
The trade diversion for intra-African trade is very limited (following the fact that some North African countries tend to export more towards the rest of the League of Arab States at the expense of exports to African partners – from North Africa as well as the rest of Africa): intra-
African trade would increase by $69.5 billion and $68.9 billion with CFTA and CFTA plus Pan-Arab FTA, respectively. Third countries’ exports towards the League of Arab States (North Africa and the rest of the League of Arab States) would be reduced further (than if only CFTA were implemented), but this trade diversion effect for third countries would still remain relatively limited.
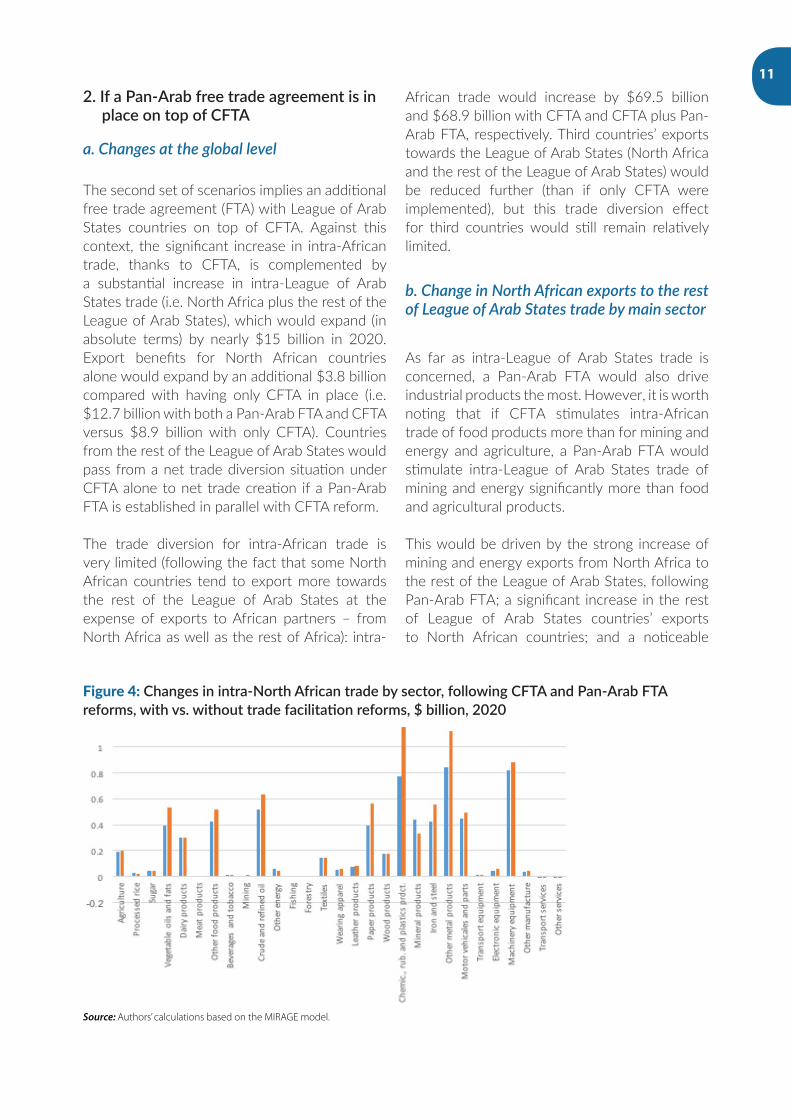
b. Change in North African exports to the rest of League of Arab States trade by main sector
As far as intra-League of Arab States trade is concerned, a Pan-Arab FTA would also drive industrial products the most. However, it is worth noting that if CFTA stimulates intra-African trade of food products more than for mining and energy and agriculture, a Pan-Arab FTA would stimulate intra-League of Arab States trade of mining and energy significantly more than food and agricultural products.
This would be driven by the strong increase of mining and energy exports from North Africa to the rest of the League of Arab States, following Pan-Arab FTA; a significant increase in the rest of League of Arab States countries’ exports to North African countries; and a noticeable
Figure 4: Changes in intra-North African trade by sector, following CFTA and Pan-Arab FTA reforms, with vs. without trade facilitation reforms, $ billion, 2020
Source: Authors’ calculations based on the MIRAGE model.
12
increase in intra-rest of League of Arab States (excluding North African countries) trade of mining and energy.
Turning to intra-rest of League of Arab States trade, industrial products are also the most stimulated, and the benefits of having a Pan-Arab FTA in place are clear. But benefits for mining and energy products in intra-trade expansion (as highlighted earlier) are also evident, and it is interesting to note that trade facilitation measures matter tremendously for intra-League of Arab States trade of industrial products (as it is the sector making the largest progression with trade facilitation reforms in relative terms and compared with a situation without trade facilitation measures). This result confirms in a more pronounced way the previous result in the case of CFTA and trade facilitation.
3. Euromed FTA on top of CFTA and Pan-Arab FTA
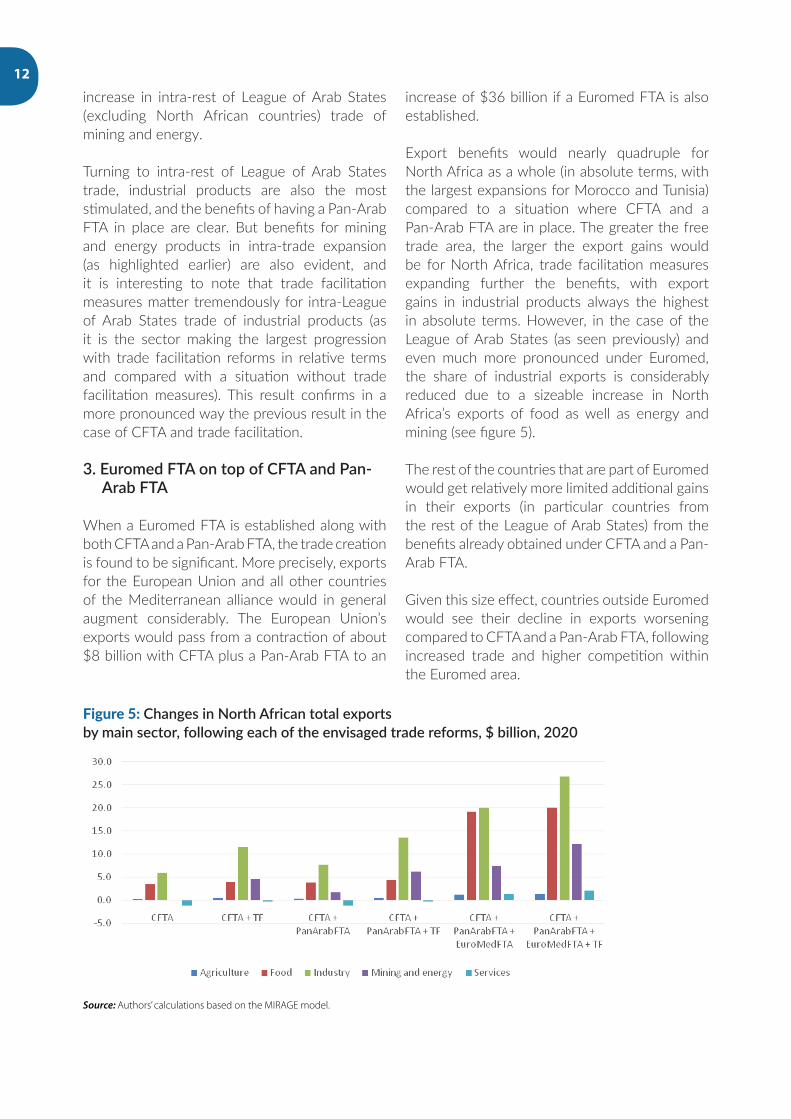
When a Euromed FTA is established along with both CFTA and a Pan-Arab FTA, the trade creation is found to be significant. More precisely, exports for the European Union and all other countries of the Mediterranean alliance would in general augment considerably. The European Union’s exports would pass from a contraction of about $8 billion with CFTA plus a Pan-Arab FTA to an
increase of $36 billion if a Euromed FTA is also established.
Export benefits would nearly quadruple for North Africa as a whole (in absolute terms, with the largest expansions for Morocco and Tunisia) compared to a situation where CFTA and a Pan-Arab FTA are in place. The greater the free trade area, the larger the export gains would be for North Africa, trade facilitation measures expanding further the benefits, with export gains in industrial products always the highest in absolute terms. However, in the case of the League of Arab States (as seen previously) and even much more pronounced under Euromed, the share of industrial exports is considerably reduced due to a sizeable increase in North Africa’s exports of food as well as energy and mining (see figure 5).
The rest of the countries that are part of Euromed would get relatively more limited additional gains in their exports (in particular countries from the rest of the League of Arab States) from the benefits already obtained under CFTA and a Pan-Arab FTA.
Given this size effect, countries outside Euromed would see their decline in exports worsening compared to CFTA and a Pan-Arab FTA, following increased trade and higher competition within the Euromed area.
Figure 5: Changes in North African total exports by main sector, following each of the envisaged trade reforms, $ billion, 2020
Source: Authors’ calculations based on the MIRAGE model.
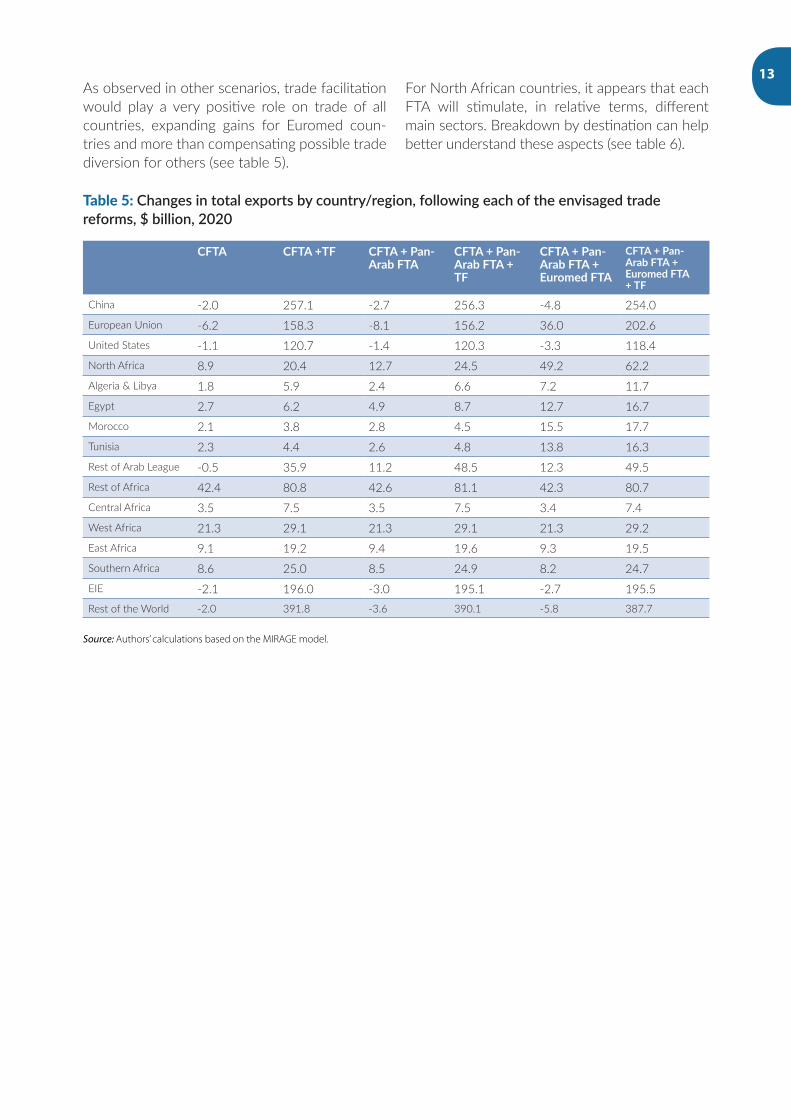
13As observed in other scenarios, trade facilitation would play a very positive role on trade of all countries, expanding gains for Euromed coun-tries and more than compensating possible trade diversion for others (see table 5).
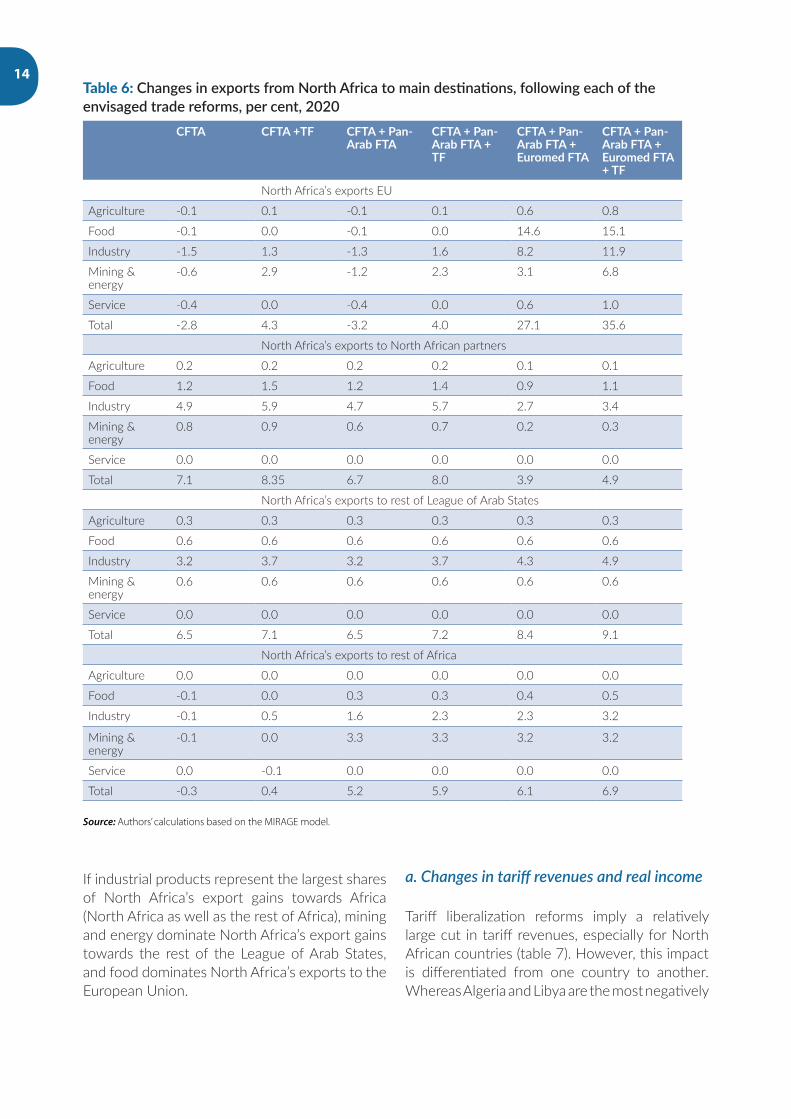
For North African countries, it appears that each FTA will stimulate, in relative terms, different main sectors. Breakdown by destination can help better understand these aspects (see table 6).
Table 5: Changes in total exports by country/region, following each of the envisaged trade reforms, $ billion, 2020
CFTA CFTA+TF CFTA+Pan-ArabFTA
CFTA+Pan-ArabFTA+TF
CFTA+Pan-ArabFTA+EuromedFTA
CFTA+Pan-ArabFTA+EuromedFTA+TF
China -2.0 257.1 -2.7 256.3 -4.8 254.0European Union -6.2 158.3 -8.1 156.2 36.0 202.6United States -1.1 120.7 -1.4 120.3 -3.3 118.4North Africa 8.9 20.4 12.7 24.5 49.2 62.2Algeria & Libya 1.8 5.9 2.4 6.6 7.2 11.7Egypt 2.7 6.2 4.9 8.7 12.7 16.7Morocco 2.1 3.8 2.8 4.5 15.5 17.7Tunisia 2.3 4.4 2.6 4.8 13.8 16.3Rest of Arab League -0.5 35.9 11.2 48.5 12.3 49.5Rest of Africa 42.4 80.8 42.6 81.1 42.3 80.7Central Africa 3.5 7.5 3.5 7.5 3.4 7.4West Africa 21.3 29.1 21.3 29.1 21.3 29.2East Africa 9.1 19.2 9.4 19.6 9.3 19.5Southern Africa 8.6 25.0 8.5 24.9 8.2 24.7EIE -2.1 196.0 -3.0 195.1 -2.7 195.5Rest of the World -2.0 391.8 -3.6 390.1 -5.8 387.7
Source: Authors’ calculations based on the MIRAGE model.
14
If industrial products represent the largest shares of North Africa’s export gains towards Africa (North Africa as well as the rest of Africa), mining and energy dominate North Africa’s export gains towards the rest of the League of Arab States, and food dominates North Africa’s exports to the European Union.
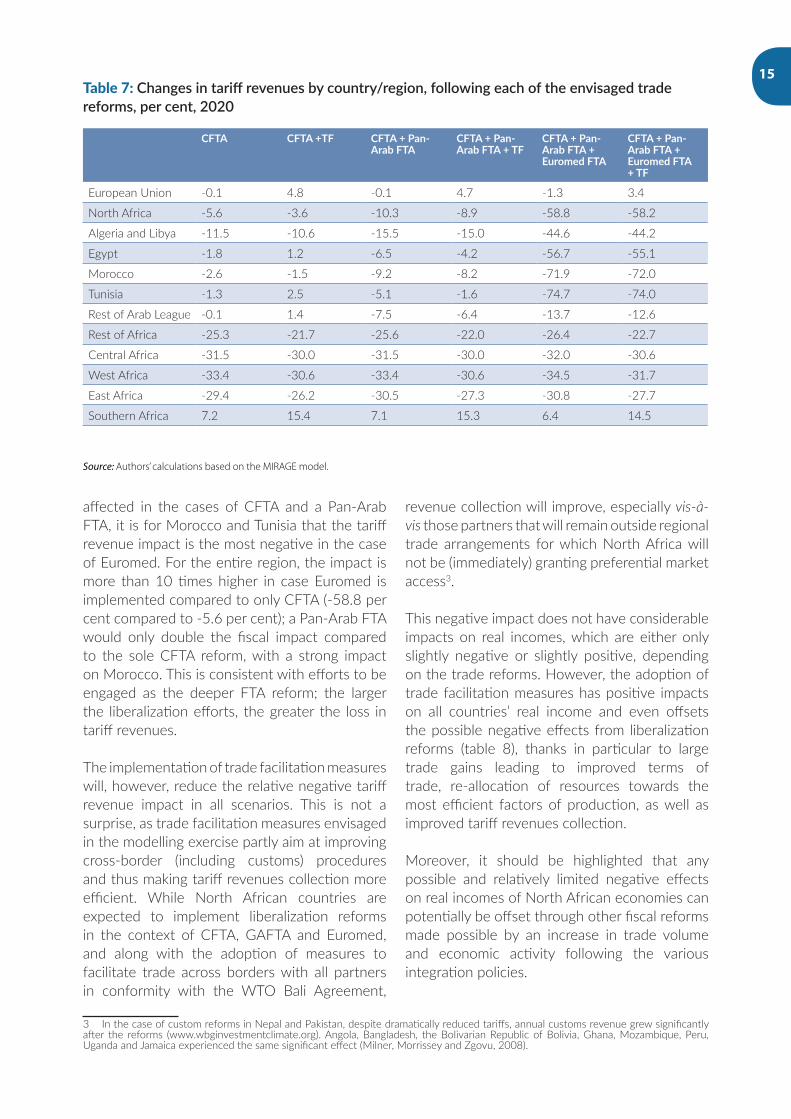
a. Changes in tariff revenues and real income
Tariff liberalization reforms imply a relatively large cut in tariff revenues, especially for North African countries (table 7). However, this impact is differentiated from one country to another. Whereas Algeria and Libya are the most negatively
Table 6: Changes in exports from North Africa to main destinations, following each of the envisaged trade reforms, per cent, 2020
CFTA CFTA+TF CFTA+Pan-ArabFTA
CFTA+Pan-ArabFTA+TF
CFTA+Pan-ArabFTA+EuromedFTA
CFTA+Pan-ArabFTA+EuromedFTA+TF
North Africa’s exports EU
Agriculture -0.1 0.1 -0.1 0.1 0.6 0.8
Food -0.1 0.0 -0.1 0.0 14.6 15.1
Industry -1.5 1.3 -1.3 1.6 8.2 11.9
Mining & energy
-0.6 2.9 -1.2 2.3 3.1 6.8
Service -0.4 0.0 -0.4 0.0 0.6 1.0
Total -2.8 4.3 -3.2 4.0 27.1 35.6
North Africa’s exports to North African partners
Agriculture 0.2 0.2 0.2 0.2 0.1 0.1
Food 1.2 1.5 1.2 1.4 0.9 1.1
Industry 4.9 5.9 4.7 5.7 2.7 3.4
Mining & energy
0.8 0.9 0.6 0.7 0.2 0.3
Service 0.0 0.0 0.0 0.0 0.0 0.0
Total 7.1 8.35 6.7 8.0 3.9 4.9
North Africa’s exports to rest of League of Arab States
Agriculture 0.3 0.3 0.3 0.3 0.3 0.3
Food 0.6 0.6 0.6 0.6 0.6 0.6
Industry 3.2 3.7 3.2 3.7 4.3 4.9
Mining & energy
0.6 0.6 0.6 0.6 0.6 0.6
Service 0.0 0.0 0.0 0.0 0.0 0.0
Total 6.5 7.1 6.5 7.2 8.4 9.1
North Africa’s exports to rest of Africa
Agriculture 0.0 0.0 0.0 0.0 0.0 0.0
Food -0.1 0.0 0.3 0.3 0.4 0.5
Industry -0.1 0.5 1.6 2.3 2.3 3.2
Mining & energy
-0.1 0.0 3.3 3.3 3.2 3.2
Service 0.0 -0.1 0.0 0.0 0.0 0.0
Total -0.3 0.4 5.2 5.9 6.1 6.9
Source: Authors’ calculations based on the MIRAGE model.
15
affected in the cases of CFTA and a Pan-Arab FTA, it is for Morocco and Tunisia that the tariff revenue impact is the most negative in the case of Euromed. For the entire region, the impact is more than 10 times higher in case Euromed is implemented compared to only CFTA (-58.8 per cent compared to -5.6 per cent); a Pan-Arab FTA would only double the fiscal impact compared to the sole CFTA reform, with a strong impact on Morocco. This is consistent with efforts to be engaged as the deeper FTA reform; the larger the liberalization efforts, the greater the loss in tariff revenues.
The implementation of trade facilitation measures will, however, reduce the relative negative tariff revenue impact in all scenarios. This is not a surprise, as trade facilitation measures envisaged in the modelling exercise partly aim at improving cross-border (including customs) procedures and thus making tariff revenues collection more efficient. While North African countries are expected to implement liberalization reforms in the context of CFTA, GAFTA and Euromed, and along with the adoption of measures to facilitate trade across borders with all partners in conformity with the WTO Bali Agreement,
3 In the case of custom reforms in Nepal and Pakistan, despite dramatically reduced tariffs, annual customs revenue grew significantly after the reforms (www.wbginvestmentclimate.org). Angola, Bangladesh, the Bolivarian Republic of Bolivia, Ghana, Mozambique, Peru, Uganda and Jamaica experienced the same significant effect (Milner, Morrissey and Zgovu, 2008).
revenue collection will improve, especially vis-à-vis those partners that will remain outside regional trade arrangements for which North Africa will not be (immediately) granting preferential market access3.
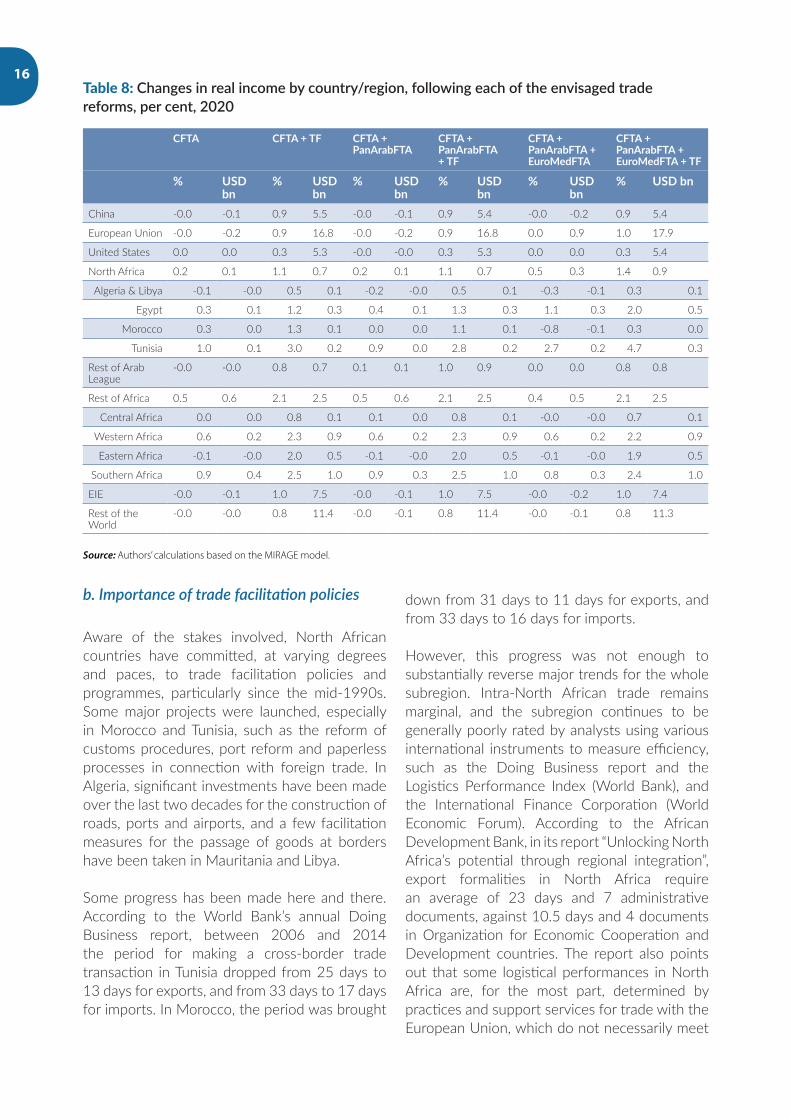
This negative impact does not have considerable impacts on real incomes, which are either only slightly negative or slightly positive, depending on the trade reforms. However, the adoption of trade facilitation measures has positive impacts on all countries’ real income and even offsets the possible negative effects from liberalization reforms (table 8), thanks in particular to large trade gains leading to improved terms of trade, re-allocation of resources towards the most efficient factors of production, as well as improved tariff revenues collection.
Moreover, it should be highlighted that any possible and relatively limited negative effects on real incomes of North African economies can potentially be offset through other fiscal reforms made possible by an increase in trade volume and economic activity following the various integration policies.
Table 7: Changes in tariff revenues by country/region, following each of the envisaged trade reforms, per cent, 2020
CFTA CFTA+TF CFTA+Pan-ArabFTA
CFTA+Pan-ArabFTA+TF
CFTA+Pan-ArabFTA+EuromedFTA
CFTA+Pan-ArabFTA+EuromedFTA+TF
European Union -0.1 4.8 -0.1 4.7 -1.3 3.4
North Africa -5.6 -3.6 -10.3 -8.9 -58.8 -58.2
Algeria and Libya -11.5 -10.6 -15.5 -15.0 -44.6 -44.2
Egypt -1.8 1.2 -6.5 -4.2 -56.7 -55.1
Morocco -2.6 -1.5 -9.2 -8.2 -71.9 -72.0
Tunisia -1.3 2.5 -5.1 -1.6 -74.7 -74.0
Rest of Arab League -0.1 1.4 -7.5 -6.4 -13.7 -12.6
Rest of Africa -25.3 -21.7 -25.6 -22.0 -26.4 -22.7
Central Africa -31.5 -30.0 -31.5 -30.0 -32.0 -30.6
West Africa -33.4 -30.6 -33.4 -30.6 -34.5 -31.7
East Africa -29.4 -26.2 -30.5 -27.3 -30.8 -27.7
Southern Africa 7.2 15.4 7.1 15.3 6.4 14.5
Source: Authors’ calculations based on the MIRAGE model.
-15.5-15.0-44.6
1.2 -6.5-4.2-56.7-55.1
-1.5 -9.2-8.2-71.9-72.0
2.5
-5.1-1.6-74.7-74.01.4 -7.5-6.4-13.7-12.6-21.7
16
b. Importance of trade facilitation policies
Aware of the stakes involved, North African countries have committed, at varying degrees and paces, to trade facilitation policies and programmes, particularly since the mid-1990s. Some major projects were launched, especially in Morocco and Tunisia, such as the reform of customs procedures, port reform and paperless processes in connection with foreign trade. In Algeria, significant investments have been made over the last two decades for the construction of roads, ports and airports, and a few facilitation measures for the passage of goods at borders have been taken in Mauritania and Libya.
Some progress has been made here and there. According to the World Bank’s annual Doing Business report, between 2006 and 2014 the period for making a cross-border trade transaction in Tunisia dropped from 25 days to 13 days for exports, and from 33 days to 17 days for imports. In Morocco, the period was brought
down from 31 days to 11 days for exports, and from 33 days to 16 days for imports.
However, this progress was not enough to substantially reverse major trends for the whole subregion. Intra-North African trade remains marginal, and the subregion continues to be generally poorly rated by analysts using various international instruments to measure efficiency, such as the Doing Business report and the Logistics Performance Index (World Bank), and the International Finance Corporation (World Economic Forum). According to the African Development Bank, in its report “Unlocking North Africa’s potential through regional integration”, export formalities in North Africa require an average of 23 days and 7 administrative documents, against 10.5 days and 4 documents in Organization for Economic Cooperation and Development countries. The report also points out that some logistical performances in North Africa are, for the most part, determined by practices and support services for trade with the European Union, which do not necessarily meet
Table 8: Changes in real income by country/region, following each of the envisaged trade reforms, per cent, 2020
CFTA CFTA+TF CFTA+PanArabFTA
CFTA+PanArabFTA+TF
CFTA+PanArabFTA+EuroMedFTA
CFTA+PanArabFTA+EuroMedFTA+TF
% USDbn
% USDbn
% USDbn
% USDbn
% USDbn
% USDbn
China -0.0 -0.1 0.9 5.5 -0.0 -0.1 0.9 5.4 -0.0 -0.2 0.9 5.4
European Union -0.0 -0.2 0.9 16.8 -0.0 -0.2 0.9 16.8 0.0 0.9 1.0 17.9
United States 0.0 0.0 0.3 5.3 -0.0 -0.0 0.3 5.3 0.0 0.0 0.3 5.4
North Africa 0.2 0.1 1.1 0.7 0.2 0.1 1.1 0.7 0.5 0.3 1.4 0.9
Algeria & Libya -0.1 -0.0 0.5 0.1 -0.2 -0.0 0.5 0.1 -0.3 -0.1 0.3 0.1
Egypt 0.3 0.1 1.2 0.3 0.4 0.1 1.3 0.3 1.1 0.3 2.0 0.5
Morocco 0.3 0.0 1.3 0.1 0.0 0.0 1.1 0.1 -0.8 -0.1 0.3 0.0
Tunisia 1.0 0.1 3.0 0.2 0.9 0.0 2.8 0.2 2.7 0.2 4.7 0.3
Rest of Arab League
-0.0 -0.0 0.8 0.7 0.1 0.1 1.0 0.9 0.0 0.0 0.8 0.8
Rest of Africa 0.5 0.6 2.1 2.5 0.5 0.6 2.1 2.5 0.4 0.5 2.1 2.5
Central Africa 0.0 0.0 0.8 0.1 0.1 0.0 0.8 0.1 -0.0 -0.0 0.7 0.1
Western Africa 0.6 0.2 2.3 0.9 0.6 0.2 2.3 0.9 0.6 0.2 2.2 0.9
Eastern Africa -0.1 -0.0 2.0 0.5 -0.1 -0.0 2.0 0.5 -0.1 -0.0 1.9 0.5
Southern Africa 0.9 0.4 2.5 1.0 0.9 0.3 2.5 1.0 0.8 0.3 2.4 1.0
EIE -0.0 -0.1 1.0 7.5 -0.0 -0.1 1.0 7.5 -0.0 -0.2 1.0 7.4
Rest of the World
-0.0 -0.0 0.8 11.4 -0.0 -0.1 0.8 11.4 -0.0 -0.1 0.8 11.3
Source: Authors’ calculations based on the MIRAGE model.
17
the special needs regarding the integration of road transport, transit and border controls within the region.
Although all North African countries are partners in several free trade agreements, projects or customs unions, inter-State cooperation remains generally limited in the area of harmonization of customs frameworks, procedures and documentation required for import and export activities. This is clearly reflected by the time, cost and number of documents required for cross-border trade, as explained above. Moreover, it seems that the multiplicity of existing customs agreements can be a source of confusion and conflicting standards, which could hamper the dynamics of intra-North African trade.
Existing agreements refer, in fact, to different rules of origin or lists of exceptions. This means the same goods from the same country, for example Morocco, sent to Tunisia or Algeria, may be taxed differently, depending on the scheme in place. Such an environment is conducive to conflict and may deter traders from initiating commercial transactions, knowing that customs authorities may, on both sides of the border, choose on a discretionary or discriminatory basis the arrangements to be applied, without
possibility for the decision to be necessarily challenged. In their commercial relations with the European Union, North African countries do not face this problem, which widens the gap of the volumes traded vertically and horizontally.
Thus, the relative performance noted in connection with North African countries’ regulatory frameworks for trade facilitation are mainly due to the bilateral agreements signed with the European Union and/or the United States. These North–South agreements encouraged the four major North African exporters to introduce customs reforms that have made the cost of these countries’ commercial transactions with Europe lower than with their immediate neighbours. However, once it is fully implemented, the Bali Agreement on trade facilitation will presumably expand prospects for the promotion of regional trade integration, and supplement existing subregional and bilateral agreements.
18
IV. ConclusionsandrecommendationsDuring different phases of their economic development, North African countries have implemented voluntary policies for their structural transformation, without significant success, particularly when their evolution is compared with East Asian developing countries. During the last decade, North African countries have experienced a stagnation of the contribution of their manufacturing industries to GDP, and have even faced a deindustrialization to some extent during the second part of this period. Despite displaying the highest level of MVA per capita among African regions with $276, MVA accounts for one tenth of the North African region’s GDP, compared with more than one fifth in developing countries as a whole, and the growth of its manufacturing sector continues to lag behind that of its overall economy (2.64 compared to 2.09 per cent growth of GDP and MVA during the period 2008–2013, respectively).
The North African region has failed, in the last decade, to expand significantly its industrial base. The region has not exploited the potential offered by the manufacturing sector to sustain the economic growth of the region and achieve significant structural transformation. It is worth reiterating that two distinct patterns of industrial development co-exist in the region: on the one hand, Algeria and Libya, rich in natural resources, have a meagre industrial base, calling for the urgent diversification of their economies; on the other hand, the relatively larger manufacturing base of Tunisia, Egypt and Morocco have stagnated or declined over recent years, partly as a consequence of the political and social changes undergone in the region and, among other reasons, due to their strong dependence on a limited number of markets severely affected by the recent international crisis.
Trade policy can make significant contributions, particularly to increase processing to lead to higher value added. Regional trade agreements may constitute a key instrument to raise the participation of North African countries in global trade. The positive growth prospects of the African continent, related to the rapid
urbanization and growth of the middle class, may convert CFTA into a serious opportunity for North African economies to expand their manufactured exports. Given their traditional trade relations with Europe and to a lesser extent with the rest of the Arab countries, this assumption has been assessed also within the context of GAFTA with the countries of the League of Arab States, and the Euromed process with the European Union.
In this study, three sets of scenarios were empirically assessed using Computable General Equilibrium modelling: establishment of CFTA with and without trade facilitation reforms; effective implementation of GAFTA in the context of CFTA with and without adoption of trade facilitation measures; and Euromed fully functioning with GAFTA and CFTA also in place with and without measures to facilitate cross-border trade.
Findings indicate that, in absolute terms, the establishment of CFTA would boost intra-African trade, with industrial products being the most stimulated (with as much as $42.7 billion of the $69.5 billion increase in intra-African trade found in just industrial products), bringing positive perspectives for Africa’s industrialization. The industrial content of intra-African trade would expand further if trade facilitation measures were improved on top of CFTA. Indeed, when trade facilitation measures are adopted in context of CFTA reform, intra-African trade of industrial products will increase further by $14 billion. Focusing solely on the impact on intra-North African trade, the positive effects of CFTA and trade facilitation reforms on industrialization would be even more pronounced.
A Pan-Arab FTA established in parallel to CFTA would further increase trade of industrial products for North African countries and also other League of Arab States countries. However, it is worth noting that the share of the trade gains in industrial products for North African countries would be noticeably reduced compared to the sole CFTA reform, due to a strong increase in intra-League of Arab States trade (and especially
19
exports and imports of North African countries to/from League of Arab States partners) of mining and energy, but also food. In this case also, trade facilitation measures matter tremendously for North Africa’s trade of industrial products, as it is the sector making the largest progression with trade facilitation reforms adopted, in relative terms and compared to a situation without trade facilitation.
When a Euromed FTA is established along with both CFTA and a Pan-Arab FTA, the additional trade creation is considerable. More precisely, exports for the European Union and all other countries of the Mediterranean alliance, and especially North African countries, would in general augment tremendously, especially if costs to trade across borders are reduced. However, as observed with the Pan-Arab FTA – and although in the absolute North African exports of industrial products still increase most and further with Euromed on top of CFTA and GAFTA – the proportion of industrial products in North Africa’s export gains would shrink under the strong increase in food exports from North Africa to the European Union following the formation of the Euromed FTA.
In other words, it appears that each FTA configuration will stimulate most, in relative terms, different main sectors of North African countries’ exports. Whereas industrial products represent the largest shares of North Africa’s export gains towards Africa (North Africa as well as the rest of Africa), mining and energy dominate North Africa’s export gains towards the rest of the League of Arab States, and food dominates North Africa’s exports to the European Union. This has to do largely with the very different current trade structures between North Africa and its partners from Africa, the League of Arab States and the European Union.
Therefore, the establishment of CFTA, accompanied by trade facilitation measures,
appears critical in providing support for the industrialization of North African economies. Indeed, if GAFTA and Euromed were to be established without CFTA in place, then the pro-industrialization effects would be much more marginal for North African economies.
Obviously, regional integration reforms that offer clear new market opportunities for North African nations come with a cost, as they generate tariff revenue losses which can lead to mitigated real income effects (some countries being hurt more than others). However, complementary policies – such as the adoption of trade facilitation measures – are critical to guarantee better distributed outcomes and specifically real income gains for all North African countries and more broadly all African economies. These measures also help considerably, boosting further intraregional trade and export-led industrialization. Of course, such outcomes would only be possible if adjustment efforts were made to tackle tariff revenue contractions (including efforts to limit illicit financial outflows through trade mis-pricing; see Mevel et al., 2016) at the country level; exemptions from trade liberalization efforts (such as so-called “sensitive products”) are prohibited or strictly limited; reforms are fully implemented and effective; and coordination is improved between trade and industrial policy.
Furthermore, trade facilitation reforms will have their maximum impact if in parallel an important endeavour is made on trade infrastructure, highlighting the key importance of financial resources dedicated to these efforts. Generalizing the creation of common funds and regional development banks to finance key infrastructure projects and other projects aimed at easing trade across borders will be of special importance, as they often benefit a large number of countries and facilitate the development of regional value chains. Against that context, the aid for trade projects in particular should focus more towards the objective of boosting intraregional trade.
20
Annex1:Modelusedanddescriptionoftrade reforms
4 See Decreux and Valin (2007) for full description of the model features.5 See Narayanan et al. (2012).6 See Boumellassa et al. (2009).7 It should be noted that Algeria and Libya are lumped together into the GTAP database under the “Rest of North Africa” region and therefore results from the simulation exercise cannot be drawn for each of the two countries separately. Similarly, the Sudan is part of the “Rest of Eastern Africa” region in the GTAP database.
A. Main model assumptions, data requirements, and geographic and sectoral decomposition
This analysis relies on the MIRAGE multi-country multisectoral Computable General Equilibrium model, particularly well designed for trade policy analysis. The dynamic version of the model is utilized with its standard closure. The dynamic is recursive, implying a succession of equilibriums being solved sequentially from one year to another. See chapter IV for a more detailed description of the model and its main assumptions4. The model relies on the Global Trade Analysis Project (GTAP) database version 8.15
for macroeconomic and bilateral trade data, while the Market Access Map at Harmonized System 6-digit (MAcMap-HS6) database version 26
is employed for bilateral protection information. The MAcMap-HS6 database is updated with key evolutions to date (such as those that reflect the Everything But Arms initiative, the African Growth and Opportunity Act, and the enlargement of the European Union to 28 members).
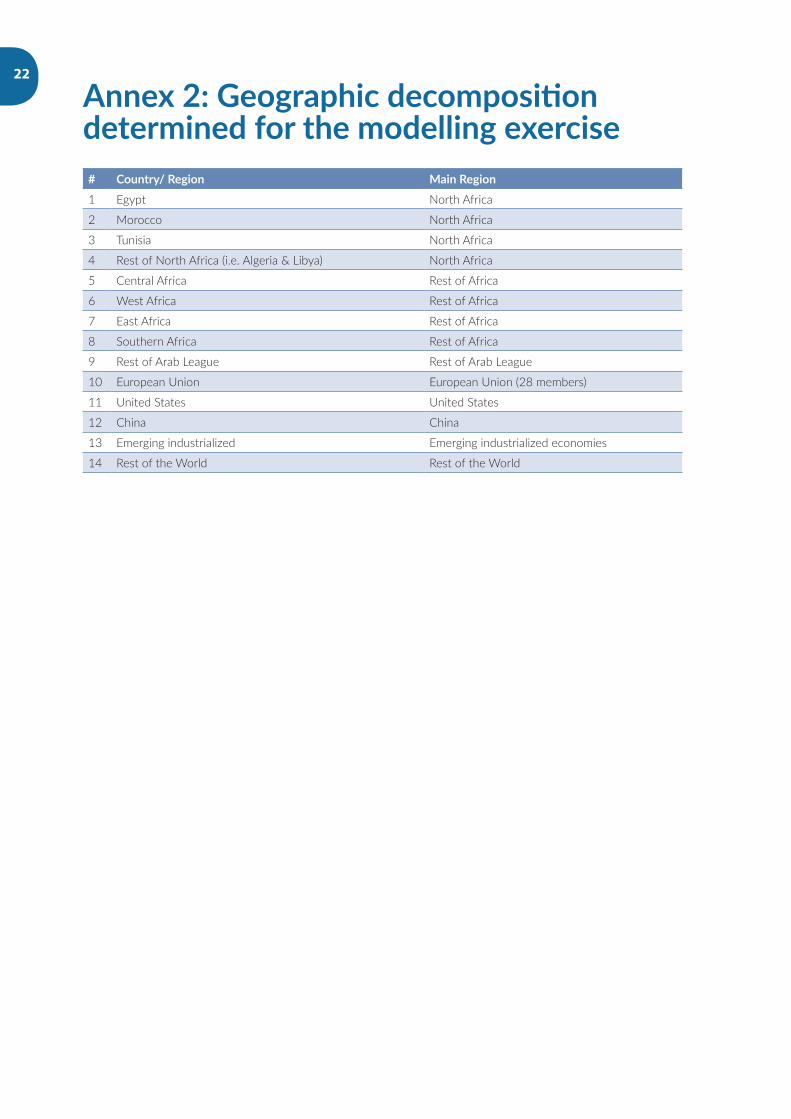
Considering both solver limitations and constraints from the GTAP database in terms of geographic and sectoral details, simulations are conducted with a total of 14 countries or regions and 29 sectors.
The focus being on North Africa, all the North African countries available in the GTAP version 8.1 database are preserved7. The rest of African countries are aggregated in the four remaining African regions. The main trading partners (i.e. the European Union, the United States and China) are also kept as they are available in the database, while all other
countries and regions are aggregated into two groups: Emerging Industrialized Economies (EIE) and the rest of the world (see annex 2).
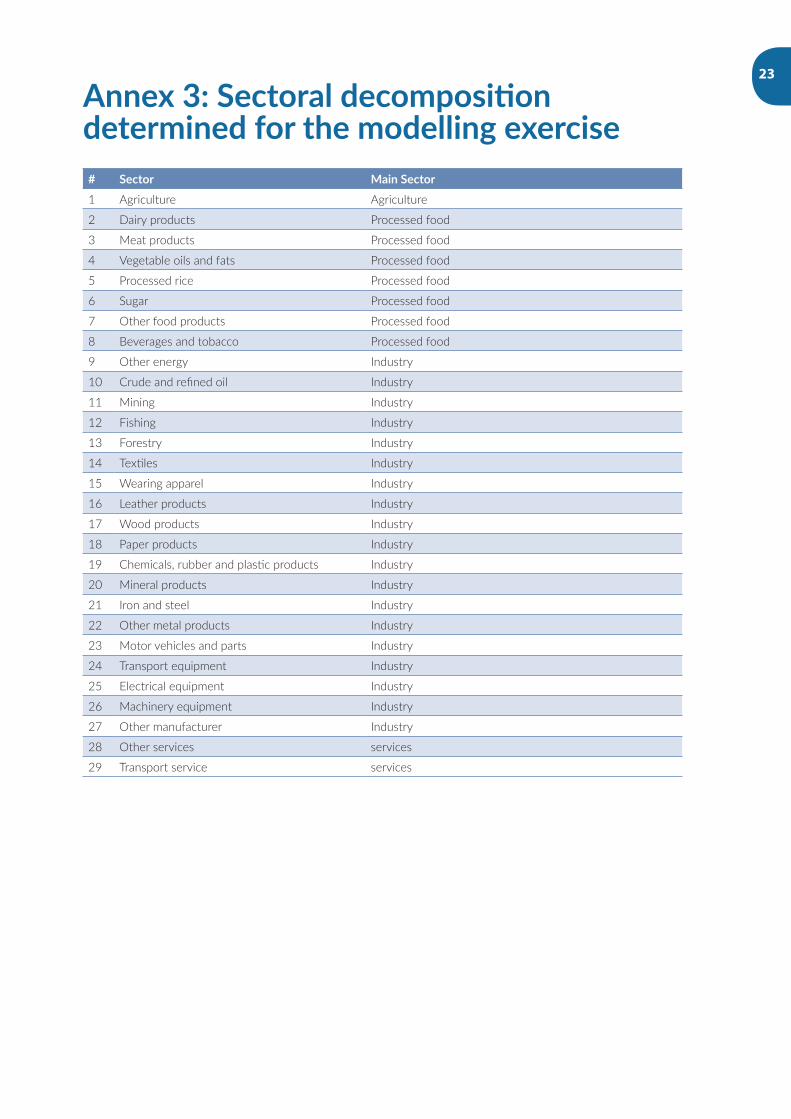
Regarding the sectoral aggregation, emphasis is put on industrial manufacturing sectors, which are key for North African countries’ structural transformation. In other words, as many details as possible were kept for these sectors. In total, 29 sectors were considered, which can be decomposed into Agriculture (1), Food (7), Industrial Manufacturing (16), Mining and Energy (3) and Service Sectors (2) (see annex 3).
Following the decision to tentatively establish a CFTA by 2017, all the scenarios in this study will be fully implemented by 2017. Moreover, while the reforms are assumed to be effective by 2017, outcomes are given for the year 2020 in order for all variables of the model to properly adjust to shocks. Unless otherwise indicated, these yearly outcomes are given by comparison between the scenarios and the reference (or baseline, i.e. without trade reforms) either in per cent or absolute changes.
B. Trade reforms
A clear road map for the regional integration process in Africa was initially provided by the Abuja Treaty, which came into effect in 1994. In line with the Treaty, African Heads of State and Government agreed in January 2012 – by endorsing the African Union Action Plan for “Boosting Intra-African Trade and the Establishment of a Continental Free Trade Area” – to set up CFTA, with 2017 as the tentative target. Therefore, a first scenario assumes the removal of all tariff barriers on goods within the African continent to be effective by 2017.
21
An alternate reform is to consider a reduction of costs to trade across borders on top of the trade liberalization entailed by CFTA, assuming that all countries are implementing the trade facilitation part of the WTO agreement reached in December 2013, called “the Bali Package”. These trade costs are obtained by crossing information on average number of days required for the export and import processes (World Bank, 2013); and export and import weighted average time costs obtained at the GTAP level of sectors, and by exporting and importing countries and regions (Minor and Hummels, 2011). Twenty-five per cent reductions of these trade costs or “iceberg costs” were then applied – such as customs procedures, port handling and inland transport in import and export processes – which are assumed to become more efficient worldwide by 2017, as compared to that in the base year. The assumption is that reforms should lead to improved productivity (Portugal-Perez and Wilson, 2010), and particularly improve the competitiveness of manufactured industrial products. Trade facilitation can boost productivity. Karingi and Spencer (2011) confirm these results on trade facilitation policies from a sample of 18 African countries, and indicate that trade facilitation can also shape production, catalysing transition toward more sophisticated exports and greater future growth.
A second set of scenarios is based on the first one, with an additional FTA within the GAFTA framework. The implementation of the Pan-Arab FTA has already started in the majority of Arab countries. However, in many cases the product coverage is low and the lists of exclusion for sensitive products are long. In this scenario, we assume a full FTA by 2017 without any exclusion. As for the first scenario, we assess an alternative reform that includes a 25 per cent reduction of costs to trade across borders by 2017.
A third set of scenarios is based on the second one, to which we add a deep FTA between North African countries and European Union countries. The scenario is an enlargement of the current bilateral Euromed agreement, which focuses on manufactured products, to all sectors by 2017, without any exclusion. As for the previous set of scenarios, an additional reform, including a 25 per cent reduction of costs to trade across borders by 2017, is envisaged.
22
Annex2:Geographicdecompositiondeterminedforthemodellingexercise# Country/ Region MainRegion1 Egypt North Africa
2 Morocco North Africa
3 Tunisia North Africa
4 Rest of North Africa (i.e. Algeria & Libya) North Africa
5 Central Africa Rest of Africa
6 West Africa Rest of Africa
7 East Africa Rest of Africa
8 Southern Africa Rest of Africa
9 Rest of Arab League Rest of Arab League
10 European Union European Union (28 members)
11 United States United States
12 China China
13 Emerging industrialized Emerging industrialized economies
14 Rest of the World Rest of the World
23
Annex3:Sectoraldecompositiondeterminedforthemodellingexercise# Sector MainSector1 Agriculture Agriculture
2 Dairy products Processed food
3 Meat products Processed food
4 Vegetable oils and fats Processed food
5 Processed rice Processed food
6 Sugar Processed food
7 Other food products Processed food
8 Beverages and tobacco Processed food
9 Other energy Industry
10 Crude and refined oil Industry
11 Mining Industry
12 Fishing Industry
13 Forestry Industry
14 Textiles Industry
15 Wearing apparel Industry
16 Leather products Industry
17 Wood products Industry
18 Paper products Industry
19 Chemicals, rubber and plastic products Industry
20 Mineral products Industry
21 Iron and steel Industry
22 Other metal products Industry
23 Motor vehicles and parts Industry
24 Transport equipment Industry
25 Electrical equipment Industry
26 Machinery equipment Industry
27 Other manufacturer Industry
28 Other services services
29 Transport service services
Main Sector
Agriculture
Processed food
Processed food
Processed foodProcessed food IndustryIndustryIndustryIndustryIndustryIndustryIndustryIndustryIndustryIndustryIndustryIndustryIndustryIndustryIndustryIndustry
24
Annex4:Changesinbilateraltrade,followingtheCFTAreforms(withouttradefacilitationmeasures),percent,2020
Importer
China
Euro
pean
Uni
on
Uni
ted
Stat
es
NorthAfrica
RestofArabLeague
RestofAfrica
EIE
RestoftheWorld
China 0.1 0.1 -0.7 0.1 -8.2 0.1 0.1
European Union -0.1 0.0 -0.9 0.0 -3.5 0.0 0.0
United States -0.1 0.0 0.4 0.0 -1.7 0.0 0.0
North Africa -1.5 -1.6 -0.7 73.1 -2.6 126.1 -1.3 -2.2
Algeria & Libya -0.1 0.0 0.1 33.6 2.6 146.4 0.1 0.1
Egypt -1.9 -2.7 -2.3 88.2 -2.8 77.2 -3.1 -2.2
Morocco -3.5 -2.7 -2.5 26.1 -5.2 240.8 -2.4 -2.7
Tunisia -6.8 -6.2 -6.4 116.1 -6.3 127.4 -5.9 -6.2
Rest of Arab League 0.0 0.0 0.2 -0.5 0.1 -4.4 0.1 0.0
Rest of Africa -1.2 -3.6 -2.8 114.3 -2.3 72.7 -4.0 -3.9
Central Africa 0.5 1.7 0.6 165.9 1.6 62.8 0.9 1.0
Western Africa -3.7 -3.2 -3.2 59.1 -3.6 126.3 -3.4 -3.3
Eastern Africa 1.0 2.4 1.1 38.8 3.5 39.6 1.9 2.2
Southern Africa -6.1 -8.6 -9.5 284.6 -9.5 58.1 -10.3 -9.0
EIE 0.0 0.1 0.1 -1.5 0.0 -6.6 0.1 0.1
Rest of the World -0.1 0.0 0.0 -0.6 0.0 -1.3 0.0 0.0
Source: authors’ calculations based on the MIRAGE model.
Expo
rter
25
ReferencesBigsten, A. and Söderbom M. (2011), Industrial Strategies for Economic Recovery and Long-term Growth in Africa, African Development Review 23:2, pp. 161-171.
Boumellassa, H., D. Laborde, C. Mitaritonna (2009), “A Picture of Tariff Protection Across theWorld in 2004: MAcMap-HS6, Version 2”, IFPRI Discussion Paper No. 00903.
Cohen, S. and J. Zysman (1987), Manufacturing Matters, Basic Books, Nueva York.
Decreux, Y., H. Valin (2007), “MIRAGE, Updated Version of the Model for Trade Policy Analysis:Focus on Agricultural and Dynamics”, CEPII, Working paper No. 2007-15.
Economic Report on Africa (2014) ‘Dynamic Industrial Policy in Africa: Innovative Institutions, Effective Processes and Flexible Mechanisms’, ECA, Addis Ababa.
Johnson, C. (ed.), (1984), The Industrial Policy Debate, San Francisco Institute for Contemporary Studies.
Lall, S. (2005) “Is African industry competing?”, Working Paper Number 121, Queen Elizabeth House, University of Oxford.
Mevel S., ‘Ofa S.V. and Karingi S. (2014) “Quantifying Illicit Financial Flows from Africa through Trade Mis-Pricing and Assessing their Incidence on African Economies”. In Regional Integration and Policy Challenges in Africa, ed. A. Elhiraika, A. Mukungu, and W. Nyoike, 220-232. London, UK: Palgrave McMillan.
Milner, C., Morrissey, O. and Zgovu, E. (2008) “Trade Facilitation in Developing Countries” CREDIT research Paper 08/05.
Minor, Peter and David Hummels (2011) “Time as a Barrier to Trade: A GTAP Database of ad valorem Trade Time Costs”, Latest version of the Research Report submitted to GTAP 11th Annual Conference, Helsinki, Finland.
Moll De Alba, J. (2014) “Industrial development in North African countries –A statistical profile”, UNIDO Working Paper03/2014, Vienna.
Narayanan, G., Badri, A. Aguiar and R. McDougall, Eds. 2012. Global Trade, Assistance, and Production: The GTAP 8 Data Base, Center for Global Trade Analysis, Purdue University.
Norton, R. (1986), “Industrial policy and American Renewal”, Journal of Economic Literature, vol. 24-1.
Portugal-Perez, A. and J.S. Wilson (2010) “Export performance and trade facilitation reform: hard and soft infrastructure” Policy Research Working Paper Series 5261, The World Bank.
Szirmai, A. (2012) “Industrialisation as an engine of growth in developing countries, 1950–2005”, Structural Change and Economic Dynamics, 3 (4), 406-420.
Thompson, G. (ed.), (1989), Industrial Policy: USA and UK debates, Routledge, London.
UNIDO (2010), Breaking in and Moving up: New Industrial Challenges for the Bottom Billion and the Middle-income Countries, Industrial Development Report 2009, Vienna, Austria.
UNIDO (2013a), The Industrial Competitiveness of Nations, Looking back, forging ahead, Competitive Industrial Performance Report 2012/2013, Vienna, Austria.
UNIDO (2013b), Sustaining Employment Growth: The Role of Manufacturing and Structural Change, Industrial Development Report 2013, Vienna, Austria.
UNIDO (2014), Industrial development in North African countries: A statistical profile, Working paper No. 03/14, Vienna, Austria.
World Bank (2013) “Doing Business: Trading Across Borders”, 2013 Report.
Printed in Addis Ababa by the ECA Printing and Publishing Unit. ISO 14001:2004 certified. Printed on CF (Chlorine Free Paper).
Although North Africa can claim the continent’s highest level of industrial production, such a level represents merely one tenth of its annual production. Time has not played in favour of North African countries; they experienced deindustrialization as the industrial sector grew at a slower pace than the overall economy. North Africa failed to stimulate its industrial sector enough for it to become a driving force of change and structural transformation.
Trade policy can make significant contributions, particularly to increase processing to lead to higher value added. Regional trade agreements may constitute a key instrument to raise the participation of North African countries in global trade. The positive growth prospects of the African continent, related to the rapid urbanization and growth of the middle class, may convert the Continental Free Trade Agreement (CFTA) into a serious opportunity for North African economies to expand their manufactured exports. Given their traditional trade relations with Europe and to a lesser extent with the rest of the Arab countries, this assumption has been assessed also within the context of the Greater Arab Free Trade Area (GAFTA) with the countries of the League of Arab States, and the Euro-Mediterranean partnership (Euromed) process with the European Union.
The present publication provides a prospective analysis of the expected benefits of CFTA for North African countries, and identifies the tools and channels available to the subregion to make CFTA a stepping stone toward industrial development and the structural transformation of North African economies. In addition to this analysis, other regional integration projects are also examined, such as GAFTA and the Euromed project.