Overlapping Free Trade Agreements and International Trade ...
37
Overlapping Free Trade Agreements and International Trade: A network Approach Silvia Sopranzetti 1 1 University of Rome Tor Vergata Abstract In our work we analyze the effect on trade of the hub and spoke nature of FTAS. Differently from previous analysis we consider also what is the effect of the country position in the FTAs network on the bilateral trade of the country. We analyze in depth the global network of FTAs, focusing in particular in the evolution of it in the last fifteen years. We then use a panel dataset covering 1960-2010 to investigate the effects of the position of a country in the FTAs network on bilateral trade. Our results show that hubs export more than the other countries involved in a FTA, how not all the spokes are the same. An increase in the number of spokes which are not linked between them has, on average, a negative effect on trade of the hub, meaning that to sign FTAs with every country it is not the optimal strategy to increase trade. However, if we consider how new FTAs change the relative position of a country, we can observe that, if new 1
Transcript of Overlapping Free Trade Agreements and International Trade ...
Overlapping Free Trade Agreements and
International Trade: A network Approach
Silvia Sopranzetti1
1University of Rome Tor Vergata
Abstract
In our work we analyze the effect on trade of the hub and spoke
nature of FTAS. Differently from previous analysis we consider also
what is the effect of the country position in the FTAs network on
the bilateral trade of the country. We analyze in depth the global
network of FTAs, focusing in particular in the evolution of it in the
last fifteen years. We then use a panel dataset covering 1960-2010
to investigate the effects of the position of a country in the FTAs
network on bilateral trade. Our results show that hubs export more
than the other countries involved in a FTA, how not all the spokes are
the same. An increase in the number of spokes which are not linked
between them has, on average, a negative effect on trade of the hub,
meaning that to sign FTAs with every country it is not the optimal
strategy to increase trade. However, if we consider how new FTAs
change the relative position of a country, we can observe that, if new
1
FTAs bring the country to become more central or more free in the
network, this new agreements have a strong positive and significant
effect on trade.
1 Introduction
The last twenty years have witnessed the proliferation of the number of trade
agreements all over the world. According to the World Trade Organization
(WTO) there are 275 trade agreements now in force of which almost 70%
are free trade agreements (FTAs), (WTO 2015). Only in the last five years
53 new trade agreements have been signed. Only few countries are not part
of any preferential agreement; counties as Mexico and Singapore have more
than duplicate their number of FTAs in ten years. According to the WTO
more than half of the global commerce is conducted under the rule of some
preferential agreement; the rest is mainly trade between EU, US, Japan and
China which, until now, do not have any preferential trade agreement.
This surge in the numbers of “crisscrossing” trade agreements has cre-
ated what Bhagwati (2002) and Baldwin (2006) has called the spaghetti
bowl which define a very complex interaction between different and often
overlapping free trade agreements. This complex framework may turn some
countries into hubs and some others into spokes according to the number of
FTAs every country has. As an example, Israel has a FTA with the European
Union and the US but, until now, EU and US has no FTA between them.
In our example Israel is the hub while EU and US are the spokes. In this
2
specific case EU is a spoke but if we considered EU, Israel and Morocco, the
European Union has a FTA with both countries, while Israel and Morocco
do not have one between them. Hence, in this case, EU is the hub while
Israel and Morocco are the spokes.
In the near future it is likely that the picture will become even more
complex. The possible entry into force of the Trans-Pacific Partnership
(TPP)between Us-Japan, of the Transatlantic Trade and Investment Part-
nership (TTIP) the US-EU agreement and of the Regional Comprehensive
Economic Partnership (RCEP) the ASEAN plus 3 with India Australia and
New Zealand agreement is going to deeply change the general structure of
the FTA network creating big mega regions.
The concept of hub and spokes was developed first in transport literature
and introduced in international trade by Wonnacott (1975) as a “two-sided
triangle” in which the hub and the spokes are the nodes. In his work Won-
nacott considered a hub as arising from the decision of an outside country
to form a bilateral agreement with only one member of a multimember pre-
existing RTA. The country which is inside this imaginary triangle is called
the hub. This definition of “hub” is too narrow. We observe several different
situation in which a hub and spokes system may arise and, in some case not
only the countries search a strategic hub position but also group of countries,
already part of the same FTA, jointly negotiate free trade agreement with
third countries in search of better hub position.
3
Several reasons have been put forward to explain this phenomenon. The
first is the problem connected to the negotiation of multilateral liberalization
in the WTO framework with a large number of diverse members respect to a
regional or even bilateral agreement. Moreover since trade agreements have
in general deepened including service, investment and standards, the cost
of negotiation have increased. The second is connected with the so called
“Domino effect” Baldwin (1993). If the number of countries which are part
of an agreements increases, the countries outside this agreement will face
an increasing discrimination, which in principle will push them to sign new
agreements: the “fear” of exclusion can force reluctant countries to engage in
a FTA even if this wouldn’t be their first decision.
Given this complex picture our aim is to study the effects of overlapping
free trade agreements on bilateral trade. The effects of being a hub on bilat-
eral trade is not clear. On one hand, an hub country, respect to a non-hub
one, will gain preferential access to more markets facing an improvement in
its export competitiveness. If this improved competitiveness translates into
more export, the hub country will face an increase in its bilateral export. On
the other hand, following Lloyd and MacLaren (2004) in a hub and spoke
system both importer and exporter deal with a complex sets of rules of ori-
gin that can increase costs connected with the verification of this rules. If
this costs are high enough, trade creation can be restrained and being a hub
cannot have a positive effect on the bilateral export of the hub country.
The effects of being an hub for a country has been deeply analyzed in
4
the trade literature, with mixed evidence. We confine to contributions which
consider the effect on trade volume. As for the theoretical literature, the
first work are the one of Wonnacott (1982, 1996) and Kowalsky and Won-
nocott (1992), where they analyze the trade effect of the NAFTA agreement
on Canada. Daltas et al. (2006) developing a simple model of comparative
advantage conclude that, due to the decrease in trade among the two spokes,
the hub will increase trade with both the spokes. For what concern the em-
pirical studies, the main contributions are De Benedictis et alii (2005), who
analyze the effects of the east enlargement of the European union in a gravity
model, Deltas et alli (2012) on the hub and spokes system formed by Israel,
USA and Europe, Lee et al alii (2008) and Alba et alii (2010), who use a
panel of bilateral trade from 1960 to 1999 to investigate the average effects
of being an hub on the bilateral trade of the countries. The results show a
mixed evidence depending on the data considered.
Respect to this works, in our analysis, we try to investigate not only the
effect of being an hub on bilateral trade, but also what is the effect of the
country position in the global FTAs network. So far the importance of the
hub’s position in the overall system of free trade agreement has not be in-
vestigated and, to our knowledge, our paper is one of the first to empirically
explore the FTAs network effect on trade.
Using network is a natural way to visualize this complex system of over-
lapping agreement. The power of the country in the network derives from
its ties, countries with more and better connections may enjoy significant
5
increase in bilateral trade. We suppose that the trade volume between two
countries does not depend only on the possible agreement between the two
but also on the larger network of FTAs each one of them is connected to.
In our work, first of all, we analyze in depth the global network of FTAs,
focusing in particular in the evolution of it in the last fifteen years. Then
in the second part we consider the effects of the FTAs network on bilat-
eral trade. We developed a gravity model analysis in which we account for
multilateral resistance whit country and time fixed effects. We follow the
Baier and Bergstrand (2007) econometric approach who extend the Ander-
son and van Wincoop (2003) model to panel data to consider unobservable
time- varying resistance terms. We add to this framework four variables:
an FTA-hub variable, betweenness centralities, aggregate constrain and the
number of a country’s neighbor in the FTA network which are not connected
to the other country involved in the bilateral trade. This variables jointly
try to assess not only if a country is a hub but his position in the general
network of FTAs. We run pooled OLS and we show that the error terms are
serially correlated and the violation of the assumption of strict exogeneity.
We then handle the likely presence of endogeneity between FTA variable and
time-invariant variables using panel data model with fixed effect.
The rest of the paper is organized as follows. Section 2 defines and dis-
cusses the features of a hub and spoke system in a framework of overlapping
FTAs. Section 3 describes the characteristic of the FTAs Network and com-
pared the network in 2000 and in 2015. Section 4 shows the data and the
6
methodology used in the empirical analysis. Section 5 presents the main
results and, finally section 6 concludes our work
2 A Hub and Spoke System
Following Alba et alii (2010)1: “Suppose that country i has bilateral FTAs
with m countries with m strictly greater than one and country j is one of
the m countries. Country j is defined as a spoke country if it has bilateral
FTAs with m−2 or less countries among the m countries that have bilateral
FTAs with country i. Country i is defined as a hub country if it has at least
two spokes.”
A hub can arise in several different ways. As Wonnacott (1996) pointed
out, it can be formed when a country which is a member of a FTA forms
a new bilateral FTA with a country which is not part of the original one.
It can be formed when a country, simultaneously, negotiates bilateral agree-
ments with a number of countries, for example Singapore, or when it entered
as a member in two different multimember FTAs, as Mexico. Moreover,
we can have a structure of plurilateral hubs and plurilateral spokes when
we have multimember FTA. As an example of multiple spokes, we can con-
sider the US, which are member of NAFTA and have signed a multimember
spokes agreement with the CACM, the Central America Common Market.
This “multi-spoke” strategy in the last years has been followed by individual1Alba, Joseph D., Hur, Jung,and Donghyun Park. “Effects of Hub-and-Spoke Free
Trade Agreements on Trade: A Panel Data Analysis.” World Development 38, no. 8
(2010) pag.9
7
states as Mexico, Chile and Singapore and also by multilateral FTA as the
EFTA and the MERCOSUR which are used to negotiate as a party with
other countries or FTA.
Against this background, we are interested in asking if being a hub, rather
than being a spoke, can increase or decrease the trade of the country and its
welfare. The answer to this question is not as simple as one might expect.
There is little clear empirical support to an unambiguous answer since there
are forces that push to an increase of the bilateral trade of a hub while, there
are others which push to the opposite direction.
Spokes have less market access than hubs since a hub has preferential
agreements with all the spokes, while the spokes have a preferential agree-
ment only with the hub. If a hub adds new spokes, the preferential conditions
previously enjoyed by the old spokes may diminish because of the increas-
ing competition between the spokes or because the new ones can negotiate
better conditions then the previous one. For a spoke, an intersecting hub
and spokes system is the same that in a non-intersecting FTA except for
the increasing competition. For what concern the hub, its bilateral trade
can increase since a hub has preferential access to more markets so it can
improve his competitiveness. On the other hand, in a multi-spokes system
the tariff administration of the hub is more complicated since there are three
or more columns in the tariff structure and every hub has to face multiple
and usually complex sets of rules of origin and a higher level of rent-seeking
waste. There will be a waste of time and effort which can increase the trade
8
costs and potentially decrease trade.
To better analyze the final effects of an hub and spokes system we can
consider what is the overall effect of adding a new spoke on the bilateral
export between the hub and two spokes.
Let us consider three countries A, B and C which trade with one other.
If A and B sign a free trade agreement, we expect that trade between the
two countries will increase due to the preferential tariff treatment. Suppose
now that A chooses to sign a new trade agreement with C, becoming a hub
while B and C turn to become spokes. First of all we will expect that, due to
the preferential tariff treatment trade between A and C will increase. How
does the new agreement between A and C affect trade between A and B?
There may be two simultaneous opposite effects. A’s export to B can de-
crease because of the trade diversion of A’s export to C caused by the new
preferential tariff treatment between A and C. But trade between A and B
can also increase, if the FTA between A and C would divert C’s export from
country B to A, letting room to increase trade between the hub and the old
spoke. So, in this case, the hub country A would increase the volume of its
trade with country B.
To clarify this statement we can consider the previous case of the hub
and spoke system between Israel, USA and the European Union. When in
2000 the EU-Israel Association agreement entered into force Israel already
have signed a free trade agreement with the US. Since the EU and the US
9
do not have an agreement, Israel is the hub and EU and US are the spokes.
After the new EU-Israel agreement, the export of Israel to EU has increased
since Israel would enjoy a price advantage respect to US. Israel will face lower
tariffs and non-tariff barrier which reduce the relative price of Israeli goods
relative to Americans one. For what concern the Israel-US trade, there are
two opposite effects. Israel can decrease its export to US if the new FTA will
divert its export from the American market to the European one or it can
increase its export to US if the European export will be diverted from the
American market to the Israeli one due to the lower tariffs.
In our example, while it is clear that the trade between the hub and the
new spoke will increase, we have no a priori answer about what could happen
to the export from the hub to the old spoke. For this reason the average
export of a hub in a FTA could rise or fall depending of the strength of the
two forces. If two or more hub and spoke system intersect this discrimination
is multilayered and the interaction between this pro-trade and anti-trade
effects becomes even more complicated.
3 Network Analysis
The Network analysis is concerned with the investigation of the structure of
relations between actors. In our contest the presence of a link gij represent
the existence of a FTA agreement between country i and country j. Given
this basic framework we have an unweighted network since the relation is
dichotomous.
10
To develop our network analysis we will use the WTO database on RTAs
and the Baier and Bergstrand database 2013. From the list we eliminate
the EU enlargement treaties, the Global System of Trade Preferences among
Developing Countries (1988) and the Protocol on Trade Negotiations (1971)
because they are very different from the others treaties considered and cannot
be easily compared to others FTAs. We disaggregate the agreements accord-
ing to the bilateral ties or dyads, for example the NAFTA agreement will
be represented as three bilateral links connecting USA, Canada and Mexico
between them. In our final dataset we consider 154 countries. For the sake
of tractability in this part of our analysis we consider the EU as a single
actor. It is not incorrect to do so because since 1958, the Commission of the
European Communities has negotiated all trade agreements on behalf of the
member states. Moreover, the EU is itself a member of the WTO, the only
supranational association to hold this status. So every free trade agreement
signed by EU is binding for all the states which are part of it. Since we are
interested in the impressive surge of FTAs in the recent years we compared
the FTAs network in 2000 and the FTAs network in 2015. In both networks,
to improve the clarity of graphs, we choose not to represent graphically the
links which symbolize the agreement between EU and the Overseas Countries
and Territories. .We consider this agreements in the numerical analysis of
the network.
If we consider the number of agreements we can see that the most involved
actor in our network in 2000 is the EU, followed by the EFTAs country (Is-
11
land, Norway, Liechtenstein and Switzerland) as well as Morocco, Tunisia
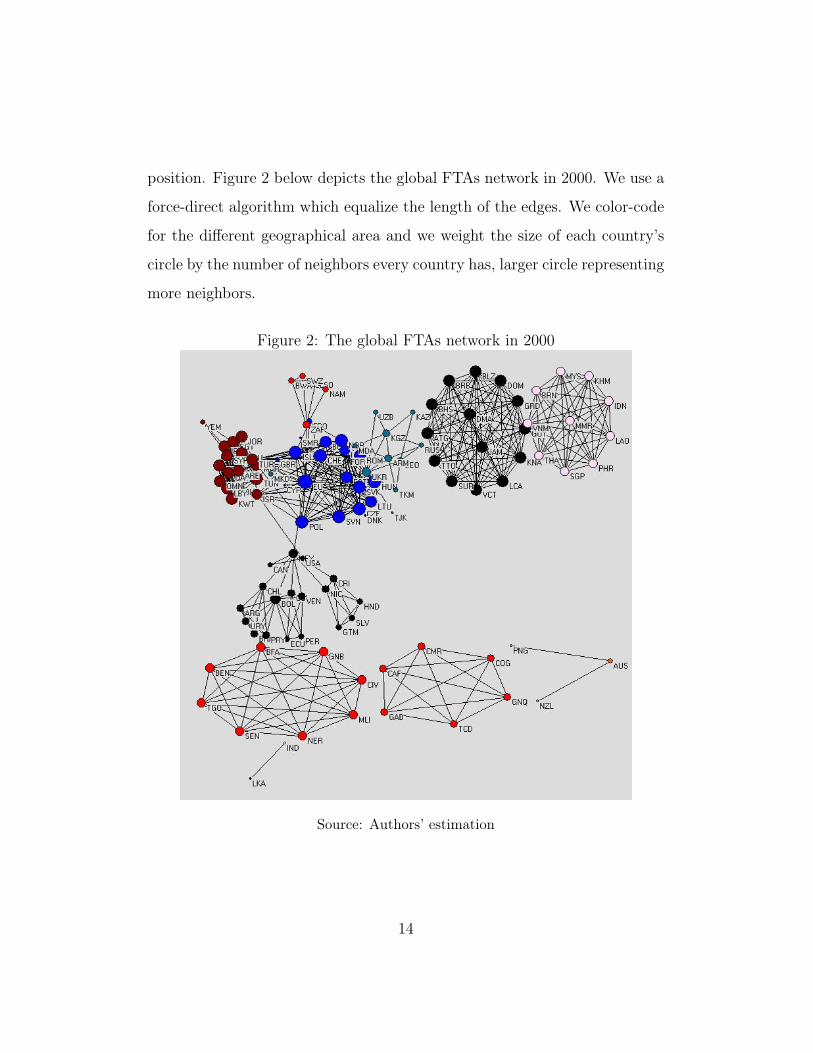
and the Czech Republic. In 2015 the first position remain stable with EU
and the EFTA countries, while we observe in the last position Chile, Turkey
and Singapore. United States only rank twelfth.
To check how tight are two networks connected we consider the network
density, i.e. what percentage of possible links is actually covered by a tie.
Out of maximum number of 11,858 possible bilateral relations covered by a
FTAs only 4.6% are covered in 2000. However 15 years later the network
density surge to 9.2% confirming the magnitude of the observed increase in
FTAs.
12
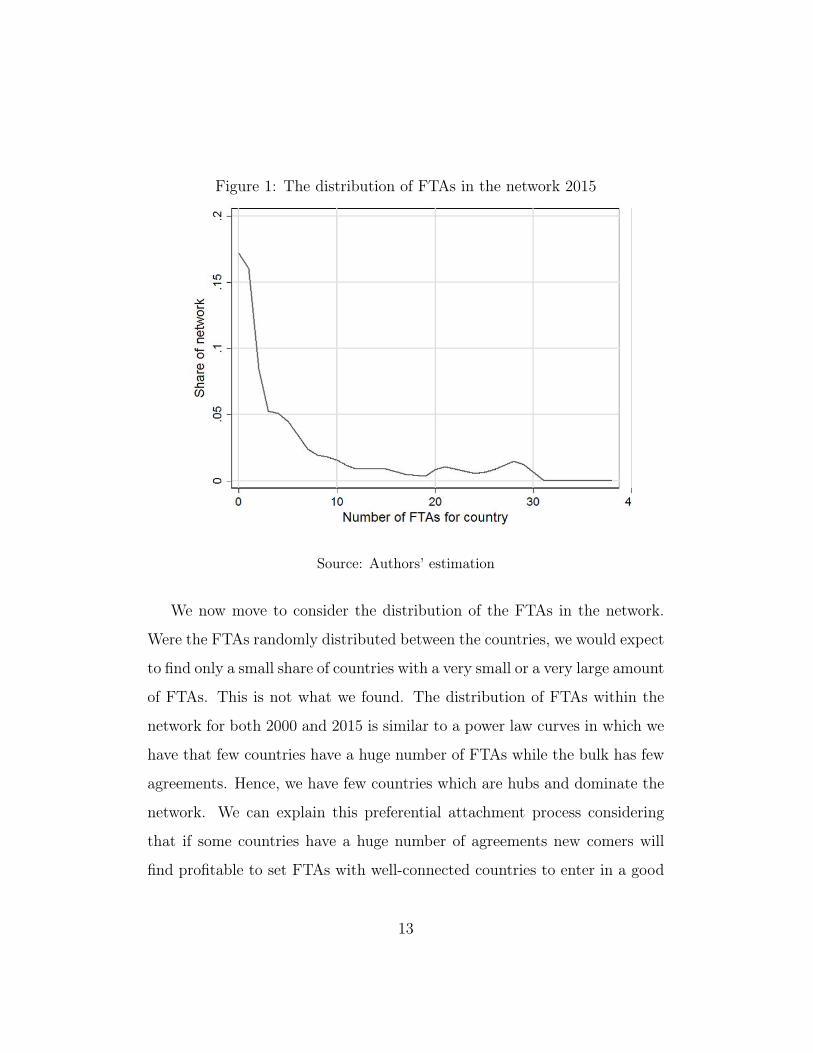
Figure 1: The distribution of FTAs in the network 2015
Source: Authors’ estimation
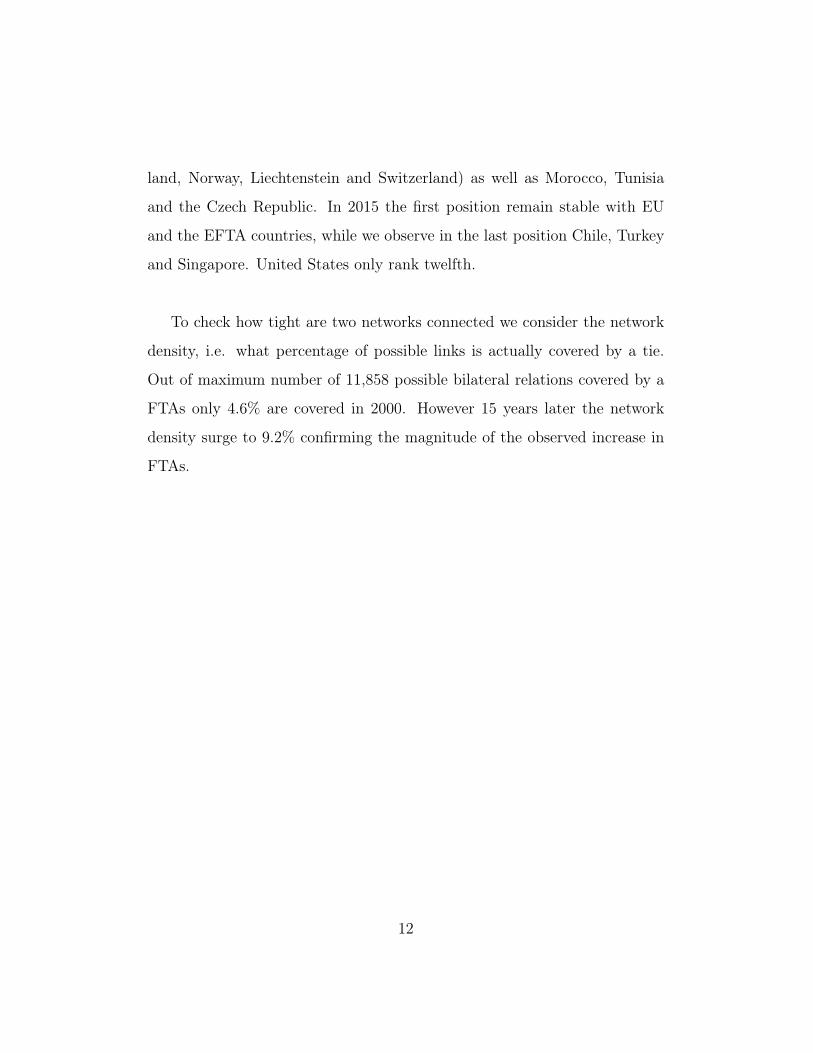
We now move to consider the distribution of the FTAs in the network.
Were the FTAs randomly distributed between the countries, we would expect
to find only a small share of countries with a very small or a very large amount
of FTAs. This is not what we found. The distribution of FTAs within the
network for both 2000 and 2015 is similar to a power law curves in which we
have that few countries have a huge number of FTAs while the bulk has few
agreements. Hence, we have few countries which are hubs and dominate the
network. We can explain this preferential attachment process considering
that if some countries have a huge number of agreements new comers will
find profitable to set FTAs with well-connected countries to enter in a good
13
position. Figure 2 below depicts the global FTAs network in 2000. We use a
force-direct algorithm which equalize the length of the edges. We color-code
for the different geographical area and we weight the size of each country’s
circle by the number of neighbors every country has, larger circle representing
more neighbors.
Figure 2: The global FTAs network in 2000
Source: Authors’ estimation
14
Figure 3: The global FTAs network in 2015
Source: Authors’ estimation
Figure 3 shows the network in 2015. As we can see comparing the two
figures, from 2000 to 2015 the FTAs network changes substantially. While in
2000 the graph is organized in separate components except for Europe and
North Africa and Middle East, suggesting that the global system of FTAs
is organized mainly around multilateral regional agreements, in 2015 all the
countries are directly or indirectly mutually connected.
15
In 2015 the FTAs network is still organized in regional cluster with the
European Union, which is the one with the highest number of neighbors, in
the middle as pivoting point. As we can see from the graph, most of the clus-
ters correspond to specific regions which are linked by few countries which
act as a bridge, connecting different multilateral regional agreements. We
can see a notable exception to this statement for the countries of East Asia
and America which are forming a larger cluster and are moving to create a
mega-regional FTAs.
We now move to consider centrality measures in a network. There are
a huge number of different measures for centrality, each considering differ-
ent nodes’ characteristic to assess what is the meaning of importance in a
network. In our work, we consider degree, betweenness and eigenvector cen-
trality. The degree centrality is simply the number of neighbors that a node
has in the network. Betweenness centrality is the ratio between the number
of shortest path which flows through the given node, divided by the total
number of path which flows through that node and it measures how much
a node links otherwise unconnected parts of the network. Eigenvector cen-
trality is a measure of the influence of a node in the network and is a core
proportional to the sum of the scores of his neighbors. It accounts not only
for the number of path a node has, but also for the importance of the nodes
it is connected with.
As we can see from the table, we confirm the importance of the EU in the
global FTAs network. However, we can notice that the comparatively low
16
Table 1: Centrality in the network
Degree centrality Betweenness centrality Eigenvector centrality
EU 80 EU 0.4601 Swaziland 0.2388
Egypt 39 India 0.0894 Egypt 0.2377
Chile 34 Ivory Coast 0.0878 Mauritius 0.2269
Sudan 34 Singapore 0.0783 Zimbabwe 0.2267
Libya 33 Korea 0.0777 EU 0.2254
Switzerland 32 Egypt 0.0603 Zambia 0.216
Island 31Papua New
Guinea0.0594 Sudan 0.2033
Norway 31 Island 0.0588 Burundi 0.1785
Liechtenstein 30 Mexico 0.0555 Kenya 0.1785
Swaziland 30 Congo 0.0512 Libya 0.1657
Turkey 30 Norway 0.0497 Djibouti 0.1548Source: Authors’ calculation
eigenvector rank for the EU (only 5) underlines that many of the EU’s agree-
ments have been concluded with minor trading partners. Other somewhat
counter-intuitive results, like the high ranking of North African countries such
as Egypt, Libya2 and Sudan, can be explained by the fact that these coun-
tries are members of several multi-party (in contrast to bilateral) FTAs which
place them centrally in certain regions without, however, reaching global rele-
vance. We can see also from the eigen-vector centrality that, except Europe,
countries with high values are newcomers. Since they entered later, they
probably preferred to sign agreement with countries already highly involved2We consider Lybia before the militar cup in 2014
17
in the FTAs network, confirming the presence of a preferential attachment
process
4 Data and Econometric
In this section we describe briefly the data we are going to use for the gravity
equation. Following Baier and Bergstrand (2007), we consider 96 potential
trading partners over 5-year intervals beginning in 1960 and ending in 2010.
Differently from their work, we choose to add the post-2000 period because
we would like to analyze also the increasing surge of new FTAs in this period.
The nominal bilateral flows are from the IMF’s Direction of Trade Statis-
tics, we scaled these data by the exporter GDP deflators to create real trade
flows. The exporter and the importer GDPs are from the World Bank’s
World Development Indicators and they are scaled by the GDP deflators
to generated real GDPs. Bilateral distance, adjacency and common lan-
guage dummies are obtained by the CEPII gravity dataset by Head and
Mayer(2010). The data for the dummies FTA and HUB are from the Baier
and Bergstrand database and the WTO database on RTAs, we use those
data also to calculate the network variables. For our analysis we construct
our key variables using the open source network analysis program Pajek:
betweenness centralities, aggregate constrain and the number of a country’s
neighbors in the FTA network which are not connected to the other country
involved in the bilateral trade, jointly this three variables try to assess not
18
only if a country is a hub but its position in the general network of FTAs.
Betweenness centrality is an indicator which measures the connectivity of a
node’s neighbors. It is equal to the number of shortest path from all vertices
to all the other links that pass through that node. Betweenness centrality
of node v is equal to g(υ) =∑s 6=υ 6=t
σst(υ)σst
with σst equal to the total number
of shortest path from node s to node t and σst(υ) equal to the total number
of shortest path from node s to node t which pass through v. In our setting
betweenness centrality measures the number of countries that a country con-
nects indirectly through their direct FTAs links.
We add betweenness centrality to our estimate to control if a country
position in the FTA’s network can offer advantages for local bridge countries
with respect to the others. We suppose that gatekeepers countries can in-
crease their trade connecting otherwise unconnected countries.
We also suppose that to consider the network effects of FTA’s on trade, it
is important not only to account for the characteristics of the links a country
has but also for the characteristics of the links of its neighbors. If a country
is connected via free trade agreement with countries which are already highly
connected between them, it will lose some of its brokerage opportunity. To
check this specific effects we include an aggregate constrain measure. Ag-
gregate constrain is a summary measure which indicates the extent to which
a country, in the FTAs network, is connected with others country which
are already well connected between them. It gives an idea about how much
freedom you have in your relation within the network, since it measures how
19
many potential alternatives a country has, given the structure of the network.
Network constrain vary according to three different dimension: size, density
and hierarchy. The constrain is high if a country has a FTAs with few other
countries or if the countries it is connected with are strongly connected to
one other, either directly or through a central hub country.
In line with Baier and Bergstrand (2007), we add two lags for the FTAs
variable, this because generally FTAs are phased in over 5 to 10 years and so
they will not become fully effective before this time period. We also try to
add up to five lags in the equation but after fifteen years the specific effects of
a FTA tend to become insignificant. We account for the omitted variable bias
introduced by ignoring the relative prices in the gravity equation Anderson
and van Wincoop (2003) including country-and-time dummy variables to
value the multilateral price term.
The specification of our log-linearized gravity model is:
lnT ijt = α0+βXijt +µ0FTA
ijt +µ1HUB
ijt +µ2V NV
ijt +µ3BC
it+µ4AG
it+D
it+Dum
itξijt
(1)
Where T ijt is the non-zero exports of country i to country j at time t
scaled by country i’s GDP deflator. The vector X ijt includes the log of real
GDP of the exporter and the importer country, the log of the distance be-
tween the two countries and the dummy variables for common language and
adjacency. V NV ijt represents the neighbor of i in the network of FTAs which
are not neighbor of j in time t, BCit is the betweenness centrality of i in time
t and AGit is the aggregate constrain of country i in time t. We also include
20
up to three lags of FTAijt in the estimation and the dummy variables Dumit
and Dumjt to assess the multilateral price terms.
At first, we estimate our gravity equation adjusting for serial correlation.
Even if we adjust for serial correlation, however, our OLS adjusted estimation
violates the assumption of strict exogeneity resulting in a biased estimation
of the coefficients.
The presence of potential endogeneity, which can seriously bias the fi-
nal results, is a standard problem of the gravity model. The error term εij
may include unobservable policy related barriers which tend to reduce trade
between the countries, that are not included in the gravity specification.
Moreover, countries which are part of a FTA, tend to have similar economic
characteristic that will further increase the effects of the FTA related vari-
ables. To treat this endogeneity problem, in line with Wooldridge (2000) we
will use panel data analysis with bilateral fixed effects which allows us to
consider the unobserved heterogeneity of our data.
We run use fixed effects rather than random effects estimation for two
reason. First, as already pointed out in the literature (cf. Egger, 2000), the
evaluation of the Hausman test for gravity model with country fixed effect
shows a clear evidence for the rejection of the random effects and, second, we
believe that it is more plausible to assume an arbitrary correlation between
the unobserved time invariant bilateral variables wij and FTAijt , as fixed
effects do, than zero correlation between wij and FTAijt as random effects.
21
This gives an unbiased estimation of µ.
As Wooldridge (2000) underlines, to deal with endogeneity bias using
panel data we must focus on the choice between estimation with fixed ef-
fects or with first differencing (depending on the nature of the series). If the
numbers of periods is equal to 2, the two techniques give the same results
but, when the numbers of periods is higher, the two techniques differ in the
relative efficiency of the estimators: fixed effect estimators are more efficient,
if we assume that the error terms are serially uncorrelated while, first differ-
encing is more efficient when the error term is correlated, for example if it
follows a random walk. Since we cannot easily compare the efficiency of the
fixed effects and the first differencing we use fixed effect as a benchmark and
we will check the robustness of our results using differenced data.
The form of our first differencing equation will be:
dlnT ijt−(t−1) = βdX ijt−(t−1) + µ0dFTA
ijt−(t−1) + µ1dHUB
ijt−(t−1) + µ2dV NV
ijt−(t−1)+
µ3dBCit−(t−1) + µ4dAG
it−(t−1) + dDumi
t−(t−1) + dDumjt−(t−1)dξ
ijt−(t−1)
(2)
We follow the Baier and Bergstrand’s procedure to estimate this equa-
tion. At first, we take the first difference of the log of real export dln
T ijt−(t−1), of the log of real GDP for country i and country j dlnGDP it−(t−1)
and dlnGDP jt−(t−1), of the FTAs variables (including the lags dFTAijt−(t−1),
dFTAij(t−1)−(t−2) and dFTAij(t−2)−(t−3), of all the network variables dHUB
ijt−(t−1),
dV NV ijt−(t−1), dBC
it−(t−1), dAG
it−(t−1). Then we regress each of the differenced
22
variables on the difference of the country-and-time dummies dDumit−(t−1),
dDumjt−(t−1) and we hold the residuals of all this estimation. Finally we
regress the residual of the dlnT ijt−(t−1) regression over the residual of all the
other variables in the gravity equation. This procedure will estimate the first
differencing equation.
To be efficient, both fixed effect and first differencing estimates need the
assumption that the errors in the regression are serially uncorrelated. In our
estimation we may expect that bilateral trade levels in one period can affect
bilateral trade levels in the next ones. To test this we use the Wooldridge
test (2002) for fist order serial correlation AR(1). This test is based on ρ
which is the coefficient obtained from regressing the residual of each of our
regression on the lagged values of them. The true value for the fixed effect
estimation is −1/(T − 1) which in or case is −0.1 while, for first differencing
the true values is −0.5.
We also test for strict exogeneity, since it can result in biased estimates.
To test for exogeneity, we apply the Wooldridge test (2002) as in Head and
Ries (2010). We try to find any possible feedback effects between potentially
endogenous and dependent variables. To do so we included in the regression
the future values of FTAs and the future values of betweenness centrality
testing if this is correlated with the present values of trade.
First of all we test for serial correlation in the pooled OLS. We find ev-
idence of serial correlation, since the coefficient is −0.302, significant at 1%
23
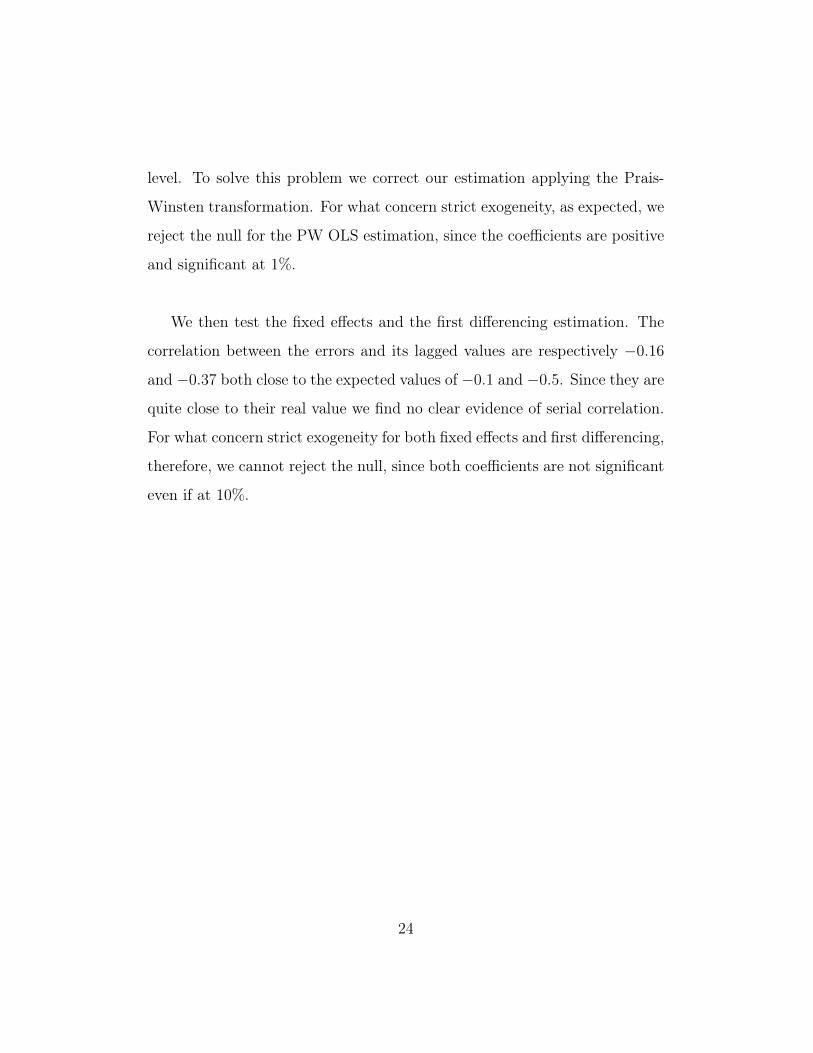
level. To solve this problem we correct our estimation applying the Prais-
Winsten transformation. For what concern strict exogeneity, as expected, we
reject the null for the PW OLS estimation, since the coefficients are positive
and significant at 1%.
We then test the fixed effects and the first differencing estimation. The
correlation between the errors and its lagged values are respectively −0.16
and −0.37 both close to the expected values of −0.1 and −0.5. Since they are
quite close to their real value we find no clear evidence of serial correlation.
For what concern strict exogeneity for both fixed effects and first differencing,
therefore, we cannot reject the null, since both coefficients are not significant
even if at 10%.
24
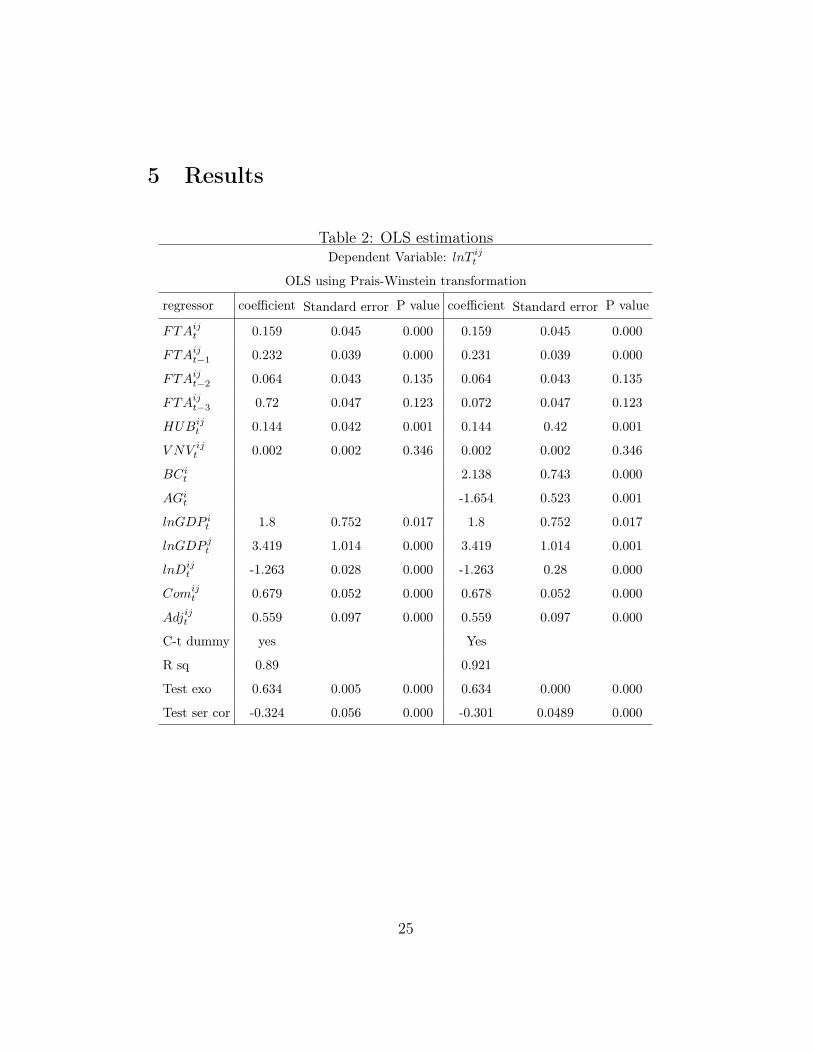
5 Results
Table 2: OLS estimationsDependent Variable: lnT ij
t
OLS using Prais-Winstein transformation
regressor coefficient Standard error P value coefficient Standard error P value
FTAijt 0.159 0.045 0.000 0.159 0.045 0.000
FTAijt−1 0.232 0.039 0.000 0.231 0.039 0.000
FTAijt−2 0.064 0.043 0.135 0.064 0.043 0.135
FTAijt−3 0.72 0.047 0.123 0.072 0.047 0.123
HUBijt 0.144 0.042 0.001 0.144 0.42 0.001
V NV ijt 0.002 0.002 0.346 0.002 0.002 0.346
BCit 2.138 0.743 0.000
AGit -1.654 0.523 0.001
lnGDP it 1.8 0.752 0.017 1.8 0.752 0.017
lnGDP jt 3.419 1.014 0.000 3.419 1.014 0.001
lnDijt -1.263 0.028 0.000 -1.263 0.28 0.000
Comijt 0.679 0.052 0.000 0.678 0.052 0.000
Adjijt 0.559 0.097 0.000 0.559 0.097 0.000
C-t dummy yes Yes
R sq 0.89 0.921
Test exo 0.634 0.005 0.000 0.634 0.000 0.000
Test ser cor -0.324 0.056 0.000 -0.301 0.0489 0.000
25
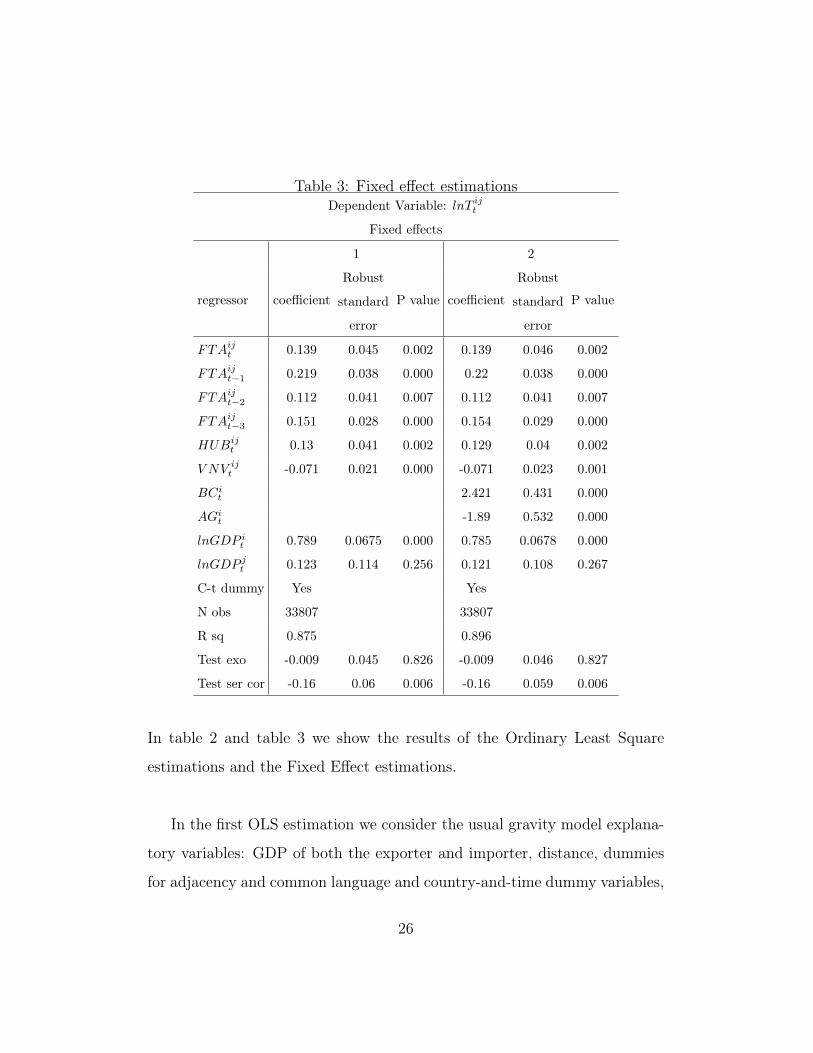
Table 3: Fixed effect estimationsDependent Variable: lnT ij
t
Fixed effects
1 2
regressor coefficient
Robust
standard
error
P value coefficient
Robust
standard
error
P value
FTAijt 0.139 0.045 0.002 0.139 0.046 0.002
FTAijt−1 0.219 0.038 0.000 0.22 0.038 0.000
FTAijt−2 0.112 0.041 0.007 0.112 0.041 0.007
FTAijt−3 0.151 0.028 0.000 0.154 0.029 0.000
HUBijt 0.13 0.041 0.002 0.129 0.04 0.002
V NV ijt -0.071 0.021 0.000 -0.071 0.023 0.001
BCit 2.421 0.431 0.000
AGit -1.89 0.532 0.000
lnGDP it 0.789 0.0675 0.000 0.785 0.0678 0.000
lnGDP jt 0.123 0.114 0.256 0.121 0.108 0.267
C-t dummy Yes Yes
N obs 33807 33807
R sq 0.875 0.896
Test exo -0.009 0.045 0.826 -0.009 0.046 0.827
Test ser cor -0.16 0.06 0.006 -0.16 0.059 0.006
In table 2 and table 3 we show the results of the Ordinary Least Square
estimations and the Fixed Effect estimations.
In the first OLS estimation we consider the usual gravity model explana-
tory variables: GDP of both the exporter and importer, distance, dummies
for adjacency and common language and country-and-time dummy variables,
26
along with our primary interest variables FTA and HUB dummies and the
number of spokes of the exporter which are not linked to the importer. In the
second one we add our two network specific variables: betweenness centrality
and aggregate constraint.
In both specifications, the variables show the correct signs and are highly
significant. The coefficient for FTAij is positive and significant for the first
year, showing the presence of a pro-trade effect of free trade agreements, and
remains positive and significant also in the next five years while, after 10
years it becomes insignificant. It may seem odd that the FTA variables show
the highest coefficient after 5 years and not in the first year in which a FTA
entered into force. A possible explanation for this is that, generally, a FTA
is a complicated agreement which takes years to become fully effective, so
that only after five years all the possible pro trade effects of the agreement
become evident.
The HUB coefficient is positive, its numerical value is 0.144 and it is sig-
nificant while the coefficient for the number of the exporter’s neighbors in
the FTA network which are not connected to the importer is positive, even
if with a very small effect 0.002, and insignificant. This results suggest that
being an hub increases on average the bilateral trade of a country and add
new spokes in general will increases bilateral trade in particular.
The numerical value of the betweenness centrality coefficient is 2.138 and
it is significant. This is a clear network effect: connect indirectly in the FTA
27
networks otherwise unconnected countries will increase the bilateral trade of
the countries which can act as a bridge increasing the competitiveness of the
exporter.
The aggregate constrain coefficient is significant and negative −1.654. It
varies from 0 to 1 and an increase means that the considered country is more
constrained by its overall relations. A higher aggregate constrain coefficient
has a negative impact on bilateral trade since, the more connected a coun-
try’s partners in the FTA network are between themselves, the less bilateral
trade the initial country has, countries that are highly constrained are less
free within their own FTA relations. As a consequence their bilateral trade
with particular trading partners is reduced.
This huge impact of the network related variables with respect to the others
surprising, since this measures are of an order of magnitude greater than the
others since a small change in a network variables implies a higher impact in
the overall relation of the country.
However we could not rely on the OLS results to support the positive
effects of the hub and spoke system on bilateral trade since, as noted earlier,
the pooled OLS estimation suffer from endogeneity and the estimates are
therefore likely to be biased.
To overcome this problem we consider the results of the fixed effect re-
gression since, as Baier and Bergstrand (2007) pointed out, they do not suffer
28
from the endogenous problem of the FTA related variables3.
For what concern our most relevant coefficients, the FTA dummies are
positive and significant up to the third lags. The average positive effect of an
FTA on the bilateral trade of two countries is 0.625 after fifteen years. The
HUB dummy is positive and significant with a coefficient of 0.129, meaning
that, the average effect of being an hub- i.e the average positive effect on
bilateral trade of being a hub ceteris paribus- is 0.754 after fifteen years.
The coefficient for number of the exporter’s neighbors in the FTA net-
work which are not connected to the importer in the fixed effect estimation
is now negative, −0.071 and significant. From this result we can conclude
that increasing the number of spokes has a negative small effect on bilateral
trade, possibly due to trade diversion. One explanation to this effect could
be the increase in costs connected to the obligation of several FTAs. If a
country has several FTAs, it has to face different sets of rules of origin and
tariff administration, and this increases in trade costs can, on average, induce
a small reduction in bilateral trade.
Betweenness centrality and aggregate constrain show almost the same co-
efficients of the OLS estimation: the first one is positive and significant and
the second negative and significant.3The first differencing estimation is presented in appendix A. When comparing the sign
of the coefficients of the regression, these remain the same of the fixed effect specifications,
however some of them show lower significance
29
The fixed effect estimation coefficients, since the residuals are serially
uncorrelated and strictly exogeneity assumption is not violated, are efficient.
The results show the presence of a strong positive effect of the hub and spoke
system in FTAs on trade. Our analysis, however, suggests that not all part-
ners are the same. Adding new spokes can have a negative effect on bilateral
trade but, if a country increases its betweenness centrality or lowers its ag-
gregate constraint acting like a bridge with not well-connected countries or
areas, the final effect on bilateral trade could be positive and significant.
6 Conclusion
We apply the well-known concept of hub and spoke in trade elements of net-
work analysis to better understand how the overall effect of being a hub is
influenced by the relative position of the country in the FTAs system.
More specifically, we analyze, using network instruments, the evolution
of the global FTAs network from 2000 to 2015. We use a panel data set
comprising 96 countries and covering 51 years (1960-2010) adding the hub
and spoke concept and network indicators to empirically asses the effects of
the position of a country in the FTAs network on bilateral trade.
Our analysis starts from the empirical observation of a massive explosion
in the number of free trade agreements among countries in the last years,
30
which resulted in multilayers hub and spoke. We assessed the effect of this
multilayers hub and spokes on bilateral trade of a hub. In this setting, a
hub, faces a competitive advantages respect to the spokes which enjoy price
advantage only in the hub market while, the hub, enjoys price advantage
in all the markets of the spokes. If this advantage faced by the hub results
in higher exports, we expect this hub and spoke feature to increase trade
more than the expected trade-liberalizing effect of FTAs. However, if the
more complexed system of rules connected with overlapping FTAs, causes
a massive increment in trade costs, ten we can observe a decrease in trade
connected with hub and spokes system.
To properly address this issue we need to analyze not only the presence
of hub and spokes but also how they are connected with the global network
of FTAs. We analyze the change from 2000 to 2015, years in which several
new (and relevant) FTAs has been signed. We can observe that while in
2000, when the global system of FTAs is organized mainly around multilat-
eral regional agreements, in 2015, all the countries are directly or indirectly
mutually connected. In 2015, most of the cluster in the graph correspond to
specific regions which are linked by countries which act as a bridge connect-
ing them. The relevant feature for our analysis is the relative importance
of the countries which are not only a hub but also centrally placed in the
network.
Our empirical analysis supports the view that the hub and spoke char-
acteristics of FTAs has a positive and significant effect on bilateral trade
31
of the members. Our results show that hubs export more than the other
countries involved in a FTA, providing an incentive to countries to become
an hub. This incentive can help to explain the proliferation of FTAs in the
last decade. However adding other variables to control for the hub and spoke
characteristic, we observe how not all the spokes are the same. An increase
in the number of spokes which are not linked between them has, on average,
a negative effect on trade of the hub, meaning that to sign FTAs with every
country it is not the optimal strategy to increase trade. However, if we con-
sider how new FTAs change the relative position of a country, we can observe
that, if new FTAs bring the country to become more central or more free
in the network, this new agreements have a strong positive and significant
effect on trade.
This phenomenon of overlapping FTAS in international trade has grown
in the last decade and is likely to continue in the e next years. However,
supporting evidence about the overall effects on trade and welfare is lacking.
In our work, we underline how this trade- creating effect of the hub and
spoke features depends on the strategic evolution of the FTAs scheme of a
country. Thus policy maker and institution must carefully consider this evo-
lutionary process and its consequences on the global trade.
32
7 Appendix
7.1 Appendix A: First differencing estimation
Dependent variable: lnT ijt
First differencing
Regressor coefficient Robust standard error P value
dFTAijt−(t−1) 0.194 0.051 0.000
dFTAijt−(t−2) 0.159 0.046 0.000
dFTAijt−(t−3) 0.049 0.051 0.342
dHUBijt−(t−1) 0.041 0.051 0.422
dV NV ijt−(t−1) -0.021 0.03 0.57
dBCit−(t−1) 0.052 0.027 0.06
dAGit−(t−1) -0.015 0.008 0.058
dlnGDP it−(t−1) 0.982 0.006 0.000
dlnGDP jt−(t−1) 0.349 0.004 0.000
C-t dummy Yes
N obs 31593
R sq 0.5323
Test exo 0.06 0.044 0.133
Test ser cor -0.45 0.005 0.000
7.2 Appendix B: List of the country
Albania; Algeria; Angola; Argentina; Australia; Austria; Bangladesh; Bel-
gium–Luxembourg; Bolivia; Brazil; Bulgaria; Burkina Faso; Cameroon; Canada;
Chile; China, People‘s Republic of; Colombia; Congo, Democratic Republic
of; Congo, Republic of; Costa Rica; Cote D‘Ivoire (Ivory Coast); Cyprus;
Denmark; Dominican Republic; Ecuador; Egypt; El Salvador; Ethiopia;
33
Finland; France; Gabon; Gambia; Germany; Ghana; Greece; Guatemala;
Guinea–Bissau; Guyana; Haiti; Honduras; Hong Kong, China; Hungary; In-
dia; Indonesia; Iran; Ireland; Israel; Italy; Jamaica; Japan; Kenya; Korea;
Madagascar; Malawi; Malaysia; Mali; Mauritania; Mauritius; Mexico; Mo-
rocco; Mozambique; Netherlands; New Zealand; Nicaragua; Niger; Nigeria;
Norway; Pakistan; Panama; Paraguay; Peru; Philippines; Poland; Portugal;
Romania; Saudi Arabia; Senegal; Sierra Leone; Singapore; Spain; Sri Lanka;
Sudan; Sweden; Switzerland; Syrian Arab Republic; Thailand; Trinidad &
Tobago; Tunisia; Turkey; Uganda; United Kingdom; United States; Uruguay;
Venezuela; Zambia; and Zimbabwe.
References
[1] Networks, crowds, and markets.
[2] Anderson, J. E. and van Wincoop, E. Gravity with gravitas: A solution
to the border puzzle. 93(1):170–192.
[3] Baier, S. L. and Bergstrand, J. H. Do free trade agreements actually
increase members’ international trade? 71(1):72–95.
[4] Baldwin, R. E. 21st century regionalism: Filling the gap between 21st
century trade and 20th century trade rules.
[5] Baldwin, R. E. Multilateralising regionalism: Spaghetti bowls as building
blocs on the path to global free trade. 29(11):1451–1518.
34
[6] Baldwin, R. E. and Gylfason, T. A domino theory of regionalism. In Ex-
panding membership of the European Union. Cambridge University Press.
[7] Bhagwati, J. N. Free Trade Today. Princeton University Press.
[8] De Benedictis, L., Santis, R. D., and Vicarelli, C. Hub-and-spoke or else?
free trade agreements in the ’enlarged’ european union. 2(2):245–260.
[9] De Benedictis, L. and Tajoli, L. The world trade network. 34(8):1417–
1454.
[10] Deguchi, T., Takahashi, K., Takayasu, H., and Takayasu, M. Hubs and
authorities in the world trade network using a weighted HITS algorithm.
9(7):e100338.
[11] Deltas, G., Desmet, K., and Facchini, G. Hub-and-spoke free trade
areas.
[12] Deltas, G., Desmet, K., and Facchini, G. Hub-and-spoke free trade
areas: theory and evidence from israel. 45(3):942–977.
[13] Egger, P. A note on the proper econometric specification of the gravity
equation. 66(1):25–31.
[14] Freund, C. L. and Ornelas, E. Regional trade agreements.
[15] Furusawa, T. and Konishi, H. FREE TRADE NETWORKS WITH
TRANSFERS*. 56(2):144–164.
[16] Hur, J., Alba, J. D., and Park, D. Effects of hub-and-spoke free trade
agreements on trade: A panel data analysis. 38(8):1105–1113.
35
[17] Kowalczyk, C. and Wonnacott, R. J. Hubs and spokes, and free trade
in the americas.
[18] Lee, J.-W., Park, I., and Shin, K. Proliferating regional trade arrange-
ments: Why and whither? 31(12):1525–1557.
[19] Lee, S. Creating a region? the evolution of free trade agreement networks
in east asia. (7):1–32.
[20] Lloyd, P. J. and MacLaren, D. Gains and losses from regional trading
agreements: A survey*. 80(251):445–467.
[21] Magerman, G., De Bruyne, K., and Van Hove, J. Revealed multilateral
trade resistance in gravity models–a network approach.
[22] Manger, M. S., Pickup, M. A., and Snijders, T. A. B. A hierarchy of
preferences: A longitudinal network analysis approach to PTA formation.
56(5):853–878.
[23] Mayer, T., Head, K., and Ries, J. The erosion of colonial trade linkages
after independence.
[24] Pauwelyn, J. and Alschner, W. Forget about the WTO: The network of
relations between preferential trade agreements (PTAs) and’double PTAs’.
[25] Wonnacott, P. and Wonnacott, R. J. Free trade between the united
states and canada: Fifteen years later. 8:412–427.
[26] Wonnacott, R. J. Canada’s future in a world of trade blocs: A proposal.
1(1):118–130.
36
[27] Wonnacott, R. J. Trade and investment in a hub-and-spoke system
versus a free trade area. 19(3):237–252.
[28] Wooldridge, J. M. Econometric Analysis of Cross Section and Panel
Data. MIT Press.
37