Freddie Mac Structured Agency Credit Risk (STACR) Debt … · 2014-03-31 · However, unlike in...
29
March 31, 2014 U.S. Structured Finance RMBS Presale Analytical Contacts: Michele Patterson, Senior Director [email protected], 646-731-2397 Steve McCarthy, Associate Director [email protected], 646-731-2343 Julian Ferdman, Senior Analyst [email protected], 646-731-2379 Lenny Giltman, Senior Director [email protected], 646-731-2378 Freddie Mac Structured Agency Credit Risk (STACR) Debt Notes, Series 2014-DN2
Transcript of Freddie Mac Structured Agency Credit Risk (STACR) Debt … · 2014-03-31 · However, unlike in...

March 31, 2014
U.S. Structured Finance
RMBS Presale
Analytical Contacts:
Michele Patterson, Senior Director
[email protected], 646-731-2397
Steve McCarthy, Associate Director
[email protected], 646-731-2343
Julian Ferdman, Senior Analyst
[email protected], 646-731-2379
Lenny Giltman, Senior Director
[email protected], 646-731-2378
Freddie Mac Structured Agency Credit Risk
(STACR) Debt Notes, Series 2014-DN2

STACR 2014-DN2 Page | 2 March 31, 2014
Transaction Overview ..................................................................................................................... 3
Recent Transaction Comparison .................................................................................................... 8
Collateral Pool and Model Analysis .................................................................................................... 9
Analysis ..................................................................................................................................... 9
Collateral ................................................................................................................................... 9
Historical Performance .................................................................................................................. 12
Structure and Cashflow Modeling ................................................................................................... 14
Interest ................................................................................................................................ 14
Principal ................................................................................................................................ 14
Write-downs .......................................................................................................................... 15
Write-ups .............................................................................................................................. 15
Underwriting Defect ................................................................................................................ 15
Minimum Credit Enhancement and Cumulative Net Credit Event Tests .......................................... 15
Credit Event .......................................................................................................................... 16
Modifications ......................................................................................................................... 16
Termination Date ................................................................................................................... 17
Exchangeable Certificates........................................................................................................ 17
Representations, Warranties and Enforcement Mechanisms ............................................................... 18
Transaction Parties ....................................................................................................................... 19
Freddie Mac .............................................................................................................................. 21
Company Overview/Background............................................................................................... 21
Loan Acquisitions ................................................................................................................... 21
Extending of Credit and Counterparty Review ............................................................................ 22
Quality Control ...................................................................................................................... 22
Servicing ............................................................................................................................... 23
KBRA Rating Process .................................................................................................................... 25
Scenario/Sensitivity Analysis ......................................................................................................... 25
Rating Surveillance ....................................................................................................................... 26
Appendix A: Tear Sheet ................................................................................................................ 27
Appendix B: Eligibility Criteria ........................................................................................................ 28
Table of Contents

STACR 2014-DN2 Page | 3 March 31, 2014
Transaction Overview STACR 2014-DN2 constitutes Freddie Mac’s fourth Structured Agency Credit Risk Debt Notes risk-sharing transaction. Amounts due on the notes will be calculated based on the performance of a reference pool of mortgages that were acquired and securitized into agency mortgage-backed securities (MBS) by December 31, 2013, but the notes themselves will not be secured by any collateral. The notes will instead be unsecured obligations of Freddie Mac and, much like the agency MBS that Freddie Mac currently guarantees, will not be explicitly guaranteed by the federal government.
Freddie Mac is initially retaining the risk that the Class A-H, M-1H, M-2H, M-3H and B-H reference tranches represent in the Reference Pool. The Class M-1, M-2 and M-3 Notes will be offered to investors and are paid pro rata with reductions in the notional amounts of the Class M-1H, M-2H and M-3H reference tranches, respectively. As each class of mezzanine notes and its corresponding “H” reference tranche represent the same credit risk and are only differentiated by the risk-bearer, in this pre-sale report we generally use the class designation (e.g. Class M-1) to mean the combination of the two reference tranches.
This pre-sale report is based on information regarding the underlying mortgage loans (Reference Obligations) and the terms of the transaction as of March 20, 2014. The ratings shown are preliminary and

STACR 2014-DN2 Page | 4 March 31, 2014
subsequent information may result in the assignment of final ratings that differ from the preliminary ratings. This report does not constitute a recommendation to buy, hold, or sell securities.
Class Initial Certificate Balance ($)
Scheduled Final Maturity Coupon CE (%) Initial KBRA
RatingA-H1 26,880,367,090* April 2024 N/A 4.50 NR
M-1 230,000,000 April 2024 1M Libor + [] 3.50 A(sf)
M-1F 230,000,000 April 2024 1M Libor + [] 3.50 A(sf)
M-1I 230,000,000 April 2024 [] 3.50 A(sf)M-1H1 51,469,812* April 2024 N/A 3.50 NR
M-2 345,000,000 April 2024 1M Libor + [] 2.00 BBB(sf)
M-2F 345,000,000 April 2024 1M Libor + [] 2.00 BBB(sf)
M-2I 345,000,000 April 2024 [] 2.00 BBB(sf)M-2H1 77,204,718* April 2024 N/A 2.00 NR
M-3 391,000,000 April 2024 1M Libor + [] 0.30 NR
M-3F 391,000,000 April 2024 1M Libor + [] 0.30 NR
M-3I 391,000,000 April 2024 [] 0.30 NRM-3H1 87,498,681* April 2024 N/A 0.30 NR
M-12 575,000,000 April 2024 WAC2 2.00 BBB(sf)
MA 966,000,000 April 2024 WAC2 0.30 NRB-H1 84,440,945* April 2024 N/A 0.00 NRTotal 840,000,000 - - - -
Structure
WA CLTVWA FICOGeographic ConcentrationTop OriginatorsTop Servicers
Capital Structure
STACR 2014-DN2KBRA Quick Facts
75.3%116,677
$28,146,981,24630 Yr Fixed: 100%
$241,238
2The Class M-12 Notes will bear interest at the WAC rate of the Class M-1 Notes and Class M-2 Notes, and the MA at the WAC of the Class M-1, Class M-2, and Class M-3 Notes.
1Reference Tranche; *Notional Amount
Product TypeLoan BalanceAverage Loan BalanceNumber of LoansWA LTV
Senior/subordinate; Sequential
JPMCB: 19%; US Bank: 10%; BB&T: 6%CA: 20.9%; TX: 5.5%; IL: 5.2%
76076.4%
JPMCB: 20%; US Bank: 10%; Nationstar: 7%

STACR 2014-DN2 Page | 5 March 31, 2014
Key Credit Considerations + / –
Fully-documented, prime loans with strong credit characteristics
The reference obligations are all fully documented prime quality loans, as evidenced by the weighted average (WA) FICO of 760, which is well above Freddie Mac’s historical pre-crisis average and in line with recent prime jumbo RMBS. The WA debt-to-income (DTI) ratio of 33% is also within the range that Kroll Bond Rating Agency (KBRA) has seen in recent prime jumbo RMBS.
+
High Loan-To-Value (LTV) and Combined LTV (CLTV) Ratio
While the WA first-lien loan-to-value (LTV) and combined LTV (CLTV) ratios of 75% and 76%, respectively, represent significant borrower equity in the properties and provide a margin of safety against potential home price declines, these are higher than any of the recent vintage non-agency RMBS transactions that KBRA has rated. KBRA views high levels of equity in the property to be among the best deterrents of default, particularly when home prices come under stress. Our loan level default model incorporates a regression analysis that measures default rates in response to current equity in the property and tends to be highly sensitive to CLTV.
-
Geographic Diversity
The STACR 2014-DN2 pool is by far the most geographically diverse pool that KBRA has rated. California concentration is low at 21% (relative to the current minimum and average concentration for collateral KBRA has rated of 37% and 48%, respectively). The top 10 Core Based Statistical Areas (CBSAs) comprise just 39% of the pool. Geographic diversity helps to ameliorate the risk that a regional economic recession or natural disaster will have an outsized impact on default rates.
+
Robust set of historical data made available by Freddie Mac
In 2013, Freddie Mac released a historical dataset allowing the investing community to gain comfort with Freddie Mac’s historical default rates. The dataset, which included origination and performance information for 15.7 million mortgage loans, allowed KBRA to apply its RMBS approach to Freddie Mac collateral. KBRA’s original analysis of the dataset can be found in KBRA’s report, Mortgage Credit Trends: Freddie Mac vs. Prime Jumbo.
+
Alignment of Interests
Freddie Mac is aligned both vertically and horizontally in its risk retention, as it will be retaining the credit risk of the reference pool represented by the Class A-H, M-1H, M-2H, M-3H and B-H reference tranches. The Class B-H represents the first 30 bps of loss, while Classes M-1H, M-2H and M-3H collectively represent 22% of the mezzanine stack.
+

STACR 2014-DN2 Page | 6 March 31, 2014
Structural Advantages
Investors benefit from a number of structural features, such as a 10-year transaction maturity, that will help protect against back-ended loss. In addition, a pre-determined severity formula, which is fixed and tiered around the percentage of cumulative net credit events and tops out at 40%, limits potential losses. Furthermore, sequential payments within the mezzanine stack benefit the Class M-1 and M-2 as they could potentially be paid off prior to losses depleting their credit enhancement.
+
Representation and Warranties
Freddie Mac does not make representations and warranties (R&Ws) directly to investors as part of the STACR transaction. The sellers of the reference obligations are required to make certain R&Ws that comply with Freddie Mac guidelines, and to the extent an R&W is breached and Freddie Mac is entitled to a repurchase amount, indemnity or other cure right, the investor may benefit from such remedy. However, unlike in non-agency RMBS transactions that typically provide for automatic reviews for R&W breaches when loans underperform, Freddie Mac will have full discretion as to whether and to what extent it will review reference obligations. Because of Freddie Mac’s strong alignment of interest with investors, KBRA does not view this as a major transaction risk.
An additional weakness regarding the R&W framework is that several R&Ws made by the sellers of the reference obligations potentially sunset in as few as three years, although R&Ws related to fraud, compliance with laws and lien priority remain in effect for the life of the loan.
-
Due Diligence Sampling
Most non-agency transactions KBRA has rated feature a review of 100% of the loans in the pool (with the exception of loans originated by First Republic Bank) by a third party due diligence firm for compliance with underwriting guidelines. However, only 1,000 of the 122,987 loans in the STACR 2014-DN2 initial cohort pool (including loans that were dropped from the reference pool for not meeting the reference pool eligibility criteria) were reviewed by an independent reviewer, and while the results were generally good, there were some defects and data discrepancies that likely also exist in the un-reviewed portion of the pool.
-
Interest payments not dependent on mortgage rates of reference obligations or payment collections.
Freddie Mac will be responsible for paying the note rate on the outstanding balance of the class regardless of the interest rates owed or collected by the reference obligations. This removes the risk found in standard RMBS transactions of interest shortfalls due to available funds or weighted average coupon (WAC) caps stemming from modifications or expenses incurred by the trust.
+

STACR 2014-DN2 Page | 7 March 31, 2014
Existing Conservatorship and Risk of Future Receivership
The Federal Housing Finance Agency (FHFA) placed Freddie Mac in conservatorship on September 6, 2008. This action was a result of the agencies massive financial duress during the financial crisis. Despite recent overhauls and management changes, issues may linger. If the FHFA finds reason to take Freddie Mac into receivership, FHFA could reject contracts previously entered into by Freddie Mac. As long as the U.S. government continues to support Freddie Mac, risk of non-payment of the notes is limited.
+/-

STACR 2014-DN2 Page | 8 March 31, 2014
Recent Transaction Comparison
The chart above compares key collateral, structural, and performance information for STACR 2014-DN2 with similar risk-sharing transactions, all of which are comprised entirely of 30-year fixed rate mortgage loans.
To download the full transaction comparison, please click here: Transaction Comparison.
Transaction Name STACR 2014-DN2 STACR 2014-DN1 STACR 2013-DN2 STACR 2013-DN1 KBRA 2013 Rated 30-Year Fixed
Original Pool Balance ($) 28,146,981,246 32,440,675,487 35,327,316,633 22,584,361,520 8,008,144,399
Average Loan Balance ($) 241,238 232,528 242,636 234,304 791,945
Number of Loans 116,677 139,513 145,598 96,389 10,112
WA LTV (%) 75.3 74.8 74.3 74.8 65.8
WA CLTV (%) 76.4 75.7 75.3 75.6 67.1
CLTV > 80% 6.6 5.3 5.8 4.6 0.3
WA FICO* 760 761 764 766 771
WALA (mo) 6 3 8 9 2
ARMs (%) 0.0 0 0 0 0.0
IO (%) 0.0 0 0 0 2.7
Full Doc (%) 100 100 100 100 100
DTI 33.2 32.8 32.1 32.0 30.1
Primary Residence (%) 88 86 89 89 94
Purchase (%) 53 41 27 40 37
Cash-Out Refinance (%) 17 19 20 43 9
WA Gross Coupon (%) 4.02 3.72 3.6 3.84 3.91
WA Margin (%) 0.00 0 0 0 0.0
WA Original Term (mos.) 360 360 360 360 352
1st Liens (%) 100 100 100 100 100
Loans with 2nd Liens (%) 9 8 9 7 10
Geographical Concentration (%)
Largest State CA - 20.9 CA - 23.4 CA - 24.5 CA - 22.4 CA - 47.2
2nd Largest State TX - 5.5 VA - 5.2 VA - 5.5 VA - 5.2 MA - 7.2
3rd Largest state IL - 5.2 TX - 4.7 MA - 4.9 IL - 4.7 TX - 6.0
Top 3 States (%) 31.6 33.4 34.8 32.3 32.3
Largest CBSA Los Angeles, CA3 - 7.3 Los Angeles, CA3 - 8.2 Los Angeles, CA3 - 8.6 Non Metro - 10.1 San Francisco, CA1 - 18.7
2nd Largest CBSA New York, NY2 - 6.1 Washington, DC4 - 6.0 Washington, DC4 - 6.3 Los Angeles, CA3 - 4.8 Los Angeles, CA3 - 12.23rd Largest CBSA Washington, DC4 - 5.7 New York, NY2 - 5.4 New York, NY2 - 5.9 Washington, DC4 - 4.4 Boston,MA5 - 6.2Top 3 CBSA (%) 19.1 19.6 20.8 19.3 19.3
Top Originators (%)
Largest Originator JPMCB - 19.2 Wells Fargo - 22.3 Wells Fargo - 21.4 Wells Fargo - 26.8 First Republic - 17.8
2nd Largest Originator US Bank - 10.5 US Bank - 9.4 US Bank - 12.1 US Bank - 16.2 New Penn - 6.0
3rd Largest Originator BB&T - 6.3 JPMCB - 8.7 JPMCB - 11.8 Provident - 8.2 Prime Lending - 5.7
Total Top Originators (%) 35.9 40.4 45.3 51.3 29.5
KBRA A(sf) Loss
Model 3.94 3.78 NA NA NA
+ GEO Adjustment 3.62 3.47 NA NA NA
GEO Adj % -8% -8% NA NA NA
+ Other Adjustments 3.40 3.30 NA NA NA
Other Adj % -6% -5% NA NA NA1San Francisco-Oakland-Fremont, CA; 2New York-Northern New Jersey-Long Island, NY-NJ-PA; 3Los Angeles-Long Beach-Santa Ana, CA; 4Washington-Arlington-Alexandria, DC-VA-MD-WV; 5Boston-Cambridge-Quincy, MA-NH*Note: FICO scores are as of origination date

STACR 2014-DN2 Page | 9 March 31, 2014
Collateral Pool and Model Analysis
Analysis As described in KBRA’s report, Mortgage Credit Trends: Freddie Mac vs. Prime Jumbo, KBRA believes the performance of agency and non-agency collateral to be comparable when controlling for risk attributes such as CLTV and FICO score. In analyzing the STACR 2014-DN2 pool, KBRA implemented the same loan level default model it uses in rating non-agency transactions. As described later in this pre-sale report, losses on the notes will be determined by the occurrence of discrete credit events, with the first time the loan reaches 180 days of delinquency (D180) likely to comprise the vast majority of such credit events. KBRA’s expected credit event levels are shown in the table below. KBRA ran the model on each of the 116,677 loans to calculate a pool level expected lifetime default rate.
There were two major modifications relative to non-agency analysis which KBRA employed when forecasting loss rates to the noteholders. KBRA’s model predicts when a loan will be liquidated. Since credit events, not actual loan liquidations will determine losses on the notes, our lifetime default numbers were converted to credit event rates. KBRA researched historical loan level data and determined that lifetime cure rates of D180s averaged approximately 15%, and grossed up its expected default rate numbers by that amount to arrive at an expected D180 rate. That value can be seen in the second column.
The second significant adjustment KBRA made to the credit event expectations was to account for the geographic diversity that is present in the STACR 2014-DN2 pool as compared to jumbo collateral issued both recently and historically. KBRA uses the entirety of the Corelogic jumbo database as a benchmark for non-agency concentration, and STACR 2014-DN2 proved to be significantly more diverse. KBRA believes geographic diversity helps insulate the pool from localized economic and environmental risks. The benefit KBRA gave to the pool for geographic diversity can be seen in the fourth column when compared to the third.
Lastly, the transaction documents will require Freddie Mac to redeem all remaining notes in April 2024, so investors will not be exposed to credit events that occur after that date. The fifth column represents KBRA’s expected noteholder loss rates for the first 10 years after issuance.
Collateral KBRA considers the mortgage loans referenced by STACR 2014-DN2 to be high quality, prime collateral. All of the reference loans are fully documented and meet Freddie Mac’s eligibility criteria, including having an LTV between 60% and 80%. The reference pool is made up entirely of first-lien, fully amortizing mortgages loans with a 30-year term to maturity. The WA FICO of 760 is very similar to the WA FICOs in recent jumbo non-agency securitizations and is well within the “prime” mortgage range. The borrowers
SEMT 2014-1
Rating Level
Modeled Lifetime Default
Modeled Lifetime D180
Rate
Modeled Noteholder Loss
Geographic Diversity
Adjustment
10 Year Term Adjustment
Final Noteholder Loss Rate
Implied Credit Event Rate
Modeled Lifetime Default
A 9.43 10.85 3.94 3.62 3.40 3.40 9.50 4.83BBB 5.60 6.44 2.18 2.00 1.88 2.90 5.75 2.86B 2.33 2.68 0.67 0.55 0.52 0.50 2.25 1.22
STACR 2014-DN2 Expected Credit Event Levels (% of Closing Pool Balance)

STACR 2014-DN2 Page | 10 March 31, 2014
have a WA DTI of 33%, which is also within the range seen in recent RMBS securitizations, albeit on the high end. However, at 76.4%, the WA CLTV is much higher than any of the jumbo transactions KBRA has rated to date, and is the major driver of the higher default expectations for STACR 2014-DN2 versus previously rated transactions. Adjacent to the STACR levels above is the modeled default rates for the last jumbo transaction KBRA rated in 2014, Sequoia Mortgage Trust (SEMT) 2014-1, which had lifetime default projections that were on average 49% lower than what is being projected for STACR 2014-DN2.
The tables below compare the CLTV distributions of STACR 2014-DN2 and SEMT 2014-1. One significant difference in the two distributions is the portion of the SEMT 2014-1 pool that has a CLTV below 60%. Loans with LTVs of 60% and below are ineligible for the STACR transaction, and while the percent of the SEMT 2014-1 pool in that cohort is low at 22%, its contribution to the total ‘AAA’ expected loss was minimal at 2.5%. Both pools are seeing the biggest contribution to their respective default and loss numbers from the 80% and greater CLTV buckets, with 49% in STACR contributing 63% of its defaults, and 24% in SEMT with 80% or greater CLTV contributing 49% of its ending loss number. The larger percentage of loans with CLTVs of 80% and above, in combination with the absence of loans with CLTVs less than or equal to 60% as an offset, is leading to the significant difference in KBRA’s default projections.
Another important distinction between the collateral attributes of STACR 2014-DN2 and the collateral included in post-crisis non-agency securitizations is the geographic diversity that the agency collateral exhibits. Non-agency pools are almost entirely comprised of loans above the conforming balance limit. That characteristic generally leads to high concentrations in those regions of the country where home prices are highest. As a result, the geographic concentration in pools of non-agency prime loans tends to be high, with significant exposure to assets located in California, New York City and Washington, D.C. The single largest state concentration for most non-agency pools generally ranges from 37% to 64%. Alternatively, only 21% of the reference obligations in this pool are located in California. As the tables below show, the most represented CBSA in KBRA rated jumbo transactions in 2013 was San Francisco, which contributed 18% of loans on average. This is almost as much as the top three CBSAs combined in STACR. Over 70% of the loans in the jumbo pools KBRA rated in 2013 were concentrated in just 10 CBSAs, while STACR is just 39% concentrated in its top 10 CBSAs.
# of Loans
WA FICO
WA LTV (%)
WA CLTV (%)
% of Total
Balance
% of 'A' Defaults
# of Loans
WA FICO
WA LTV (%)
WA CLTV (%)
% of Total
Balance
% of AAA EL
20-24.99 0 0 0 0 0.0 0.0 0 0 0 0 0.0 0.025-29.99 0 0 0 0 0.0 0.0 3 751 27 27 0.9 0.030-34.99 0 0 0 0 0.0 0.0 8 771 33 33 1.4 0.035-39.99 0 0 0 0 0.0 0.0 8 766 37 37 1.8 0.040-44.99 0 0 0 0 0.0 0.0 10 778 42 43 2.3 0.045-49.99 0 0 0 0 0.0 0.0 12 750 45 47 2.7 0.150-54.99 0 0 0 0 0.0 0.0 27 762 52 52 7.0 0.755-59.99 0 0 0 0 0.0 0.0 26 759 58 58 6.0 1.760-64.99 6,291 761 63 63 5.3 1.8 41 761 62 62 9.5 3.065-69.99 11,527 760 67 67 10.2 4.9 44 752 67 68 9.2 5.370-74.99 16,220 760 72 72 14.5 10.1 54 768 70 72 14.1 12.075-79.99 24,437 760 76 76 21.2 20.2 90 764 75 77 20.7 28.180-84.99 53,154 760 80 80 43.0 50.9 106 763 80 80 24.4 49.085-89.99 1,701 756 75 87 2.0 3.6 0 0 0 0 0.0 0.090-94.99 2,751 758 76 90 3.2 6.9 0 0 0 0 0.0 0.095-99.99 595 754 77 95 0.6 1.6 0 0 0 0 0.0 0.0Grand Total 116,676* 760 75 76 100 100 429 762 68 68 100 100*CLTV unavailable for one loan
CLTV Range (%)
STACR 2014-DN2 SEMT 2014-1CLTV Distribuion

STACR 2014-DN2 Page | 11 March 31, 2014
To determine a baseline for calculating geographic concentration adjustments for non-agency jumbo pools, KBRA calculated a Herfindahl index on the entirety of the Corelogic prime database at the CBSA level. When KBRA rates a non-agency pool, it first calculates a weighting factor by comparing the Herfindahl index to the index for a large set of historical loans backing non-agency RMBS. The adjusted loss rate at a given rating level is then the weighted average of the expected loss at the given rating level and the rating level above it, weighted by the calculated weighting factor.
The Herfindahl for the STACR pool was significantly below that of the historical non-agency dataset. In recognition of this geographic diversity, KBRA adjusted the expected loss levels downward. The adjustment resulted in expected losses that were approximately 8% lower at both the ‘A’ and ‘BBB’ levels.
CBSA Name% of total CBSA Name
% of total
Los Angeles-Long Beach-Santa Ana, CA 7.3% San Francisco-Oakland-Fremont, CA 18.4%New York-Northern New Jersey-Long Island, NY-NJ-PA 6.1% Los Angeles-Long Beach-Santa Ana, CA 12.2%Washington-Arlington-Alexandria, DC-VA-MD-WV 5.7% New York-Northern New Jersey-Long Island, NY-NJ-PA 6.1%Chicago-Joliet-Naperville, IL-IN-WI 4.7% Boston-Cambridge-Quincy, MA-NH 6.1%San Francisco-Oakland-Fremont, CA 3.7% San Jose-Sunnyvale-Santa Clara, CA 5.7%Boston-Cambridge-Quincy, MA-NH 3.6% Washington-Arlington-Alexandria, DC-VA-MD-WV 5.3%San Diego-Carlsbad-San Marcos, CA 2.2% San Diego-Carlsbad-San Marcos, CA 4.7%Denver-Aurora-Broomfield, CO 2.1% Seattle-Tacoma-Bellevue, WA 4.4%Seattle-Tacoma-Bellevue, WA 2.0% Chicago-Joliet-Naperville, IL-IN-WI 4.3%Phoenix-Mesa-Glendale, AZ 1.8% Dallas-Fort Worth-Arlington, TX 2.9%
KBRA 2013 Rated RMBSSTACR 2014-DN2

STACR 2014-DN2 Page | 12 March 31, 2014
Historical Performance In 2013 Freddie Mac released a comprehensive loan-level database which included origination and performance data for a select set of its portfolio that included mortgage loans similar to the reference obligations in STACR 2014-DN2. A more detailed report on that dataset can be found here. KBRA concluded after analyzing that dataset that there was dramatic improvement in credit quality between 2007 and 2009, as evidenced by a sharp fall in credit events
The table above is an updated version of the one that was released as part of the published report, now with data through the first quarter of 2013. Some of the most significant findings in the table are the sharp increases in weighted average credit scores, the drops in CLTV and DTI that occurred post-crisis, and the performance improvement that can be seen as a result. The 2009 vintage has outperformed all of the vintages prior to it. The crisis era vintages of 2005-2008 all stand out as having experienced substantial credit event rates that approach or pierce double digits. Many of the early vintages, however, experienced credit event rates that were below the 2.25% rate that KBRA is projecting in STACR 2014-DN2, despite their credit attributes being considerably worse, due mainly to the fact that the early vintages experienced a historic refinancing boom in 2003 which transitioned many of the borrowers that may have later defaulted. The subsequent bull market in housing gave many borrowers who may have been under financial stress an opportunity to tap equity and prepay their mortgage instead of defaulting. Indeed, the 1999-2002 vintages all had very short WA loan lives.
The final column in the table shows what the 10 year credit event rates would have been had the vintages been proportioned into CLTV, FICO, and DTI cohorts with the same weightings as STACR 2014-DN2. The worst vintage, 2007, which showed a credit event rate of 13.2% unweighted, would have shown a rate closer to 7.3% if it had similar risk attributes to STACR 2014-DN2. We note that the 7.3% credit event rate falls between our ‘BBB(sf)’ and ‘A(sf)’ expected credit event rates on this transaction.
Vintage Loan CountTotal Orig
UPB ($)
WA FICO
WA LTV (%)
WA CLTV (%)
WA DTI (%)
WAC (%)
Purch
(%)
C/O (%)
R/T Refi (%)
WA Months Outstanding
Est. WA HPA
10-Yr CER to Date
10-Yr CER to Date Weighted by
STACR 2014-DN2
1999 972,078 122 708 77.4 77.5 31.9 7.21 55.8 16.9 27.3 46.0 33.6 1.6% 0.6%2000 731,283 94 702 78.6 79.1 34.5 8.19 78.4 9.5 12.1 22.3 14.6 1.7% 0.6%2001 1,540,346 226 711 76.1 76.8 33.2 7.13 44.7 23.6 31.7 26.9 16.0 1.7% 0.7%2002 1,734,328 266 714 74.0 75.0 33.2 6.65 36.0 27.0 37.0 32.0 15.6 1.8% 1.0%2003 1,944,594 314 725 71.8 73.1 31.8 5.77 25.3 25.5 49.3 61.5 12.4 2.3% 1.7%2004 952,285 158 718 73.7 75.5 34.7 5.84 46.6 25.1 28.3 60.2 2.1 4.3% 2.7%2005 1,293,414 233 723 72.3 74.2 35.9 5.77 43.3 36.2 20.5 60.2 -12.4 7.8% 5.1%2006 1,098,826 203 722 72.9 75.4 37.1 6.39 50.5 34.9 14.6 47.3 -17.2 11.3% 6.8%2007 1,082,507 204 723 74.0 77.1 37.1 6.35 47.1 34.9 18.0 41.6 -17.8 13.2% 7.3%2008 1,032,059 217 737 72.4 74.4 37.1 6.12 41.6 31.4 27.0 32.9 -10.8 8.9% 5.2%2009 1,463,948 333 762 67.2 69.1 32.8 5.05 24.1 26.7 49.2 33.4 -1.2 1.0% 1.2%2010 815,989 182 761 69.7 71.1 33.5 4.90 38.6 25.1 36.3 25.9 0.0 0.3% 0.4%2011 591,047 138 762 71.0 72.3 33.3 4.60 41.7 20.7 37.5 17.5 4.7 0.1% 0.1%2012 640,893 156 766 71.1 72.4 32.3 3.93 34.9 17.0 48.2 7.9 4.1 0.0% 0.0%Total 15,893,597 2,846 732 72.5 74.1 34.1 5.92 40.2 26.6 33.2 38.6 2.1 4.1% 2.4%
STACR2014-DN2 116,677 28 760 75.3 76.4 33.2 4.02 52.7 17.0 30.4
C/O - Cash-Out R/T - Rate/Term HPA - Home Price Appreciation CER - Credit Event Rate

STACR 2014-DN2 Page | 13 March 31, 2014
Through February 2014, the first STACR transaction was still performing well with few delinquencies. From the few delinquencies that are showing, the significance of borrower characteristics such as FICO and DTI becomes evident. The average FICO of the delinquent loans is 40 points below that of the performing ones, and over 30% of the delinquent loans had original FICOs below 700. First time homebuyers were slightly but not significantly more likely to be delinquent while delinquent and seriously delinquent loans were much less likely to have multiple borrowers associated with them. DTI is clearly an important default driver as D30 loans had a WA DTI that was 4 points higher than current loans, and the WA DTI for seriously delinquent loans was 6 points higher than that of the current loans.
So far three loans have gone D180 in STACR 2013-DN1 resulting in a writedown to the B-H reference tranche of $60,285(9 bps). All three of the loans had below-average original balances and FICO scores and above-average DTIs. None of the D180 loans had multiple borrowers supporting the mortgage.
KBRA also analyzes how discoveries during the due diligence phase may indicate higher likelihoods of future underperformance. To date, only one of the reference obligations ever to go delinquent in STACR 2013-DN1 was reported as having a discrepancy in the released loan data tape, but it was for having a DTI that was reported at 45 when the diligence firm calculated 34.
StatusCurrent Balance ($MM)
% Of Total
Average Current Loan
Balance
WA FICOWA
Originial CLTV
WA DTI WAC FICO < 700
CLTV > 90 DTI > 40
First Time Home Buyer
Mult. Bowrs. Own Occ Pchse. Cash Out
Current 21,625 99.8% 230,937 766 74.8 32.2 3.84 6.0 0.9 24.3 10.4 62.9 89.3 40.0 17.1D30 41 0.2% 212,829 719 75.5 36.4 3.96 36.3 2.2 37.2 14.6 47.1 94.5 46.5 25.5
D60+ 7 0.0% 194,267 736 72.7 38.3 3.97 25.6 4.7 43.9 11.5 34.1 95.8 36.9 26.3
STACR 2013-DN1 Delinquency Buckets as Of 2/28/2014
Loan Id Seller State Masked Zip MSA Interest
RateOriginal Balance Purpose Channel Prop.
Type Occ. # Of Bowrs.
First Time Home Buyer
FICO Orig LTV
Orig CLTV
Orig DTI
14564 OTHER FL 336 Tampa, FL1 4 127,000 C/O Retail PUD Owner 1 N 730 61 61 3925422 JPM OH 430 Columbus, OH 4.25 101,000 No C/O Corresp. SF Owner 1 N 724 78 78 4216996 OTHER FL 335 Tampa, FL1 3.99 180,000 Purchase Retail PUD Owner 1 Y 689 80 80 36
D180 Loans As of 2/28/2014
1Tampa-St. Petersburg-Clearwater, FL

STACR 2014-DN2 Page | 14 March 31, 2014
Structure and Cashflow Modeling The STACR 2014-DN2 certificates are reference notes, not pass-through securities, and as such principal and interest payments will be derived from the performance of the reference pool but will not be paid directly from the underlying mortgage collections. The notes will be unsecured, general obligations of Freddie Mac and investors will have no recourse to the reference mortgage pool.
Interest
Interest due on the notes will be calculated as the product of the outstanding note balance times the note rate (1M libor + the class margin). Interest payments are not subject to WAC or available funds caps.
Principal
Except when a trigger is in effect, scheduled and unscheduled principal collected will be allocated pro rata to two distribution amounts, a senior reduction amount and a subordinate reduction amount, based on the outstanding balance of the classes in each group. The senior reduction amount will reduce the balance of the A-H reference note. The subordinate reduction amount will be allocated sequentially among the subordinate notes (first paying off Class M-1, then Class M-2, then Class M-3, then Class B-H).
Locking out the Class M-2, M-3, and B-H tranches serves to turbo the Class M-1, potentially safeguarding it against back-ended losses in higher prepayment scenarios. In KBRA’s base case projected default scenario, the Class M-1 tranche is paid down to a .08 factor at maturity - even with 0 prepayments - by collecting 100% of the subordinate share of scheduled principal, while the Class A-H and collateral have only paid down 23% and 24%, respectively. At 5 CPR the Class M-1 is paid off by May 2020, and at 10 CPR both of the Class M-1 and M-2 tranches are paid off before the 10 year final.
Tranche 0 5 10 15 20 30 40A-H 0.77 0.45 0.26 0.14 0.08 0.02 0.00M-1 0.08 0.00 0.00 0.00 0.00 0.00 0.00M-2 1.00 0.57 0.00 0.00 0.00 0.00 0.00M-3 0.88 0.88 0.87 0.52 0.30 0.06 0.00
Collat 0.76 0.45 0.26 0.15 0.08 0.02 0.00M-1 5.58 3.39 1.88 1.29 0.96 0.64 0.47M-2 10.04 9.28 6.02 3.60 2.65 1.68 1.20M-3 9.74 9.74 9.73 9.08 7.66 5.12 3.42M-1 4/24 5/20 4/17 4/16 10/15 5/15 12/14M-2 4/24 4/24 2/24 5/20 4/18 10/16 1/16M-3 4/24 4/24 4/24 4/24 4/24 4/24 8/22
Factor At Maturity
Projected WAL
Payoff Month
Cashflow Metrics at Base Case Default RateProjected CPR

STACR 2014-DN2 Page | 15 March 31, 2014
Write-downs
Losses on the underlying mortgages will not be used in determining write-downs on the notes. Instead, write-downs will be applied to the notes, in reverse sequential order, as credit events occur. The write-down amount will equal the unpaid principal balance of the reference obligation that has experienced a credit event times a fixed severity that will be based on the current cumulative credit events as pre-defined by this schedule:
Write-ups
The most senior tranche that has been written down will be written back up when a loan that previously experienced a credit event is later found to have had an Underwriting Defect or a data correction that invalidates the previously determined credit event. The tranche will be written back up by the unpaid principal balance of the loan at the time of the credit event times the applicable severity during the payment month of the reversal. The tranche will also be written up when Freddie Mac enters into an R&W settlement that covers loans in the reference pool.
Underwriting Defect
When Freddie Mac, through its quality control review process, determines that a reference obligation either had material violations of the underwriting guidelines or was secured by inadequate collateral as of the origination date, or that as of the origination date the mortgagor could not be expected to repay the mortgage in full, the reference obligation will be deemed to suffer from an unconfirmed underwriting defect. If such reference obligation is later repurchased by the loan seller, an alternative remedy is reached, Freddie Mac elects to waive enforcement, or the seller becomes insolvent, the defect will be deemed an Underwriting Defect.
Minimum Credit Enhancement and Cumulative Net Credit Event Tests
Similar to the 2014-DN1 structure, two triggers exist in the deal, and subordinate classes will not be entitled to unscheduled principal while either is failing. The Minimum Credit Enhancement Test ensures that the Class A-H current credit enhancement is at least 5%. Unlike 2013 STACR transactions where Class A-H original enhancement just had to be maintained to satisfy this test, 2014-DN2 is structured with insufficient Class A-H credit enhancement at origination, thus requiring that the subordinate notes initially be locked out from unscheduled principal (Class M-1 will still be paid the subordinate share of scheduled principal). At 10 CPR, it took 12 months for Class A-H to build up from 4.5% initial enhancement to the 5% required in KBRA’s base default scenario.
Under KBRA’s projections, the trigger that is more likely to lead to volatility in expected cashflows for subordinate noteholders is the Cumulative Net Credit Event Test. Under KBRA’s BBB scenario, Class M-1 extended from a 1.88 WAL in the expected case to 4.57, both run at 10 CPR. Class M-2 went from a 6.02 WAL to 10.04.
Cumulative Net Credit Event Percentages Applicable Severity Cumulative Tranche Write-down Amount
Less than or equal to 1.00% 15.00% 0.0% + 15% * Cum. Net Credit Event %Greater than 1.00% and less than or equal to 2.00% 25.00% 0.15% + 25% * Excess of Cum. Net Credit Event % over 1%
Greater than 2.00% 40.00% 0.40% + 40% * Excess of Cum. Net Credit Event % over 2%

STACR 2014-DN2 Page | 16 March 31, 2014
Credit Event As defined by the following table:
Modifications
Modifications will not be considered credit events. However, modifications have the potential to lead to increased credit events. Before a borrower’s mortgage is permanently modified, the borrower typically will have to first make at least three consecutive payments during a trial period. The borrower will not be considered current during this period, and the delinquency status of the loan will continue to advance until the permanent modification has been made. The potential exists for a borrower to begin a trial modification prior to being 180 days delinquent and reaching 180 days delinquent during the trial period, even though the trial payments are being made and an eventual permanent modification and cure takes place. In this scenario, the loan would still be considered a credit event reference obligation when it becomes 180 days delinquent and will not be reversed if it cures at the end of a successful trial period.
Payment Date occurring in the period Percentage AAA A BBB BMay 2014 to April 2015 0.25% 0.85% 0.46% 0.28% 0.11%May 2015 to April 2016 0.50% 2.68% 1.46% 0.89% 0.35%May 2016 to April 2017 0.75% 5.07% 2.77% 1.68% 0.66%May 2017 to April 2018 1.00% 7.78% 4.26% 2.58% 1.01%May 2018 to April 2019 1.25% 10.57% 5.78% 3.50% 1.37%May 2019 to April 2020 1.50% 13.14% 7.18% 4.35% 1.70%May 2020 to April 2021 1.75% 15.21% 8.32% 5.03% 1.97%May 2021 to April 2022 2.00% 16.57% 9.06% 5.48% 2.15%May 2022 to April 2023 2.25% 17.22% 9.41% 5.70% 2.23%May 2023 and thereafter 2.50% 17.38% 9.50% 5.75% 2.25%
M-1 WD 6.32 4.57 1.88M-2 WD WD 10.04 6.02
Test DefinitionRating-Level-Highest Credit Event
Percentage Projected In Period
Cumulative Net Credit Event Test
WAL @ 10 CPR
Event% of Total Credit Events Observed in
Freddie Mac Data Release1
180 or more days delinquent (regardless of any grant of forbearance) 91.7%a short sale is settled 3.7%
the related Mortgage Note is sold to a third party during the foreclosure process 0.6%
a deed in lieu of foreclosure is executed 0.1%a REO acquisition occurs 3.8%
Credit Event Definition and Historical Composition
1As of Q1 2013

STACR 2014-DN2 Page | 17 March 31, 2014
Termination Date
The notes have a 10 year maturity and Freddie Mac is obligated to retire any outstanding balances in Apri 2024. Freddie Mac also has the option to redeem the notes once the reference pool pays down to 10% of its cut-off balance.
Exchangeable Certificates
The Holders of the Class M-1, M-2 and M-3 Notes (the Original Notes) can exchange all or part of those Classes for proportionate interests in the related classes of Modifiable and Combinable STACR® Notes (the MAC Notes, and together with the Original Notes, the Notes), and vice versa, in the proportions set forth below. Certificates may only be exchanged in the specified proportion that the original principal balances or notional amounts of such certificates bear to one another as shown in the table above. Holders of exchangeable certificates will be the beneficial owners of an interest in the related exchangeable combination certificates and will receive a proportionate share, in the aggregate, of the distributions on those certificates. Upon an exchange, the exchangeable certificates will be entitled to interest distributions at the applicable pass-through rate in the same priority as the exchangeable combination certificates and principal distributions on each class of exchangeable combination certificates, in the order of priority assigned to such certificates.
Exchangeable Combination
OriginalClass
OriginalBalance ($)
Exchangeable Certificates
Max Orig Class Amt ($)
M-1F 230,000,000M-1I 230,000,000* M-2F 345,000,000M-2I 345,000,000* M-3F 391,000,000M-3I 391,000,000*
M-1 230,000,000M-2 345,000,000M-3 391,000,000M-1 230,000,000M-2 345,000,000
*Notional Amount
966,000,0004
Permitted Exchangeable Combinations
1
2
5 575,000,000
4
MA
M-12
M-1
M-2
M-3
230,000,000
345,000,000
391,000,000

STACR 2014-DN2 Page | 18 March 31, 2014
Representations, Warranties and Enforcement Mechanisms Unlike in non-agency transactions where R&Ws are made to the trust for the benefit of the investors, Freddie Mac will not directly make loan level R&Ws to the noteholders. Instead, investors must rely on Freddie Mac to enforce the R&Ws made by the entities that sold it the reference obligations, and Freddie Mac will have sole discretion whether to waive a repurchase or cure remedy owed to it by a loan seller. Furthermore, Freddie Mac allows certain of the sellers’ R&Ws to sunset if the borrower either (i) makes the first 36 monthly payments with no 30-day or greater delinquencies or (ii) is current on the 60th month and there were no more than two 30-day delinquencies and no 60-day or greater delinquencies in the first 36 months. R&Ws related to systemic fraud, compliance with laws, and lien priority will survive for the life of the loan.
Because of Freddie Mac’s alignment of interests with the investors both vertically (through ownership in portions of the mezzanine reference tranches) and horizontally (in the Class B-H reference tranche), KBRA believes Freddie Mac is highly incentivized to enforce the loan sellers’ R&Ws. However, the enforcement process will be far less transparent and deterministic than what is normally seen in current private label RMBS transactions, where discrete events (such as a 120 day delinquency or a realized loss) typically triggers an automatic review to ensure no breach has occurred. Reference obligations in 2014-DN2 will be reviewed at Freddie Mac’s discretion as part of the review of its entire mortgage portfolio through its regular quality control review process. Freddie Mac specifically states that the reviews are not performed for the benefit of investors, and there is no guarantee that a reference obligation that experiences a credit event will ever be reviewed. Also, once a seller or servicer becomes subject to a bankruptcy, Freddie Mac will cease reviewing the loans sold or serviced by such entity. Since most recent non-agency R&Ws have either not been backstopped or have been backstopped by lightly capitalized entities, KBRA does not see this as significantly weaker than the prevailing non-agency R&W frameworks.
As part of its diligence, KBRA reviewed the R&Ws Freddie Mac requires its sellers to make. These R&Ws are generally comparable to KBRA’s benchmark R&Ws with one exception: although KBRA’s benchmarks provide that no borrower has been subject to a bankruptcy proceeding in the four years prior to loan origination or to a foreclosure in the seven years prior to loan origination, the Freddie Mac-required R&W periods are only two years and three years, respectively. Because KBRA believes its modelling adequately captures the credit risk of each reference obligation based on other data points provided by Freddie Mac, KBRA did not make an adjustment to loss expectations because of this weaker R&W.
STACR 2014-DN2 Page | 19 March 31, 2014
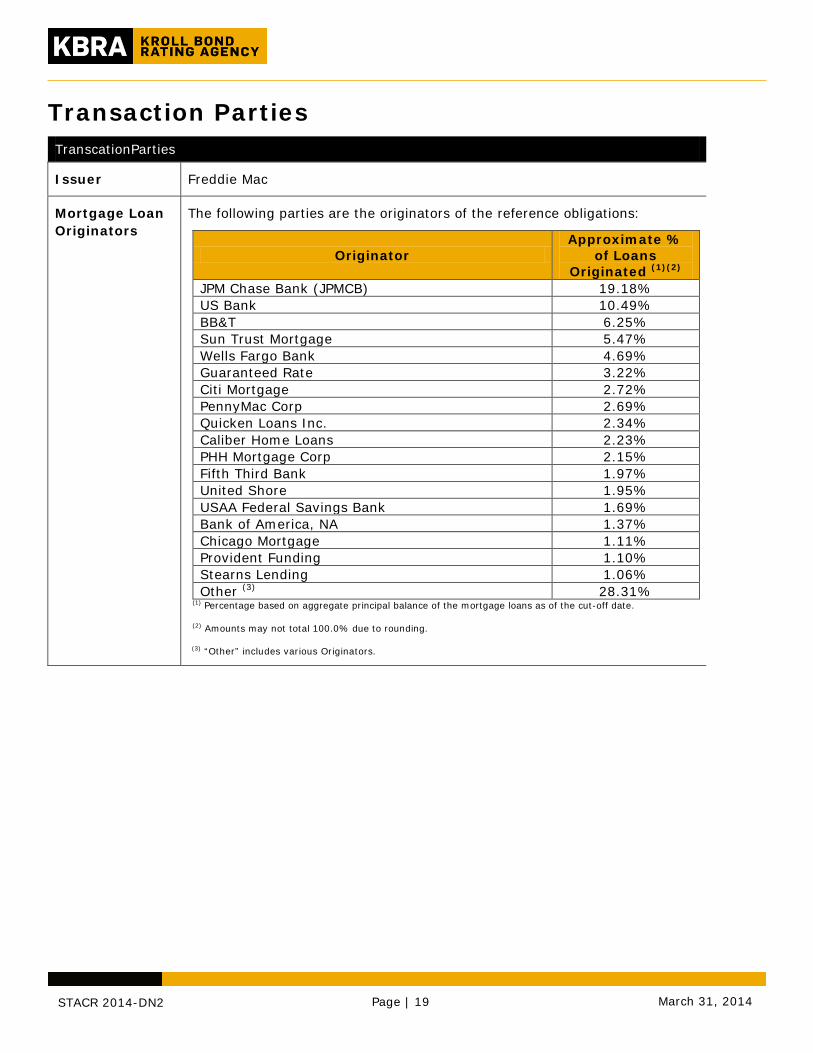
Transaction Parties TranscationParties
Issuer Freddie Mac
Mortgage Loan Originators
The following parties are the originators of the reference obligations:
Originator Approximate %
of Loans Originated (1)(2)
JPM Chase Bank (JPMCB) 19.18% US Bank 10.49% BB&T 6.25% Sun Trust Mortgage 5.47% Wells Fargo Bank 4.69% Guaranteed Rate 3.22% Citi Mortgage 2.72% PennyMac Corp 2.69% Quicken Loans Inc. 2.34% Caliber Home Loans 2.23% PHH Mortgage Corp 2.15% Fifth Third Bank 1.97% United Shore 1.95% USAA Federal Savings Bank 1.69% Bank of America, NA 1.37% Chicago Mortgage 1.11% Provident Funding 1.10% Stearns Lending 1.06% Other (3) 28.31%
(1) Percentage based on aggregate principal balance of the mortgage loans as of the cut-off date.
(2) Amounts may not total 100.0% due to rounding.
(3) “Other” includes various Originators.

STACR 2014-DN2 Page | 20 March 31, 2014
Servicers The following parties are the primary servicers of the reference obligations:
Servicer Approximate %
of Loans Serviced (1)(2)
JPMCB 20.08% US Bank 10.49% Nationstar Mortgage 6.53% BB&T 6.25% Suntrust Mortgage 5.47% Wells Fargo Bank 4.69% Citi Mortgage 2.72% PennyMac Corp 2.69% Quicken Loans Inc. 2.34% Caliber Home Loans 2.23% PHH Mortgage Corp 2.15% Fifth Third Bank 1.97% United Shore 1.95% Arvest 1.72% USAA Federal Savings Bank 1.69% Bank of America, NA 1.37% Provident Funding 1.10% Stearns Lending 1.06% Guaranteed Rate 1.01% Other (3) 22.49%
(1) Percentage based on aggregate principal balance of the mortgage loans as of the cut-off date.
(2) Amounts may not total 100.0% due to rounding.
(3) “Other” includes various Servicers.
Exchange Administrator and Global Agent
U.S. Bank National Association
Co-Lead Managers
Morgan Stanley & Co. LLC
Nomura Securities International, Inc.

STACR 2014-DN2 Page | 21 March 31, 2014
Freddie Mac
Company Overview/Background
In September 2013, KBRA attended a rating agency presentation by Freddie Mac regarding its mortgage loan operations. The full-day presentation was held at Freddie Mac’s headquarters in McLean, VA.
The U.S. Congress chartered Freddie Mac in 1970 to expand the secondary market for mortgages and mortgage-backed securities. Freddie Mac operates in three business segments: Single Family Credit Guarantee, Multifamily and Investments. This review focuses on the single-family business line. Freddie Mac does not originate residential mortgage loans; rather, it buys mortgages that conform to its required underwriting criteria from approved sellers.
On September 6, 2008, the Federal Housing Finance Agency (FHFA) placed Freddie Mac in conservatorship. Due to its size and impact on the mortgage market, Freddie Mac effectively continues to do business as usual. Since 2009 the company has provided over $2 trillion in liquidity to the mortgage market. FHFA has stated that “conservatorship will end when it is determined that the plan to restore the GSEs to safe and solvent condition is complete”, although the decision is ultimately up to Congress. One of the current goals of the FHFA is to gradually contract the GSE’s dominant presence in the mortgage market. Specific to the single-family guarantee business, FHFA is seeking for Freddie Mac to develop and implement risk transfer transactions.
While under conservatorship, Freddie Mac must turn over most of its profits to the federal government - the current terms of the bailout (amended in 2012) do not allow the company to build equity or repurchase the $72 billion government owned preferred shares. Unless these terms are changed by Congress, Freddie Mac will continue to pay all profits to the U.S. Treasury in perpetuity. Including the December dividend obligation, Freddie Mac has paid the Treasury $71.3 billion in equity and dividends through earnings. Net income during 2013 was $48.7 billion and was $11.0 billion for all of 2012. Total equity was $12.8 billion as of yearend 2013.
Loan Acquisitions
Loans are purchased from over 1,100 approved sellers throughout the United States. Residential 1-4 family mortgage loans purchased by Freddie Mac must be originated in accordance with thoroughly defined policies and procedures. These policies are outlined in the Freddie Mac Single-Family Seller/Servicer Guide (Guide), which is publicly available on Freddie Mac’s website. The terms outlined in the Guide are usually revised several times a year, as necessary, through bulletins that update the underwriting and servicing standards. An ongoing audit process reviews all closed loans. Loans that were not originated according to Freddie Mac guidelines (e.g. incorrectly underwritten, missing documentation, etc.) can be put back to the seller for repurchase.
There are limits to the changes Freddie Mac can make to its underwriting standards. The Federal Home Loan Mortgage Corporation Act establishes requirements for and limitations on purchased loans. For example, the maximum loan limit set by the Act is $417,000; this limit can increase up to $625,500 for properties located in ‘high-cost’ areas.
Freddie Mac does not service the loans it purchases. Servicing is either retained by the originator or transferred to a third party servicer upon purchase. Freddie Mac’s servicing requirements are also detailed

STACR 2014-DN2 Page | 22 March 31, 2014
in the Guide. Compliance is monitored through various reporting metrics along with operational and loan file audits. Poor performance generally leads to remediation or ultimately to a servicer transfer.
Extending of Credit and Counterparty Review
Freddie Mac approves sellers and servicers prior to purchasing loans. Approval is granted through a financial and operational review process. Based on qualitative and quantitative factors, Freddie Mac assigns a risk rating and sets risk adjusted credit limits. Exposure is aggregated by counterparty and across product lines. Ultimately the risk to Freddie Mac is the counterparty’s ability to honor its R&Ws.
All approved seller/servicers are monitored on an ongoing basis. Financials are reviewed at least annually and more frequently when warranted. A surveillance team monitors exposure versus limits, risk ratings and audit results. The goal is to mitigate risk and take action prior to default. Based on findings, Freddie Mac may reduce counterparty’s credit limit, perform additional reviews or assign the counterparty to the Watchlist or apply a Troubled Counterparty designation.
Freddie Mac states there are over 1,100 approved sellers. Approximately 500 of these have individualized and negotiated credit agreements referred to as Terms of Business (TOBs). These are effectively modifications to the Guide. The purpose of TOBs is to streamline production and allow changes to accommodate a seller/servicer’s systems and processes. Loans are underwritten by the seller based upon the Guide or its individual TOB. All sellers represent and warrant that they originated loans in accordance with their negotiated terms. Examples of TOBs are streamlined documentation, estimated debt payment amounts (if not listed on a credit report) and income calculation using documented future income. Since the financial crisis, Freddie Mac has materially decreased the use of TOBs.
Prior to approving a TOB, Freddie Mac analyzes potential implications and impacts to performance including compliance with Consumer Financial Protection Bureau (CFPB) and Qualified Mortgage (QM) requirements. Freddie Mac periodically reviews seller contracts and TOBs to determine if changes to the TOBs are needed. An individual company’s performance is closely tracked and monitored. If performance is below expectations, the use of a TOB can be terminated.
Freddie Mac states that 98% of purchased loans are underwritten using an automated underwriting system (AUS). The Freddie Mac proprietary system is called Loan Prospector (LP). Through a TOB, Freddie Mac will allow a seller to use an AUS other than Freddie Mac’s system, which can be either the seller/servicer’s own system or Fannie Mae’s system, Desktop Underwriter (DU). Regardless of the original underwriting method all loans purchased by Freddie Mac are run through LP to rescore and confirm eligibility.
The top 10 seller/servicers provide approximately 64% of Freddie Mac’s single-family mortgage purchase volume. The largest two, Wells Fargo and JPMorgan Chase, accounted for 17% and 13%, respectively, of purchase volume and were the only seller/servicers that comprised 10% or more.
Quality Control
Freddie Mac has over 115 full-time employees in its quality control (QC) area. The QC process monitors data integrity, proper underwriting and required documentation through a statistical sampling of purchased loans. The goal is to find “ineligible” loans, which allows Freddie Mac to refine its credit policies and find repurchase loans and thus mitigate credit losses.

STACR 2014-DN2 Page | 23 March 31, 2014
The loan review process begins with a statistically relevant sample of performing loans; additional loans are selected based upon current supplemental issues. Freddie Mac also reviews a significant portion of loans that have defaulted within the first few years after purchase. The results of the QC review measure the accuracy of data and calculate ineligible rates, which are used to enforce R&Ws. Per Freddie Mac, the most prevalent errors consist of insufficient documentation, incorrect calculations and incorrect data entry. If errors are found, the loan can be put back to the seller through Freddie Mac’s repurchase process. Once presented with a buy back request, a seller has an opportunity to correct the errors. The appeal process is defined in the Guide.
The loans selected to be sampled are compared against the underwriting standards outlined in the Guide and applicable TOBs. Appraisals are given a desktop review and, if available, an underwriter will review the appraisal value against Freddie Mac’s automated valuation model, Home Value Explorer (HVE). Other aspects of the QC review include compliance with regulatory requirements pertaining to high-cost home loans and anti-predatory lending.
An independent quality assurance (QA) team performs a full review of the QC review process and loan decision on a percentage of the loans that went through the QC process. Decisions made by Freddie Mac underwriters and outside vendors are reviewed for accuracy and compliance. The goal is to provide internal feedback regarding the effectiveness, interpretation and enforcement of policies.
Freddie Mac performs onsite operational reviews of selected seller/servicers. During 2013, reviews of sellers and servicers covered approximately 74% of all production and 92% of all serviced loans. The larger national accounts are reviewed up to three times per year, while other national and large regional accounts are generally reviewed annually; other accounts are selected based upon a risk analysis and from business line referrals. A 38 person internal team performs reviews. The team also reviews vendors, custodians and insurance companies. New independent mortgage bank applicants are also reviewed with support currently from an external audit firm. The scope of the review is risk-based and customized based upon performance and business line input. The results of the review are summarized in an overall assessment of the seller/servicer operational capabilities. If significant findings are noted in the review, a remediation plan is required from the seller/servicer. Outstanding issues and action plans are monitored and reviewed with the business unit.
Servicing
Freddie Mac does not service the loans it purchases; all servicing is done by approved servicers. Freddie Mac details its servicing requirements through the Guide and individual TOBs. Examples of servicer TOBs include loan modifications that differ from defined standards, pilot programs and use of technology enhancements that provide non standardized reporting. Per Freddie Mac, there are approximately 1,400 servicers and over 10 million accounts. An internal team monitors accurate and timely reporting and cash management. Another team monitors loan performance and loss mitigation.
All servicers are required to report on every loan at least monthly; delinquent loans require additional metrics that include detailed loss mitigation activity. Failure to comply with required reporting or incorrect cash management results in compensatory fees.
A stated mission of Freddie Mac is to preserve homeownership. As such, loss mitigation techniques focus on alternatives to foreclosure. As detailed in the Guide, once a loan becomes delinquent servicers are required to actively work with a borrower and, based upon homeowner qualification, offer various workout plans. Specific plans include forbearance, repayment plans, loan modifications and government supported

STACR 2014-DN2 Page | 24 March 31, 2014
plans such as Home Affordable Refinance Program (HARP). If a homeowner does not qualify for a plan or fails in his or her performance, foreclosure will be pursued.
Freddie Mac has an extensive process of monitoring servicer compliance and performance. All servicers are given individual goals or plans. Additionally, all servicers are subject to on-site operational reviews and loan file reviews. Larger accounts have dedicated account teams. All servicers are measured and ranked monthly via a performance scorecard that tracks data metrics, measures performance versus peers and quantifies results of operational reviews. Based upon the scorecard analysis, the bottom 25% are given an additional review that may include a remediation plan or other direct oversight.

STACR 2014-DN2 Page | 25 March 31, 2014
KBRA Rating Process KBRA analyzed the transaction using the following RMBS methodology reports published on January 9, 2012:
• U.S. RMBS Rating Methodology • Residential Mortgage Default and Loss Model
KBRA’s RMBS methodology incorporates (1) its loan level default and loss model, (2) a review of key transaction participants, including aggregators/conduits, master servicers, originators and/or servicers as warranted, (3) the results of loan file reviews performed by independent third party firms and (4) a review of the legal structure and key documentation.
In applying the methodology, KBRA has evaluated the loan level information available on this transaction. KBRA will also review the operative agreements and legal opinions for the transaction. We applied our default and loss model to the loan data and reviewed the capital structure model, both provided by Credit Suisse.
Scenario/Sensitivity Analysis The ratings assigned to STACR 2014-DN2 will be monitored through the life of the transaction. If home prices exhibit a sustained trend (higher or lower) KBRA will consider making rating changes. We emphasize that home price changes alone are not sufficient to warrant a rating action. Clear evidence of the impact of such changes on the mortgage pool must also be observed. For example, if home prices are rising, in a generally good economic environment KBRA would expect there to be very low levels of mortgage delinquency, perhaps accompanied by high levels of voluntary prepayments, which would serve to de-lever the senior RMBS class. Given those conditions, the increase in borrower equity and structural protections may warrant upgrades. Conversely, KBRA would anticipate that large declines in home prices could occur in the context of an economic downturn and that as a result, the percentage of delinquent loans in the pool would rise noticeably.
The table below illustrates the potential for a KBRA downgrade of each rated class under a number of home price scenarios. ‘Stable’ means a downgrade is unlikely. ‘Moderate’ means a potential transition of up to one rating category is possible. ‘Severe’ indicates a multi-category downgrade is possible. In addition to providing insight into the risk of rating migration, the table also indicates which scenarios may cause particular classes to default. Any scenario that indicates ‘Default’ for a class means that KBRA’s cash flow projection indicated a principal write down under that scenario.
The basis for the potential migration actions indicated below is consideration of the degree to which a particular class could tolerate additional stress beyond the home price change indicated. For STACR 2014-DN2 the level of credit enhancement slightly exceeds the level strictly needed to survive the KBRA stress scenarios associated with each class rating. This is reflected in our view of the potential severity of rating actions under a given scenario.

STACR 2014-DN2 Page | 26 March 31, 2014
KBRA notes that rating changes could occur for a variety of reasons other than home price changes. For example, national or regional economic stress could impact borrowers’ ability to pay independent of a specific level of home price decline. Moreover, in considering home price changes, KBRA surveillance will be analyzing the speed of decline, the likelihood of recovery, and the degree of sensitivity particular mortgages are exhibiting. These factors will be incorporated into rating decisions, and discussed in rating action commentary.
Rating Surveillance KBRA views the assignment of an initial rating to an RMBS as the beginning of a process that generally continues until the payment in full or other redemption of the security. KBRA considers ongoing transaction surveillance as critical in order to preserve the accuracy and integrity of issued ratings, as well as a useful method for obtaining information on loan pool, servicer, and transaction performance that can be considered in connection with new rating analyses.
The KBRA RMBS surveillance process incorporates review of monthly remittance and performance data, monitoring of home prices and economic conditions and on-going dialogue with and evaluation of servicers. The KBRA RMBS surveillance process is further described in the RMBS Rating Methodology report.
Class and Initital RatingM-1 M-2
Home Price Change A(sf) BBB(sf)-5% Stable Stable-10% Stable Stable-20% Stable Moderate-30% Moderate Severe-40% Severe Default-50% Default Default

STACR 2014-DN2 Page | 27 March 31, 2014
Appendix A: Tear Sheet
Class Initial Certificate Balance ($)
Scheduled Final Maturity Coupon CE (%)
A-H126,880,367,090* April 2024 N/A 4.50
M-1 230,000,000 April 2024 1M Libor + [] 3.50
M-1F 230,000,000 April 2024 1M Libor + [] 3.50
M-1I 230,000,000 April 2024 [] 3.50M-1H1
51,469,812* April 2024 N/A 3.50
M-2 345,000,000 April 2024 1M Libor + [] 2.00
M-2F 345,000,000 April 2024 1M Libor + [] 2.00
M-2I 345,000,000 April 2024 [] 2.00M-2H1
77,204,718* April 2024 N/A 2.00
M-3 391,000,000 April 2024 1M Libor + [] 0.30
M-3F 391,000,000 April 2024 1M Libor + [] 0.30
M-3I 391,000,000 April 2024 [] 0.30M-3H1
87,498,681* April 2024 N/A 0.30
M-12 575,000,000 April 2024 WAC22.00
MA 966,000,000 April 2024 WAC20.30
B-H184,440,945* April 2024 N/A 0.00
Total 840,000,000 - - -
KBRA View(1)
+NNN++N
Capital Structure
1Reference Tranche; *Notional Amount2The Class M-12 Notes will bear interest at the WAC rate of the Class M-1 Notes and Class M-2 Notes, and the MA the WAC of the Class M-1, Class M-2, and Class M-3 Notes.
NR
NR
NR
-
NR
BBB(sf)
NR
NR
Geographical ConcentrationStructure
WA CLTV
Parties
Product TypeAverage Loan BalanceWA LTV
30 Yr Fixed: 100%$241,238.47
75.31%
Transaction Highlights
Underwriter
Freddie MacFreddie Mac
(1) '+' denotes a positive factor; '-' denotes a negative factor; 'N' is neutral
Initial KBRA Rating
NR
A(sf)
A(sf)
A(sf)
NR
BBB(sf)
BBB(sf)
BBB(sf)
76.39%760
CA: 20.9%; TX: 5.5%; IL: 5.2%Senior/subordinate; Sequential
WA FICO
NR
JPMCB: 19%; US Bank: 10%; BB&T: 6%JPMCB: 20%; US Bank: 10%; Nationstar: 7%
U.S. Bank N.A.Morgan Stanley
Seller/SponsorIssuerTop OriginatorsTop ServicersGlobal Agent and Exchange Administrator

STACR 2014-DN2 Page | 28 March 31, 2014
Appendix B: Eligibility Criteria Each mortgage loan in the Initial Cohort Pool must satisfy the following criteria:
a) is a fully amortizing, fixed-rate, one-to four-unit, first lien Mortgage Loan, which has an original term of 30 years;
b) was originated on or after April 1, 2013; c) was securitized into a mortgage Participation Certificate (“PC”) by December 31, 2013 and remained in such
PC as of March 4, 2014; d) has not been prepaid in full as of March 4, 2014; e) has not been repurchased by the applicable seller or servicer as of March 4, 2014; f) has no Underwriting Defects as of March 2, 2014; g) as of January 31, 2014, has never been reported to be 30 days or more delinquent since purchase by Freddie
Mac; h) was originated with documentation as described under “General Mortgage Loan Purchase and Servicing —
Underwriting Standards — Documentation” in Annex A of the offering memorandum; i) is not covered by mortgage or pool insurance; j) does not have an original loan-to-value ratio that (i) is less than or equal to 60%, or (ii) exceeds 80%; k) is not subject to recourse or other credit enhancement; l) was not originated under Freddie Mac’s Relief Refinance program (including the Home Affordable Refinance
Program (“HARP”) which is FHFA’s name for Relief Refinance Mortgage Loans with an LTV greater than 80%); m) was not originated under Home Possible® or other affordable mortgage programs of Freddie Mac; n) was not associated with a mortgage revenue bond purchased by Freddie Mac; o) had an original principal balance greater than or equal to $5,000; and p) was not originated under a government program (e.g., FHA, VA or Guaranteed Rural Housing loans).

STACR 2014-DN2 Page | 29 March 31, 2014
© Copyright 2014, Kroll Bond Rating Agency, Inc., and/or its licensors and affiliates (together, "KBRA”). All rights reserved. All information contained herein is proprietary to KBRA and is protected by copyright and other intellectual property law, and none of such information may be copied or otherwise reproduced, further transmitted, redistributed, repackaged or resold, in whole or in part, by any person, without KBRA’s prior express written consent. Ratings are licensed by KBRA under these conditions. Misappropriation or misuse of KBRA ratings may cause serious damage to KBRA for which money damages may not constitute a sufficient remedy; KBRA shall have the right to obtain an injunction or other equitable relief in addition to any other remedies. The statements contained in this report are based solely upon the opinions of KBRA and the data and information available to the authors at the time of publication of this report. All information contained herein is obtained by KBRA from sources believed by it to be accurate and reliable; however, KBRA ratings are provided “AS IS”. No warranty, express or implied, as to the accuracy, timeliness, completeness, merchantability, or fitness for any particular purpose of any rating or other opinion or information is given or made by KBRA. Under no circumstances shall KBRA have any liability resulting from the use of any such information, including without limitation, for any indirect, special, consequential, incidental or compensatory damages whatsoever (including without limitation, loss of profits, revenue or goodwill), even if KBRA is advised of the possibility of such damages. The credit ratings, if any, and analysis constituting part of the information contained herein are, and must be construed solely as, statements of opinion and not statements of fact or recommendations to purchase, sell or hold any securities. KBRA receives compensation for its rating activities from issuers, insurers, guarantors and/or underwriters of debt securities for assigning ratings and from subscribers to its website.