Fourth Quarter and Year-end Results Fourth Quarter and ... All figures in US$ million Gold ......
32
Fourth Quarter and Year-end Results Market Presentation 14 February 2013 Fourth Quarter and Year-end Results Period ending 31 December 2012 14 February 2013 Nick Holland Chief Executive Officer
Transcript of Fourth Quarter and Year-end Results Fourth Quarter and ... All figures in US$ million Gold ......

Fourth Quarter and Year-end Results
Market Presentation14 February 2013
Fourth Quarter and Year-end Results Period ending 31 December 201214 February 2013Nick HollandChief Executive Officer

Forward Looking Statements
Certain statements in this document constitute “forward looking statements” within the meaning of Section 27A of the US Securities Act of 1933
and Section 21E of the US Securities Exchange Act of 1934.
In particular, the forward looking statements in this document include among others those relating to the Damang Exploration Target Statement;
the Far Southeast Exploration Target Statement; commodity prices; demand for gold and other metals and minerals; interest rate expectations;
exploration and production costs; levels of expected production; Gold Fields’ growth pipeline; levels and expected benefits of current and
l d it l dit f t d th i li ti l l d th t t f t ffi i i d i t bplanned capital expenditures; future reserve, resource and other mineralisation levels; and the extent of cost efficiencies and savings to be
achieved. Such forward looking statements involve known and unknown risks, uncertainties and other important factors that could cause the
actual results, performance or achievements of the company to be materially different from the future results, performance or achievements
expressed or implied by such forward looking statements. Such risks, uncertainties and other important factors include among others: economic,
business and political conditions in South Africa, Ghana, Australia, Peru and elsewhere; the ability to achieve anticipated efficiencies and other
cost savings in connection with past and future acquisitions, exploration and development activities; decreases in the market price of gold and/or
copper; hazards associated with underground and surface gold mining; labour disruptions; availability terms and deployment of capital or credit;
changes in government regulations particularly taxation and environmental regulations; and new legislation affecting mining and mineral rights;changes in government regulations, particularly taxation and environmental regulations; and new legislation affecting mining and mineral rights;
changes in exchange rates; currency devaluations; the availability and cost of raw and finished materials; the cost of energy and water; inflation
and other macro-economic factors, industrial action, temporary stoppages of mines for safety and unplanned maintenance reasons; and the
impact of the AIDS and other occupational health risks experienced by Gold Fields’ employees.
These forward looking statements speak only as of the date of this document. Gold Fields undertakes no obligation to update publicly or release
any revisions to these forward looking statements to reflect events or circumstances after the date of this document or to reflect the occurrence
f ti i t d t
Gold Fields Limited | Q4 2012 & F2012 Results Market Presentation | 14 February 2013Page 2
of unanticipated events.

Overview

Q4 2012 Salient Features
• Attributable production of 754,000 gold equivalent ounces (811koz)
- KDC and Beatrix down 30% quarter on quarter due to strike- KDC and Beatrix down 30% quarter on quarter due to strike
- International operations up 11%
Strike impact mitigated through improved international performance- Strike impact mitigated through improved international performance
• Total cash cost US$946/oz (Q3 - US$916/oz)
Distorted by strike• NCE US$1,476/oz (Q3 - US$1,448/oz)
• NCE margin of 13% (Q3 - 13%)
y
• Operating profit R5.0bn (Q3 - R5.1bn)
• 2H 2012 Dividend of 75 SA cents per share• 2H 2012 Dividend of 75 SA cents per share
Strong International Performance Partially Offsets Strike Action in SA
Gold Fields Limited | Q4 2012 & F2012 Results Market Presentation | 14 February 2013Page 4

F2012 Salient Features
• Attributable production of 3.25 million gold 1 200
Earnings - SA cents per sharep g
equivalent ounces (F2011 - 3.49Moz)
T t l h t US$894/
973
778
1 003 939 1 000
1 200
• Total cash cost US$894/oz (F2011- US$795/oz)
• NCE US$1,376/oz (F2011 – US$1,173/oz)400
492
778
396
578 529 600
800
• Operating profit to R21.0bn (F2011 - R21.1bn)
• NCE margin of 17% (F2011 - 25%)
400
161
396
200
400
NCE margin of 17% (F2011 25%)
• Normalised earnings R6.8bn (F2011 - R7.2bn)
-2008 2009 2010 2011 2012
EPS Normalised EPS
Strong First Half, Challenging Second Half
Gold Fields Limited | Q4 2012 & F2012 Results Market Presentation | 14 February 2013Page 5

F2012 Achievements
• SA production stable in H1, disrupted by YaRona fire and strikes in H2
• Strikes at KDC and Beatrix well managed from a safety perspective
• South Deep physical infrastructure completed• South Deep physical infrastructure completed
• New “24/7/365” operating model at South Deep agreed and being implemented
• Conversion to owner mining completed at St Ives open pit operations
• GFI ranking on the Dow Jones Sustainability Index (DJSI) mining index improved to 3rd (2011: 4th)
• Portfolio review completed
Gold Fields Limited | Q4 2012 & F2012 Results Market Presentation | 14 February 2013
Page 6
Unbundling of Sibanye Gold

Proforma Results – new Gold Fields
Q4 2012 F2012
Attributable production koz 534 2,031
Cash costs US$/oz 793 784
NCE US$/oz 1,365 1,365
NCE i % 19 18NCE margin % 19 18
EBITDA US$ m 506 1,868
Mine capital expenditure US$ m 312 1,155
Project capital US$m 17 58
FSE expenditure US$m 16 65
Cash generated by international operations
US$m 177 276
Cash invested in South Deep US$m 43 167
Net cash generated by new Gold Fields mines
US$m 134 109
Gold Fields Limited | Q4 2012 & F2012 Results Market Presentation | 14 February 2013Page 7

Financial Strategy
Leverage the Balance Sheet
Financial Targets
Leverage the Balance SheetProforma
All figures in US$ millionGold
FieldsSibanye
Gold
Net Debt – 31 Dec 2012 1,263 443• Leverage balance sheet in particular,
the long end
• Strive for long-term Net Debt / EBITDA
,
EBITDA – C2012 1,868 694
Net Debt/EBITDA – 31 Dec 2012 0.68 0.64
C itt d tili d f iliti 700 207 Strive for long term Net Debt / EBITDA
ratio ≤1.0x
Liquidity and Funding PolicyDebt Maturity Post Unbundling
Committed unutilised facilities (Post unbundling) 700 207
Cash From Operations – C2012 962 480
• Maintain strong liquidity and improve
debt maturity profile800
1 000
1 200
on
y g
• Continue to diversify financing sources
away from bank funding
Balance Sheet720
1 000
200
400
600
$ m
illio
• Conservative debt maturity schedule40 40 - 50 - --
2013 2014 2015 2016 2017 2018 2019 2020
GFI (excl. Sibanye) Sibanye
Conservative Approach
Gold Fields Limited | Q4 2012 & F2012 Results Market Presentation | 14 February 2013Page 8

Financial Strategy
Commitment to return cash to shareholdersCommitment to return cash to shareholders
re 1003
38%33%
30%35%40%
1000
1200
Dividend (SA cps)F2008 to F2012
A ce
nts
per s
har
Pay-
out r
atio
396
578 529
1003939
22%26%
25%
10%15%20%25%30%
200
400
600
800
• Final dividend: R0.75 per share
F ll di id d R2 35 h
SA
150 130 140330 235
0%5%
0
200
2008 2009 2010 2011 2012
• Full-year dividend: R2.35 per share
• Annual pay-out ratio: 25%40%
50%
60%Dividends as a % of EPS
10%
20%
30%
40%
0%2007 2008 2009 2010 2011
Gold Fields Peer Average* Peer average pay-out ratio based on Bloomberg estimates of peer group on 13/02 2012
Conservative Approach
Gold Fields Limited | Q4 2012 & F2012 Results Market Presentation | 14 February 2013Page 9

The New Gold FieldsI ’ bIt’s not about ouncesIts about cash!

However we have not met their expectations
Investors expect us to deliver leverage to the gold price
However, we have not met their expectations…
Note: Data indexed to 13 January 2006; index made up of 8 major gold producers’ total return indexes weighted by market capitalisation; Major Gold producers defined as: AngloGold Ashanti, Barrick, Harmony, Kinross, Goldcorp, Gold Fields, Newmont and Newcrest
Source: Bloomberg
Gold Fields Limited | Q4 2012 & F2012 Results Market Presentation | 14 February 2013
Page 11
Regaining Investor Confidence Requires a Paradigm Shift
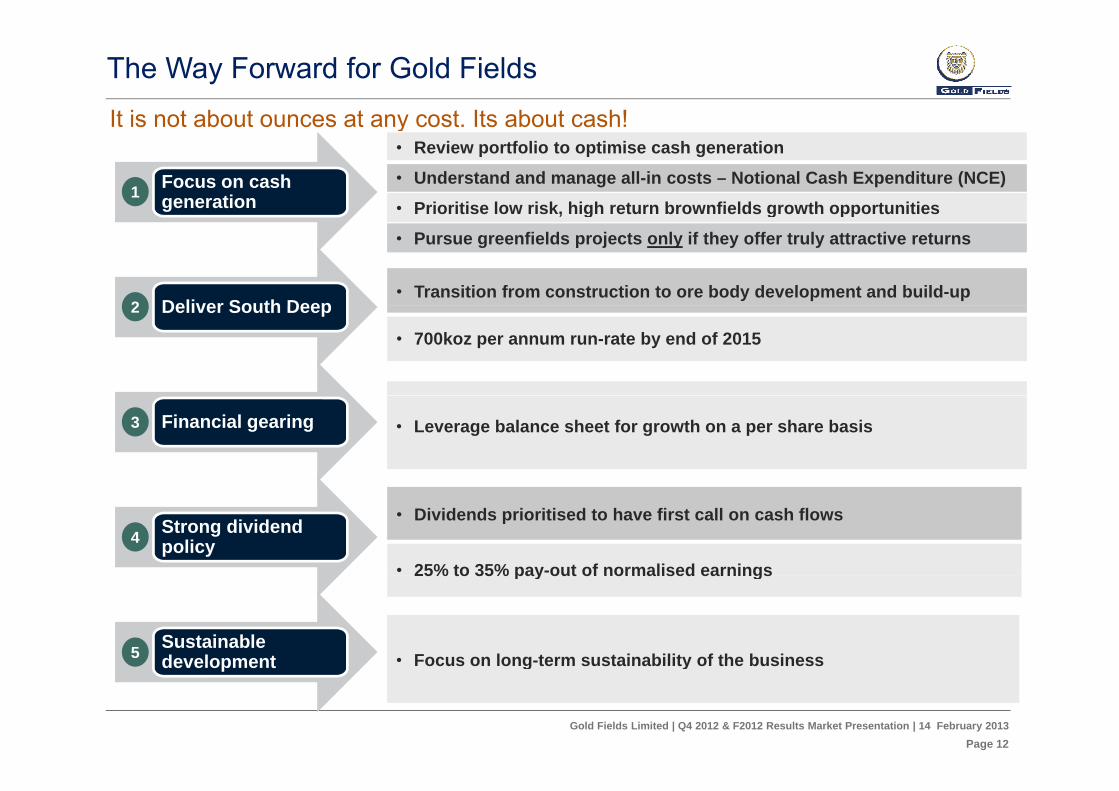
The Way Forward for Gold Fields
It is not about ounces at any cost. Its about cash!It is not about ounces at any cost. Its about cash!
Focus on cash generation
• Review portfolio to optimise cash generation
• Understand and manage all-in costs – Notional Cash Expenditure (NCE)
• Prioritise low risk, high return brownfields growth opportunities1
Deliver South Deep
, g g pp
• Pursue greenfields projects only if they offer truly attractive returns
2• Transition from construction to ore body development and build-up
Deliver South Deep2
• 700koz per annum run-rate by end of 2015
Financial gearing3 • Leverage balance sheet for growth on a per share basis
Strong dividend policy4
• Dividends prioritised to have first call on cash flows
• 25% to 35% pay-out of normalised earnings25% to 35% pay out of normalised earnings
Sustainable development5 • Focus on long-term sustainability of the business
Gold Fields Limited | Q4 2012 & F2012 Results Market Presentation | 14 February 2013Page 12
development Focus on long term sustainability of the business

Portfolio Review
Unbundling Sibanye GoldUnbundling Sibanye GoldShareholders
GFIMSAGold Fields
GFIMSAKDCBeatrix
InternationalTarkwaDamang
Limited
BeatrixService Entities
DamangSt IvesAgnewgCerro Corona South DeepOther subsidiaries and Investments
T I d d t C iGold Fields Limited | Q4 2012 & F2012 Results Market Presentation | 14 February 2013
Page 13
Two Independent Companies

Portfolio Review
Rationale for Unbundling Sibanye GoldRationale for Unbundling Sibanye Gold
Create fit-for-purpose, sustainable, long-life operations
Install a specialist, dedicated and focussed management team
Ring-fence SA cash flows for SA projects and dividends
R d li i d ti t dReverse declining production trends
Optimise extraction of reserves & resources and extend life of mines
Harness technology for challenges of deep level, hard rock, labour intensive miningg
Act as catalyst for consolidation in SA gold industry
A N F t F KDC d B t iGold Fields Limited | Q4 2012 & F2012 Results Market Presentation | 14 February 2013
Page 14
A New Future For KDC and Beatrix

International Diversification
A more balanced portfolioGold Fields
Before UnbundlingGold Fields
Post Unbundling
A more balanced portfolio
40%9%
17%28%24%
ctio
n ed
)13%
29%
8%26%
9%35%
13%
Prod
uc(m
anag 43%15%
C2012 C2016
RSA - Sibanye West AfricaAustralia South AmericaRSA – South Deep
22%
10%6%
erve
s2na
ged)
53%19%
4%6%
62%22%
Res
e(m
an
53%
18%
Gold Fields Limited | Q4 2012 & F2012 Results Market Presentation | 14 February 2013Page 15
1 Adjusts 2012 production for South Deep at full production of 700koz2 Reserves as at 31 December 2011 for New Gold Fields and as at 31 December 2012 for Sibanye Gold

Portfolio Review
GFI After Sibanye Gold UnbundlingGFI After Sibanye Gold UnbundlingFINLAND
Arctic Platinum Project
MALIYanfolila
GHANAPERU PHILIPPINES
Vancouver
Denver
GHANATarkwaDamang
PERUCerro CoronaChucapaca AUSTRALIA
AgnewSt Ives
Far Southeast
AccraLima
Manila
SOUTH AFRICASouth Deep
PerthJohannesburg
Santiago
South America West Africa South Africa Australasia Sub-total Projects Total
Offices Mines Exploration Projects: GFI 100% | CIR Option | JV GFI Operated
Resources1 8 Moz 25 Moz 81 Moz 9 Moz 123 Moz 32 Moz 155 MozReserves1 6 Moz 14 Moz 40 Moz 4 Moz 64 Moz - 64 MozAnnual production 342koz 885koz 270koz 626koz 2.1 Moz - 2.1 MozNumber of mines 1 2 1 2 6 - 6
Gold Fields Limited | Q4 2012 & F2012 Results Market Presentation | 14 February 2013Page 16
1. Managed gold equivalent Mineral Resources and Reserves as at 31 December 2011 2. The total managed gold equivalent Mineral Resources as at 31 December 2011 includes the managed gold equivalent ounces of the growth projects

Portfolio Review
U d t d d M All i C t (NCE)Understand and Manage All-in Costs (NCE)
1 6001 800
US$/oz
26%
New GFI Excluding South DeepNew GFI Including South Deep
1 6001 800
US$/oz
800 1 000 1 200 1 400 1 600 26%
NCEMargin
8001 000 1 200 1 400 1 600 19%
NCEMargin
-200 400 600
08 08 08 09 09 09 09 10 10 10 10 11 11 11 11 12 12 12 12
-200 400 600 800
8 8 8 9 9 9 9 0 0 0 0 1 1 1 1 2 2 2 2
Jun-
0S
ep-0
Dec
-0M
ar-0
Jun-
0S
ep-0
Dec
-0M
ar-1
Jun-
1S
ep-1
Dec
-1M
ar-1
Jun-
1S
ep-1
Dec
-1M
ar-1
Jun-
1S
ep-1
Dec
-1
Gold price Total cash costs NCE
Jun-
08S
ep-0
8D
ec-0
8M
ar-0
9Ju
n-09
Sep
-09
Dec
-09
Mar
-10
Jun-
10S
ep-1
0D
ec-1
0M
ar-1
1Ju
n-11
Sep
-11
Dec
-11
Mar
-12
Jun-
12S
ep-1
2D
ec-1
2
Gold price Total cash costs NCE
Gold Fields Limited | Q4 2012 & F2012 Results Market Presentation | 14 February 2013Page 17
Targeting a 25% NCE Margin

Portfolio Review
R i P tf li f C h G tiReview Portfolio for Cash Generation
Group • Corporate Office and Regional structures rationalisedGroup • Greenfields exploration spend cut to US$80 million p.a.
St Ives • Owner mining conversion completed St Ives • High cost heap leach operation closed
Agnew • Low grade Main and Rajah ore bodies stoppedF hi h d Ki b dAgnew • Focus on high grade Kim ore body
Tarkwa • High cost South Heap leach operation stoppedTarkwa High cost South Heap leach operation stopped
Damang • Focus to improve NCE margin to + 25%Pit t b k d d d ti l d
N M i l O !
g • Pit cut-back and underground options explored
Gold Fields Limited | Q4 2012 & F2012 Results Market Presentation | 14 February 2013Page 18
No Marginal Ounces!

Portfolio Review
P i iti L Ri k Hi h R t B fi ld G th O t itiPrioritise Low Risk, High Return Brownfields Growth Opportunities
Tarkwa Tarkwa Expansion Phase 6 (TEP6)
Damang Optimise extraction of 10Moz ore bodyDamang Optimise extraction of 10Moz ore body
Cerro Corona Sulphides Expansion ProjectOxides Project
L Ri k St t T G C h G ti M hiGold Fields Limited | Q4 2012 & F2012 Results Market Presentation | 14 February 2013
Page 19
Low Risk Strategy To Grow Cash Generation Machine

Portfolio Review
Pursue Greenfields Projects Only For Attractive ReturnsPursue Greenfields Projects Only For Attractive Returns
Construction Decision (+ve feasibility study)
Indicated and Inferred Resources (+ve pre-feasibility study)
FS
1
APPFar Southeast
Chucapaca
GFI Target Confirmed(+ve scoping study)
Resource Development
4 Far SoutheastDamangYanfolila
Talas
Economic Intersection(with requisite size potential)
Advanced Drilling
3 WoodjamSalares Norte
Bedrock Drill Target Defined(and available)
Initial Drilling
13
Target Definition8
Gold Fields Limited | Q4 2012 & F2012 Results Market Presentation | 14 February 2013Page 20
Greenfields Project Pipeline – December 2012

Portfolio Review
Pursue Greenfields Projects Only For Attractive ReturnsPursue Greenfields Projects Only For Attractive Returns
Peru Chucapaca Project • Start small if possible
• Advance only projects with attractive returns
• Enforce stringent stage gatesPhilippines Far Southeast Project
• Where appropriate de-risk through financial or technical partnerships
Finland Arctic Platinum Project
• It is not about ounces!Mali Yanfolila Project
N U li ti P d ti T tGold Fields Limited | Q4 2012 & F2012 Results Market Presentation | 14 February 2013
Page 21
No Unrealistic Production Targets
Operations Review

South Deep Project – South Africa
Managed ProductionKoz
60 70 80 90
gF2012 F2011
Managed production koz 270 273
EBITDA (operating profit) US$ m 148 131
1020 30 40 50 Contribution to New GFI EBITDA 8% 7%
Total cash cost US$/oz 1,105 1,073
NCE US$/oz 2 283 2 091-10
Mar
-10
Jun-
10
Sep-
10
Dec
-10
Mar
-11
Jun-
11
Sep-
11
Dec
-11
Mar
-12
Jun-
12
Sep-
12
Dec
-12
NCE US$/oz 2,283 2,091
Internal contribution to capital 52% 55%
Capex US$ m 315 275
2 500
3 000
Managing NCE$/ozResource – 31 Dec 2011 81.4Moz
Reserves – 31 Dec 2011 39.6Moz
1 000
1 500
2 000
2013 Guidance*
-
500
Mar
-10
un-1
0
Sep-
10
Dec
-10
Mar
-11
un-1
1
Sep-
11
Dec
-11
Mar
-12
un-1
2
Sep-
12
Dec
-12
2013 Guidance
• Managed production: 305 - 320koz
• Total cash cost: ~US$1,100/oz (~R317,000/kg)
• NCE: ~US$1,800/oz (~R520,000/kg)
Gold Fields Limited | Q4 2012 & F2012 Results Market Presentation | 14 February 2013Page 23
M J S D M J S D M J S D
Gold price Total cash costs NCE
NCE: US$1,800/oz ( R520,000/kg)
* Exchange rate used for guidance: US$1=R9.00

South Deep Project – South Africa
Deliver South Deep
Landmark Union Agreement on new Operating Model – 2 October 2012
Deliver South Deep
Production build-up to run-rate of 700koz by end of 2015
De-stress development increased 75% year on year.
Self-funding by end of 2013
Major progress on key infrastructure: on budget and on timeMajor progress on key infrastructure: on budget and on time
2010 2011 2012 2013E 2014E 2015E Status94 Level Refrigeration Plant On schedule
CommissionedPhase1 commissioned Commission machines 3, 4 and 5 with 100 and 105 Level BACs
Twin Vent Shaft Deepening CommissionedOct 2012
Tailings Storage Facility Commissioned April 2011
Plant Expansion 330 Ktpm Commissioned N 2012
Hoisting builds up as per mine plan
p p Nov 2012Backfill Infrastructure Commissioned
New Mine Development On-going
Backfill pipe extensions in the 95-1W, 95-2W and 95-3W
Gold Fields Limited | Q4 2012 & F2012 Results Market Presentation | 14 February 2013Page 24
Key Infrastructure Projects Completed – Transition to Build-up Underway

Tarkwa Gold Mine - Ghana
Managed ProductionKoz
150
200
250
gF2012 F2011
Managed production koz 719 717
EBITDA (operating profit) US$ m 729 752
50
100
150 Contribution to New GFI EBITDA 39% 38%
Total cash cost US$/oz 673 556
NCE US$/oz 1,049 913-
Mar
-10
Jun-
10
Sep-
10
Dec
-10
Mar
-11
Jun-
11
Sep-
11
Dec
-11
Mar
-12
Jun-
12
Sep-
12
Dec
-12
NCE US$/oz 1,049 913
NCE Margin 39% 42%
Resource – 31 Dec 2011 15.1Moz
1 400 1 600 1 800
Managing NCE$/ozReserves – 31 Dec 2011 10.3Moz
• Steady, world-class producer• High costs South Heap Leach Operations
600 800
1 000 1 200 stopped
• Brownfields expansion – CIL options to replace Heap Leach under consideration
-200 400
Mar
-10
un-1
0
Sep-
10
Dec
-10
Mar
-11
un-1
1
Sep-
11
Dec
-11
Mar
-12
un-1
2
Sep-
12
Dec
-12
2013 Guidance• Managed production: 640 - 650koz
• Total cash cost: ~US$785/oz
Gold Fields Limited | Q4 2012 & F2012 Results Market Presentation | 14 February 2013Page 25
M J S D M J S D M J S D
Gold price Total cash costs NCE• NCE: ~US$1,190/oz

Damang Gold Mine - Ghana
Managed ProductionKoz
50
60
70
gF2012 F2011
Managed production koz 166 218
EBITDA (operating profit) US$ m 125 201
10
20
30
40 Contribution to New GFI EBITDA 7% 10%
Total cash cost US$/oz 918 701
NCE US$/oz 1,630 1,056-
Mar
-10
Jun-
10
Sep-
10
Dec
-10
Mar
-11
Jun-
11
Sep-
11
Dec
-11
Mar
-12
Jun-
12
Sep-
12
Dec
-12
NCE $ 1,630 1,056
NCE Margin 2% 33%
Resource – 31 Dec 2011 10.0Moz
1 600 1 800 2 000
Managing NCE$/ozReserves – 31 Dec 2011 3.4Moz
• A mine in transition• Mine to be recapitalised to harness value of
600 800
1 000 1 200 1 400 10.0Moz resource position
• Recapitalisation planned to bring production to ~200 – 250koz at NCE of ~$1,200/oz
-200 400
ar-1
0
un-1
0
ep-1
0
ec-1
0
ar-1
1
un-1
1
ep-1
1
ec-1
1
ar-1
2
un-1
2
ep-1
2
ec-1
2
2013 Guidance• Managed production: 165 – 180koz
• Total cash cost: ~US$1,010/oz
Gold Fields Limited | Q4 2012 & F2012 Results Market Presentation | 14 February 2013Page 26
M Ju Se De M Ju Se De M J u Se De
Gold price Total cash costs NCE• NCE: ~US$1,650/oz

Cerro Corona Gold Mine - Peru
Managed Equivalent ProductionKoz
80
100
120
g qF2012 F2011
Managed production koz 342 383
EBITDA (operating profit) US$ m 396 403
20
40
60 Contribution to New GFI EBITDA 21% 20%
Total cash cost US$/oz 492 437
NCE US$/oz 775 592-
Mar
-10
Jun-
10
Sep-
10
Dec
-10
Mar
-11
Jun-
11
Sep-
11
Dec
-11
Mar
-12
Jun-
12
Sep-
12
Dec
-12
NCE $ 775 592
NCE Margin 51% 60%
Resource – 31 Dec 2011 7.7Moz
1 600 1 800 2 000
Managing NCE$/ozReserves – 31 Dec 2011 6.1Moz
• World class mine• Brownfields opportunities: Oxides Project and
600 800
1 000 1 200 1 400
pp jSulphide Plant expansion
• 5 year pay back achieved in 2013 with 18 years left to mine
-200 400
ar-1
0
un-1
0
ep-1
0
ec-1
0
ar-1
1
un-1
1
ep-1
1
ec-1
1
ar-1
2
un-1
2
ep-1
2
ec-1
2
2013 Guidance• Managed production: 270 - 280koz*
• Total cash cost: ~US$600/oz
Gold Fields Limited | Q4 2012 & F2012 Results Market Presentation | 14 February 2013Page 27
M Ju Se De M Ju Se De M J u Se De
Gold price Total cash costs NCE
* Stated on an equivalent ounce basis based on a gold price of US$1,700 per ounce and a copper price of US$8,000 per tonne
• NCE: ~US$920/oz

St Ives Gold Mine - Australia
Managed ProductionKoz
120
125
130
gF2012 F2011
Managed production koz 450 465
EBITDA (operating profit) US$ m 326 322
100
105
110
115 Contribution to New GFI EBITDA 17% 16%
Total cash cost US$/oz 931 901
NCE US$/oz 1,608 1,28795
Mar
-10
Jun-
10
Sep-
10
Dec
-10
Mar
-11
Jun-
11
Sep-
11
Dec
-11
Mar
-12
Jun-
12
Sep-
12
Dec
-12
NCE $ 1,608 1,287
NCE Margin 4% 19%
Resource – 31 Dec 2011 5.3Moz
1 600 1 800 2 000
Managing NCE$/ozReserves – 31 Dec 2011 2.8Moz
• Harnessing cost benefit of 2012 re-investment - Owner-mining from 2013
600 800
1 000 1 200 1 400 • High cost heap leach closed
• Promising new exploration targets identified: Invincible and Greater Neptune
-200 400
ar-1
0
un-1
0
ep-1
0
ec-1
0
ar-1
1
un-1
1
ep-1
1
ec-1
1
ar-1
2
un-1
2
ep-1
2
ec-1
2
2013 Guidance*
• Managed production: 380 - 400koz
• Total cash cost: ~US$970/oz (~A$930/oz)
Gold Fields Limited | Q4 2012 & F2012 Results Market Presentation | 14 February 2013Page 28
M Ju Se De M Ju Se De M J u Se De
Gold price Total cash costs NCE
* Exchange rate used for guidance: A$1 = US$1.04
• NCE: ~US$1,405/oz (~A$1,350/oz)

Agnew Gold Mine - Australia
Managed ProductionKoz
40
50
60
gF2012 F2011
Managed production koz 177 194
EBITDA (operating profit) US$ m 144 181
10
20
30 Contribution to New GFI EBITDA 8% 9%
Total cash cost US$/oz 827 696
NCE US$/oz 1,191 1,096-
Mar
-10
Jun-
10
Sep-
10
Dec
-10
Mar
-11
Jun-
11
Sep-
11
Dec
-11
Mar
-12
Jun-
12
Sep-
12
Dec
-12
NCE $ 1,191 1,096
NCE Margin 29% 32%
Resource – 31 Dec 2011 3.8Moz
1 600 1 800 2 000
Managing NCE$/ozReserves – 31 Dec 2011 1.3Moz
• Restructured for cash flow• High cost, low grade Main and Rajah closed
600 800
1 000 1 200 1 400
g g j• Focus on high-grade Kim Lode• Significant exploration opportunities
-200 400
ar-1
0
un-1
0
ep-1
0
ec-1
0
ar-1
1
un-1
1
ep-1
1
ec-1
1
ar-1
2
un-1
2
ep-1
2
ec-1
2
2013 Guidance*
• Managed production: 150 - 160koz
• Total cash cost: ~US$730/oz (A$700/oz)
NCE: US$1 035/oz (A$990/oz)
Gold Fields Limited | Q4 2012 & F2012 Results Market Presentation | 14 February 2013Page 29
M Ju Se De M Ju Se De M J u Se De
Gold price Total cash costs NCE
* Exchange rate used for guidance: A$1 = US$1.04
• NCE: ~US$1,035/oz (A$990/oz)

Conclusions

Group Guidance for 2013
Managed production koz 1,910 to 1,990
Attributable production koz 1,825 to 1,900
Cash cost US$860/oz (R250,000/kg)
NCE US$1,360/oz (R395,000/kg)
Exchange rates US$1=R9.00U$1 = A$0.962
Gold Fields Limited | Q4 2012 & F2012 Results Market Presentation | 14 February 2013Page 31

Conclusion
A smaller, more focussed, yet solid platform for growth
Focus on cash generation and a superior return on all funds investedFocus on cash generation and a superior return on all funds invested
Cash generation takes priority over production targetsCash generation takes priority over production targets
Dividends have first call on cash flows – 25% to 35% of normalised earningsDividends have first call on cash flows 25% to 35% of normalised earnings
Judiciously advance only low-risk, high return, brownfields and best greenfields j tprojects
Seek opportunistic M&A of in production assets where path to value is clearpp p p
Maintain current approach to focus on gold and continue international diversification
Gold Fields Limited | Q4 2012 & F2012 Results Market Presentation | 14 February 2013Page 32
pp g