Fourth Quarter and Full Year 2014 Operational Results and 2015 Guidance
83
Fourth Quarter and Full Year 2014 Operational Results and 2015 Guidance February 5, 2015
-
Upload
newgold2011 -
Category
Investor Relations
-
view
645 -
download
5
Transcript of Fourth Quarter and Full Year 2014 Operational Results and 2015 Guidance

Fourth Quarter and Full Year 2014
Operational Results and 2015 Guidance
February 5, 2015

2
Discussion topics
Company and gold market overview Randall Oliphant
2014 operational results and 2015 outlook David Schummer
Mineral reserves and resources update and 2015 exploration plan Mark Petersen
Projects overview and Blackwater/El Morro update Robert Gallagher
New Afton mill expansion and C-zone update Peter Marshall
Rainy River development Paul Hosford
Conclusion Randall Oliphant
Cautionary statements
3
CAUTIONARY NOTE REGARDING FORWARD-LOOKING STATEMENTS
Certain information contained in this presentation, including any information relating to New Gold’s future financial or operating performance are “forward looking”. All statements in this presentation,other than statements of historical fact, which address events, results, outcomes or developments that New Gold expects to occur are “forward-looking statements”. Forward-looking statements arestatements that are not historical facts and are generally, but not always, identified by the use of forward-looking terminology such as “plans”, “expects”, “is expected”, “budget”, “scheduled”,“targeted”, “estimates”, “forecasts”, “intends”, “anticipates”, “projects”, “potential”, “believes” or variations of such words and phrases or statements that certain actions, events or results “may”,“could”, “would”, “should”, “might” or “will be taken”, “occur” or “be achieved” or the negative connotation of such terms. Forward-looking statements in this presentation include, among others,statements with respect to: guidance for production, total cash costs and all-in sustaining costs (as well as the related margin), and the factors contributing to those expected results, as well asexpected capital expenditures; expected reductions in the carrying value of New Gold’s assets; mine life; mineral reserve and resource estimates; grades expected to be mined at the company’soperations; the expected production, costs, economics, grade and operating parameters of the Rainy River project; planned activities for 2015 and beyond at the company’s operations and projects,as well as planned exploration activities and expenses; the results of the C-zone study, including operating parameters and expected mine life, production, costs and project economics; plans toadvance the C-zone project, including permitting requirements, impact on the historic Teck tailings facility, capital expenditures and potential timelines; expected production and costs for theBlackwater project; targeted timing for commissioning and full production (and other activities) related to the New Afton mill expansion and Rainy River and the sequencing of Blackwater; and cashflow expected from Cerro San Pedro to the end of the residual leach period relative to expected closure costs.
All forward-looking statements in this presentation are based on the opinions and estimates of management as of the date such statements are made and are subject to important risk factors anduncertainties, many of which are beyond New Gold’s ability to control or predict. Certain material assumptions regarding such forward-looking statements are discussed in this presentation, NewGold’s annual and quarterly management’s discussion and analysis (“MD&A”), its Annual Information Form and its Technical Reports filed at www.sedar.com. In addition to, and subject to, suchassumptions discussed in more detail elsewhere, the forward-looking statements in this presentation are also subject to the following assumptions: (1) there being no significant disruptions affectingNew Gold’s operations; (2) political and legal developments in jurisdictions where New Gold operates, or may in the future operate, being consistent with New Gold’s current expectations; (3) theaccuracy of New Gold’s current mineral reserve and resource estimates; (4) the exchange rate between the Canadian dollar, Australian dollar, Mexican peso and U.S. dollar being approximatelyconsistent with current levels; (5) prices for diesel, natural gas, fuel oil, electricity and other key supplies being approximately consistent with current levels; (6) equipment, labour and materials costsincreasing on a basis consistent with New Gold’s current expectations; (7) arrangements with First Nations and other Aboriginal groups in respect of Rainy River and Blackwater being consistentwith New Gold’s current expectations; (8) all required permits, licenses and authorizations being obtained from the relevant governments and other relevant stakeholders within the expectedtimelines; (9) the results of the feasibility studies for the Rainy River and Blackwater projects being realized; and (10) in the case of production, cost and expenditure outlooks at operating mines for2016 and 2017, additionally, commodity prices and exchange rates being consistent with those estimated for purposes of 2015 guidance.
Forward-looking statements are necessarily based on estimates and assumptions that are inherently subject to known and unknown risks, uncertainties and other factors that may cause actualresults, level of activity, performance or achievements to be materially different from those expressed or implied by such forward-looking statements. Such factors include, without limitation:significant capital requirements and the availability and management of capital resources; additional funding requirements; price volatility in the spot and forward markets for metals and othercommodities; fluctuations in the international currency markets and in the rates of exchange of the currencies of Canada, the United States, Australia, Mexico and Chile; discrepancies betweenactual and estimated production, between actual and estimated reserves and resources and between actual and estimated metallurgical recoveries; changes in national and local governmentlegislation in Canada, the United States, Australia, Mexico and Chile or any other country in which New Gold currently or may in the future carry on business; taxation; controls, regulations andpolitical or economic developments in the countries in which New Gold does or may carry on business; the speculative nature of mineral exploration and development, including the risks of obtainingand maintaining the validity and enforceability of the necessary licenses and permits and complying with the permitting requirements of each jurisdiction in which New Gold operates, including, butnot limited to: in Canada, obtaining the necessary permits for the Rainy River and Blackwater projects; in Mexico, where Cerro San Pedro has a history of ongoing legal challenges related to ourenvironmental authorization (EIS); and in Chile, where certain activities at El Morro have been delayed due to litigation relating to its environmental permit; the lack of certainty with respect to foreignlegal systems, which may not be immune from the influence of political pressure, corruption or other factors that are inconsistent with the rule of law; the uncertainties inherent to current and futurelegal challenges New Gold is or may become a party to; diminishing quantities or grades of reserves and resources; competition; loss of key employees; rising costs of labour, supplies, fuel andequipment; actual results of current exploration or reclamation activities; uncertainties inherent to mining economic studies including the feasibility studies for Rainy River and Blackwater and the C-zone study; the uncertainty with respect to prevailing market conditions necessary for a positive development decision at Blackwater; changes in project parameters as plans continue to be refined;accidents; labour disputes; defective title to mineral claims or property or contests over claims to mineral properties; unexpected delays and costs inherent to consulting and accommodating rights ofFirst Nations and other Aboriginal groups; uncertainties with respect to obtaining all necessary surface and other land use rights or tenure for Rainy River; risks, uncertainties and unanticipateddelays associated with obtaining and maintaining necessary licenses, permits and authorizations and complying with permitting requirements, including those associated with the environmentalassessment process for Blackwater. In addition, there are risks and hazards associated with the business of mineral exploration, development and mining, including environmental events andhazards, industrial accidents, unusual or unexpected formations, pressures, cave-ins, flooding and gold bullion losses (and the risk of inadequate insurance or inability to obtain insurance to coverthese risks) as well as “Risk Factors” included in New Gold’s disclosure documents filed on and available at www.sedar.com.
Forward-looking statements are not guarantees of future performance, and actual results and future events could materially differ from those anticipated in such statements. All of the forward-looking statements contained in this presentation are qualified by these cautionary statements. New Gold expressly disclaims any intention or obligation to update or revise any forward-lookingstatements whether as a result of new information, events or otherwise, except in accordance with applicable securities laws.
The footnotes, endnotes and appendices to this presentation contain important information. The endnotes and appendices are found at the end of the presentation.
ALL AMOUNTS IN U.S. DOLLARS UNLESS OTHERWISE STATED

Portfolio of assets
in top-ratedjurisdictions
Invested and experienced
team
Amonglowest-cost
producers with established track record
Peer-leading growth pipeline
A history of value creation
New Gold investment thesis
4
17.6 Moz gold
reserves(1)
>$75 million
investment by
Board and
Management
2014 delivered
record-low costs
~8% production
growth in 2015
130% increase
in share price
since March 2009
1. For a detailed breakdown of mineral resources and reserves by category and the key assumptions and parameters, refer to Appendix 1. This information can also be found in New Gold’s news release dated February 4, 2015. Refer to Endnotes under
the heading “Cautionary note to U.S. readers concerning estimates of mineral reserves and mineral resources” and “Technical Information”.
2. Refer to Endnote on all-in sustaining costs under the heading “Non-GAAP Measures”.
3. Based on ~325Koz annual production from Rainy River (first nine years) and ~485Koz annual production from Blackwater (first nine years), as outlined in the feasibility studies for the projects. Excludes 30% share of El Morro production.
>70% of gold
reserves located
in Canada
~1 million shares
purchased by
insiders in 2014
2015E all-in
sustaining costs(2)
of ~$765/oz
~800 Koz annual
production
potential from
growth projects(3)

5
Highlights
2014 Gold Production 2014 Copper/Silver Production 2014 Costs
Balance Sheet New Afton Rainy River
1. Refer to Endnote on total cash costs under the heading “Non-GAAP Measures”.
2. Refer to Endnote on all-in sustaining costs under the heading “Non-GAAP Measures”.
3. For a detailed breakdown of mineral resources and reserves by category and the key assumptions and parameters, refer to Appendix 1. Refer to Endnotes under the heading “Cautionary note to U.S. readers concerning estimates of mineral reserves
and mineral resources” and “Technical Information”.
380thousand oz $312per oz
Total cash costs(1)
$779per oz
All-in sustaining costs(2)
$371million
2014 year-end cash balance
Received Federal and
Provincial Environmental
Assessment approvals in
early 2015
Advanced engineering,
permitting and exploration
Completed C-zone
scoping study in early 2015
Mill expansion remains
on schedule for mid-2015
commissioning
+51%C-zone gold M&I resource(3)
Additional financial
flexibility with $300
million credit facility
102million lbs
Copper
1.45million oz
Silver
ACHIEVED PRODUCTION AND BEAT COST GUIDANCE

6
Experienced and invested team
BOARD OF DIRECTORS
David Emerson Former Canadian Cabinet Minister
James Estey Chairman, PrairieSky Royalty
Robert Gallagher President & Chief Executive Officer
Vahan Kololian Founder, TerraNova Partners
Martyn Konig Former Executive Chairman, European Goldfields
Pierre Lassonde Chairman, Franco-Nevada
Randall Oliphant Executive Chairman
Raymond Threlkeld Chairman, Newmarket Gold
EXECUTIVE MANAGEMENT TEAM
Randall OliphantExecutive Chairman
Robert Gallagher
President & Chief Executive Officer
Brian Penny
Executive Vice President &
Chief Financial Officer
David Schummer
Executive Vice President &
Chief Operating Officer
Hannes Portmann
Vice President Corporate Development
Approximately 1 million shares purchased by insiders in 2014
>$75 million collectively invested in New Gold
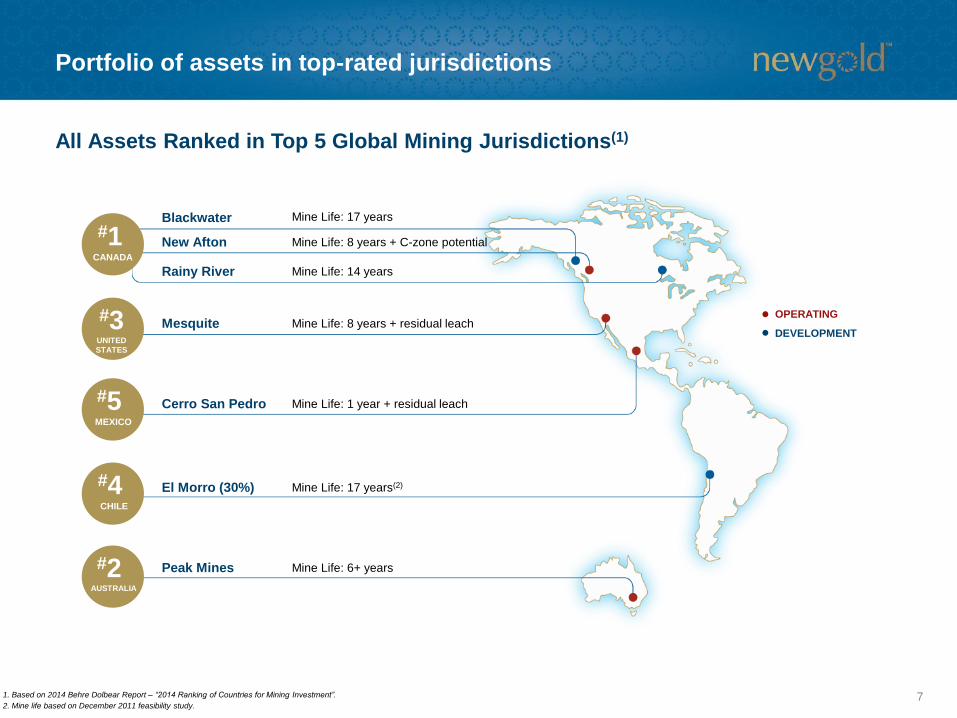
Portfolio of assets in top-rated jurisdictions
Blackwater
New Afton
Rainy River
Mesquite
Cerro San Pedro
El Morro (30%)
Peak Mines
Mine Life: 17 years
Mine Life: 8 years + C-zone potential
Mine Life: 14 years
Mine Life: 8 years + residual leach
Mine Life: 1 year + residual leach
Mine Life: 17 years(2)
Mine Life: 6+ years
#1CANADA
#3UNITED
STATES
#5MEXICO
#4CHILE
#2AUSTRALIA
OPERATING
DEVELOPMENT
7
All Assets Ranked in Top 5 Global Mining Jurisdictions(1)
1. Based on 2014 Behre Dolbear Report – “2014 Ranking of Countries for Mining Investment”.
2. Mine life based on December 2011 feasibility study.

$414$312
$845$779
$774
$944
8
• 2014 costs were the lowest in
the company’s history
• Continue to generate robust
margins in current commodity
price environment
• Free cash flow from four
operations being reinvested into
the business
Low costs drive robust margins
2014 FOURTH QUARTER AND FULL YEAR
Total cash costs(1) ($/oz) All-in sustaining costs(2) ($/oz)
Total cash cost margin(3) ($/oz)
1. Refer to Endnote on total cash costs under the heading “Non-GAAP Measures”.
2. Refer to Endnote on all-in sustaining costs under the heading “Non-GAAP Measures”.
3. Refer to Endnote on margin under the heading “Non-GAAP Measures”. Margin per ounce is equal to realized gold price per ounce during the period less costs (being cash costs or all-in sustaining costs, as the case may be) per ounce.
$343$477
All-in sustaining cost
margin(3) ($/oz)
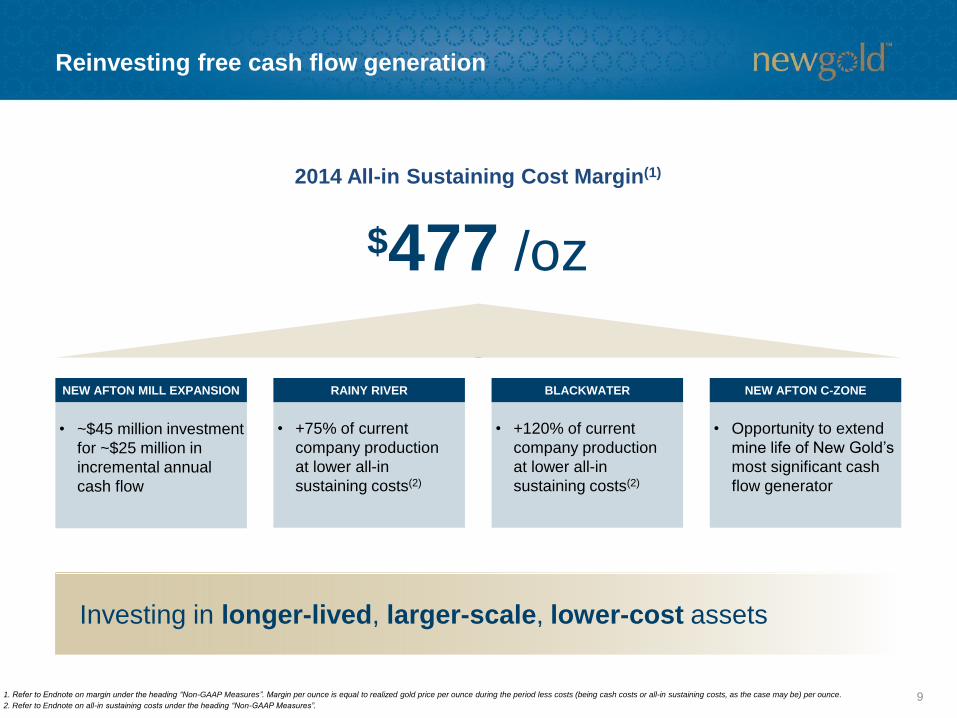
Reinvesting free cash flow generation
91. Refer to Endnote on margin under the heading “Non-GAAP Measures”. Margin per ounce is equal to realized gold price per ounce during the period less costs (being cash costs or all-in sustaining costs, as the case may be) per ounce.
2. Refer to Endnote on all-in sustaining costs under the heading “Non-GAAP Measures”.
2014 All-in Sustaining Cost Margin(1)
• ~$45 million investment
for ~$25 million in
incremental annual
cash flow
NEW AFTON MILL EXPANSION
• +75% of current
company production
at lower all-in
sustaining costs(2)
RAINY RIVER
• +120% of current
company production
at lower all-in
sustaining costs(2)
BLACKWATER
• Opportunity to extend
mine life of New Gold’s
most significant cash
flow generator
NEW AFTON C-ZONE
Investing in longer-lived, larger-scale, lower-cost assets
$477 /oz
10
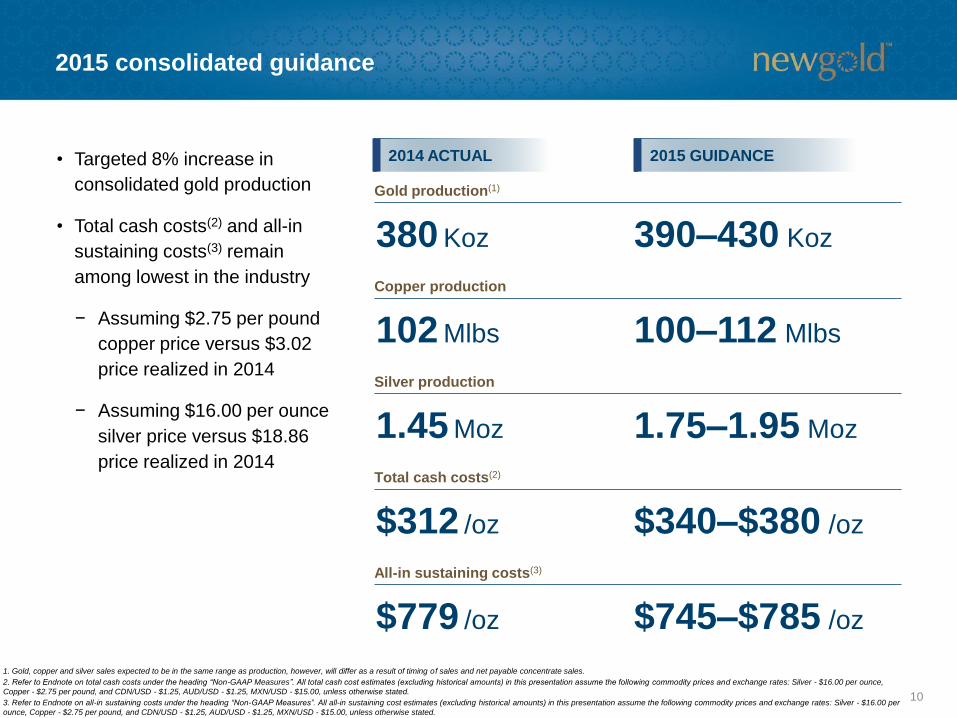
• Targeted 8% increase in
consolidated gold production
• Total cash costs(2) and all-in
sustaining costs(3) remain
among lowest in the industry
− Assuming $2.75 per pound
copper price versus $3.02
price realized in 2014
− Assuming $16.00 per ounce
silver price versus $18.86
price realized in 2014
2015 consolidated guidance
2014 ACTUAL
380 Koz
2015 GUIDANCE
Gold production(1)
390–430 Koz
$312 /oz
Total cash costs(2)
$340–$380 /oz
$779 /oz
All-in sustaining costs(3)
$745–$785 /oz
1. Gold, copper and silver sales expected to be in the same range as production, however, will differ as a result of timing of sales and net payable concentrate sales.
2. Refer to Endnote on total cash costs under the heading “Non-GAAP Measures”. All total cash cost estimates (excluding historical amounts) in this presentation assume the following commodity prices and exchange rates: Silver - $16.00 per ounce,
Copper - $2.75 per pound, and CDN/USD - $1.25, AUD/USD - $1.25, MXN/USD - $15.00, unless otherwise stated.
3. Refer to Endnote on all-in sustaining costs under the heading “Non-GAAP Measures”. All all-in sustaining cost estimates (excluding historical amounts) in this presentation assume the following commodity prices and exchange rates: Silver - $16.00 per
ounce, Copper - $2.75 per pound, and CDN/USD - $1.25, AUD/USD - $1.25, MXN/USD - $15.00, unless otherwise stated.
102 Mlbs
Copper production
100–112 Mlbs
1.45 Moz
Silver production
1.75–1.95 Moz
11
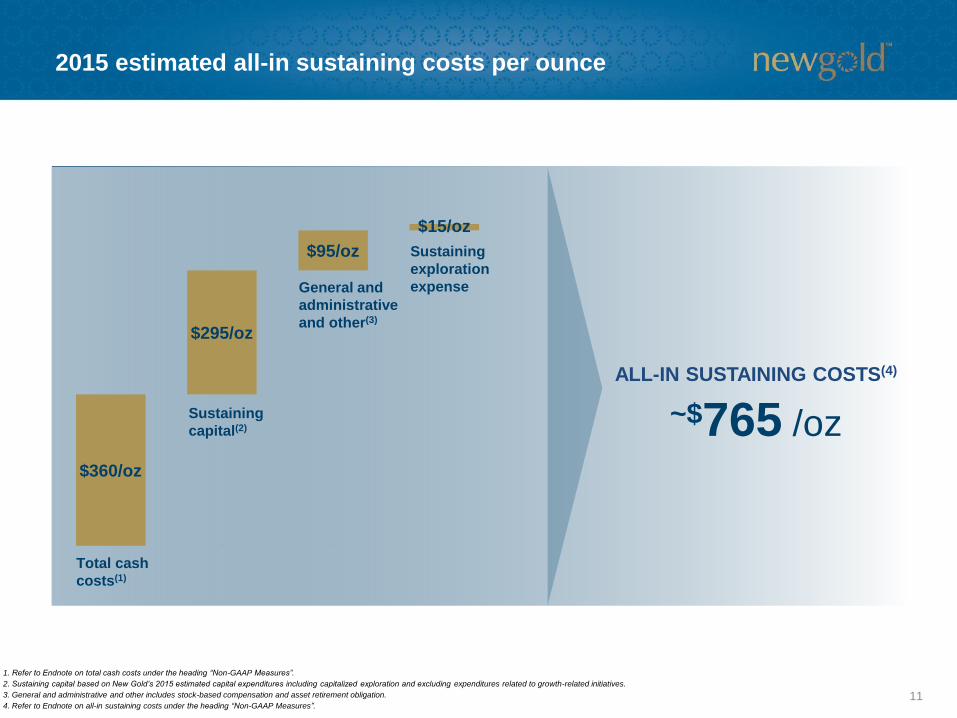
2015 estimated all-in sustaining costs per ounce
$360/oz
$295/oz
$95/oz
$15/oz
Total cash
costs(1)
Sustaining
capital(2)
General and
administrative
and other(3)
Sustaining
exploration
expense
1. Refer to Endnote on total cash costs under the heading “Non-GAAP Measures”.
2. Sustaining capital based on New Gold’s 2015 estimated capital expenditures including capitalized exploration and excluding expenditures related to growth-related initiatives.
3. General and administrative and other includes stock-based compensation and asset retirement obligation.
4. Refer to Endnote on all-in sustaining costs under the heading “Non-GAAP Measures”.
ALL-IN SUSTAINING COSTS(4)
~$765 /oz

12
Strong balance sheet
1. Cash and equivalents as at December 31, 2014.
2. $54 million of $300 million facility used for Letters of Credit at January 31, 2015.
3. Refer to Endnote on margin under the heading “Non-GAAP Measures”. Margin per ounce is equal to spot gold price of $1,270 per ounce less 2015 estimated all-in sustaining costs per ounce.
$617million
LIQUIDITY POSITION
$246 million
UNDRAWN
CREDIT
FACILITY(2)
CASH AND
EQUIVALENTS(1)
$371 million
No debt due until 2020
2015E ALL-IN SUSTAINING
COST MARGIN(3)
$505 /oz
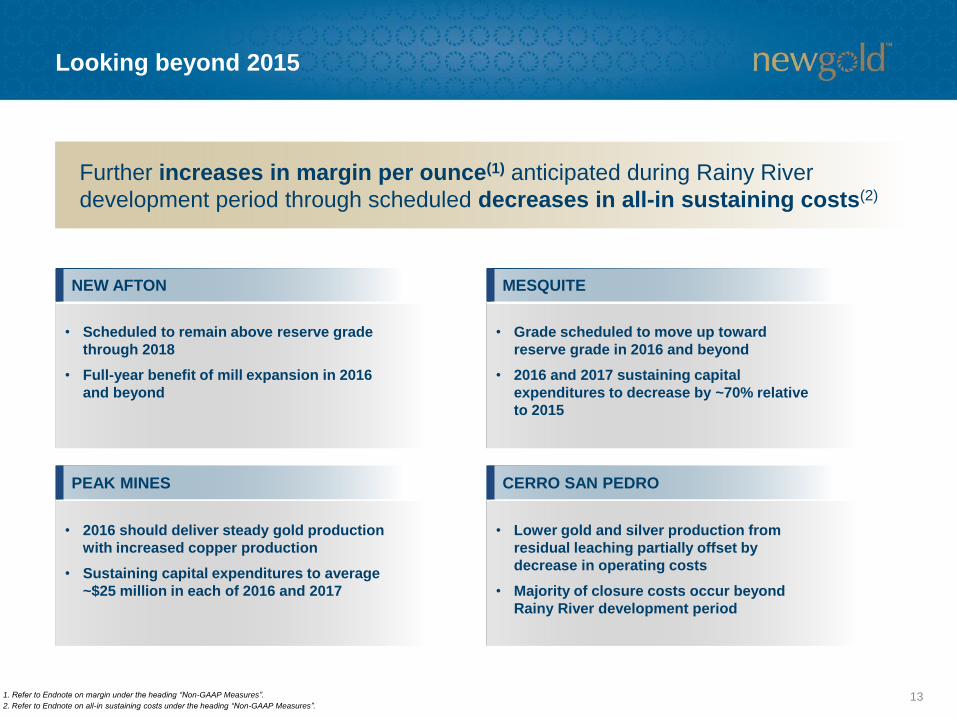
CERRO SAN PEDROPEAK MINES
Looking beyond 2015
13
• Scheduled to remain above reserve grade
through 2018
• Full-year benefit of mill expansion in 2016
and beyond
NEW AFTON MESQUITE
1. Refer to Endnote on margin under the heading “Non-GAAP Measures”.
2. Refer to Endnote on all-in sustaining costs under the heading “Non-GAAP Measures”.
• 2016 should deliver steady gold production
with increased copper production
• Sustaining capital expenditures to average
~$25 million in each of 2016 and 2017
• Grade scheduled to move up toward
reserve grade in 2016 and beyond
• 2016 and 2017 sustaining capital
expenditures to decrease by ~70% relative
to 2015
• Lower gold and silver production from
residual leaching partially offset by
decrease in operating costs
• Majority of closure costs occur beyond
Rainy River development period
Further increases in margin per ounce(1) anticipated during Rainy River
development period through scheduled decreases in all-in sustaining costs(2)

Rainy River project development considerations
14
CURRENT PLAN(2)2014 FEASIBILITY ESTIMATE(1)
Start-up / commissioning
Development capital estimate
2015 capital spend estimate
Late-2016
$885million
Mid-2017
$808million
• The Rainy River project
continues to maintain
the flexibility to further
extend or accelerate
construction as market
conditions evolve
Project construction extended by six months to enhance financial flexibility
1. Feasibility estimate based on $1.05 CDN/USD foreign exchange rate.
2. Current plan based on $1.25 CDN/USD foreign exchange rate.
3. Refer to Endnote on all-in sustaining costs under the heading “Non-GAAP Measures”. First nine years.
• $69 million spent in 2014
Remaining
All-in sustaining costs(3)
$736 /oz $658 /oz
$418million $300million

15
Rainy River overview
1. Refer to Endnote on all-in sustaining costs under the heading “Non-GAAP Measures”. First nine years.
• $0.05 change in exchange rate
equals ~$100 million change in
after-tax NAV and 2.0% change
in IRR
• $100 per ounce change in gold
price equals ~$180 million
change in after-tax NAV and
3.0% change in IRR
Average Mill
Head Grade (g/t)
Underground Grade (g/t)
Open Pit Grade (g/t)
0
50
100
150
200
250
300
350
2017 2018 2019 2020 2021
Open Pit Underground
1.5 1.5 1.5 1.5 1.5
Th
ou
san
d o
un
ces
1.5
--
1.5
--
1.4
4.5
1.4
4.8
1.3
5.3
PROJECT ECONOMICS GRADE, PRODUCTION AND COST PROFILES
$658 /oz
ALL-IN SUSTAINING COSTS(1)
Gold Price ($/oz)
Silver Price ($/oz)
CDN/USD ($)
$1,300
$16.00
$1.25
After-tax
5% NPV ($mm) $484
IRR (%) 13.7
Payback (years) 5.2

Multiple growth initiatives(1)
161. Based on ~325Koz annual production from Rainy River (first nine years) and ~485Koz annual production from Blackwater (first nine years) as outlined in the feasibility studies for the projects.
Construction
• New Afton mill expansion
• Rainy River – 325 Koz of
annual production
Permitting
• Blackwater – 485 Koz of
annual production
Engineering/Planning
• New Afton C-zone
• 30% carried interest in
El Morro
New Gold has multiple organic growth options in its portfolio
2015E GOLD
PRODUCTION
BLACKWATER
RAINY RIVER
NEW AFTON
EXPANSION
390-430 Koz
A history of value creation
17
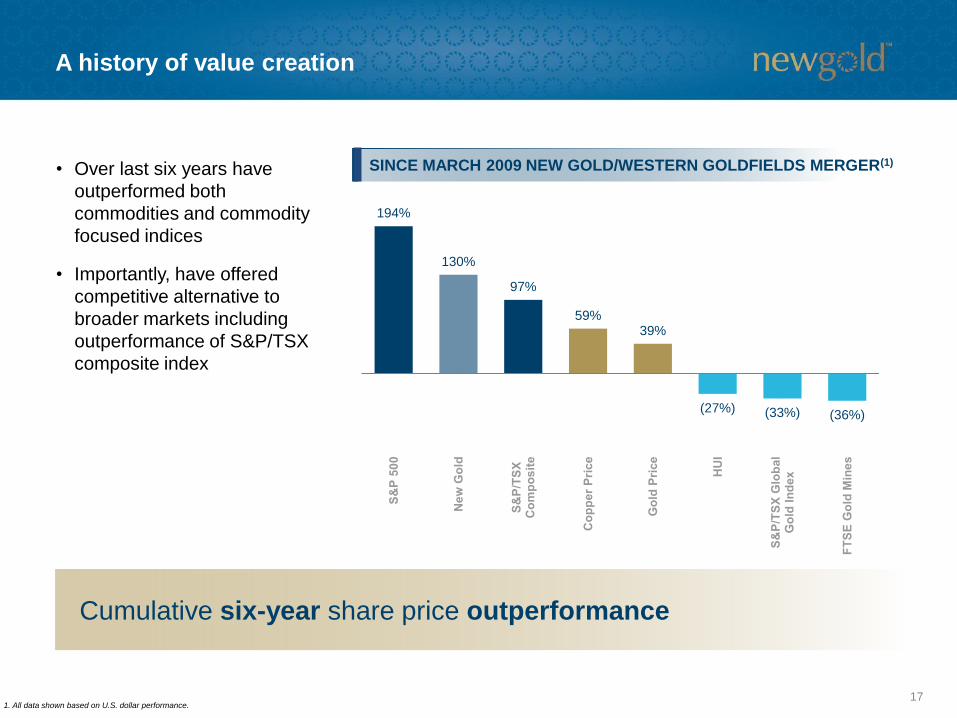
SINCE MARCH 2009 NEW GOLD/WESTERN GOLDFIELDS MERGER(1)
194%
130%
97%
59%39%
(27%) (33%) (36%)
Cumulative six-year share price outperformance
• Over last six years have
outperformed both
commodities and commodity
focused indices
• Importantly, have offered
competitive alternative to
broader markets including
outperformance of S&P/TSX
composite index
1. All data shown based on U.S. dollar performance.

Gold market outlook
18
WHAT IS CURRENTLY DRIVING GOLD?
INVESTMENT DEMAND
JEWELLERY DEMAND
CENTRAL BANK BUYING

2014 operational results
19

Health, safety and corporate social responsibility
20
2014 HIGHLIGHTS
• Awarded top safety culture in Canada
• Received E.A. Scholz Award for excellence
in mine development at Canadian operations
by Association for Mineral Exploration
British Columbia
• Cerro San Pedro >2 million hours without a lost
time incident; Rainy River and Blackwater full
year without a lost time incident
• New Afton achieved Work Safe British Columbia
Certificate of Recognition for the second year in
a row
2.5
3.4
2013/2014 Regional Average(1)
Total Reportable Injury Frequency Rate2015 OBJECTIVES
• Complete environmental assessment process
and First Nations agreements for Blackwater
• Continue to measure implementation of New
Gold Environmental as well as Community
Engagement and Development Management
Standards across all operations
• Continue engagement and preparation activities
with host communities in anticipation of first
phase of closure of Cerro San Pedro mine
1. Average of all the regulatory jurisdictions in which New Gold’s sites operate.

2014 consolidated operational results
21
GOLD PRODUCTION (Koz)
380Achieved guidance
SILVER PRODUCTION (Moz)
1.45Achieved guidance
COPPER PRODUCTION (Mlbs)
102Exceeded guidance
TOTAL CASH COSTS(1) ($/oz)
$312Lower than guidance
ALL-IN SUSTAINING
COSTS(2) ($/oz)
$779Lower than guidance
1. Refer to Endnote on total cash costs under the heading “Non-GAAP Measures”.
2. Refer to Endnote on all-in sustaining costs under the heading “Non-GAAP Measures”.
2014 operational scorecard
22
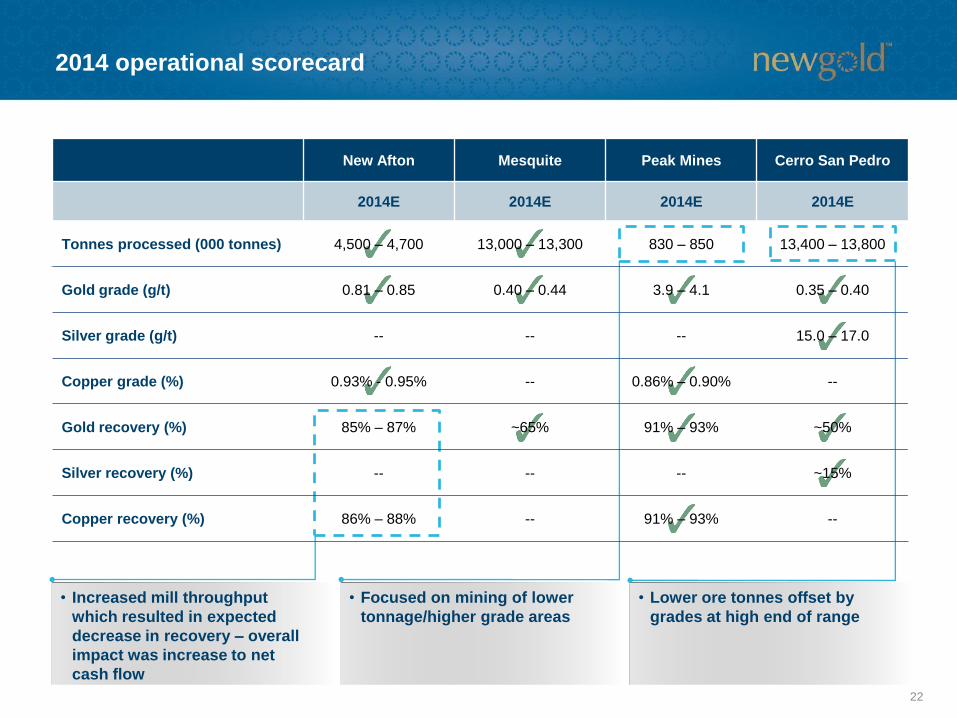
• Lower ore tonnes offset by
grades at high end of range
• Focused on mining of lower
tonnage/higher grade areas
• Increased mill throughput
which resulted in expected
decrease in recovery – overall
impact was increase to net
cash flow
New Afton Mesquite Peak Mines Cerro San Pedro
2014E 2014E 2014E 2014E
Tonnes processed (000 tonnes) 4,500 – 4,700 13,000 – 13,300 830 – 850 13,400 – 13,800
Gold grade (g/t) 0.81 – 0.85 0.40 – 0.44 3.9 – 4.1 0.35 – 0.40
Silver grade (g/t) -- -- -- 15.0 – 17.0
Copper grade (%) 0.93% - 0.95% -- 0.86% – 0.90% --
Gold recovery (%) 85% – 87% ~65% 91% – 93% ~50%
Silver recovery (%) -- -- -- ~15%
Copper recovery (%) 86% – 88% -- 91% – 93% --

New Afton 25 (1,199) (560) 105 (1,248) (650)
Mesquite 36 852 1,090 107 909 1,266
Peak Mines 22 707 1,231 99 658 1,025
Cerro San Pedro 23 1,413 1,447 70 1,251 1,354
Consolidated(3) 106 414 845 380 312 779
New Afton co-product costs(1)
Gold ($/oz) 395 603 409 610
Copper ($/lb) 1.00 1.52 0.99 1.48
2014 mine-by-mine operating results
23
1. Refer to Endnote on total cash costs under the heading “Non-GAAP Measures”.
2. Refer to Endnote on all-in sustaining costs under the heading “Non-GAAP Measures”.
3. Consolidated all-in sustaining costs includes corporate general and administrative expenses.
4. Figures may not add due to rounding.
2014 FOURTH QUARTER
Gold production
(000s ounces)
Cash costs(1)
($/oz)
All-in sustaining
costs(2) ($/oz)
2014 FULL YEAR
Gold production
(000s ounces)
Cash costs(1)
($/oz)
All-in sustaining
costs(2) ($/oz)
NEW AFTON
2014 FOURTH QUARTER
Co-product
cash costs(1)
Co-product all-in
sustaining costs(2)
NEW AFTON
2014 FULL YEAR
Co-product
cash costs(1)
Co-product all-in
sustaining costs(2)

2015 outlook
24

2015 consolidated guidance
25
GOLD PRODUCTION (Koz)
390-430
• Increase at each of
New Afton, Mesquite
and Cerro San Pedro
SILVER PRODUCTION (Moz)
1.75-1.95
• Increase at Cerro San Pedro
COPPER PRODUCTION (Mlbs)
100-112
• Increase at New Afton
ALL-IN SUSTAINING
COSTS(2) ($/oz)
$745-$785
• Lower sustaining capital
KEY INPUT ASSUMPTIONS
COMMODITY
Gold $1,200/oz
Copper $2.75/lb
Silver $16.00/oz
Diesel $2.25/gl
1. Refer to Endnote on total cash costs under the heading “Non-GAAP Measures”.
2. Refer to Endnote on all-in sustaining costs under the heading “Non-GAAP Measures”.
TOTAL CASH COSTS(1) ($/oz)
$340-$380
• Lower by-product price
assumptions partly offset by
depreciation of Canadian and
Australian dollars
FOREIGN EXCHANGE
CDN/USD $1.25
AUD/USD $1.25
MXN/USD $15.00
(at Mesquite)

New Afton – 2015 guidance
26
105–115
GOLD PRODUCTION (Koz)
85–95
COPPER PRODUCTION (Mlbs)
($1,070)–($1,030)
TOTAL CASH COSTS(1) ($/oz) ALL-IN SUSTAINING COSTS(2)($/oz)
GOLD
Total Cash Costs(1) ($/oz)
$400–$440
All-in Sustaining Costs(2) ($/oz)
$575–$615
CO-PRODUCT CASH COSTS(1)(2)
($560)–($520)
OVERVIEW
• Gold and copper production
increases due to increase in
average annual throughput rate
• Costs slightly higher than 2014
due to lower by-product price
assumptions
• $0.25 per pound change in copper
price equals ~$200 per ounce change
in New Afton all-in sustaining costs(2)
• $0.05 change in Canadian dollar
exchange rate equals ~$90 per
ounce change in New Afton all-in
sustaining costs(2)
KEY SENSITIVITIES
1. Refer to Endnote on total cash costs under the heading “Non-GAAP Measures”.
2. Refer to Endnote on all-in sustaining costs under the heading “Non-GAAP Measures”.
2016/2017 OUTLOOK
• Scheduled to maintain strong
performance with average annual
gold production of ~90,000 ounces
and annual copper production of
~90 million pounds
COPPER
Total Cash Costs(1) ($/lb)
$0.90–$1.05
All-in Sustaining Costs(2) ($/lb)
$1.30–$1.45

Mesquite – 2015 guidance
27
110–120
GOLD PRODUCTION (Koz)
$925–$965
TOTAL CASH COSTS(1) ($/oz) ALL-IN SUSTAINING COSTS(2)($/oz)
$1,290–$1,330
OVERVIEW
• Production increase driven by
mining of higher grades and
increase in tonnes processed
• Increase in costs attributable to
increase in total tonnes mined
• Diesel comprises ~25% of
Mesquite’s total costs
• Every $0.25 per gallon change in
diesel price has ~$15 per ounce
impact on all-in sustaining costs(2)
KEY SENSITIVITIES
1. Refer to Endnote on total cash costs under the heading “Non-GAAP Measures”.
2. Refer to Endnote on all-in sustaining costs under the heading “Non-GAAP Measures”.
2016/2017 OUTLOOK
• Production scheduled to average
150,000 ounces of gold at all-in
sustaining costs(2) of
approximately $800 per ounce
• Targeted performance
improvement driven by increase
in ore tonnes placed, grade and
lower sustaining capital
expenditures

Peak Mines – 2015 guidance
28
85–95
GOLD PRODUCTION (Koz)
$660–$700
TOTAL CASH COSTS(1) ($/oz) ALL-IN SUSTAINING COSTS(2)($/oz)
$1,005–$1,045
OVERVIEW
• Gold production impacted by grade
moving toward reserve grade
• Copper production in line with 2014
• $0.25 per pound change in copper
price equals ~$40 per ounce change
in Peak Mines all-in sustaining costs(2)
• $0.05 change in Australian dollar
exchange rate equals ~$90 per
ounce change in Peak Mines all-in
sustaining costs(2)
KEY SENSITIVITIES
15–17
COPPER PRODUCTION (Mlbs)
1. Refer to Endnote on total cash costs under the heading “Non-GAAP Measures”.
2. Refer to Endnote on all-in sustaining costs under the heading “Non-GAAP Measures”.
2016/2017 OUTLOOK
• Steady performance expected
from the Peak Mines with
potential for an increasing
copper profile in 2017
• Annual sustaining capital to
average ~$25 million
Cerro San Pedro – 2015 guidance
29
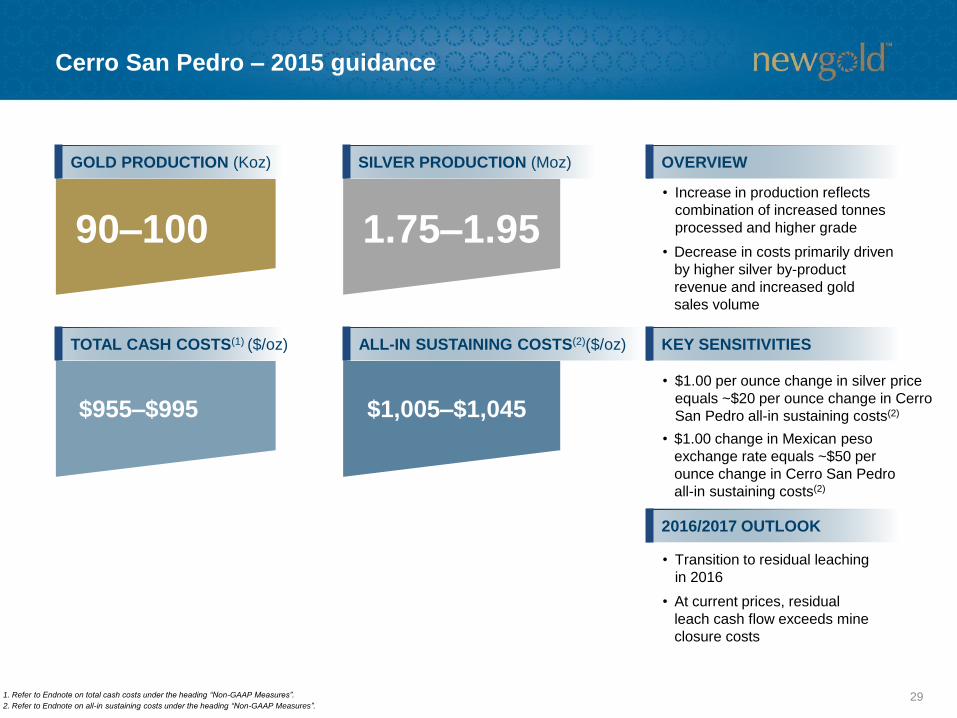
90–100
GOLD PRODUCTION (Koz)
$955–$995
TOTAL CASH COSTS(1) ($/oz) ALL-IN SUSTAINING COSTS(2)($/oz)
$1,005–$1,045
OVERVIEW
• Increase in production reflects
combination of increased tonnes
processed and higher grade
• Decrease in costs primarily driven
by higher silver by-product
revenue and increased gold
sales volume
• $1.00 per ounce change in silver price
equals ~$20 per ounce change in Cerro
San Pedro all-in sustaining costs(2)
• $1.00 change in Mexican peso
exchange rate equals ~$50 per
ounce change in Cerro San Pedro
all-in sustaining costs(2)
KEY SENSITIVITIES
1.75–1.95
SILVER PRODUCTION (Moz)
1. Refer to Endnote on total cash costs under the heading “Non-GAAP Measures”.
2. Refer to Endnote on all-in sustaining costs under the heading “Non-GAAP Measures”.
2016/2017 OUTLOOK
• Transition to residual leaching
in 2016
• At current prices, residual
leach cash flow exceeds mine
closure costs

30
2015 capital expenditures by category
TOTAL CAPITAL
$455million
SUSTAINING CAPITAL: ~$120 million GROWTH CAPITAL: ~$335 million
NEW AFTON
$55 million
MESQUITE
$40 million
PEAK MINES
$25 million
CERRO SAN PEDRO
$2 million
RAINY RIVER
$300 million
NEW AFTON
$25 million
BLACKWATER
$8 million
1. Totals may not add due to rounding.
31
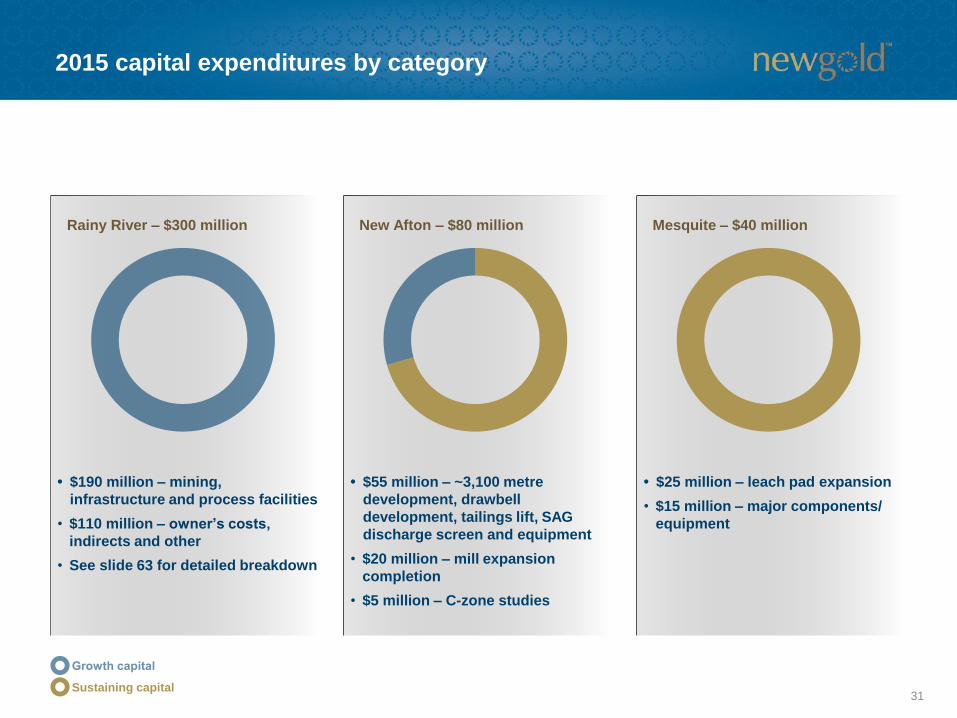
2015 capital expenditures by category
Rainy River – $300 million New Afton – $80 million Mesquite – $40 million
• $190 million – mining,
infrastructure and process facilities
• $110 million – owner’s costs,
indirects and other
• See slide 63 for detailed breakdown
• $55 million – ~3,100 metre
development, drawbell
development, tailings lift, SAG
discharge screen and equipment
• $20 million – mill expansion
completion
• $5 million – C-zone studies
• $25 million – leach pad expansion
• $15 million – major components/
equipment
Sustaining capital

32
2015 capital expenditures by category (cont’d)
Peak Mines – $25 million Blackwater – $8 million
• $15 million – development and
capitalized exploration
• $10 million – equipment
replacements and upgrades
• $8 million – permitting,
environmental studies and
site support
Sustaining capital
2014 year-end reserves and resources
33

Reserves summary
34
GOLD RESERVES(1) (Moz)
18.5 17.6
• For 2014 year-end mineral reserve
estimates, commodity price
assumptions were lowered by $100
per ounce to $1,200 per ounce for
gold and by $4 per ounce to $18 per
ounce for silver
− Commodity price assumption
for copper was held at $3.00
per pound
• Change in gold reserves attributable
to combination of 2014 mine
depletion, lower metal price
assumptions and updated mine plans
• Beginning with 2014 year end and
moving forward, New Gold will be
reporting Measured and Indicated
resources exclusive of reserves
>70%
1. For a detailed breakdown of mineral resources and reserves by category and the key assumptions and parameters, refer to Appendix 1. Refer to Endnotes under the heading “Cautionary note to U.S. readers concerning estimates of mineral reserves
and mineral resources” and “Technical Information”.
COPPER RESERVES(1) (Blbs) SILVER RESERVES(1) (Moz)
3.0 2.890.1
82.0
CERRO SAN PEDROPEAK MINES
2014 reserve and resource changes
35
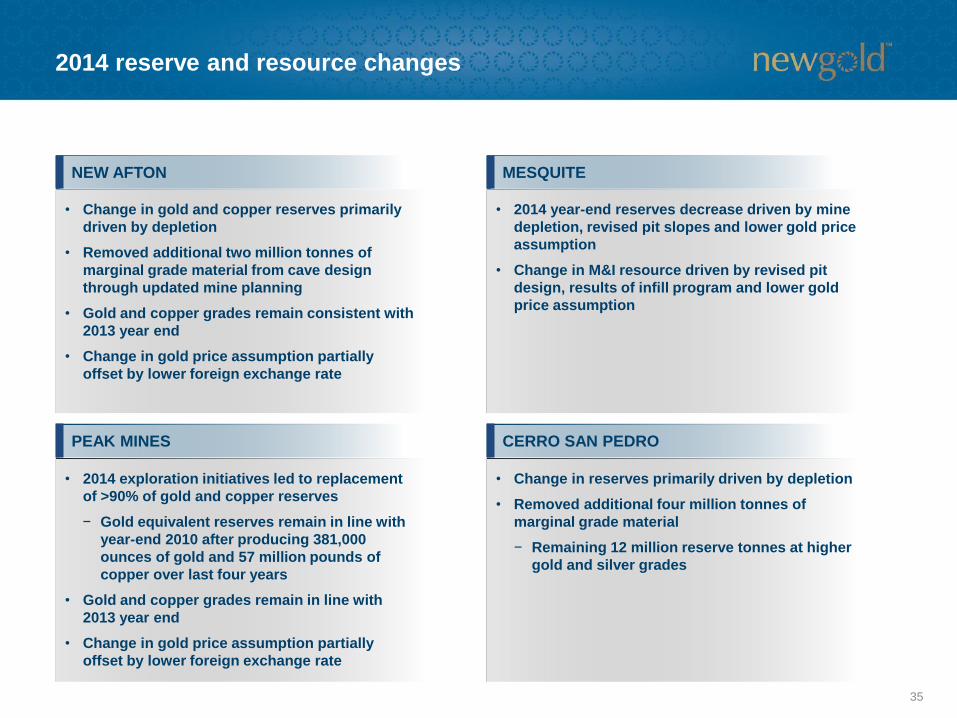
• Change in gold and copper reserves primarily
driven by depletion
• Removed additional two million tonnes of
marginal grade material from cave design
through updated mine planning
• Gold and copper grades remain consistent with
2013 year end
• Change in gold price assumption partially
offset by lower foreign exchange rate
NEW AFTON MESQUITE
• 2014 exploration initiatives led to replacement
of >90% of gold and copper reserves
− Gold equivalent reserves remain in line with
year-end 2010 after producing 381,000
ounces of gold and 57 million pounds of
copper over last four years
• Gold and copper grades remain in line with
2013 year end
• Change in gold price assumption partially
offset by lower foreign exchange rate
• 2014 year-end reserves decrease driven by mine
depletion, revised pit slopes and lower gold price
assumption
• Change in M&I resource driven by revised pit
design, results of infill program and lower gold
price assumption
• Change in reserves primarily driven by depletion
• Removed additional four million tonnes of
marginal grade material
− Remaining 12 million reserve tonnes at higher
gold and silver grades

Geographic breakdown
36
GOLD M&I RESOURCES(1) (Moz)GOLD RESERVES(1) (Moz)
CANADA (72%)
CHILE (15%)
USA (10%)
AUSTRALIA (2%)
MEXICO (1%)
CANADA (74%)
USA (16%)
AUSTRALIA (5%)
CHILE (5%)
17.6 7.8
1. M&I resources exclusive of reserves. For a detailed breakdown of mineral resources and reserves by category and the key assumptions and parameters, refer to Appendix 1. Refer to Endnotes under the heading “Cautionary note to U.S. readers
concerning estimates of mineral reserves and mineral resources” and “Technical Information”.
Exploration updates
37

2015 exploration program overview
38
MESQUITE (15%)
PEAK MINES (40%)
RAINY RIVER (20%)
BLACKWATER (25%)
1. Circle proportions are representative of both capitalized and expensed exploration for each respective asset. Total includes expenses of corporate exploration team.
$17million
EXPENSED
CAPITALIZED
$6million
$11million
(included in capital expenditures)
Expensed - $2 million
Capitalized - $3 million
Expensed - $4 million
Capitalized - $3 million
Expensed - $4 million
2015 exploration program overview (cont’d)
39
2015 PROGRAM2014 ACHIEVEMENTS
Peak Mines
Blackwater
Rainy River
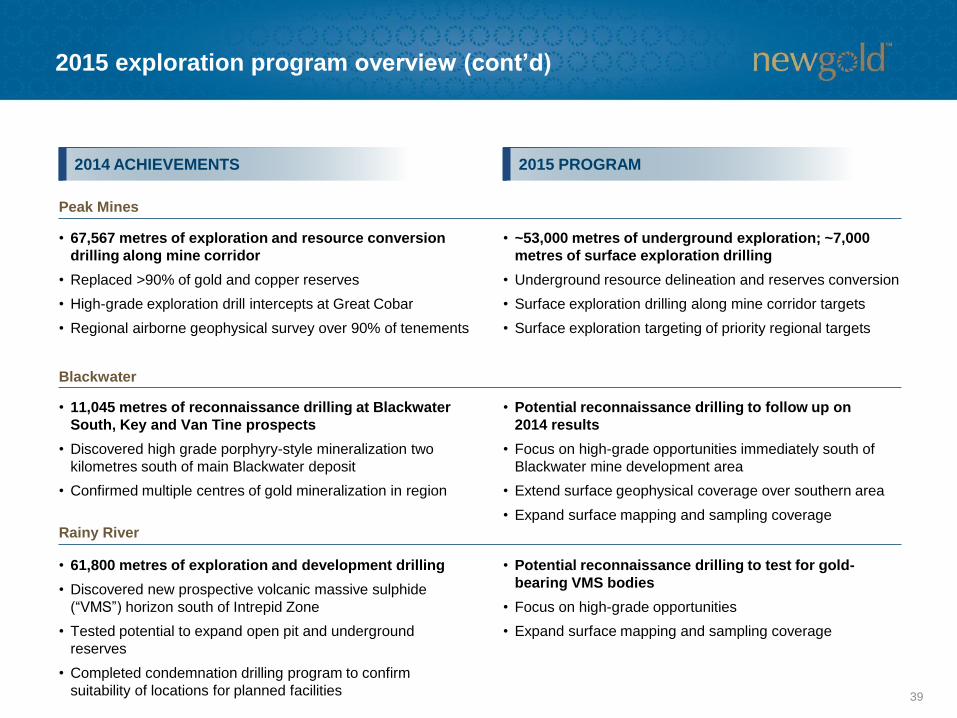
• 67,567 metres of exploration and resource conversion
drilling along mine corridor
• Replaced >90% of gold and copper reserves
• High-grade exploration drill intercepts at Great Cobar
• Regional airborne geophysical survey over 90% of tenements
• ~53,000 metres of underground exploration; ~7,000
metres of surface exploration drilling
• Underground resource delineation and reserves conversion
• Surface exploration drilling along mine corridor targets
• Surface exploration targeting of priority regional targets
• 11,045 metres of reconnaissance drilling at Blackwater
South, Key and Van Tine prospects
• Discovered high grade porphyry-style mineralization two
kilometres south of main Blackwater deposit
• Confirmed multiple centres of gold mineralization in region
• Potential reconnaissance drilling to follow up on
2014 results
• Focus on high-grade opportunities immediately south of
Blackwater mine development area
• Extend surface geophysical coverage over southern area
• Expand surface mapping and sampling coverage
• 61,800 metres of exploration and development drilling
• Discovered new prospective volcanic massive sulphide
(“VMS”) horizon south of Intrepid Zone
• Tested potential to expand open pit and underground
reserves
• Completed condemnation drilling program to confirm
suitability of locations for planned facilities
• Potential reconnaissance drilling to test for gold-
bearing VMS bodies
• Focus on high-grade opportunities
• Expand surface mapping and sampling coverage

Development projects
40

41
Leading growth pipeline
Jurisdiction Ontario, Canada British Columbia, Canada Atacama Region, Chile
Significant Gold
Reserve(1) 3.8 Moz 8.2 Moz 2.7 Moz
By-product
Metal Reserve(1) 9.4 Moz silver 60.8 Moz silver 2.0 Blbs copper
Large Land
Package>190 km2 >1,100 km2 >415 km2
Three
organic growth
initiatives
Rainy River Blackwater El Morro (30%)
1. For a detailed breakdown of mineral resources and reserves by category and the key assumptions and parameters, refer to Appendix 1. Refer to Endnotes under the heading “Cautionary note to U.S. readers concerning estimates of mineral reserves
and mineral resources” and “Technical Information”.
REGIONAL UPSIDESIGNIFICANT GOLD AND SILVER RESOURCE
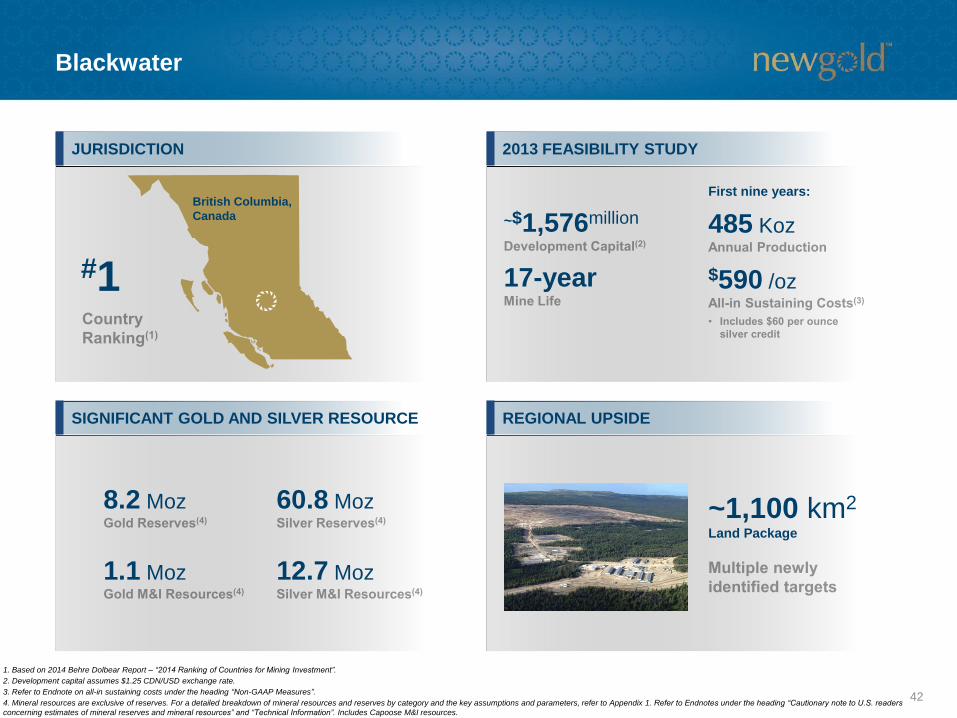
Blackwater
42
British Columbia,
Canada
#1
8.2 Moz
1.1 Moz
~1,100 km2
Land Package
First nine years:
485 Koz
$590 /oz17-year
JURISDICTION 2013 FEASIBILITY STUDY
1. Based on 2014 Behre Dolbear Report – “2014 Ranking of Countries for Mining Investment”.
2. Development capital assumes $1.25 CDN/USD exchange rate.
3. Refer to Endnote on all-in sustaining costs under the heading “Non-GAAP Measures”.
4. Mineral resources are exclusive of reserves. For a detailed breakdown of mineral resources and reserves by category and the key assumptions and parameters, refer to Appendix 1. Refer to Endnotes under the heading “Cautionary note to U.S. readers
concerning estimates of mineral reserves and mineral resources” and “Technical Information”. Includes Capoose M&I resources.
~$1,576million
60.8 Moz
12.7 Moz

UNIQUE JOINT VENTURE STRUCTURE
El Morro
43
#4
Goldcorp 70% partner
Funds 100% of capital
New Gold retains 20% of its 30% share of cash flow from mine start-up
Interest on carried funding fixed at 4.58%
Goldcorp currently determining the optimal new development plan
JURISDICTION
1. Based on 2014 Behre Dolbear Report – “2014 Ranking of Countries for Mining Investment”.
2. For a detailed breakdown of mineral resources and reserves by category and the key assumptions and parameters, refer to Appendix 1. Refer to Endnotes under the heading “Cautionary note to U.S. readers concerning estimates of mineral reserves
and mineral resources” and “Technical Information”.
Chile
RESERVES AND RESOURCES (30%)
2.7 Moz @ 0.5 g/t
2.0 Blbs @ 0.5%
Reserves(2) –
Open Pit
Inferred Resources(2) –
Potential Block Cave
1.1 Moz @ 1.0 g/t
0.6 Blbs @ 0.8%

New Afton mill expansion and C-zone update
44
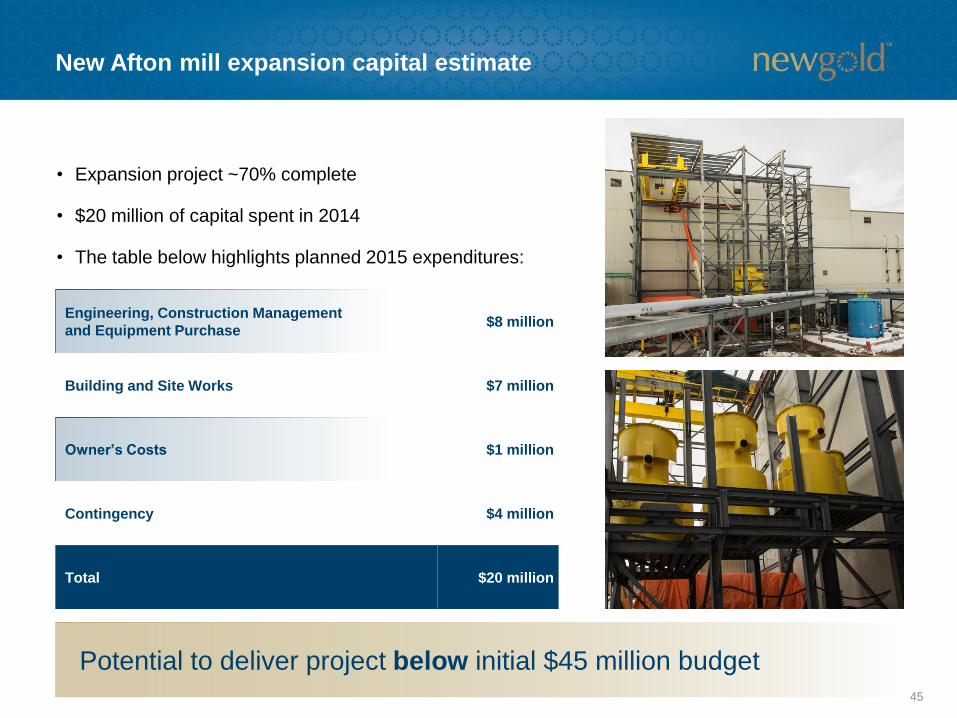
Engineering, Construction Management
and Equipment Purchase$8 million
Building and Site Works $7 million
Owner’s Costs $1 million
Contingency $4 million
Total $20 million
New Afton mill expansion capital estimate
45
• Expansion project ~70% complete
• $20 million of capital spent in 2014
• The table below highlights planned 2015 expenditures:
Potential to deliver project below initial $45 million budget

New Facilities
To Tailings
Surface Stockpile
New Afton mill schematic
46
North

New Afton mill expansion timeline
47
• Building services
• Vertimill installation
• Flotation cell installation
• Piping/electrical
• Instrumentation
• Commissioning
2014 FIRST HALF 2015

New Afton C-zone update
48
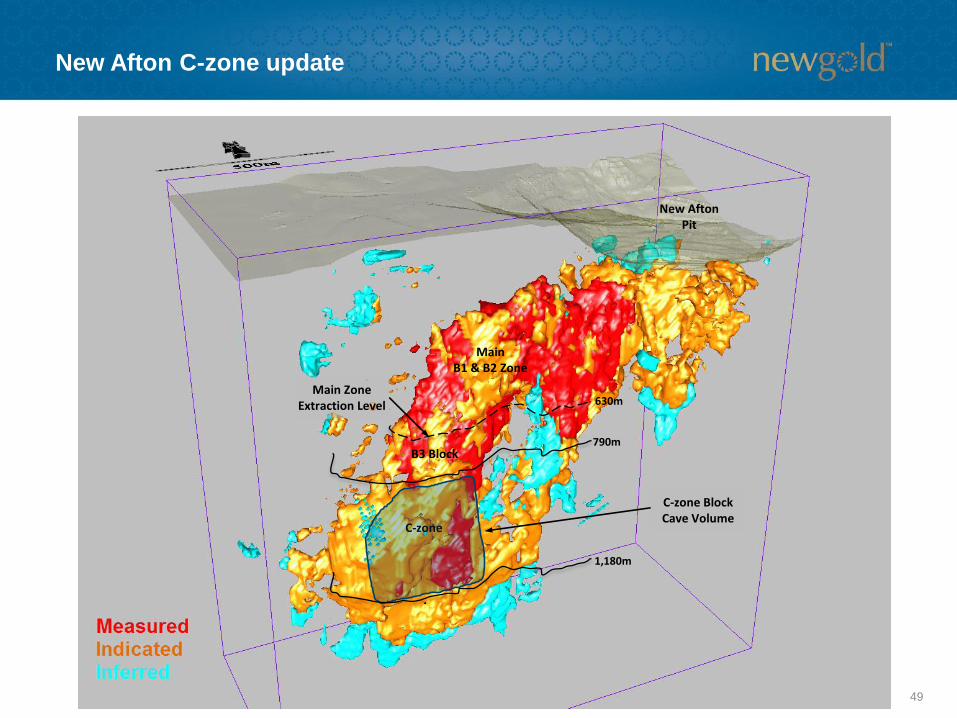
New Afton C-zone update
49
New AftonPit
MainB1 & B2 Zone
B3 Block
C-zone
Main ZoneExtraction Level
790m
630m
1,180m
C-zone Block Cave Volume
50
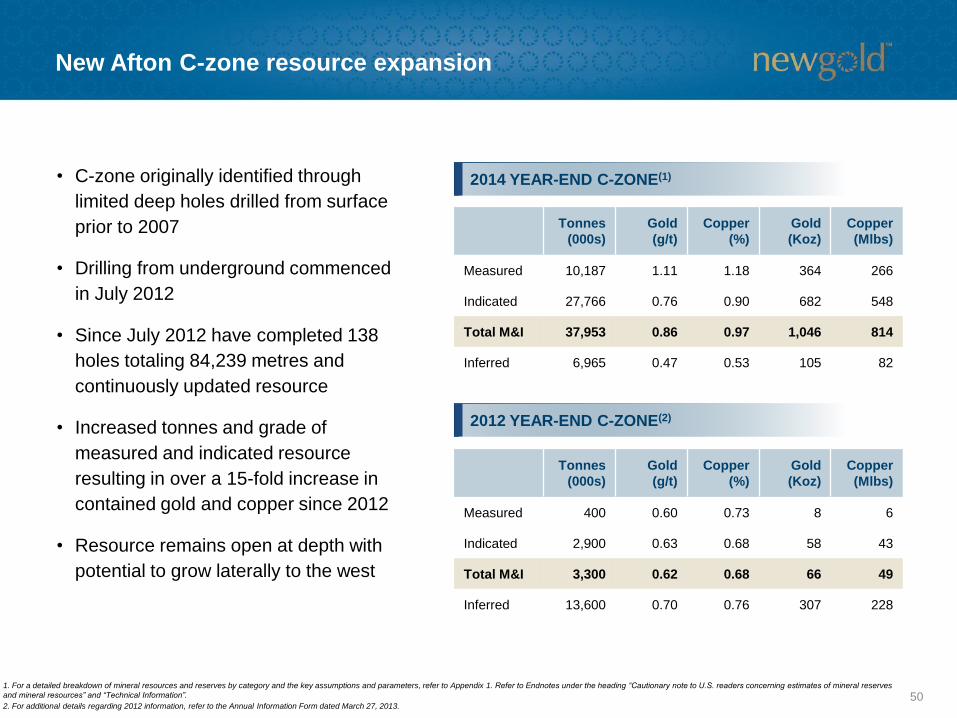
• C-zone originally identified through
limited deep holes drilled from surface
prior to 2007
• Drilling from underground commenced
in July 2012
• Since July 2012 have completed 138
holes totaling 84,239 metres and
continuously updated resource
• Increased tonnes and grade of
measured and indicated resource
resulting in over a 15-fold increase in
contained gold and copper since 2012
• Resource remains open at depth with
potential to grow laterally to the west
Tonnes
(000s)
Gold
(g/t)
Copper
(%)
Gold
(Koz)
Copper
(Mlbs)
Measured 10,187 1.11 1.18 364 266
Indicated 27,766 0.76 0.90 682 548
Total M&I 37,953 0.86 0.97 1,046 814
Inferred 6,965 0.47 0.53 105 82
1. For a detailed breakdown of mineral resources and reserves by category and the key assumptions and parameters, refer to Appendix 1. Refer to Endnotes under the heading “Cautionary note to U.S. readers concerning estimates of mineral reserves
and mineral resources” and “Technical Information”.
2. For additional details regarding 2012 information, refer to the Annual Information Form dated March 27, 2013.
Tonnes
(000s)
Gold
(g/t)
Copper
(%)
Gold
(Koz)
Copper
(Mlbs)
Measured 400 0.60 0.73 8 6
Indicated 2,900 0.63 0.68 58 43
Total M&I 3,300 0.62 0.68 66 49
Inferred 13,600 0.70 0.76 307 228
New Afton C-zone resource expansion
2014 YEAR-END C-ZONE(1)
2012 YEAR-END C-ZONE(2)

New Afton C-zone scoping study summary
51
• New Afton C-zone scoping
study completed by New Gold(1)
• The project assesses the
potential for mining the mineral
resource below the current
New Afton block cave
• C-zone is planned at an
elevation approximately 550
metres below the current
mining level
• Scoping study outlines potential
21.5 million tonne addition to
the current mine plan(2)
OVERVIEW
Block Cave Outline Relative to Existing Open Pit (Looking North)
B1 & B2
B3
C-zone
1. The scoping study was prepared by New Gold with Roscoe Postle Associates Inc. (“RPA”) providing an independent third party review. The independent Qualified Persons who reviewed and approved the disclosure contained herein on the C-zone
scoping study were David W. Rennie, P.Eng., Principal Geologist, RPA; Holger Krutzellmann, P.Eng. Associate Principal Metallurgist, RPA; and R. Dennis Bergen, P.Eng., Associate Principal Mining Engineer, RPA.
2. Material is a portion of the C-zone measured, indicated and inferred resources. For a detailed breakdown of mineral resources and reserves by category and the key assumptions and parameters, refer to Appendix 1. Refer to Endnotes under the
heading “Cautionary note to U.S. readers concerning estimates of mineral reserves and mineral resources” and “Technical Information”.

New Afton C-zone scoping study summary (cont’d)
52
• Total tonnes to be mined/processed
- 21.5 million
• Mine life of five years, including ramp-up period
• Full-year production to average 107,000 ounces
of gold and 77 million pounds of copper
− Life-of-mine to produce 522,000 ounces of
gold and 377 million pounds of copper
• Average gold and copper grades of 0.76 grams
per tonne and 0.80%
• Development capital of $349 million and
sustaining capital of $110 million
− Majority of mining equipment from current
operation would be utilized for C-zone
• Average operating cost of $19.24 per tonne
(2014A - $17.35); drivers of increase versus
current operating cost:
− Increase in conveying distance
− Ventilation costs
− Pumping costs
• Cash costs in line with current operations
Gold Price ($/oz)
Copper Price ($/lb)
CDN/USD ($)
$1,300
$3.00
$1.25
After-tax
5% NPV ($mm) $138
IRR (%) 13.5
Payback (years) 3.0
KEY SENSITIVITIES
$100 per ounce change in gold price ~$10 million in after-tax NAV
$0.25 per pound change in copper price ~$10 million in after-tax NAV
$0.05 change in exchange rate ~$5 million in after-tax NAV
C-ZONE ECONOMICS (Long-term assumptions)
DEVELOPMENT CAPITAL DETAILS
1. The scoping study discussed above is based on measured, indicated and inferred resources and is preliminary in nature. Accordingly, the scoping study is subject to a high degree of uncertainty. The scoping study includes mineral resources that are considered too speculative
geologically to have economic considerations applied to them that would enable them to be categorized as mineral reserves and there is no certainty the scoping study will be realized. Refer to Appendix 1 for additional information. The key parameters and assumptions associated
with the C- zone scoping study do not impact on the current New Afton mining operation or the New Afton B-zone reserves.
CRUSH/CONVEY SYSTEMS (19%)
TAILINGS (16%)
CONTINGENCY/OTHER (24%)
C-ZONE DEVELOPMENT (37%)
MOBILE EQUIPMENT PURCHASE (4%)
New Afton C-zone opportunities and ongoing analysis
53
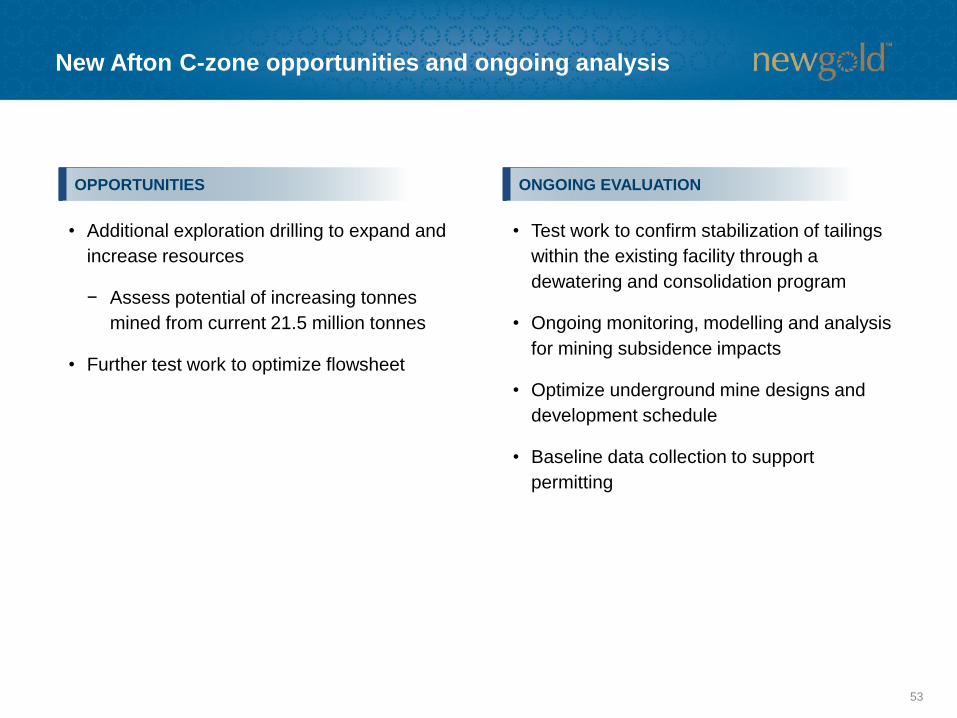
• Additional exploration drilling to expand and
increase resources
− Assess potential of increasing tonnes
mined from current 21.5 million tonnes
• Further test work to optimize flowsheet
ONGOING EVALUATIONOPPORTUNITIES
• Test work to confirm stabilization of tailings
within the existing facility through a
dewatering and consolidation program
• Ongoing monitoring, modelling and analysis
for mining subsidence impacts
• Optimize underground mine designs and
development schedule
• Baseline data collection to support
permitting
New Afton C-zone milestones
54
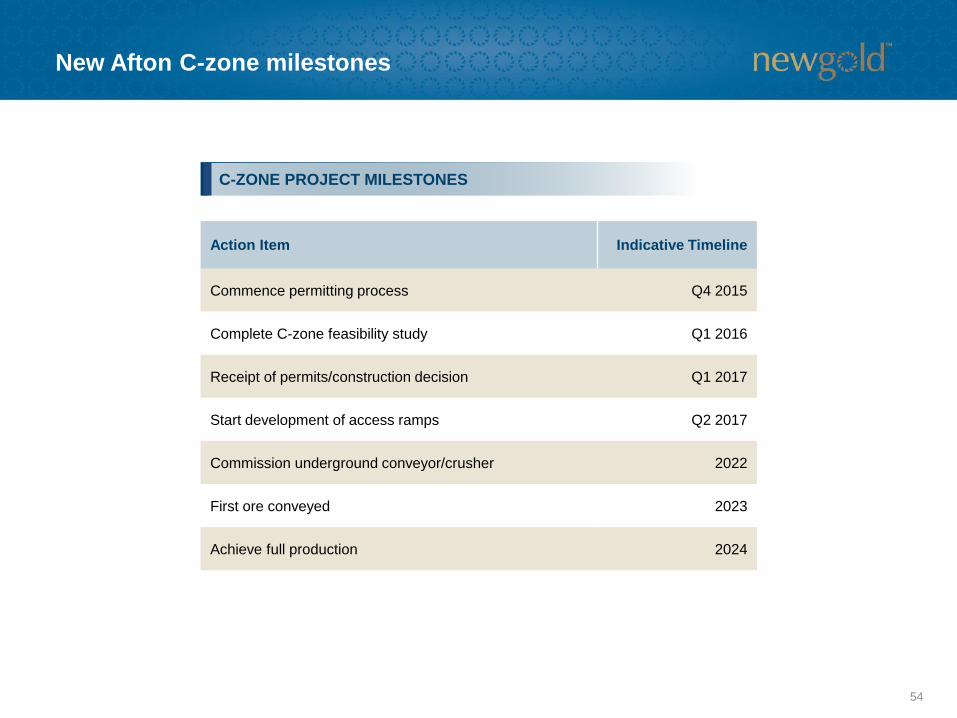
C-ZONE PROJECT MILESTONES
Action Item Indicative Timeline
Commence permitting process Q4 2015
Complete C-zone feasibility study Q1 2016
Receipt of permits/construction decision Q1 2017
Start development of access ramps Q2 2017
Commission underground conveyor/crusher 2022
First ore conveyed 2023
Achieve full production 2024

Rainy River development
55
56
Rainy River project overview
1. Based on 2014 Behre Dolbear Report – “2014 Ranking of Countries for Mining Investment”.
2. For a detailed breakdown of mineral resources and reserves by category and the key assumptions and parameters, refer to Appendix 1. Refer to Endnotes under the heading “Cautionary note to U.S. readers concerning estimates of mineral reserves
and mineral resources” and “Technical Information”.
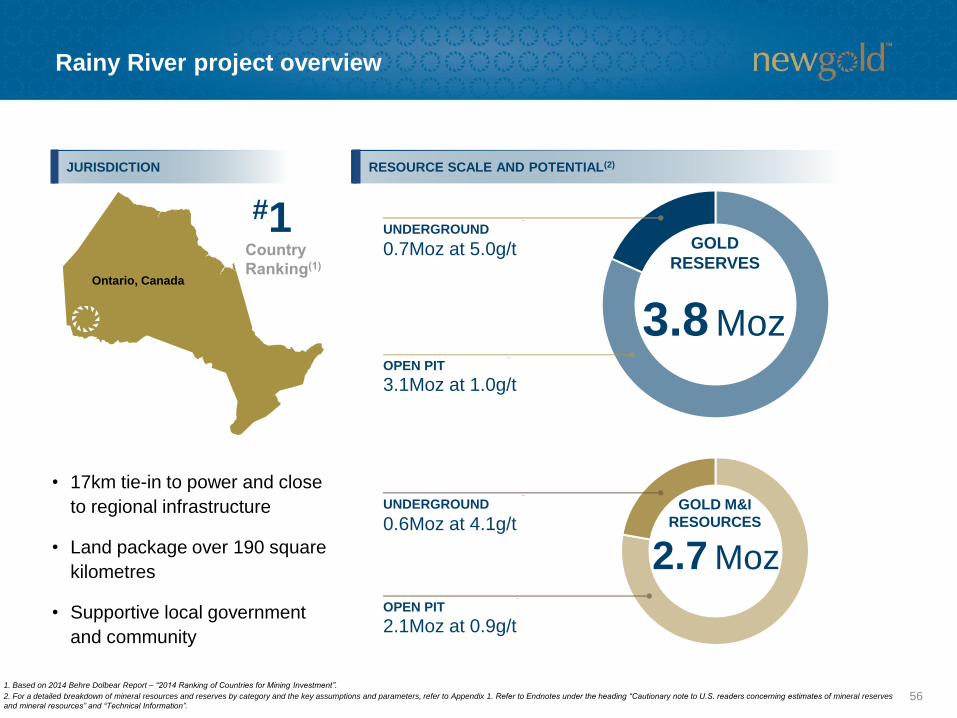
• 17km tie-in to power and close
to regional infrastructure
• Land package over 190 square
kilometres
• Supportive local government
and community
JURISDICTION RESOURCE SCALE AND POTENTIAL(2)
Ontario, Canada
GOLD
RESERVES
3.1Moz at 1.0g/tOPEN PIT
UNDERGROUND
0.7Moz at 5.0g/t
3.8 Moz
#1
GOLD M&I
RESOURCES
2.1Moz at 0.9g/tOPEN PIT
UNDERGROUND
0.6Moz at 4.1g/t
2.7 Moz
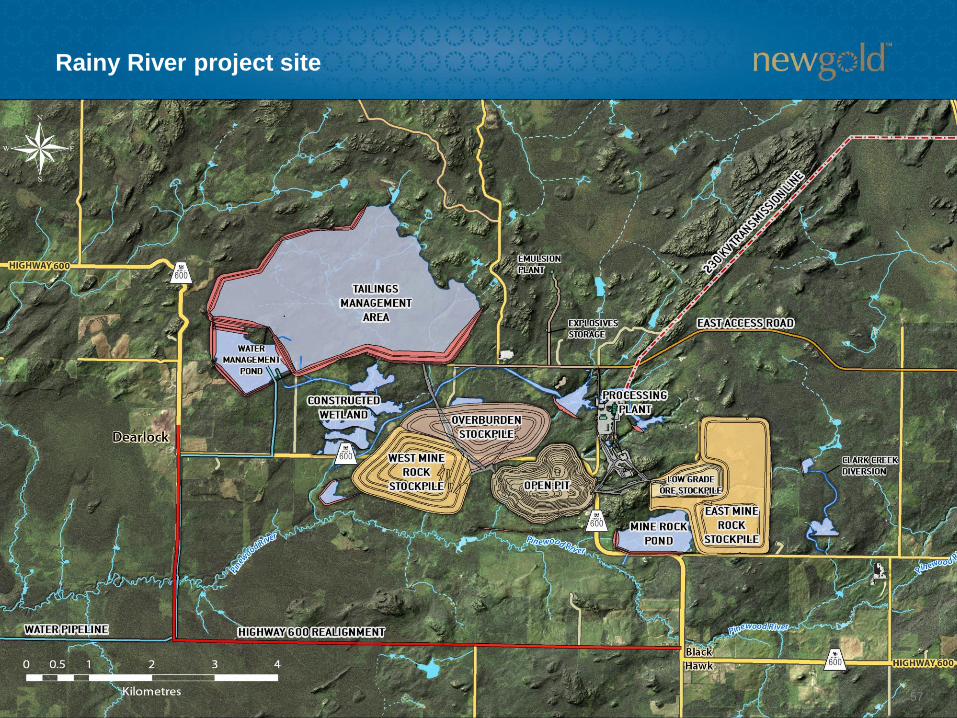
Rainy River project site
57
Rainy River project update
58
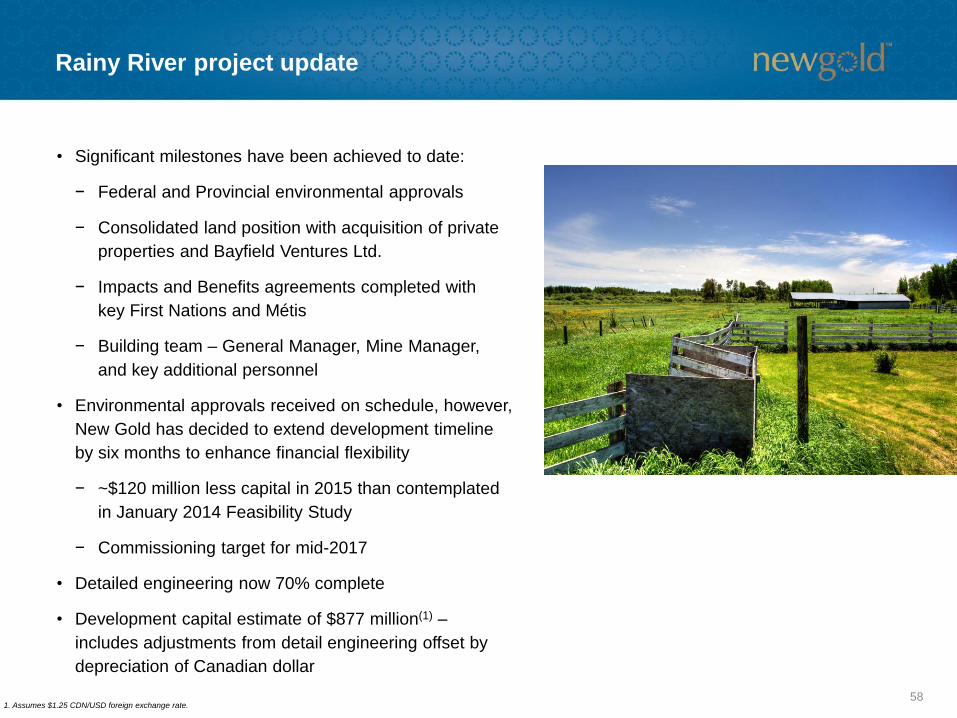
• Significant milestones have been achieved to date:
− Federal and Provincial environmental approvals
− Consolidated land position with acquisition of private
properties and Bayfield Ventures Ltd.
− Impacts and Benefits agreements completed with
key First Nations and Métis
− Building team – General Manager, Mine Manager,
and key additional personnel
• Environmental approvals received on schedule, however,
New Gold has decided to extend development timeline
by six months to enhance financial flexibility
− ~$120 million less capital in 2015 than contemplated
in January 2014 Feasibility Study
− Commissioning target for mid-2017
• Detailed engineering now 70% complete
• Development capital estimate of $877 million(1) –
includes adjustments from detail engineering offset by
depreciation of Canadian dollar
1. Assumes $1.25 CDN/USD foreign exchange rate.
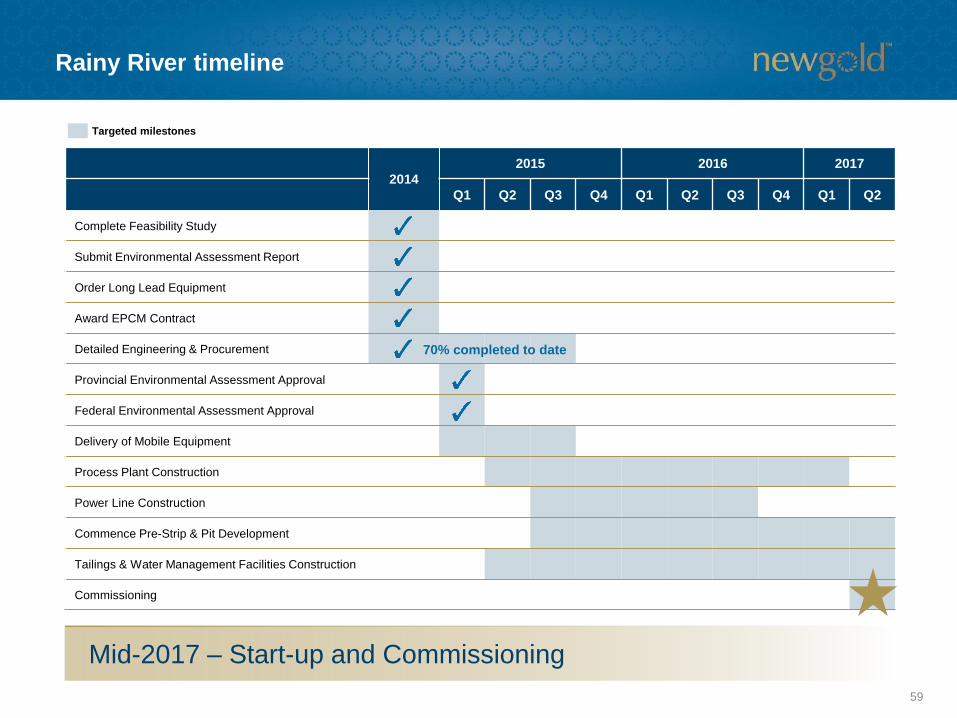
Rainy River timeline
59
2014
2015 2016 2017
Q1 Q2 Q3 Q4 Q1 Q2 Q3 Q4 Q1 Q2
Complete Feasibility Study
Submit Environmental Assessment Report
Order Long Lead Equipment
Award EPCM Contract
Detailed Engineering & Procurement
Provincial Environmental Assessment Approval
Federal Environmental Assessment Approval
Delivery of Mobile Equipment
Process Plant Construction
Power Line Construction
Commence Pre-Strip & Pit Development
Tailings & Water Management Facilities Construction
Commissioning
Targeted milestones
Mid-2017 – Start-up and Commissioning
70% completed to date

$885 $877
$808 $808
$39
$15
$12 $11
$6
$91
$69
Jan
uary
2014
feasib
ility
update
Accom
moda
tio
nfa
cili
tie
s
Escala
tio
n
Constr
uctio
naccess r
oad
s
Constr
uctio
nsup
port
Pro
cess p
lant
Fo
reig
n e
xcha
nge
Update
d d
evelo
pm
ent
cap
ital estim
ate
2014 s
pend
Rem
ain
ing
cap
ital
Rainy River key changes to capital expenditures
60
• Temporary accommodation
facilities added to de-risk
project execution
• Escalation factor added for
development period
• Additional construction access
roads around tailings and
water facilities
• Construction management
team supplemented
• Process plant increase in
material quantities
• Weakening of Canadian dollar
from $1.05 to $1.25 offsets
capital expenditure increases
1. Assumes $1.05 CDN/USD foreign exchange rate.
2. Assumes $1.25 CDN/USD foreign exchange rate.
3. 2014 spend at average $1.10 CDN/USD foreign exchange rate.
ADJUSTMENTS FROM JANUARY 2014 FEASIBILITY STUDY CAPITAL COSTS ($mm)
(1)
(2)
(3)
61
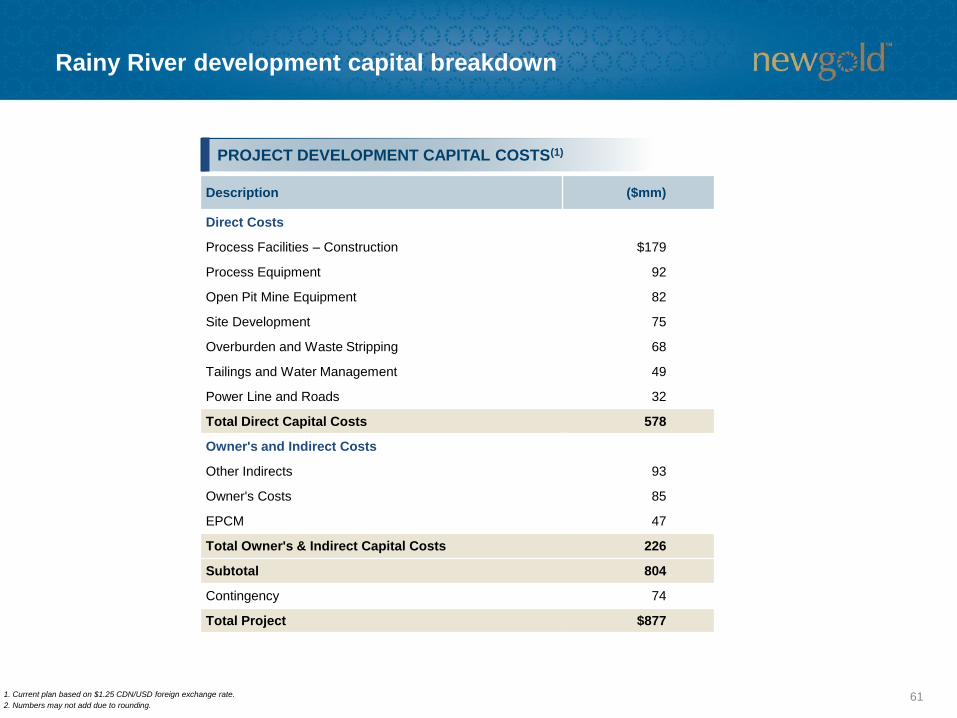
Rainy River development capital breakdown
PROJECT DEVELOPMENT CAPITAL COSTS(1)
Description ($mm)
Direct Costs
Process Facilities – Construction $179
Process Equipment 92
Open Pit Mine Equipment 82
Site Development 75
Overburden and Waste Stripping 68
Tailings and Water Management 49
Power Line and Roads 32
Total Direct Capital Costs 578
Owner's and Indirect Costs
Other Indirects 93
Owner's Costs 85
EPCM 47
Total Owner's & Indirect Capital Costs 226
Subtotal 804
Contingency 74
Total Project $877
1. Current plan based on $1.25 CDN/USD foreign exchange rate.
2. Numbers may not add due to rounding.

Rainy River 2015 capital expenditure and project plan
62
• Finalize detailed control estimate and schedule
• Tender, award and execute site clearing
• Prepare and award major civil works contracts
• Complete plant site, infrastructure and water
management earth works
• Construct Highway 600 realignment and mine
access road
• Construct mill building foundation
• Commission first phase of mine fleet
• Commence prestripping
2015 CAPITAL EXPENDITURE DETAILS 2015 PROGRAM
($mm)
Process plant $84
Mining 52
Indirects 27
On-site infrastructure 27
Owners costs 22
Accommodation facility 21
Tailings facilities 15
Access corridor 13
Off-site facilities 13
Construction management services 5
Contingency/escalation 21
Total $300

Conclusion
63
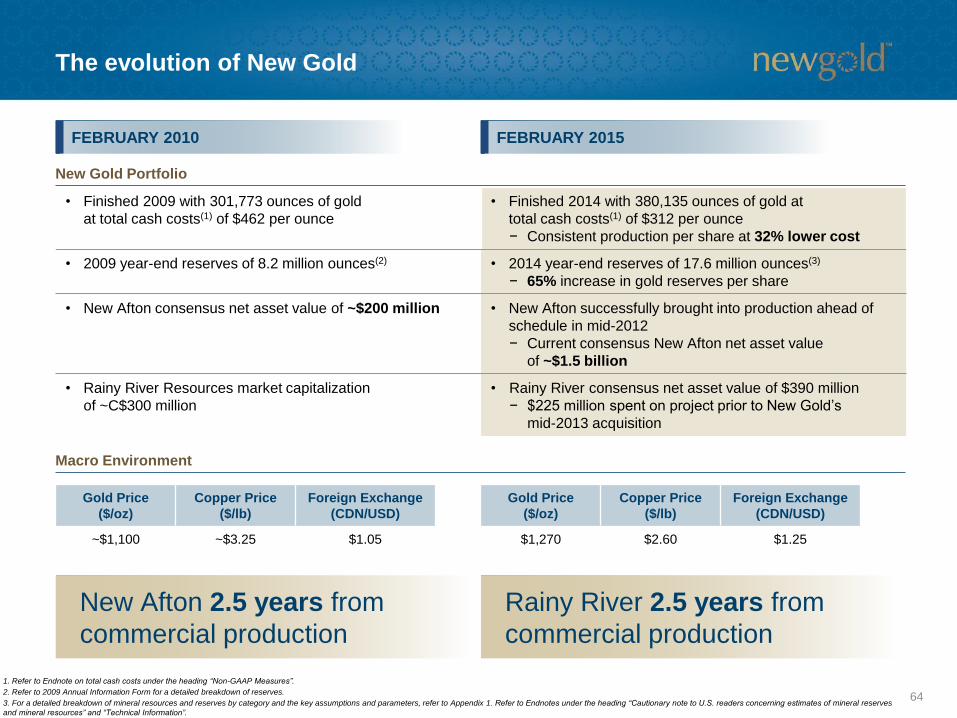
The evolution of New Gold
64
FEBRUARY 2010 FEBRUARY 2015
New Gold Portfolio
Macro Environment
New Afton 2.5 years from
commercial production
Rainy River 2.5 years from
commercial production
Gold Price
($/oz)
Copper Price
($/lb)
Foreign Exchange
(CDN/USD)
~$1,100 ~$3.25 $1.05
Gold Price
($/oz)
Copper Price
($/lb)
Foreign Exchange
(CDN/USD)
$1,270 $2.60 $1.25
• Finished 2009 with 301,773 ounces of gold
at total cash costs(1) of $462 per ounce
• Finished 2014 with 380,135 ounces of gold at
total cash costs(1) of $312 per ounce
− Consistent production per share at 32% lower cost
• 2009 year-end reserves of 8.2 million ounces(2) • 2014 year-end reserves of 17.6 million ounces(3)
− 65% increase in gold reserves per share
• New Afton consensus net asset value of ~$200 million • New Afton successfully brought into production ahead of
schedule in mid-2012
− Current consensus New Afton net asset value
of ~$1.5 billion
• Rainy River Resources market capitalization
of ~C$300 million
• Rainy River consensus net asset value of $390 million
− $225 million spent on project prior to New Gold’s
mid-2013 acquisition
1. Refer to Endnote on total cash costs under the heading “Non-GAAP Measures”.
2. Refer to 2009 Annual Information Form for a detailed breakdown of reserves.
3. For a detailed breakdown of mineral resources and reserves by category and the key assumptions and parameters, refer to Appendix 1. Refer to Endnotes under the heading “Cautionary note to U.S. readers concerning estimates of mineral reserves
and mineral resources” and “Technical Information”.
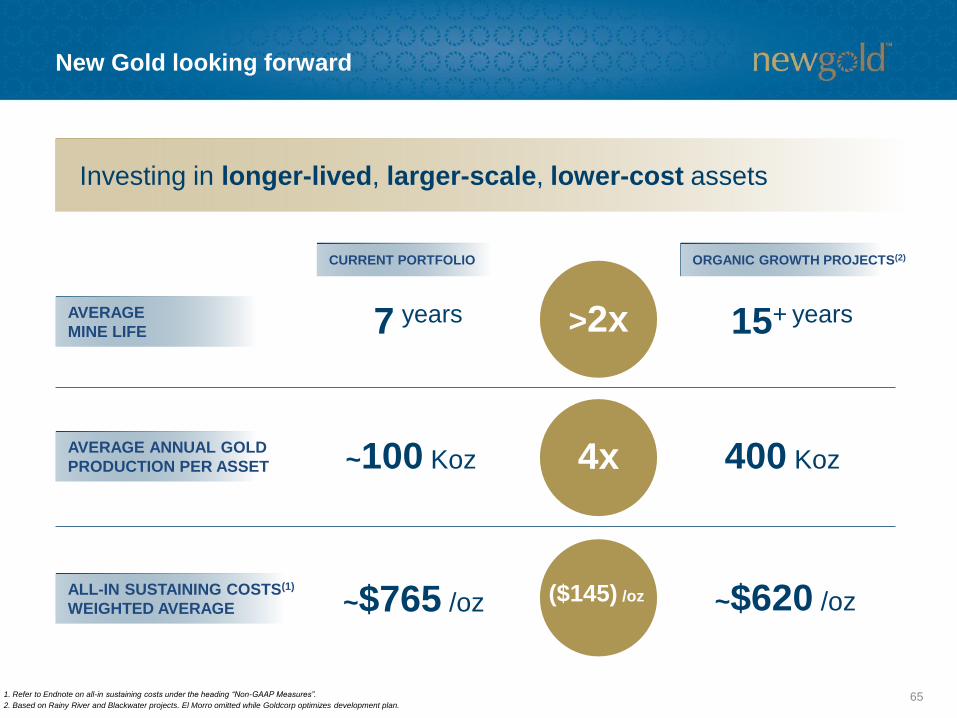
65
New Gold looking forward
15+ years
~$620 /oz
AVERAGE ANNUAL GOLD
PRODUCTION PER ASSET
ALL-IN SUSTAINING COSTS(1)
WEIGHTED AVERAGE
7 years
~100 Koz
~$765 /oz
CURRENT PORTFOLIO
>2x
4x
($145) /oz
ORGANIC GROWTH PROJECTS(2)
AVERAGE
MINE LIFE
Investing in longer-lived, larger-scale, lower-cost assets
1. Refer to Endnote on all-in sustaining costs under the heading “Non-GAAP Measures”.
2. Based on Rainy River and Blackwater projects. El Morro omitted while Goldcorp optimizes development plan.
400 Koz

Rainy River – Value creation through development
661. Based on $1.25 CDN/USD foreign exchange rate.
2. Based on first five years at $1,300 per ounce gold, $16 per ounce silver and $1.25 CDN/USD foreign exchange rate.
UPSIDE
$300millionAcquisition cost
50% /Cash
50%
Shares
$877millionDevelopment
capital estimate(1)
$1.2billionTotal investment
Average annual
after-tax
cash flow(2)
Potential cash
flow multiple
range
Implied value
potential
$235million
~8-10x
Development of Rainy River presents opportunity
for $0.7 to $1.2 billion of potential value creation
~$1.9-$2.4billion
INVESTMENT VALUE POTENTIAL

Blackwater – Value creation through development
671. Based on $1.25 CDN/USD foreign exchange rate.
2. Based on first five years at $1,300 per ounce gold, $16 per ounce silver and $1.25 CDN/USD foreign exchange rate.
UPSIDE
$630millionAcquisition cost
100%
Shares
$1,576millionDevelopment
capital estimate(1)
$2.2billionTotal investment
Average annual
after-tax
cash flow(2)
Potential cash
flow multiple
range
Implied value
potential
$415million
~8-10x
Development of Blackwater presents opportunity
for $1.1 to $2.0 billion of potential value creation
~$3.3-$4.2billion
INVESTMENT VALUE POTENTIAL
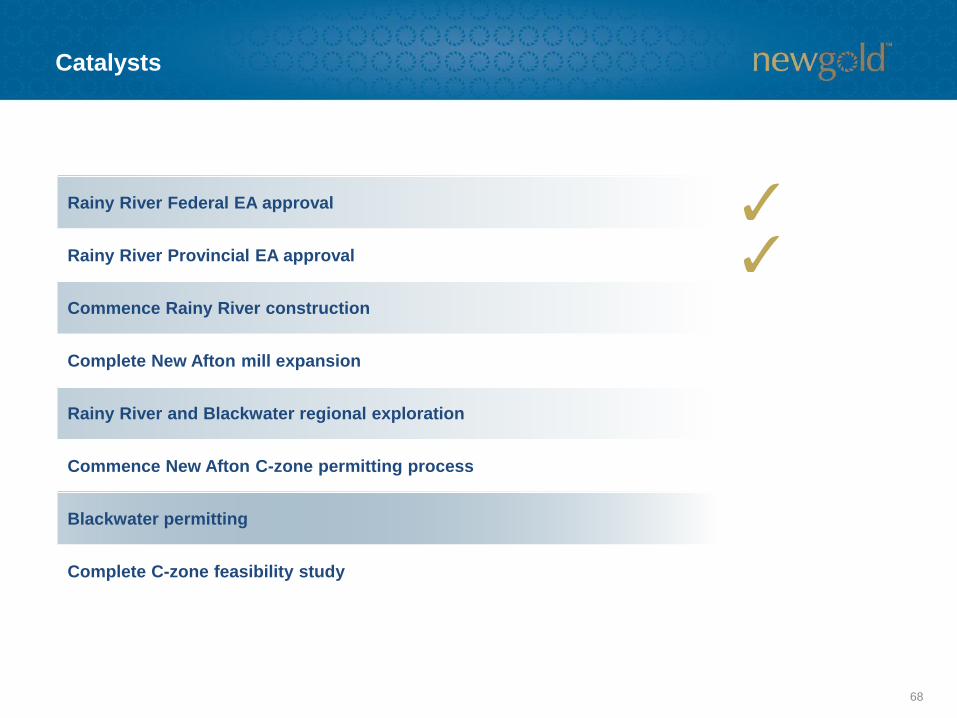
Catalysts
68
Rainy River Federal EA approval
Rainy River Provincial EA approval
Commence Rainy River construction
Complete New Afton mill expansion
Rainy River and Blackwater regional exploration
Commence New Afton C-zone permitting process
Blackwater permitting
Complete C-zone feasibility study
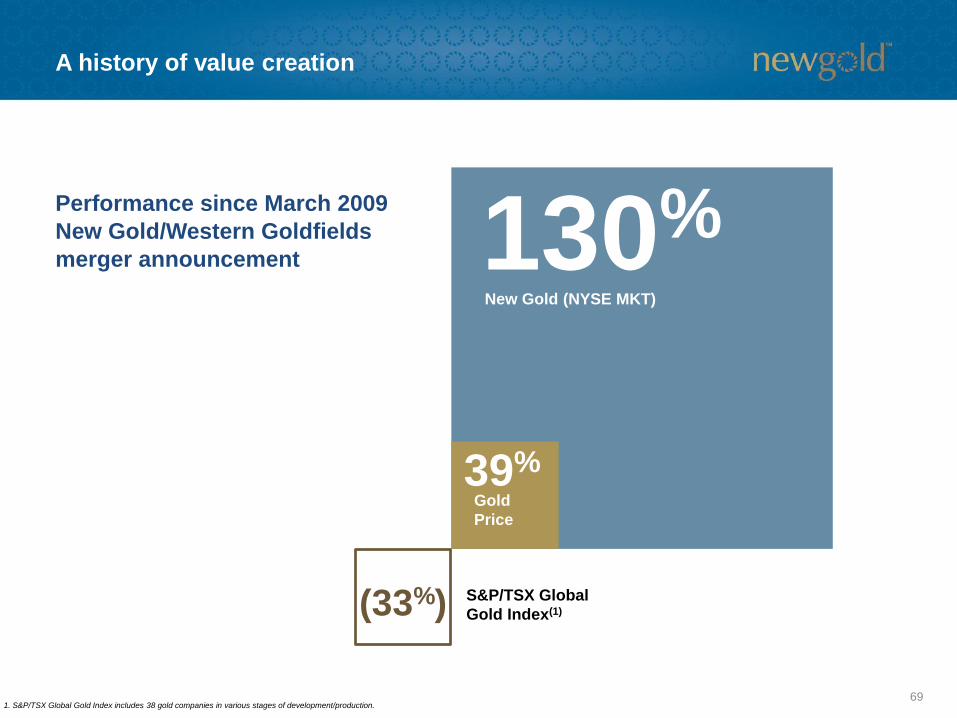
A history of value creation
Performance since March 2009
New Gold/Western Goldfields
merger announcement
69
S&P/TSX Global
Gold Index(1)
Gold
Price
New Gold (NYSE MKT)
1. S&P/TSX Global Gold Index includes 38 gold companies in various stages of development/production.
130%
39%
(33%)
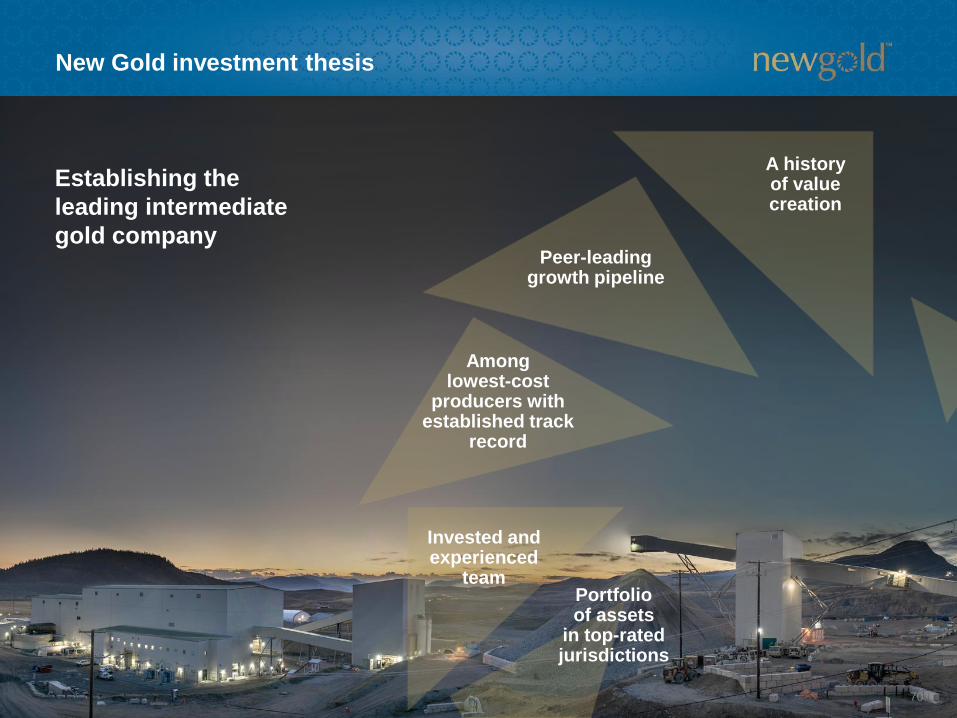
New Gold investment thesis
70
A history of value creation
Peer-leading growth pipeline
Amonglowest-cost
producers with established track
record
Invested and experienced
teamPortfolio of assets
in top-ratedjurisdictions
Establishing the
leading intermediate
gold company

Appendices
71
Appendices
Page
1. Reserves and resources notes 73
2. Commodity price/foreign exchange assumptions 81

721. 2013 information per Annual Information Form dated March 28, 2014.
Reserves and resources summaryAppendix 1
Gold
Koz
Silver
Moz
Copper
Mlbs
Gold
Koz
Silver
Moz
Copper
Mlbs
Proven and probable reserves 17,646 82 2,821 18,538 90 2,953
New Afton 760 3 781 879 4 904
Mesquite 1,679 - - 2,237 - -
Peak Mines 375 1 89 412 1 98
Cerro San Pedro 215 8 - 392 16 -
Ra iny River 3,772 9 - 3,773 9 -
Blackwater 8,170 61 - 8,170 61 -
El Morro (30%) 2,675 - 1,951 2,675 - 1,951
Measured and indicated resources (exclusive of reserves) 7,807 36 1,728 9,134 35 1,552
Inferred resources 3,597 21 1,746 4,161 30 1,820
MINERAL RESERVES AND RESOURCES SUMMARY TABLE AS AT DECEMBER 31, 2014
As at December 31, 2014 As at December 31, 2013

73
Reserves and resources summary (cont’d)Appendix 1
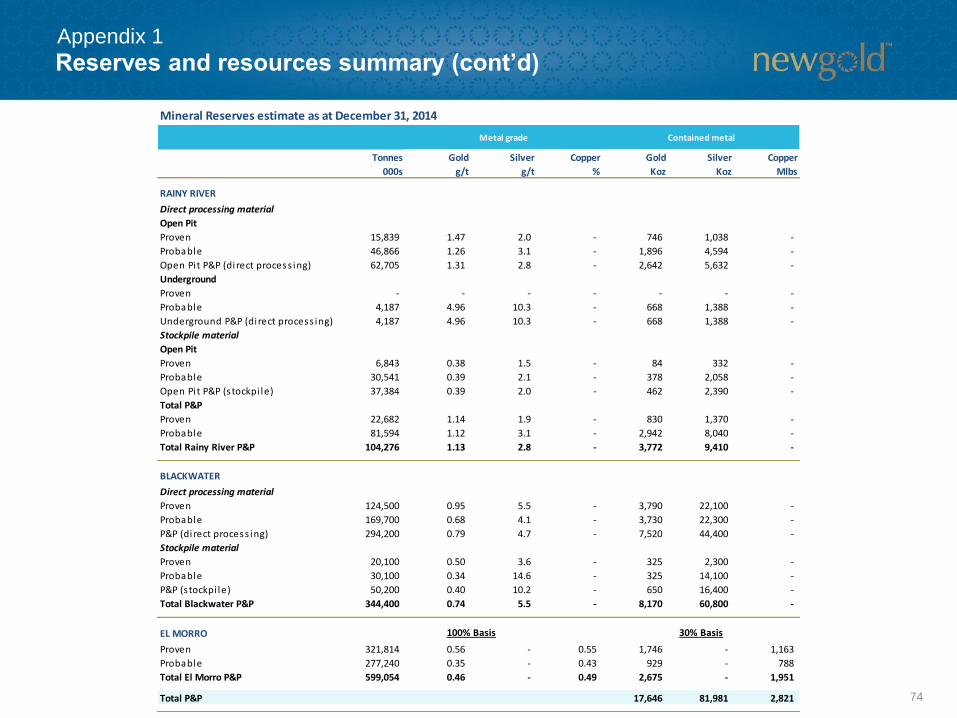
Mineral Reserves estimate as at December 31, 2014
Tonnes
000s
Gold
g/t
Silver
g/t
Copper
%
Gold
Koz
Silver
Koz
Copper
Mlbs
NEW AFTON
Proven - - - - - - -
Probable 42,026 0.56 2.3 0.84 760 3,119 781
Total New Afton P&P 42,026 0.56 2.3 0.84 760 3,119 781
MESQUITE
Proven 16,330 0.48 - - 250 - -
Probable 77,392 0.57 - - 1,429 - -
Total Mesquite P&P 93,722 0.56 - - 1,679 - -
PEAK MINES
Proven 1,520 4.35 7.2 1.21 213 351 41
Probable 1,800 2.79 6.5 1.23 162 377 49
Total Peak Mines P&P 3,330 3.51 6.8 1.22 375 728 89
CERRO SAN PEDRO
Proven 4,616 0.55 18.8 - 82 2,798 -
Probable 7,514 0.55 21.2 - 133 5,126 -
Total CSP P&P 12,130 0.55 20.3 - 215 7,924 -
Metal grade Contained metal
74
Reserves and resources summary (cont’d)Appendix 1
Mineral Reserves estimate as at December 31, 2014
Tonnes
000s
Gold
g/t
Silver
g/t
Copper
%
Gold
Koz
Silver
Koz
Copper
Mlbs
RAINY RIVER
Direct processing material
Open Pit
Proven 15,839 1.47 2.0 - 746 1,038 -
Probable 46,866 1.26 3.1 - 1,896 4,594 -
Open Pi t P&P (direct process ing) 62,705 1.31 2.8 - 2,642 5,632 -
Underground
Proven - - - - - - -
Probable 4,187 4.96 10.3 - 668 1,388 -
Underground P&P (direct process ing) 4,187 4.96 10.3 - 668 1,388 -
Stockpile material
Open Pit
Proven 6,843 0.38 1.5 - 84 332 -
Probable 30,541 0.39 2.1 - 378 2,058 -
Open Pi t P&P (s tockpi le) 37,384 0.39 2.0 - 462 2,390 -
Total P&P
Proven 22,682 1.14 1.9 - 830 1,370 -
Probable 81,594 1.12 3.1 - 2,942 8,040 -
Total Rainy River P&P 104,276 1.13 2.8 - 3,772 9,410 -
BLACKWATER
Direct processing material
Proven 124,500 0.95 5.5 - 3,790 22,100 -
Probable 169,700 0.68 4.1 - 3,730 22,300 -
P&P (direct process ing) 294,200 0.79 4.7 - 7,520 44,400 -
Stockpile material
Proven 20,100 0.50 3.6 - 325 2,300 -
Probable 30,100 0.34 14.6 - 325 14,100 -
P&P (s tockpi le) 50,200 0.40 10.2 - 650 16,400 -
Total Blackwater P&P 344,400 0.74 5.5 - 8,170 60,800 -
EL MORRO
Proven 321,814 0.56 - 0.55 1,746 - 1,163
Probable 277,240 0.35 - 0.43 929 - 788
Total El Morro P&P 599,054 0.46 - 0.49 2,675 - 1,951
Total P&P 17,646 81,981 2,821
Metal grade Contained metal
100% Basis 30% Basis
75
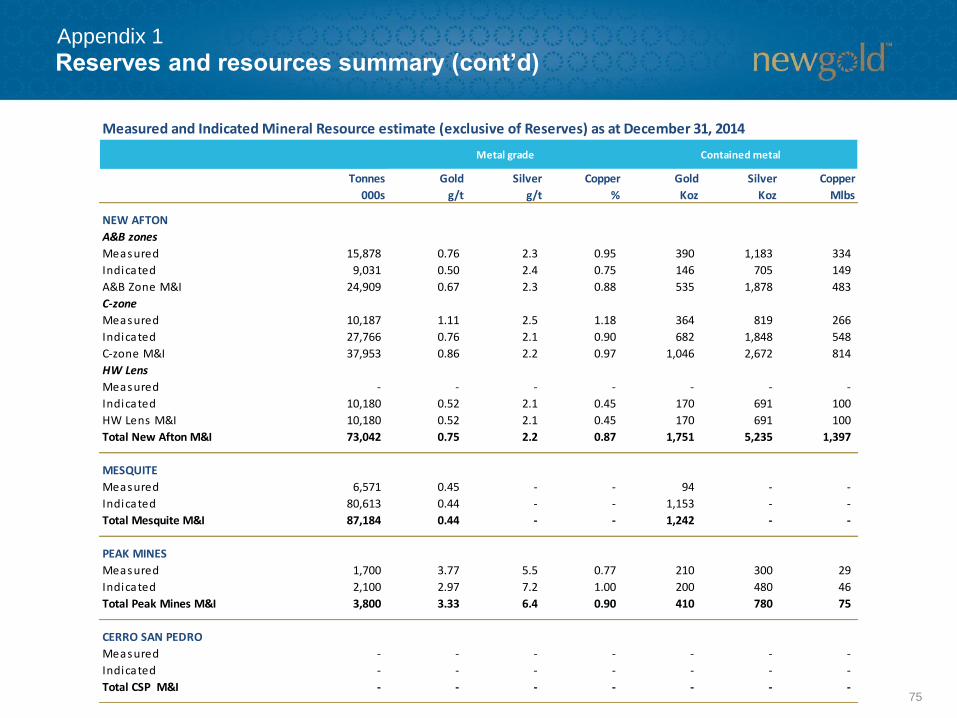
Reserves and resources summary (cont’d)Appendix 1
Measured and Indicated Mineral Resource estimate (exclusive of Reserves) as at December 31, 2014
Tonnes
000s
Gold
g/t
Silver
g/t
Copper
%
Gold
Koz
Silver
Koz
Copper
Mlbs
NEW AFTON
A&B zones
Measured 15,878 0.76 2.3 0.95 390 1,183 334
Indicated 9,031 0.50 2.4 0.75 146 705 149
A&B Zone M&I 24,909 0.67 2.3 0.88 535 1,878 483
C-zone
Measured 10,187 1.11 2.5 1.18 364 819 266
Indicated 27,766 0.76 2.1 0.90 682 1,848 548
C-zone M&I 37,953 0.86 2.2 0.97 1,046 2,672 814
HW Lens
Measured - - - - - - -
Indicated 10,180 0.52 2.1 0.45 170 691 100
HW Lens M&I 10,180 0.52 2.1 0.45 170 691 100
Total New Afton M&I 73,042 0.75 2.2 0.87 1,751 5,235 1,397
MESQUITE
Measured 6,571 0.45 - - 94 - -
Indicated 80,613 0.44 - - 1,153 - -
Total Mesquite M&I 87,184 0.44 - - 1,242 - -
PEAK MINES
Measured 1,700 3.77 5.5 0.77 210 300 29
Indicated 2,100 2.97 7.2 1.00 200 480 46
Total Peak Mines M&I 3,800 3.33 6.4 0.90 410 780 75
CERRO SAN PEDRO
Measured - - - - - - -
Indicated - - - - - - -
Total CSP M&I - - - - - - -
Metal grade Contained metal

76
Reserves and resources summary (cont’d)Appendix 1
Measured and Indicated Mineral Resource estimate (exclusive of Reserves) as at December 31, 2014
Tonnes
000s
Gold
g/t
Silver
g/t
Copper
%
Gold
Koz
Silver
Koz
Copper
Mlbs
RAINY RIVER
Direct processing material
Open Pit
Measured 3,288 1.39 1.8 - 146 189 -
Indicated 32,742 1.37 2.7 - 1,441 2,832 -
Open Pi t M&I (di rect process ing) 36,030 1.37 2.6 - 1,587 3,021 -
Underground
Measured 79 4.96 2.8 - 13 7 -
Indicated 4,750 4.12 8.5 - 629 1,302 -
Underground M&I (di rect process ing) 4,829 4.13 8.4 - 642 1,309 -
Stockpile material
Open Pit
Measured 1,158 0.37 1.1 - 14 42 -
Indicated 29,630 0.45 2.2 - 431 2,056 -
Open Pi t M&I (s tockpi le) 30,788 0.45 2.1 - 445 2,098 -
Total M&I
Measured 4,525 1.19 1.6 - 173 238 -
Indicated 67,122 1.16 2.9 - 2,501 6,190 -
Total Rainy River M&I 71,647 1.16 2.8 - 2,674 6,428 -
BLACKWATER
Direct processing material
Measured - - - - - - -
Indicated 11,102 2.23 35.5 - 797 12,670 -
M&I (di rect process ing) 11,102 2.23 35.5 - 797 12,670 -
Stockpile material
Measured - - - - - - -
Indicated 32,615 0.26 - - 273 - -
M&I (s tockpi le) 32,615 0.26 - - 273 - -
Total Blackwater M&I 43,717 0.76 5.2 - 1,071 12,670 -
CAPOOSE
Indicated 16,071 0.57 21.7 - 293 11,233 -
EL MORRO
Measured 19,790 0.53 - 0.51 102 - 67
Indicated 72,563 0.38 - 0.39 265 - 189
Tota l El Morro M&I 92,353 0.41 - 0.42 366 - 256
Total M&I 7,807 36,346 1,728
100% Basis 30% Basis
Metal grade Contained metal

77
Reserves and resources summary (cont’d)Appendix 1
Inferred Resource estimate as at December 31, 2014
Tonnes
000s
Gold
g/t
Silver
g/t
Copper
%
Gold
Koz
Silver
Koz
Copper
Mlbs
NEW AFTON
A&B-zones 6,154 0.35 1.4 0.37 69 269 50
C-zone 6,965 0.47 1.5 0.53 105 329 82
HW Lens 966 0.69 1.5 0.46 21 45 10
Total New Afton Inferred 14,085 0.43 1.4 0.46 195 643 142
MESQUITE 6,619 0.33 - - 70 - -
PEAK MINES 1,600 1.77 6.2 1.33 92 320 47
CERRO SAN PEDRO 199 0.56 19.1 - 4 122 -
RAINY RIVER
Direct processing
Open Pit 8,096 0.90 1.8 - 233 464 -
Underground 2,738 4.33 8.6 - 381 757 -
Total Direct Process ing 10,834 1.77 3.5 - 614 1,221 -
Stockpile
Open Pit 7,726 0.37 1.1 - 91 270 -
Total Rainy River Inferred 18,560 1.18 2.5 - 705 1,491 -
BLACKWATER
Direct process ing 10,485 0.79 3.6 - 265 1,201 -
Stockpi le 2,939 0.31 3.6 - 29 341 -
Total Blackwater Inferred 13,424 0.68 3.6 - 294 1,542 -
CAPOOSE 19,776 0.48 26.2 - 302 16,670 -
El MORRO
El Morro - Open Pi t 564,217 0.16 - 0.26 871 - 970
El Morro - Underground 113,840 0.97 - 0.78 1,065 - 587
Total Inferred 3,597 20,788 1,746
100% Basis 30% Basis
Metal grade Contained metal

78
1) New Gold’s mineral reserves have been estimated in accordance with the Canadian Institute of Mining, Metallurgy and Petroleum (“CIM”) Definition Standards for Mineral Resources and
Mineral Reserves adopted by CIM Council on May 10, 2014 and incorporated by reference in National Instrument 43-101 (“NI 43-101”).
2) For year-end 2014 mineral reserves for the Company’s mineral properties have been estimated based on the following metal prices and lower cut-off criteria:
Mineral Property Gold
(US$/oz)
Silver
(US$/oz)
Copper
(US$/lb)
Lower Cut-off
New Afton $1,200 $18.00 $3.00 US$21.00/t Main zone, US$24/t B3
Mesquite $1,200 - - 0.21 g/t Au – Oxide and transition reserves
0.41 g/t Au – Non-oxide reserves
Peak Mines $1,200 $18.00 $3.00 A$88 – 133/t NSR
Cerro San Pedro $1,200 $18.00 - US$4.00/t
Rainy River $1,200 $18.00 - Open Pit Direct Processing: 0.3 – 0.7 g/t AuEq
Open Pit Stockpile: 0.30 g/t AuEq
Underground: 3.5 g/t AuEq
Blackwater $1,200 $18.00 - Direct processing: 0.26 – 0.38 g/t AuEq
Stockpile: 0.32 g/t AuEq
El Morro $1,300 - $3.00 0.20% CuEq
Reserves and resources notesAppendix 1

79
3) New Gold reports its measured and indicated mineral resources exclusive of mineral reserves. Measured and indicated mineral resources that are not mineral reserves do not have
demonstrated economic viability. Inferred mineral resources have a greater amount of uncertainty as to their existence, economic and legal feasibility, do not have demonstrated economic
viability, and are likewise exclusive of mineral reserves.
4) For year-end 2014 mineral resources for the Company’s mineral properties have been estimated based on the following metal prices and lower cut-off criteria:
5) Mineral resources are classified as measured, indicated and inferred resources and are reported based on technical and economic parameters consistent with the methods most suitable
for their potential commercial exploitation. Where different mining and/or processing methods might be applied to different portions of a mineral resource, the designators ‘open pit’ and
‘underground’ have been applied to indicate envisioned mining method. Likewise the designators ‘oxide’, ‘non-oxide’ and ‘sulphide’ have been applied to indicate the type of mineralization
as it relates to appropriate mineral processing method and expected payable metal recoveries. Mineral reserves and mineral resources may be materially affected by environmental,
permitting, legal, title, taxation, sociopolitical, marketing and other risks and relevant issues. Additional details regarding mineral reserve and mineral resource estimation, classification,
reporting parameters, key assumptions and associated risks for each of New Gold’s material properties are provided in the respective NI 43-101 Technical Reports which are available at
www.sedar.com.
6) Qualified Person: The preparation of New Gold's mineral reserve and mineral resource estimates has been done by Qualified Persons as defined under NI 43-101, under the oversight
and review of Mr. Mark A. Petersen, a Qualified Person under NI 43-101.
Mineral Property Gold
(US$/oz)
Silver
(US$/oz)
Copper
(US$/lb)
Lower Cut-off
New Afton $1,300 $20.00 $3.25 0.40% CuEq
Mesquite $1,300 - - 0.12 g/t Au – Oxide and transition resources
0.24 g/t Au – Non-oxide resources
Peak Mines $1,300 $20.00 $3.25 A$93 - 133/t NSR
Cerro San Pedro $1,300 $20.00 - 0.10 g/t AuEq – Open pit oxide resources
0.30 g/t AuEq – Open pit sulphide resources
Rainy River $1,300 $20.00 - Open Pit Direct Processing: 0.30 – 0.45 g/t AuEq
Open Pit Stockpile: 0.30 g/t AuEq
Underground: 2.5 g/t AuEq
Blackwater $1,300 $20.00 - Direct processing: 0.40 g/t AuEq
Stockpile: 0.30 – 0.40 g/t AuEq
Capoose $1,300 $20.00 - 0.40 g/t AuEq
El Morro $1,500 - $3.50 0.20% CuEq
Reserves and resources notes (cont’d)Appendix 1

80
2015 guidance assumptions
Spot:
2015
Gold price ($/oz) 1,200
Silver price ($/oz) 16.00
Copper price ($/lb) 2.75
AUD/USD 1.25
CDN/USD 1.25
MXN/USD 15.00
Spot
Gold price ($/oz) 1,270
Silver price ($/oz) 17.25
Copper price ($/lb) 2.60
AUD/USD 1.28
CDN/USD 1.25
MXN/USD 14.70
Commodity price/foreign exchange assumptionsAppendix 2

Endnotes
81
CAUTIONARY NOTE TO U.S. READERS CONCERNING ESTIMATES OF MINERAL RESERVES AND MINERAL RESOURCES
Information concerning the properties and operations of New Gold has been prepared in accordance with Canadian standards under applicable Canadian securities laws, and may not be
comparable to similar information for United States companies. The terms “Mineral Resource”, “Measured Mineral Resource”, “Indicated Mineral Resource” and “Inferred Mineral Resource”
used in this presentation are Canadian mining terms as defined in the Canadian Institute of Mining, Metallurgy and Petroleum (“CIM”) Definition Standards for Mineral Resources and Mineral
Reserves adopted by CIM Council on May 10, 2014 and incorporated by reference in National Instrument 43-101 (“NI 43-101”). While the terms “Mineral Resource”, “Measured Mineral
Resource”, “Indicated Mineral Resource” and “Inferred Mineral Resource” are recognized and required by Canadian securities regulations, they are not defined terms under standards of the
United States Securities and Exchange Commission. As such, certain information contained in this presentation concerning descriptions of mineralization and resources under Canadian
standards is not comparable to similar information made public by United States companies subject to the reporting and disclosure requirements of the United States Securities and Exchange
Commission.
An “Inferred Mineral Resource” has a great amount of uncertainty as to its existence and as to its economic and legal feasibility. Under Canadian rules, estimates of inferred mineral resources
may not form the basis of feasibility of pre-feasibility studies. It cannot be assumed that all or any part of an “Inferred Mineral Resource” will ever be upgraded to a higher confidence category.
Readers are cautioned not to assume that all or any part of an “Inferred Mineral Resource” exists or is economically or legally mineable.
Under United States standards, mineralization may not be classified as a “Reserve” unless the determination has been made that the mineralization could be economically and legally
produced or extracted at the time the reserve estimation is made. Readers are cautioned not to assume that all or any part of the measured or indicated mineral resources will ever be
converted into mineral reserves. In addition, the definitions of “Proven Mineral Reserves” and “Probable Mineral Reserves” under CIM standards differ in certain respects from the standards of
the United States Securities and Exchange Commission.
TECHNICAL INFORMATION
The scientific and technical information in this presentation has been reviewed and approved by Mark A. Petersen, Vice President, Exploration of New Gold. Mr. Petersen is an AIPG Certified
Professional Geologist and a “Qualified Person” under National Instrument 43-101.

Endnotes (cont’d)
82
NON-GAAP MEASURES
(1) ALL-IN SUSTAINING COSTS
Consistent with guidance announced in 2013 by the World Gold Council, an association of various gold mining companies from around the world of which New Gold is a member, New Gold
defines “all-in sustaining costs” per ounce as the sum of total cash costs, capital expenditures that are sustaining in nature, corporate general and administrative costs, capitalized and
expensed exploration that is sustaining in nature and environmental reclamation costs, all divided by the ounces of gold sold to arrive at a per ounce figure. New Gold believes this non-GAAP
financial measure provides further transparency into costs associated with producing gold and will assist analysts, investors and other stakeholders of the company in assessing the company’s
operating performance, its ability to generate free cash flow from current operations and its overall value. This data is furnished to provide additional information and is a non-GAAP financial
measure. All-in sustaining costs presented do not have a standardized meaning under IFRS and may not be comparable to similar measures presented by other mining companies. It should
not be considered in isolation or as a substitute for measures of performance prepared in accordance with IFRS and is not necessarily indicative of cash flow from operations under IFRS or
operating costs presented under IFRS. Further details regarding historical all-in sustaining costs and a reconciliation to the nearest IFRS measures are provided in the MD&A accompanying
New Gold’s financial statements filed from time to time on www.sedar.com.
(2) TOTAL CASH COSTS
“Total cash costs” per ounce figures are non-GAAP measures which are calculated in accordance with a standard developed by The Gold Institute, a worldwide association of suppliers of gold
and gold products that ceased operations in 2002. Adoption of the standard is voluntary and the cost measures presented may not be comparable to other similarly titled measures of other
companies. New Gold reports total cash costs on a sales basis. The company believes that certain investors use this information to evaluate the company’s performance and ability to
generate liquidity through operating cash flow to fund future capital expenditures and working capital needs. This measure, along with sales, is considered to be a key indicator of the
company’s ability to generate operating earnings and cash flow from its mining operations. Total cash costs include mine site operating costs such as mining, processing and administration
costs, royalties, production taxes, and realized gains and losses on fuel contracts, but are exclusive of amortization, reclamation, capital and exploration costs and net of by-product sales.
Total cash costs are then divided by ounces of gold sold to arrive at a per ounce figure. Co-product cash costs remove the impact of other metal sales that are produced as a by-product of
gold production and apportion the cash costs to each metal produced on a percentage of revenue basis, and subsequently divides the amount by the total ounces of gold or silver or pounds of
copper sold, as the case may be, to arrive at per ounce or per pound figures. Unless otherwise indicated, all total cash cost information in this presentation is net of by-product sales. This data
is furnished to provide additional information and is a non-GAAP financial measure. Total cash costs and co-product cash costs presented do not have a standardized meaning under IFRS
and may not be comparable to similar measures presented by other mining companies. It should not be considered in isolation or as a substitute for measures of performance prepared in
accordance with IFRS and is not necessarily indicative of cash flow from operations under IFRS or operating costs presented under GAAP. Further details regarding historical total cash costs
and a reconciliation to the nearest IFRS measures are provided in the MD&A accompanying New Gold’s financial statements filed from time to time on www.sedar.com.
(3) AVERAGE REALIZED PRICE
“Average realized price per ounce or pound sold” is a non-GAAP financial measure with no standard meaning under IFRS. Management uses this measure to better understand the price
realized in each reporting period for gold, silver, and copper sales. Average realized price includes realized gains and losses from gold hedge settlements up until May 15, 2013 but excludes
from revenues unrealized gains and losses on non-hedged derivative contracts and the revenue reduction related to the non-cash accounting charge as the loss incurred on the monetization
of the company’s legacy hedge position is realized into income over the original term of the hedge contract. Average realized price is intended to provide additional information only and does
not have any standardized definition under IFRS; it should not be considered in isolation or as a substitute for measures of performance prepared in accordance with IFRS. Other companies
may calculate this measure differently and this measure is unlikely to be comparable to similar measures presented by other companies.
(4) MARGIN
“Margin” is a non-GAAP financial measure with no standard meaning under IFRS, which management uses to further evaluate the Company’s results of operations in each reporting period.
Margin per ounce is equal to the realized gold price per ounce less costs (being total cash costs or all-in sustaining costs, as the case may be) per ounce. Margin is intended to provide
additional information only and does not have any standardized definition under IFRS; it should not be considered in isolation or as a substitute for measures of performance prepared in
accordance with IFRS. Other companies may calculate this measure differently and this measure is unlikely to be comparable to similar measures presented by other companies.

Contact information
83
Investor Relations
Hannes Portmann
Vice President, Corporate Development
416-324-6014