Fourth Quarter 2018 First Quarter 2021 - ECN Capital
40
Q1-2021 FINANCIAL RESULTS May 12, 2021 Fourth Quarter 2018 Financial Results First Quarter 2021 Financial Results FINANCIAL INDUSTRY SOLUTIONS $33B Managed & Advised Credit Portfolios 100+ US Financial Partners
Transcript of Fourth Quarter 2018 First Quarter 2021 - ECN Capital
Q1-2021 FINANCIAL RESULTS
May 12, 2021
Fourth Quarter 2018Financial ResultsFirst Quarter 2021Financial Results
FINANCIAL INDUSTRY SOLUTIONS
$33BManaged &
Advised Credit
Portfolios
100+US Financial
Partners

Q1-2021 FINANCIAL RESULTS
2
Disclaimer
Certain information in this presentation is forward-looking and related to anticipated financial performance, events and
strategies. When used in this context, words such as “will”, “anticipate”, “believe”, “plan”, “intend”, “target” and “expect” or
similar words suggest future outcomes. Forward-looking statements relate to, among other things, ECN Capital Corp.’s (“ECN
Capital”) objectives and strategy; future cash flows, financial condition, operating performance, financial ratios, projected
asset base and capital expenditures; anticipated cash needs, capital requirements and need for and cost of additional
financing; future assets; demand for services; ECN Capital’s competitive position; expected growth in originations; and
anticipated trends and challenges in ECN Capital’s business and the markets in which it operates; and the plans, strategies and
objectives of ECN Capital for the future.
The forward-looking information and statements contained in this presentation reflect several material factors and expectations
and assumptions of ECN Capital including, without limitation: that ECN Capital will conduct its operations in a manner consistent
with its expectations and, where applicable, consistent with past practice; ECN Capital’s continued ability to successfully
execute on its strategic transition; the general continuance of current or, where applicable, assumed industry conditions; the
continuance of existing (and in certain circumstances, the implementation of proposed) tax and regulatory regimes; certain
cost assumptions; the continued availability of adequate debt and/or equity financing and cash flow to fund its capital and
operating requirements as needed; and the extent of its liabilities. ECN Capital believes the material factors, expectations and
assumptions reflected in the forward-looking information and statements are reasonable but no assurance can be given that
these factors, expectations and assumptions will prove to be correct.
By their nature, such forward-looking information and statements are subject to significant risks and uncertainties, which could
cause the actual results and experience to be materially different than the anticipated results. Such risks and uncertainties
include, but are not limited to, operating performance, regulatory and government decisions, competitive pressures and the
ability to retain major customers, rapid technological changes, availability and cost of financing, availability of labor and
management resources, the performance of partners, contractors and suppliers.
Readers are cautioned not to place undue reliance on forward-looking statements as actual results could differ materially from
the plans, expectations, estimates or intentions expressed in the forward-looking statements. Except as required by law, ECN
Capital disclaims any intention and assumes no obligation to update any forward-looking statement, whether as a result of new
information, future events or otherwise.
2

Q1-2021 FINANCIAL RESULTS
3
Disclaimer
ECN Capital’s condensed unaudited interim consolidated financial statements have been prepared in accordance with
International Financial Reporting Standards (“IFRS”) as issued by the International Accounting Standards Board and the
accounting policies we adopted in accordance with IFRS. In this presentation, management has used certain terms, including
adjusted operating income before tax, adjusted operating income after tax, adjusted operating income after tax EPS and
managed assets, which do not have a standardized meaning under IFRS and are unlikely to be comparable to similar measures
presented by other organizations. ECN Capital believes that certain non-IFRS Measures can be useful to investors because they
provide a means by which investors can evaluate ECN Capital’s underlying key drivers and operating performance of the
business, exclusive of certain adjustments and activities that investors may consider to be unrelated to the underlying economic
performance of the business of a given period. Throughout this presentation, management used a number of terms and ratios
which do not have a standardized meaning under IFRS and are unlikely to be comparable to similar measures presented by
other organizations. A full description of these measures can be found in the Management Discussion & Analysis that
accompanies the financial statements for the three-month period ended March 31, 2021. Disclosures related to Covid-19 can
be found in ECN Capital’s Management Discussion & Analysis for the three-month period ended March 31, 2021 and are
incorporated herein by reference. ECN Capital’s management discussion and analysis for the three-month period ended
March 31, 2021 has been filed on SEDAR (www.sedar.com) and is available under the investor section of the ECN Capital’s
website (www.ecncapitalcorp.com).
This presentation and, in particular the information in respect of ECN Capital’s prospective originations, revenues, operating
income, adjusted operating income, and adjusted operating income EPS may contain future oriented financial information
(“FOFI”) within the meaning of applicable securities laws. The FOFI has been prepared by management to provide an outlook
on ECN Capital’s proposed activities and potential results and may not be appropriate for other purposes. The FOFI has been
prepared based on a number of assumptions, including the assumptions discussed above, and assumptions with respect to
operating costs, foreign exchange rates, general and administrative expenses and expected originations growth. ECN Capital
and management believe that the FOFI has been prepared on a reasonable basis, reflecting management’s best estimates
and judgments, however, the actual results of operations of ECN Capital and the resulting financial results may vary from the
amounts set forth herein and such variations may be material. FOFI contained in this presentation was made as of the date of
this presentation and ECN Capital disclaims any intention or obligation to update or revise any FOFI contained in this
presentation, whether as a result of new information, future events or otherwise, unless required pursuant to applicable law.
3

Q1-2021 FINANCIAL RESULTS
4
Call Agenda
BUSINESS OVERVIEW
OPERATING HIGHLIGHTS
Business Services
• Service Finance
• Triad Financial Services
• The Kessler Group
CONSOLIDATED FINANCIAL SUMMARY
CLOSING SUMMARY
QUESTIONS
4

Q1-2021 FINANCIAL RESULTS
5
BUSINESS OVERVIEW
5

Q1-2021 FINANCIAL RESULTS
Origination &
Management Services for
Financial Institutions
30+ Years Commercial
finance experience
$33B Managed
credit portfolios
100+ Financial
institution partners
Investment grade rated
Origination & Management
of Prime
Home Improvement Loans
2004 Founded
$3B Managed credit
portfolios
25+ Bank, life
Insurance, pension & credit
union partners
13,000+ Network of
home improvement
dealers
Origination & Management
of Prime Manufactured
Housing Loans
1959 Founded
$2B+ Managed credit
portfolios
50+ Bank and
Credit union partners
3,000+ Network of
manufactured housing
dealers
Origination & Advisory
Services for
Credit Card Portfolios
1978 Founded
$27B Managed
credit card portfolios
25+ Financial
Institution partners
6,000+ Credit card
partnerships created
Business Overview
6
Q1-2021 FINANCIAL RESULTS
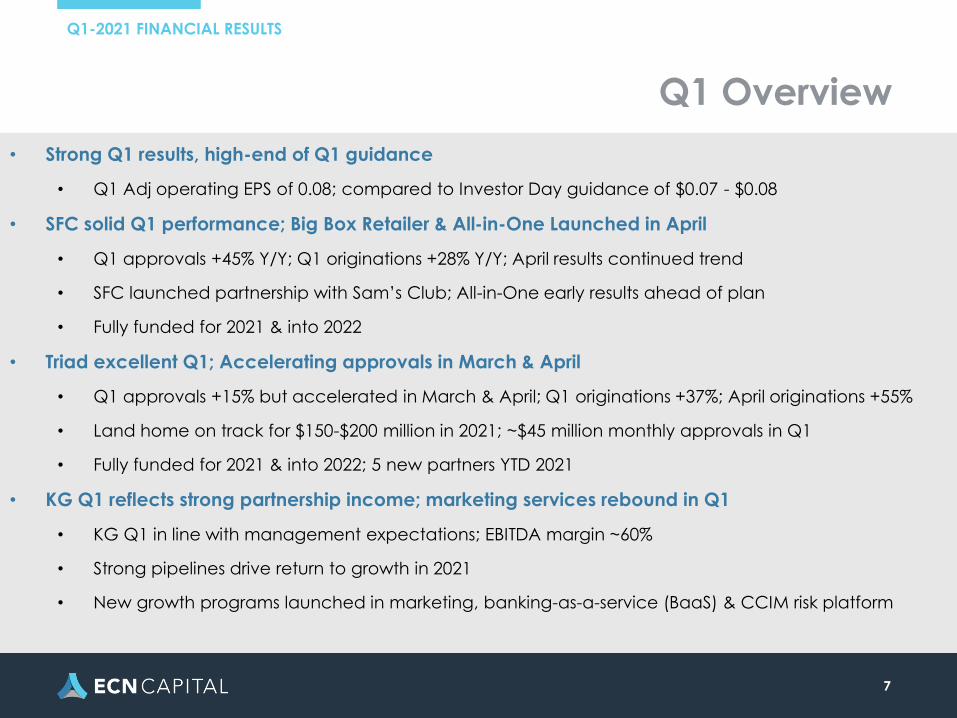
Q1 Overview
• Strong Q1 results, high-end of Q1 guidance
• Q1 Adj operating EPS of 0.08; compared to Investor Day guidance of $0.07 - $0.08
• SFC solid Q1 performance; Big Box Retailer & All-in-One Launched in April
• Q1 approvals +45% Y/Y; Q1 originations +28% Y/Y; April results continued trend
• SFC launched partnership with Sam’s Club; All-in-One early results ahead of plan
• Fully funded for 2021 & into 2022
• Triad excellent Q1; Accelerating approvals in March & April
• Q1 approvals +15% but accelerated in March & April; Q1 originations +37%; April originations +55%
• Land home on track for $150-$200 million in 2021; ~$45 million monthly approvals in Q1
• Fully funded for 2021 & into 2022; 5 new partners YTD 2021
• KG Q1 reflects strong partnership income; marketing services rebound in Q1
• KG Q1 in line with management expectations; EBITDA margin ~60%
• Strong pipelines drive return to growth in 2021
• New growth programs launched in marketing, banking-as-a-service (BaaS) & CCIM risk platform
7

Guidance
Adjusted Net Income (US$ millions) 2021
Service Finance $100 $108
Kessler $46 $52
Triad $39 $44
Continuing Ops Adj Op Income before Tax $185 $204
Corporate operating expenses ($22) ($23)
Corporate depreciation ($4) ($4)
Corporate interest ($16) ($16)
Adjusted operating income before tax $143 $161
Tax ($22) ($28)
Adjusted net income $121 $133
Preferred Dividends ($8) ($9)
Adjusted net income (after pfds) $113 $124
EPS US$1 $0.46 $0.51
KEY HIGHLIGHTS
• Reiterate 2021 Adj EPS guidance range of $0.46-$0.51 announced at Investor Day; growth of ~50% at the midpoint
• Reiterate 2022 Adj EPS guidance range of $0.55 - $0.64; growth of ~20% at the midpoint
• Estimated ROE improves to ~20%+ in 2022
• As previously discussed, we will update 2021 & 2022 guidance in Q2
1. 2021 & 2022 assumes 245 million shares; May not add due to rounding
8
9.0%11.0%
16.5%
19.5%
0.0%
5.0%
10.0%
15.0%
20.0%
25.0%
2019 2020 2021E 2022E
18.5%
23.0%
Q1-2021 FINANCIAL RESULTS
RETURN ON EQUITY1
Adjusted Operating Income/Common Equity

Q1-2021 FINANCIAL RESULTS
9
OPERATING HIGHLIGHTS
◦ Service Finance
◦ Triad Financial Services
◦ The Kessler Group
9

Q1-2021 FINANCIAL RESULTS
10
Highlights
10
• Adjusted operating income before tax in Q1 of $18.0 million; up 20% Y/Y
• 28% Q1 Y/Y growth in originations
• 27% Q1 Y/Y growth in managed portfolios
• SFC fully funded through 2021 and into 2022
• SFC continued to experience above average dealer growth YTD
• Continued market share gains
• Attractive new programs such as Big-Box
Retailer & All-In-One will drive above average dealer adds
Select Metrics (US$, 000s)
Q12021
Q12020
Originations 479.8 375.6
Period end managed portfolios 3,387.1 2,659.9
Originations revenue 14.6 9.9
Servicing & other revenue 16.9 16.2
Revenue 31.5 26.1
Adjusted EBITDA 19.5 15.9
Adjusted operating income before tax 18.0 15.0

Q1-2021 FINANCIAL RESULTS
11
Consistent Performance
11
• Consistent price, process, programs & partnerships drives satisfaction across constituents
• Superior model – “take & make share”
• Take Share: SFC has taken significant share from existing lenders across verticals over several years
• Make Share: Continue to add new
manufacturers across verticals
• Dealer base CAGR ~23%+ since investment
• $ Billions incremental demand from funding partners
• Fully funded into 2022
500
700
900
1,100
1,300
1,500
1,700
1,900
2,100
2,300
Q4/1
7
Q1/1
8
Q2/1
8
Q3/1
8
Q4/1
8
Q1/1
9
Q2/1
9
Q3/1
9
Q4/1
9
Q1/2
0
Q2/2
0
Q3/2
0
Q4/2
0
Q1/2
1
Consistent, Strong Trends Regardless of Market Environment
500
1,000
1,500
2,000
2,500
3,000
3,500
Q4/1
7
Q1/1
8
Q2/1
8
Q3/1
8
Q4/1
8
Q1/1
9
Q2/1
9
Q3/1
9
Q4/1
9
Q1/2
0
Q2/2
0
Q3/2
0
Q4/2
0
Q1/2
1
TRAILING 12-MONTH ORIGINATIONSSince ECN Investment (US$ millions)
SERVICING PORTFOLIOSince ECN Investment (US$ millions)

Q1-2021 FINANCIAL RESULTS
12
Home Improvement Industry
12
• In March 2021, HIRI1 made significant upward revisions to projections for 2021-2024
• Now expect incremental ~$254B of home improvement spending through 2024
• Incremental ~$100B within the professional contractor segment
• HIRI estimates do not account for labor, understating total spend
• Post-Covid, demand increased as homeowners focus on larger projects that require professional contractors in the home
• Additionally, manufacturers and dealers have recently noted price increases on materials which also drives higher job costs
$425
$475
$525
$575
2020 2021E 2022E 2023E 2024E
TOTAL HOME IMPROVEMENT MARKET2
(US$ Billions)
Prior Forecast Current Forecast
$120
$140
$160
$180
2020 2021E 2022E 2023E 2024E
PROFESSIONAL MARKET2
(US$ Billions)
Prior Forecast Current Forecast1. Home Improvement Research Institute; www.hiri.org2. HIRI estimates do not include labor costs

Q1-2021 FINANCIAL RESULTS
13
Q1 Program Update
13
• +28% total origination growth for Q1 Y/Y; +49% Y/Y excluding solar
• HVAC originations +42% Y/Y in Q1 ; Lennox volume +35% Y/Y in Q1
• Windows & doors originations +64% in Q1 Y/Y
• Solar originations down ~75% Y/Y in Q1; only ~3% of Q1 originations
• Approvals and originations momentum accelerating as we approach the busy season
• Q1 approvals +45% Y/Y; April approvals +49% Y/Y
• April originations +52% Y/Y
2021 vs 2020 Monthly Growth Y/Y
Jan Feb Mar Apr
Approvals +25.8% +30.3% +74.3% +48.6%
Originations +17.2% +21.0% +43.7% +52.1%

Backlog by Product
1 Backlog assumes ~70% of existing approvals from prior 6 months not already completed will fund
56.8%
142.2%
116.5%
90.5%
0.0%
20.0%
40.0%
60.0%
80.0%
100.0%
120.0%
140.0%
160.0%
HVAC Window & Doors Roofing Remodeling
• Backlog reflects approved financings that are likely to close
• HVAC, windows & doors, roofing and remodeling represent more than 80% of total originations YTD
• March 2021 backlog is up ~107% Y/Y across these product segments combined
• Equates to ~$275M million in originations expected to close in 2021
• Backlog ~$311M in April 2021
14
Y/Y BACKLOG1 GROWTH BY PRODUCTAs of March 2021
Q1-2021 FINANCIAL RESULTS

15
Big Box Retailer
15
BIG BOX RETAILER
• Big box retail program launched with Sam’s
Club in April 2021
• www.homeinstallexperts.com
• Service Finance has entered into an
agreement with Sam’s Club to administer a
home improvement services program
• Service Finance will facilitate:
• the marketing, sale, and provision of
home improvement products and
services; and
• the marketing and provision of loan
services to Sam’s Club members by SFC
authorized dealers.
• Service Finance will leverage its existing dealer
network to fulfill member requests for a myriad
of home improvement projects such as HVAC,
Roofing, Windows & Doors, etc.
Q1-2021 FINANCIAL RESULTS

New Program Update
Daltile – “Make-share”
• Announced an exclusive partnership with Daltile (subsidiary of Mohawk Industries, world’s largest flooring company) to offer an installment financing program to Daltile partners
• Daltile is the country's leading manufacturer and distributor of porcelain tile, ceramic tile and natural stone. One out of 3 tiles sold in America is a Dal-Tile product
PREVIOUSLY ANNOUNCED PROGRAMS
• All-in-One – Launched in Q2; Encouraged by early results – update in H2
• Commercial – Expect summer launch
16
Q1-2021 FINANCIAL RESULTS
https://www.daltile.com/offer?interest=universal&utm_source=google&utm_medium=cpc&utm_campaign=stmt-2020-pp1&utm_term=univ&utm_content=ad4&gclid=Cj0KCQjwp86EBhD7ARIsAFkgakhehAOsrCBstMVk5R04kBSr6hhGW2X05Yc3IRn2BU4MJZ6JTmFeu4waAv7VEALw_wcB
NEW PROGRAM ANNOUNCEMENTS

Q1-2021 FINANCIAL RESULTS
17
Held-for-Trading Asset Update
17
• Held-for-trading (“HFT”) assets temporarily increased to ~$152 million in Q1 2021 from ~$93 million in Q4 2020
• Increase driven by ~$59 million in originations of complementary flow, which are regularly accumulated and sold via bulk sales
• Subsequent to quarter-end, SFC executed a portfolio sale totaling ~$137 million to an existing partner
• Current HFT balance of ~$53 million down ~$100 million from quarter end
HELD-FOR-TRADING FINANCIAL ASSETS(US$, millions)

18
Partner Portfolio Credit Trends
18
• Performance of servicing portfolio reflects prime and super-prime customer base and sound underwriting practices
• 30+ delinquency rates continue to outperform competitors and remain well within historical ranges
• 0.53% in 30+ delinquency in March 2021 is the lowest since August 2018 and at the low end of historical ranges
• Loan losses have remained consistent with expectations
• Immaterial Covid deferrals0.00%
0.25%
0.50%
0.75%
1.00%
1.25%
1.50%
Se
p-1
7
De
c-1
7
Ma
r-18
Ju
n-1
8
Se
p-1
8
De
c-1
8
Ma
r-19
Jun
-19
Se
p-1
9
De
c-1
9
Ma
r-20
Ju
n-2
0
Se
p-2
0
De
c-2
0
Ma
r-21
Q1-2021 FINANCIAL RESULTS
30+ DELINQUENCY

Q1-2021 FINANCIAL RESULTS
Originations
ORIGINATIONS1
(US$, millions)YOY ORIGINATION GROWTH1
1Q 2Q 3Q 4Q YTD 1Q 2Q 3Q 4Q YTD
2017 135 221 249 208 814 36.8% 54.2% 49.1% 51.7% 48.9%
2018 222 336 346 307 1,211 64.7% 52.0% 38.8% 46.9% 48.8%
2019 290 426 468 397 1,581 30.5% 26.7% 35.4% 29.5% 30.6%
2020 376 513 640 530 2,059 29.4% 20.5% 36.7% 33.5% 30.2%
2021 480 480 27.7% 27.7%
1. Excludes PACE originations
19
(US$, millions)
1

2021 Guidance
Select Metrics (US$ millions)2021 Forecast
Range
Originations 2,500 2,700
Managed & advised portfolio (period end) 4,200 4,500
Income Statement (US$ millions)2021 Forecast
Range
Origination Revenues 80 90
Servicing Revenues 80 85
Total Revenues 160 175
Adjusted EBITDA 106 114
Adjusted operating income before tax
100 108
EBITDA margin ~66% ~65%
• Reiterating guidance from Investor Day
• Will update guidance in Q2
• 2021 total originations of $2.5B - $2.7B
• EBITDA margins of 65%-66% in 2021
• Servicing revenue 46%-50% of total revenue in 2021
• 2021 adjusted operating earnings before tax forecast to increase by ~48% from 2020 at the midpoint
20
Q1-2021 FINANCIAL RESULTS
KEY HIGHLIGHTS

Q1-2021 FINANCIAL RESULTS
21
Highlights
21
Select Metrics (US$, millions)
Q12021
Q12020
Originations 182.2 133.4
Period end managed portfolios 2,731.6 2,478.5
Originations revenue 12.4 10.2
Servicing & other revenue 6.5 4.9
Revenue 18.9 15.2
Adjusted EBITDA 8.3 6.9
Adjusted operating income before tax 7.1 5.6
• Adjusted operating income before tax in Q1 of
$7.1 million; up ~28% Y/Y
• Includes ~$1 million of expenses for Land
Home build out
• Q1 originations up ~37% Y/Y
• Floorplan assets (FP) at ~$127 million in Q1
• Land Home on pace for $150-$200 million of
originations in 2021
• Triad continues to add and diversify funding
partners
• 5 new bank and credit union partners
added in Q1
• Fully funded for 2021and into 2022

Q1 Program Update
• Q1 approvals +15%; Originations +37%
• Approvals & originations accelerated meaningfully in March & April
• February weather temporarily impacted growth (Cold weather; TX freeze etc.)
• Robust approval growth drives confidence in forecasted ~$1B originations in 2021
22
Q1-2021 FINANCIAL RESULTS
2021 vs 2020 Monthly Growth Y/Y
Jan Feb Mar Apr
Core Approvals +4.5% -6.2% +44.1% +93.1%
Core Originations +35.0% +12.6% +43.0% +55.4%

Chattel Update
• Chattel docs out increased more than 125% Y/Y to $88 million through April 2021
• “Docs out” defined as fully completed chattel loans with down payments awaiting delivery
• ~99% close rate historically
• Builder backlogs remain extended at 6-months or more
• Increased demand
• Reduced staff at manufacturers
• Extended supply chains
23
$35.0
$45.0
$55.0
$65.0
$75.0
$85.0
CHATTEL “DOCS OUT” (US$ millions)
Q1-2021 FINANCIAL RESULTS

Land Home Update
Significant investment in process and people results in successful land home roll-out
• Substantial up front build-out expenses taken ahead of revenue ramp
• Implementation of Black Knight’s MSP servicing system
• Incorporated origination and pricing systems of the GSEs
• Process improvements to accommodate increased mortgage originations
• Experienced team built to process increased Loan Applications, Approvals and Closings
• Land Home (“LH”) department now has 34 experienced professionals
• Q4 2020 approvals of ~$25 million per month has increased to ~$45 million in Q1 2021
Land home docs out of ~$135 million as of April 2021
• Triad projects 90%+ of LH docs out to fund based on historical experience
• Average time to origination is ~6 months consistent with MH market generally
• Revenues are earned on origination
• On pace for at least $150 to $200 million in FY2021
24
Q1-2021 FINANCIAL RESULTS

Q1-2021 FINANCIAL RESULTS
25
Held-for-Trading Asset Update
25
• Triad HFT assets are bank eligible loans where Triad accumulates loans for periodic sale to certain partners
• Held-for-trading (“HFT”) assets declined to ~$55 million in Q1 2021 from ~$57 million in Q4 2020
• Sold ~$23 million in Q1 & originated ~$22 million
• Subsequent to quarter-end, Triad further reduced HFT assets to ~$53 million
HELD-FOR-TRADING FINANCIAL ASSETS(US$, millions)

Portfolio Credit Trends
EXCEPTIONAL CREDIT PERFORMANCE
• After some elevation as a result of COVID,
30+ day delinquency has returned to normal
at just 1.6% as of March 2021
• In-line with the average from 2017-2019
of 1.63%
• Net charge-offs are at a cycle low ~0.20%
• Compares to pre-Covid average of
~0.40%
• Covid related deferrals 0%
26
30+ DELINQUENCY
Q1-2021 FINANCIAL RESULTS
0.00%
0.50%
1.00%
1.50%
2.00%
2.50%
3.00%
Se
p-1
7
De
c-1
7
Ma
r-1
8
Jun
-18
Se
p-1
8
De
c-1
8
Ma
r-1
9
Jun
-19
Se
p-1
9
De
c-1
9
Ma
r-20
Jun
-20
Se
p-2
0
De
c-2
0
Ma
r-2
1
0.00%
0.25%
0.50%
0.75%
Se
p-1
7
De
c-1
7
Ma
r-1
8
Jun
-18
Se
p-1
8
De
c-1
8
Ma
r-1
9
Jun
-19
Se
p-1
9
De
c-1
9
Ma
r-20
Jun
-20
Se
p-2
0
De
c-2
0
Ma
r-2
1
NCO’s

Q1-2021 FINANCIAL RESULTS
Originations
27
ORIGINATIONS(US$, millions)
YOY ORIGINATION GROWTH
1Q 2Q 3Q 4Q YTD 1Q 2Q 3Q 4Q YTD
2017 92 126 129 119 466 24.7% 11.3% 10.3% 15.0% 14.4%
2018 94 150 147 135 525 2.2% 19.0% 14.0% 13.4% 12.7%
2019 118 170 171 144 603 25.2% 13.2% 16.5% 7.3% 14.8%
2020 133 163 202 197 696 13.4% (3.8%) 18.0% 36.6% 15.4%
2021 182 182 36.6% 36.6%
(US$, millions)

2021 Guidance
KEY HIGHLIGHTS
• Originations projected to grow ~50% in
2021 at the midpoint as a result of solid
core growth and new programs
• Floorplan assets of ~$120 - $140 million in
2021
• 2021 adjusted operating income growth
of ~40% at the midpoint
• 2021 guidance includes land home ramp
and some contribution from re-launched
Bronze program as we are actively
approving loans
Select Metrics (US$ millions) 2021 Forecast
Total originations 950 1,150
Floorplan line utilized 120 140
Managed & advised portfolio (period end) 3,200 3,400
Income Statement (US$ millions) 2021 Forecast
Origination Revenues 55 60
Servicing Revenues1 30 35
Revenue 85 95
Adjusted EBITDA 44 49
Adjusted operating income before tax
39 44
EBITDA margin ~52% ~52%
1. Servicing Revenues includes floorplan income
28
Q1-2021 FINANCIAL RESULTS

Q1-2021 FINANCIAL RESULTS
29
Highlights
29
• Adjusted operating income before tax in Q1 of $11.3 million
• Partnership Services revenue +8.6% Y/Y reflecting solid partnership revenues and increased CCIM fees
• CCIM performing as expected; $500 million transaction closed in Q3 without capital contribution from ECN – working on similar transactions
• Marketing Services improving as client activity continues to rebound from COVID-19 related decline in 2020
• Adjusted EBITDA Margin of 60.4% in Q1
Select Metrics (US$, millions)
Q12021
Q12020
Partnership Services Revenue 14.6 13.5
Marketing Services Revenue 2.9 1.8
Transaction Services Revenue 2.0 3.2
Interest Income & Other Revenue 0.2 0.3
Revenue 19.7 18.8
Adjusted EBITDA 11.9 11.5
Adjusted operating income before tax 11.3 10.4

Q1-2021 FINANCIAL RESULTS
$13.5 $14.6
$-
$2.0
$4.0
$6.0
$8.0
$10.0
$12.0
$14.0
Q1 2020 Q1 2021
Growth in core KG business in Q1
$1.8
$2.9
$-
$.5
$1.0
$1.5
$2.0
$2.5
$3.0
Q1 2020 Q1 2021
GROWING HIGH QUALITY, RECURRING REVENUE STREAMS
• +8.6% Y/Y increase in Partnership Revenue driven by strong traditional
partnership business and growth of CCIM platform
• Client marketing spend continues to recover post COVID-19 and new
verticals are expected to drive future growth
• Marketing services revenue up sharply to $2.9 million from $1.8
million in Q1 2020; up from $1.1 million in Q4 2020
• Consumer telecom marketing to be launched in Q2
• Other consumer focused verticals under development; KG expects
to go to market in H2 2021 with several new marketing verticals
• New Program Update
• Rollout of turn-key BaaS program continues; ~$4 Billion credit union
active with others expected to be onboarded throughout 2021
• CCIM’s internally developed asset management platform officially
launched on April 1st and received PCI-DSS certification1 on April
18th; Rollout expected in H2 2021
Partnership Services Revenue
Marketing Services Revenue
30
1. Technical and operational standards for organizations accepting or processing payment transactions. The standard was created andadministered by the Payment Card Industry Security Standards Council and is mandated by major credit card brands

Q1-2021 FINANCIAL RESULTS
2021 Guidance
Income Statement (US$ millions)2021 Forecast
Range
Revenue 82 90
Adjusted EBITDA 49 54
Adjusted operating income before tax
46 52
EBITDA margin ~60% ~60%
• Return to growth in 2021
• Revenues increase ~19% at the midpoint vs. 2020
• 2021 EBITDA growth of ~17% compared to 2020 with steady EBITDA margins of ~60%
• 2021 adjusted operating income after-tax increases ~21% at the midpoint vs 2020
31
KEY HIGHLIGHTS
Q1-2021 FINANCIAL RESULTS
32
Consolidated Financial
Summary
32

Q1-2021 FINANCIAL RESULTS
Q1 Consolidated Operating Highlights
SUMMARY
• Total Originations were $662.0 million for the quarter compared to $509.0 million for Q1 2020
• Q1 adjusted EBITDA of $35.5 million compared to $27.7 million for Q1 2020
• Q1 adjusted operating income before tax of $26.6 million compared to $21.0 million for Q1 2020
• Q1 adjusted net income applicable to common shareholders was $19.7 million or $0.08 per share
• Results of legacy discontinued operations eliminated in Q1 2021
33

Q1-2021 FINANCIAL RESULTS
(1) Reflects off-balance sheet portfolios of Service Finance, Triad
Financial Services and KG.
Balance Sheet (US$, millions)
Q12021
Q4 2020
Q12020
Total assets 1,778.6 1,706.2 1,702.1
Total finance assets 438.5 374.0 362.9
Earning assets- managed and advisory (1) 33,046.6 33,097.0 33,629.6
Debt 561.7 517.2 494.7
Shareholders’ equity 817.6 822.6 843.1
Total Debt to Equity ratio 0.69 0.63 0.59
Balance Sheet
KEY HIGHLIGHTS
• Total assets increased by $72.3 million compared to Q4 2020 reflecting an increase in held-for-trading assets at Service Finance, which was reduced subsequent to the quarter-end, and an increase in floorplan loans at Triad
• Earning assets - managed and advised of $33 billion at the end of Q1 reflects:
• Servicing assets of $3.4 billion at Service Finance
• Managed loans of $2.7 billion at Triad
• Managed and advisory assets of $26.9 billion at KG
• Debt increased by $44.5 million compared to Q4 2020, primarily reflecting the increased investments in finance assets. Pro forma debt down by ~$75 million subsequent to quarter-end due to completion of sale of finance assets at Service Finance
34

Q1-2021 FINANCIAL RESULTS
(1) Excludes share-based compensation
Income Statement (US$, thousands)
Q12021
Q12020
Portfolio origination services 27,014 20,193
Portfolio management services 30,867 29,475
Portfolio advisory services 2,000 3,175
Marketing services 2,904 1,827
Interest income 7,479 5,538
Other revenue 3,753 670
Total revenue 74,017 60,878
Operating expenses 38,561 33,169
Adjusted EBITDA 35,456 27,709
Interest expense 6,091 5,070
Depreciation & amortization 2,769 1,621
Adjusted operating income before tax (1) 26,596 21,018
Adjusted net income applicable to common shareholders per share (basic)
0.08 0.06
Income Statement
KEY HIGHLIGHTS
• Q1 adjusted EPS of $0.08 per share, at the top end of our guidance range and in line with consensus
• Adjusted EBITDA of $35.5 million compared to $27.7 million in Q1 2020, reflecting strong performance of all three of our business segments
• Effective tax rate on adjusted operating income was 17.0% in Q1 2021 compared to 20.0% in Q1 2020, due to tax planning initiatives completed in 2020 and in line with guidance
35

Q1-2021 FINANCIAL RESULTS
Operating Expenses
KEY HIGHLIGHTS
• Higher business segment operating expenses due to growth in originations and managed portfolios at Service Finance and Triad as well as the build out of Triad’s Land home business
• Corporate operating expenses of $6.2 million are in line with our normalized run rate on a go-forward basis and reflect a return to normal activity levels with respect to business development, professional services and travel
• Legacy Businesses operating expenses reflect the impact of the continuing reduction of the legacy asset portfolio; largely offset by Legacy Businesses revenue of ~$1.6 million
Operating Expenses (US$, thousands)
Q12021
Q12020
Service Finance 11,973 10,200
Triad Financial Services 10,642 8,275
KG 7,820 7,240
Business segment operating expenses 30,435 25,715
Corporate 6,233 7,454
Legacy Businesses (1) 1,893 —
Total operating expenses 38,561 33,169
(1) For Q1 2020, the results of operations of our Legacy Businesses
were separately presented as discontinued operations and are
excluded from the table above.
36

Q1-2021 FINANCIAL RESULTS
37
Closing Summary
37

Q1-2021 FINANCIAL RESULTS
Closing Summary
SUCCESSFUL OPERATING RESULTS
• Q1 2021 Adj operating EPS of $0.08; compared to Investor Day Q1 guidance of $0.07-$0.08
• SFC Q1 originations +28%; April originations +52% ramping as we enter selling season
• Big Box Retailer & All-In-One programs will help drive significant growth in coming quarters
• Triad Q1 originations +37%; April originations +55% accelerating meaningfully into Q2
• Land home $135 million in docs out; on track for at least $150 - $200 million in 2021
• KG in-line Q1; strong partnership business continues; pipeline strong
• KG new growth opportunities leveraging core competencies
• Expect to revisit 2021& 2022 guidance in Q2
CAPITAL MANAGEMENT
• Quarterly dividend unchanged at C$0.03 (C$0.12 annually)
• Active in NCIB; purchased both preferred and common shares in Q1
38

ESG Commitment
ECN MANAGEMENT AND THE BOARD OF DIRECTORS ARE COMMITTED TO IMPROVING
ESG POLICY, IMPACT, AND THE DISCLOSURE OF THESE ISSUES TO OUR STAKEHOLDERS
• ECN expects to update ESG progress in Q2
• ECN formally established the ESG management committee to address ECN’s ESG impacts and disclosure
• Engaged with numerous stakeholders to better understand and plan our ESG disclosure
• Initial report given at Investor Day 2021 available on ECN website -https://www.ecncapitalcorp.com/content/uploads/ESG-FINALJW.pdf
• ECN’s businesses have attractive end markets with positive ESG tailwinds – home improvement & manufactured housing use largely energy star rated equipment
• ECN disclosure complies with SASB standards
• ECN’s CEO is a founding member of the Canadian chapter of the 30% Club
39
Q1-2021 FINANCIAL RESULTS

Q1-2021 FINANCIAL RESULTS
40
Questions
40