Fourth Consolidated M&E Report Presentation to the Portfolio Committee, Cape Town 11 June.
28
1 Fourth Consolidated M&E Report Presentation to the Portfolio Committee, Cape Town 11 June
-
Upload
winfred-hardy -
Category
Documents
-
view
215 -
download
0
Transcript of Fourth Consolidated M&E Report Presentation to the Portfolio Committee, Cape Town 11 June.

1
Fourth Consolidated M&E Report
Presentation to the Portfolio Committee, Cape Town
11 June

2
Structure of Presentation
2
Background to the PSC’s M & E System
Methodology
Presentation of findings per principle
Recommendations

3
• The PSM&ES is based on the nine Constitutional values & principles governing public administration listed in Section 195 of the Constitution.
• The system generates baseline data and comparable statistics on each of these principles for each national and provincial department included in an evaluation cycle.
• The intention with the evaluation process is to make an assessment of the extent to which sound public administration is practiced within individual departments.
Background to the PSC’s M & E System

4
Methodology
1. Notification to sampled departments
• Send letters to department, Minister, MEC and DG/HoD explaining the purpose, process and requesting a contact person.
• Attached Assessment framework and list of documents needed.
2. Introductory meeting with department.
• Obtain name of a contact person within the department
• Meet with HoD and top management of department to explain the PSM&ES and obtain buy-in
Implementation of PSM&ES in departments
3. Produce draft report
• Obtain and analyze information.
• Assess performance against defined performance indicator(s) for each principle.
• Identify areas of good practice and/or problem areas.
• Write main and summary report.
4. Presentation of draft findings to department
• Discuss findings of assessment with HoD and top management of department.
• Give opportunity to submit written comments within 10 days of presentation.
5. Final report
• Include comments of department in report and make amendments if necessary.
• Send approved report to department.
6. Consolidated report
• Collate info of individual reports into one consolidated report.
• Submit report to Parliament.• Present report on request to
Provincial Legislatures, Provincial Premiers and Provincial Executive Committees.

5
• The process of assessment involves working closely with departments to review their performance and identify areas where improvements could be effected, thereby contributing to overall management and service delivery improvement.
• The Consolidated M&E Report is generated from findings and recommendations obtained in individual departmental M&E Reports which are collated and consolidated
• As part of the implementation plan for the 2006/07 PSM&ES research cycle 16 departments (4 national and 12 provincial) are covered in this report
• Departments assessed during the 2006/07 research cycle were rank- ordered for each principle, and categorised into under-performing (below 60%, performing at an acceptable level (60%) and performing above satisfactory (above 60%)
• These comparisons should assist departments in benchmarking themselves against their counterparts and improve on their performance
Methodology - continued

6 6
Findings: Overall trends in performance for the period 2000 to 2007
Trends in performance for the period 2000 to 2007
46%
28%
48%
0%
10%
20%
30%
40%
50%
60%
2000/05 2005/06 2006/07
Research Cycles
Avera
ge P
erf
orm
an
ce
From 2000 to 2006/07 average performance ranged from 28% (indicative of development that is needed in all the standards) and 48% (indicative of development that is needed in most of the standards of the System)
7 7
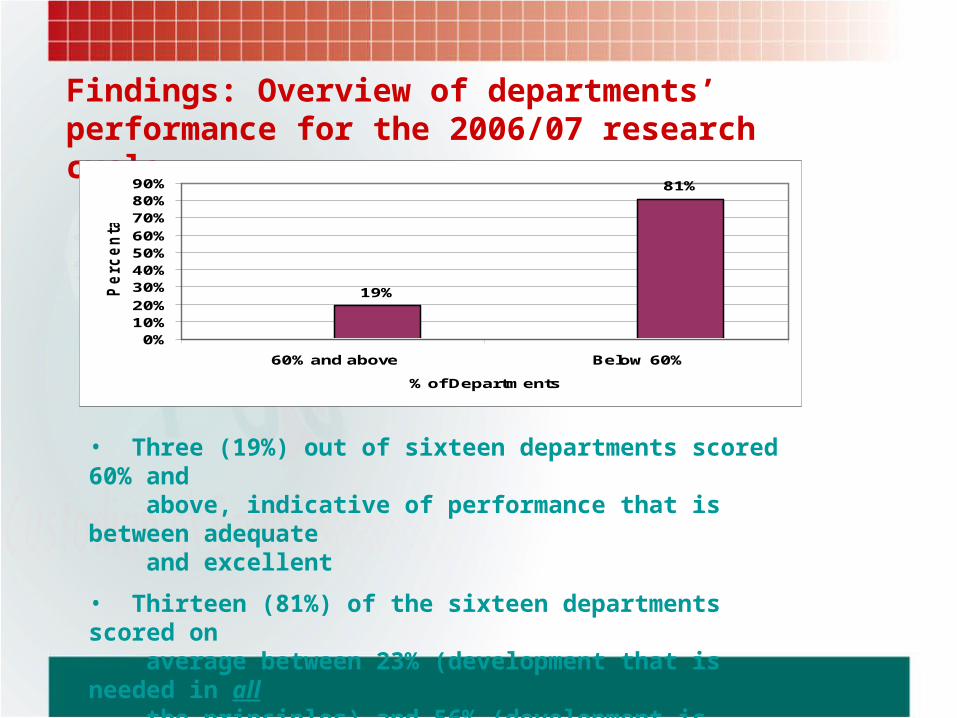
Findings: Overview of departments’ performance for the 2006/07 research cycle
19%
81%
0%10%20%
30%40%50%60%
70%80%90%
60% and above Below 60%
% of Departments
Pe
rc
en
tag
e
• Three (19%) out of sixteen departments scored 60% and above, indicative of performance that is between adequate and excellent
• Thirteen (81%) of the sixteen departments scored on average between 23% (development that is needed in all the principles) and 56% (development is needed in most of the principles).

8 8
Findings Principle 1: Professional Ethics
The key indicator for measuring adherence this principle is the manner in which departments address misconduct and assesses whether cases of misconduct where a disciplinary hearing has been conducted comply with the provisions of the Disciplinary Code and Procedures for the Public Service
Performance in Principle 1
50% 50%
0%
10%
20%
30%
40%
50%
60%
Performed above Satisfactory Under-perfromed
Performance
Pe
rce
nta
ge
De
pa
rtm
en
ts

9 9
Findings Principle 1: Professional Ethics - Continued
• Eight (50%) departments performed above satisfactory and eight (50%) under-performed – Public Enterprises scored 100%
• Four (25%) of the sixteen departments finalised cases of misconduct in which a disciplinary hearing was conducted within the time frame of 20 – 80 days, but twelve (75%) were not finalised within this time frame
• Although management reporting on cases of misconduct is done on a regular basis (75%), the reports are not always acted upon.
• Absenteeism is the most common case of misconduct
• If not properly managed absenteeism can impact on staff morale and productivity as the burden is placed on devoted officials
1010
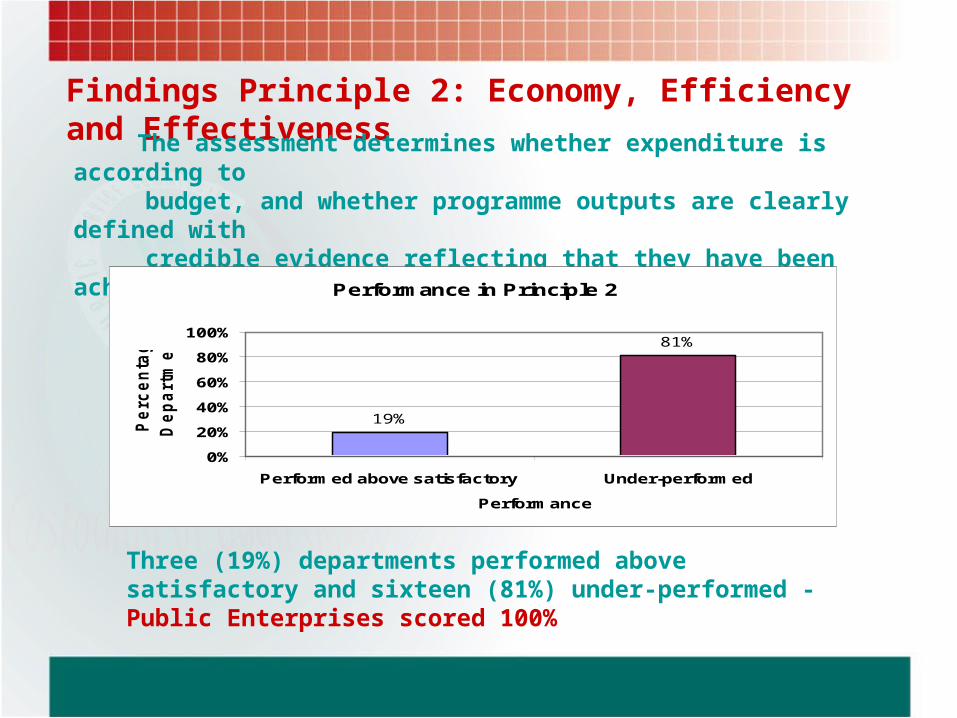
Findings Principle 2: Economy, Efficiency and Effectiveness
The assessment determines whether expenditure is according to budget, and whether programme outputs are clearly defined with credible evidence reflecting that they have been achieved
Performance in Principle 2
19%
81%
0%
20%
40%
60%
80%
100%
Performed above satisfactory Under-performed
Performance
Pe
rce
nta
ge
De
pa
rtm
en
ts
Three (19%) departments performed above satisfactory and sixteen (81%) under-performed - Public Enterprises scored 100%

1111
Findings Principle 2: Economy, Efficiency and Effectiveness - Continued
• Seven (44%) Departments are still facing a challenge in developing measurable performance indicators
• Only one department managed to meet more than 80% of its priority outputs
• Eight (67%) of the twelve provincial departments were not able to clearly link their outputs, SDIs and targets with each other as they appear in the departments’ strategic plans, estimates of expenditure and annual reports

1212
Findings Principle 3: Development-Oriented Public Administration
In addressing this principle, departments are assessed according to how effective they are in implementing programmes/projects that aim to promote development and reduce poverty
Performance in Principle 3
38%31% 31%
0%
10%
20%
30%
40%
Perfomred abovesatisfactory
Perfomed at anacceptable level
Under-performed
Performance
Pe
rc
en
tag
e
De
pa
rtm
en
ts
Six (38%) departments performed above satisfactory, five (31%) performed at an acceptable level and five (31%) under-performed

1313
Findings Principle 3: Development-Oriented Public Administration - Continued
• Eastern Cape Department of Social Development scored 100%
• Seven (44%) departments did not sufficiently accommodate local development plans, which might impact adversely on the sustainability of projects themselves
• Ten (38%) departments’ development plans did not always achieve their objectives • Twelve (75%) departments did not take lessons learned into consideration
14
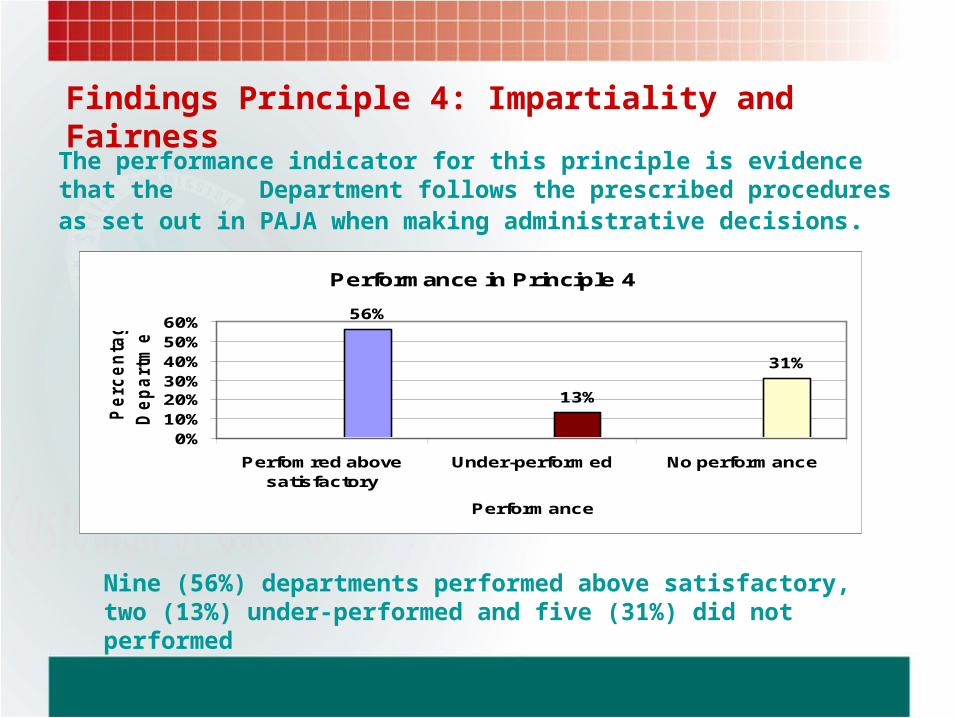
Findings Principle 4: Impartiality and Fairness
The performance indicator for this principle is evidence that the Department follows the prescribed procedures as set out in PAJA when making administrative decisions.
Performance in Principle 4
56%
13%
31%
0%10%20%30%40%50%60%
Perfomred abovesatisfactory
Under-performed No performance
Performance
Pe
rce
nta
ge
De
pa
rtm
en
ts
Nine (56%) departments performed above satisfactory, two (13%) under-performed and five (31%) did not performed

15
Findings Principle 4: Impartiality and Fairness - Continued
• The best performing department was Public Enterprises with 100%
•Ten (63%) Departments clearly refer to the applicable legislation/policy in terms of which a decision needs to be taken, six (37%) were not
• Eight (50%) of the departments were unable to submit any documentation to assess whether decisions were taken by duly authorised officials in terms of the departmental delegations of authority
• Twelve (75%) Departments still do not comply with the requirements of PAJA

16
Findings Principle 5: Public Participation in Policy-Making
The performance indicator for measuring public participation is thatdepartments must facilitate public participation in policy- making
Performance in Principle 5
31%
50%
19%
0%10%20%30%40%50%60%
Perfomred abovesatisfactory
Under-performed No performance
Performance
Pe
rc
en
tag
e
De
pa
rtm
en
ts
Five (31%) departments performed above satisfactory, eight (50%) under-performed and three (19%) did not performed

17
Findings Principle 5: Public Participation in Policy-Making - Continued
• The best performing department was Water Affairs with 100%
• Six (38%) of the sixteen departments (three national and three provincial departments) assessed do have a policy/system on public participation in policy-making in place, ten (62%) have not
• Eight (50%) departments utilised 50% of the time a system to consult and obtain public participation in policy-making
• Two (13%) departments do have a system for public participation in policy-making but do not always utilise it
• Five departments (31%) departments acknowledge and consider public inputs, eleven (69%) do not

1818
Findings Principle 6: Accountability
The assessment focuses on whether departments exercise adequate internal control over all departmental financial transactions, and whether fraud prevention plans, based on thorough risk assessments, are in place
and implemented
Performance in Principle 6
44%
6%
50%
0%10%20%30%40%50%60%
Perfomred abovesatisfactory
Perfomed at anacceptable level
Under-performed
Performance
Pe
rc
en
tag
e
De
pa
rtm
en
ts
Seven (44%) departments performed above satisfactory, one (6%) at an acceptable level and eight (50%) under-performed - The best performing department was Public Enterprises with 90%

1919
Findings Principle 6: Accountability - Continued
• Eleven (69%) of the departments assessed did not receive a clean audit report as a number of internal control weaknesses were highlighted by the Auditor-General.
• Seven (44%) departments assessed did have a comprehensive and appropriate fraud prevention plan that is based on a thorough risk assessment in place leaving a department vulnerable and open to fraud
• Most departments do not optimally use governments’ transversal systems such as BAS, PERSAL and LOGIS to manage information
• Five (31%) of the departments assessed do not have any M&E system

2020
Findings Principle 7: Transparency
The performance indicator for this principle is whether the departmentalannual report complies with National Treasury’s guideline on annual reporting, and whether the Department complies with the provisions of the Promotion of Access to Information Act (PAIA)
Performance in Principle 7
19% 19%
62%
0%10%20%30%40%50%60%70%
Perfomred abovesatisfactory
Perfomed at anacceptable level
Under-performed
Performance
Pe
rc
en
tag
e
De
pa
rtm
en
ts
Three (19%) departments performed above satisfactory, three (19%) at an acceptable level and ten (62%) under-performed - The best performing department was Public Enterprises with 90%
2121
Findings Principle 7: Transparency - Continued
Departmental Annual Reports
• The annual reports of fourteen (88%) of the departments were well written and clearly presented
• Ten (63%) departments’ annual reports covered in sufficient detail the areas prescribed by National Treasury
• Eight (50%) Departments reported clearly on their performance against predetermined outputs
PAIA
• Eight (50%) departments did appoint a deputy information officer
• Three (19%) did have a manual on access to information available
• Four (25%) did have a system for managing requests for access to information

2222
Findings Principle 8: Good Human Resource Management and Career Development PracticesThe assessment is done on whether vacant posts are filled in a timely manner and the implementation of the Skills Development Act
Performance Principle 8
13% 13%
68%
6%
0%
20%
40%
60%
80%
Perfomredabove
satisfactory
Perfomed at anacceptable level
Under-performed
No performance
Performance
Pe
rce
nta
ge
De
pa
rtm
en
ts
Two (13%) departments performed above satisfactory, two (13%) at an acceptable level, eleven (68%) under-performed and one (6%) did not perform - The best performing department was Public Enterprises with 80%

2323
Findings Principle 8: Good Human Resource Management and Career Development Practices - Continued
Recruitment
• Ten (63%) departments did not have a recruitment policy in place that complies with good practice standards
• Fourteen (88%) departments’ time taken to fill a vacancy exceeded the standard of 90 days – the average time exceeded 180 days
• Nine (56%) departments do regular reporting on recruitment
Skills Development
• Eight (50%) departments had a skills development plan based on a skills need analysis, three (19%) had only a plan and 5 (31%) had no plan
• Two (13%) departments did implement their skills development plans and assessed the training’s impact on their service delivery.

2424
Findings Principle 9: RepresentivityThe PSC assesses whether employment practices in departments contribute to be representative of the South African people and diversity management measures are implemented
One (6%) department performed above satisfactory, three (19%) at an acceptable level, nine (56%) under-performed and three (19%) did not perform - The best performing department was Labour with 70%
Performance in Principle 9
6%
19%
56%
19%
0%10%20%30%40%50%60%
Perfomredabove
satisfactory
Perfomed at anacceptable level
Under-performed
No performance
Performance
Pe
rce
nta
ge
De
pa
rtm
en
ts

2525
Findings Principle 9: Representivity - Continued
• Six (38%) departments had an Employment Equity Policy that complied with the Employment Equity Act, ten (62%) did not
• Six (38%) departments did report to management on employment equity, ten (62%) did not
• Two (13%) departments met all the national representivity targets
• Five (31%) departments met 61% to 85% of the national representivity targets
• Four (25%) departments met 10% to 60% of the national representivity targets
• Four (35%) departments (one national and three provincial) did not meet any of the national or their own Employment Equity Targets
• Nine (56%), all of them provincial departments, did not have or implemented any diversity management measures

2626
• Departments should put in place a monitoring and evaluation system for handling cases of misconduct
• Departments should put in place an early warning system for flagging under-spending and the non-achievement of objectives
• Departments should make the implementation of PAJA and delegations of authority a top priority in order to legitimise administrative decisions taken
• It is imperative that departments develop and implement a policy on public participation on policy-making to facilitate the procurement of inputs in all public policy development processes
• Departments should make concerted efforts to adopt and implement a Risk Management Strategy
• Departments should tighten their internal control measures
Recommendations

2727
• Departments in future should ensure that they comply with the requirements on annual reporting set by National Treasury
• Departments should ensure that they comply with all the requirements of the Promotion of Access to Information Act, 2000 (Act No. 2 of 2000)
• Vacancies must be filled within the time frame of twelve weeks on average
• Departments need to ensure that they meet all national employment equity targets, especially with regard to women in junior/senior management positions and attend to increase the employment of people with disabilities to 2% in order to strike an equity balance
• Departments should address the important issue of diversity management
Recommendations - Continued

2828
THANK YOU!THANK YOU!
National Anti-Corruption Hotline for the Public Service: 0800 701 701