Four JnNURM funded Bus Rapid Transport Systems … Projects in Four...Bus Rapid Transport Systems...
41
Four JnNURM funded Bus Rapid Transport Systems Ahmedabad, Indore, Jaipur & Pune Madhav Pai Transport Planner BRTS Seminar Indo – German Institute of Advanced Technology Gayatri Vidyarthi Parishad College of Engineering Vishakapattanam, India
Transcript of Four JnNURM funded Bus Rapid Transport Systems … Projects in Four...Bus Rapid Transport Systems...
Four JnNURM funded
Bus Rapid Transport Systems
Ahmedabad, Indore, Jaipur & Pune
Madhav PaiTransport Planner
BRTS SeminarIndo – German Institute of Advanced TechnologyGayatri Vidyarthi Parishad College of Engineering
Vishakapattanam, India
Outline
1. Current Transport Indicators
2. Project Descriptions & Highlights
3. Broad Observations
4. Recommendations
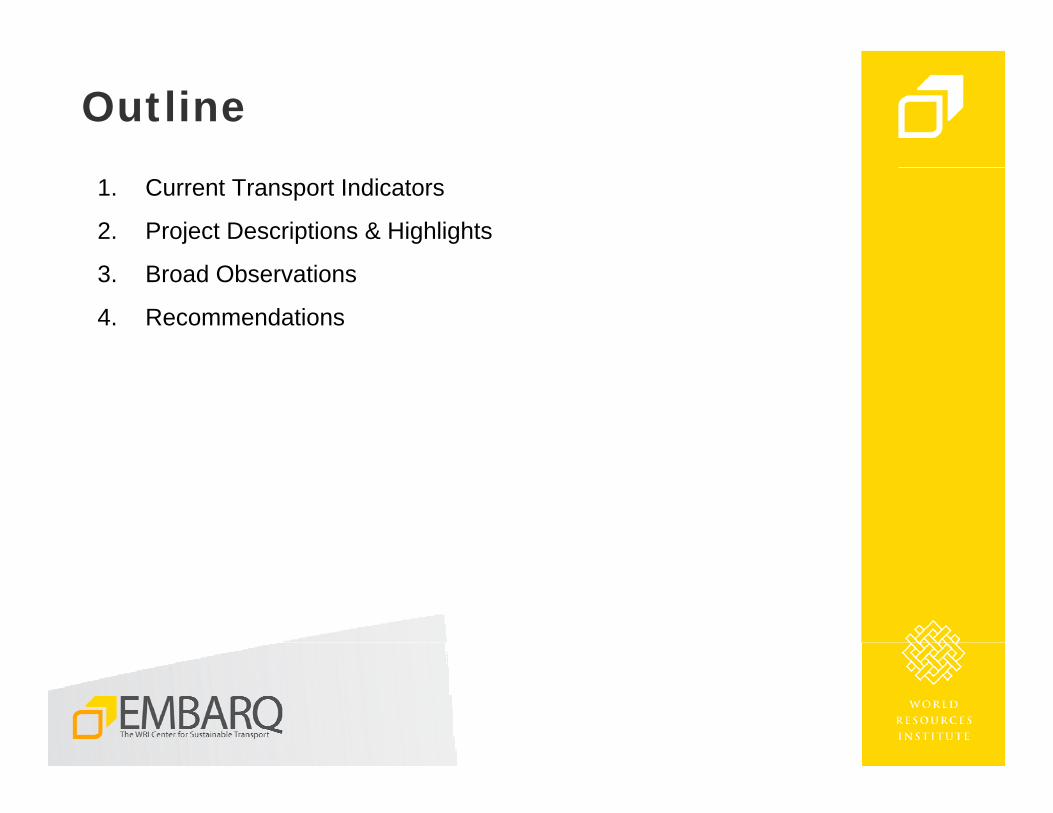
Four JnNURM
funded
BRT projects
in India
(Under Implementation)
Transport Indicators
1. Population density
2. Population growth (2001-2021)
3. Average trip length
4. Motorization
5. Non-motorized transport
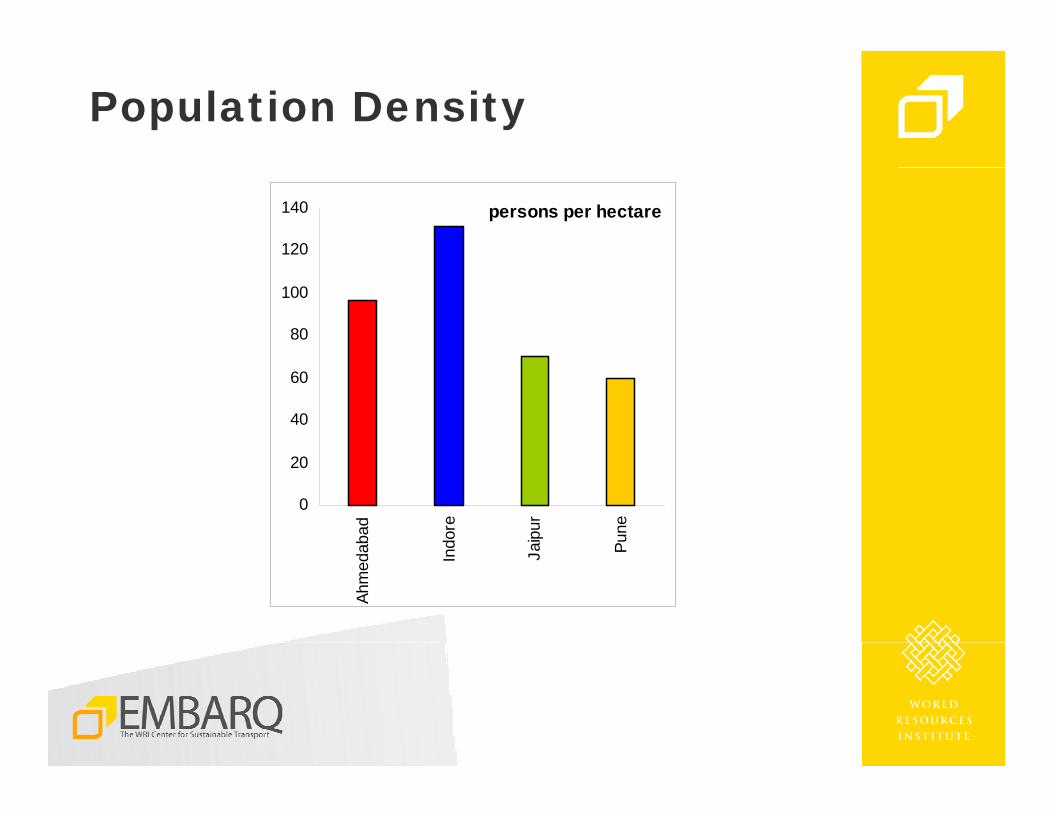
Population Density
persons per hectare
0
20
40
60
80
100
120
140
Ahm
edab
ad
Indo
re
Jaip
ur
Pune
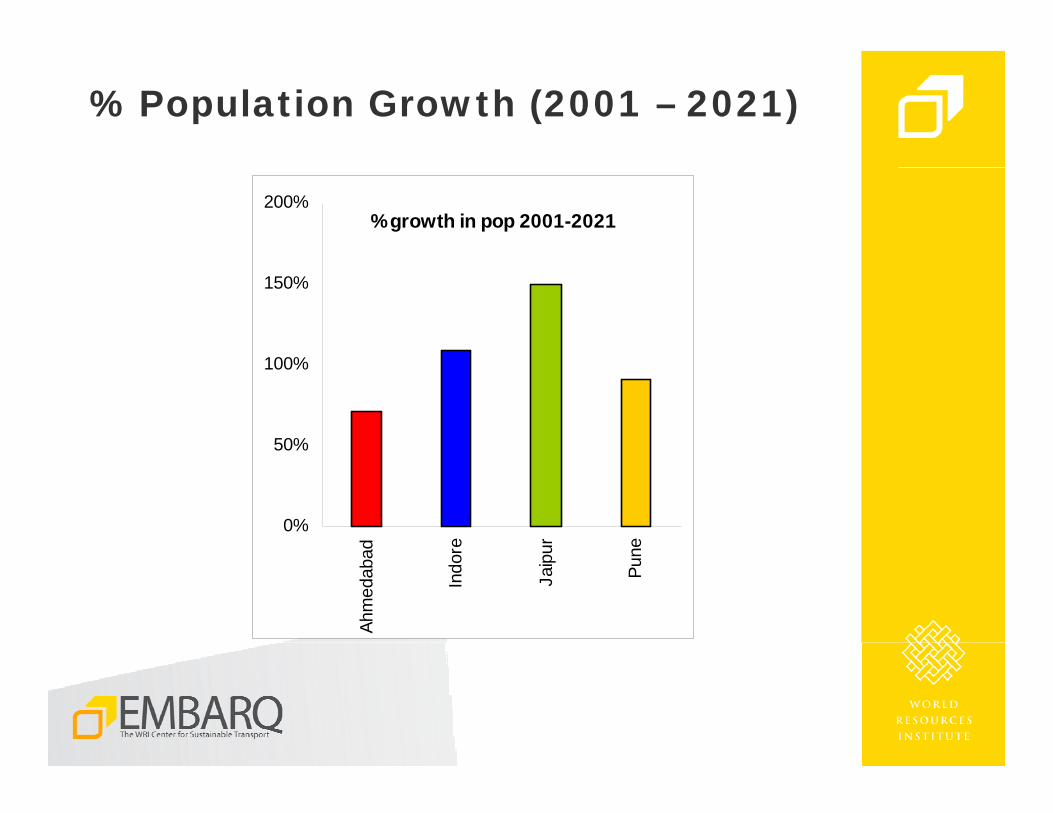
% Population Growth (2001 – 2021)
% growth in pop 2001-2021
0%
50%
100%
150%
200%
Ahm
edab
ad
Indo
re
Jaip
ur
Pune
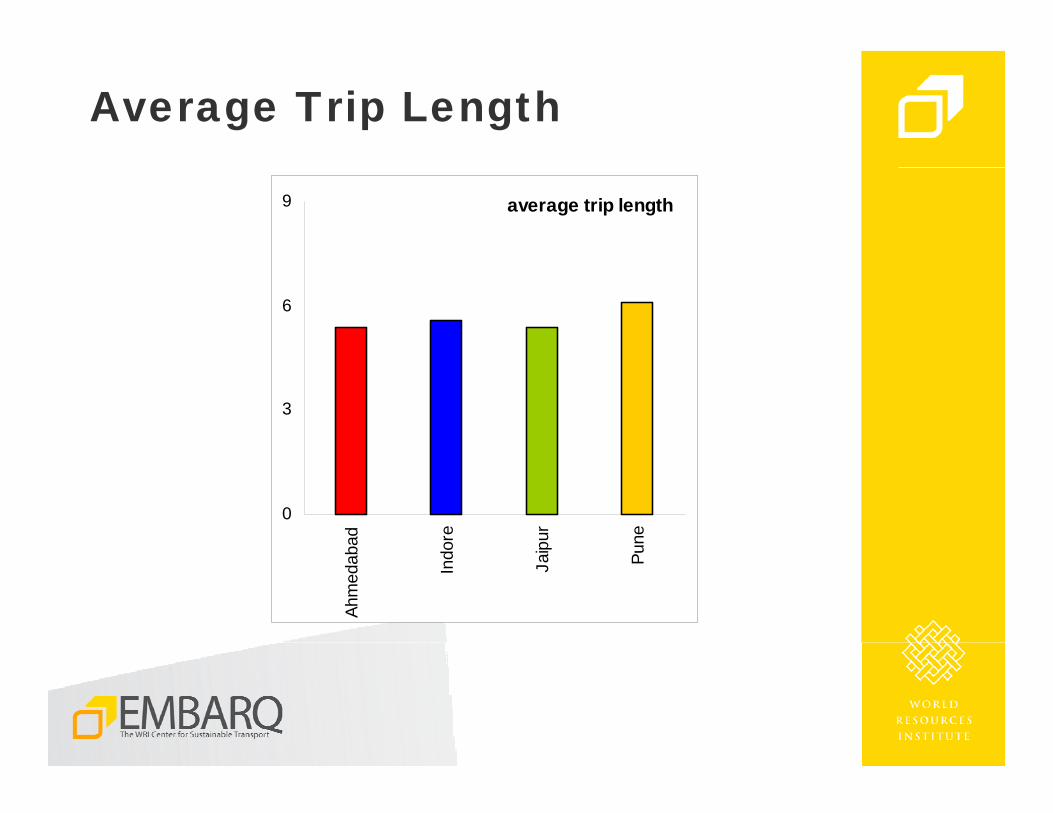
Average Trip Length
average trip length
0
3
6
9
Ahm
edab
ad
Indo
re
Jaip
ur
Pune
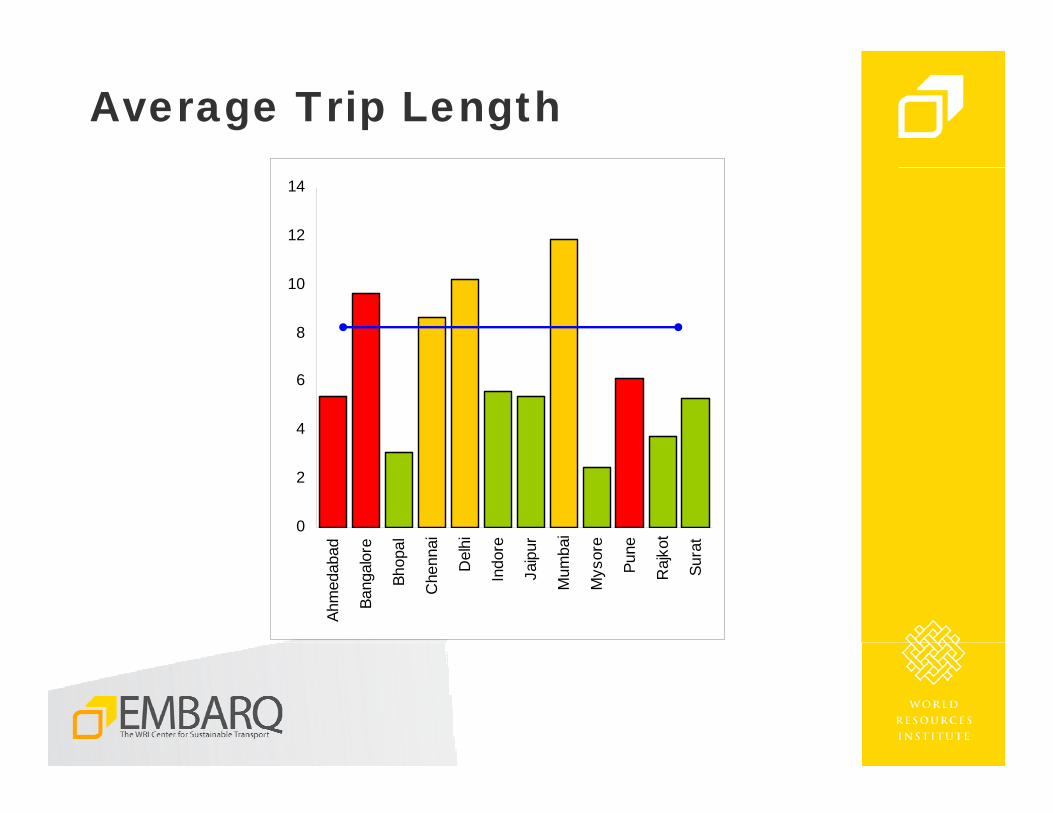
Average Trip Length
0
2
4
6
8
10
12
14
Ahm
edab
ad
Bang
alor
e
Bhop
al
Che
nnai
Del
hi
Indo
re
Jaip
ur
Mum
bai
Mys
ore
Pune
Raj
kot
Sura
t
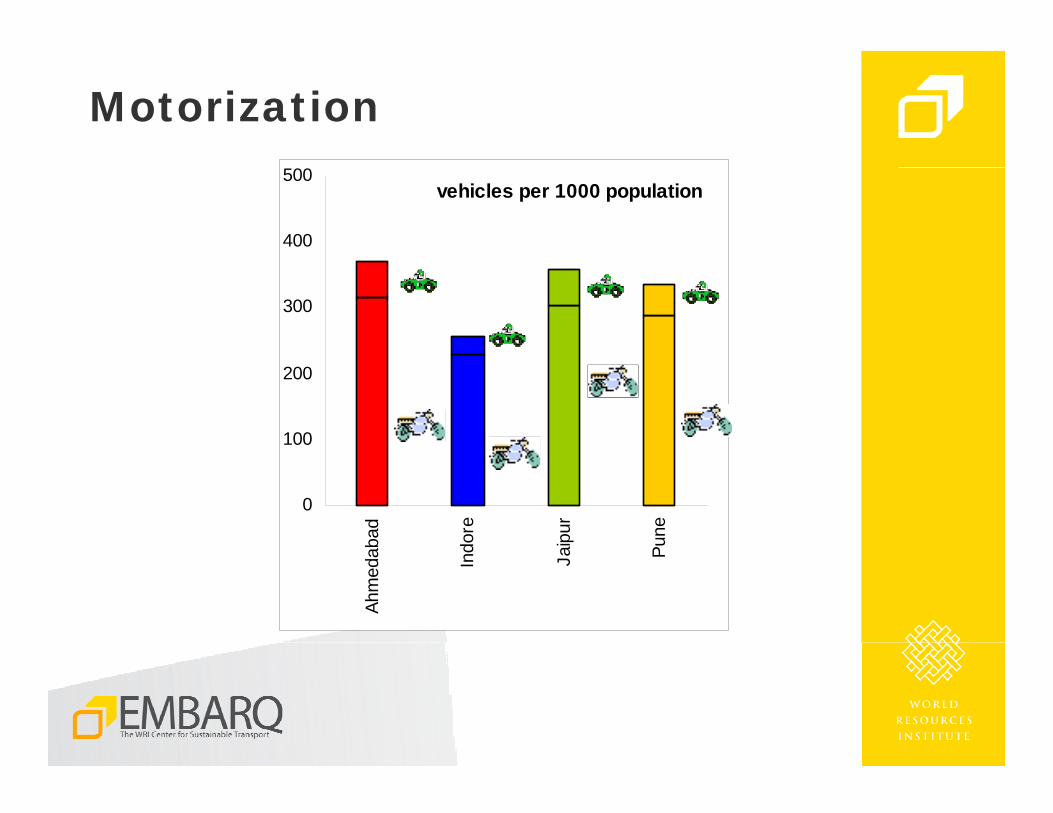
Motorization
vehicles per 1000 population
0
100
200
300
400
500
Ahm
edab
ad
Indo
re
Jaip
ur
Pune
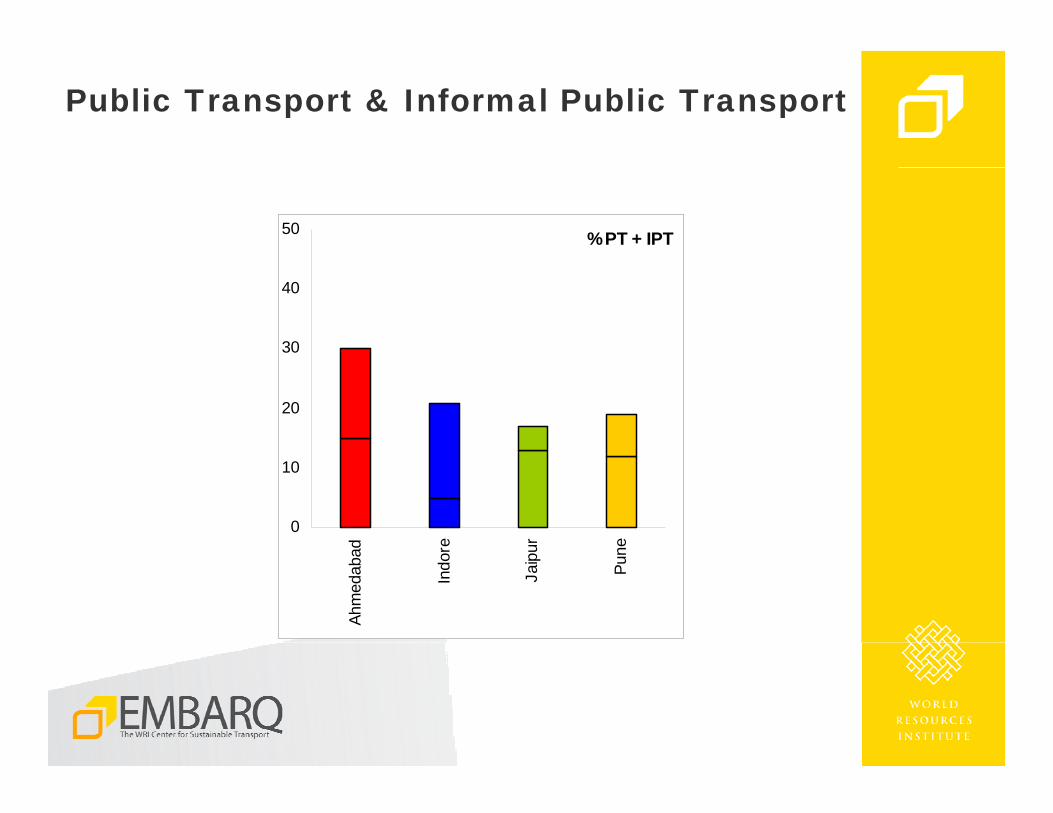
Public Transport & Informal Public Transport
% PT + IPT
0
10
20
30
40
50
Ahm
edab
ad
Indo
re
Jaip
ur
Pune
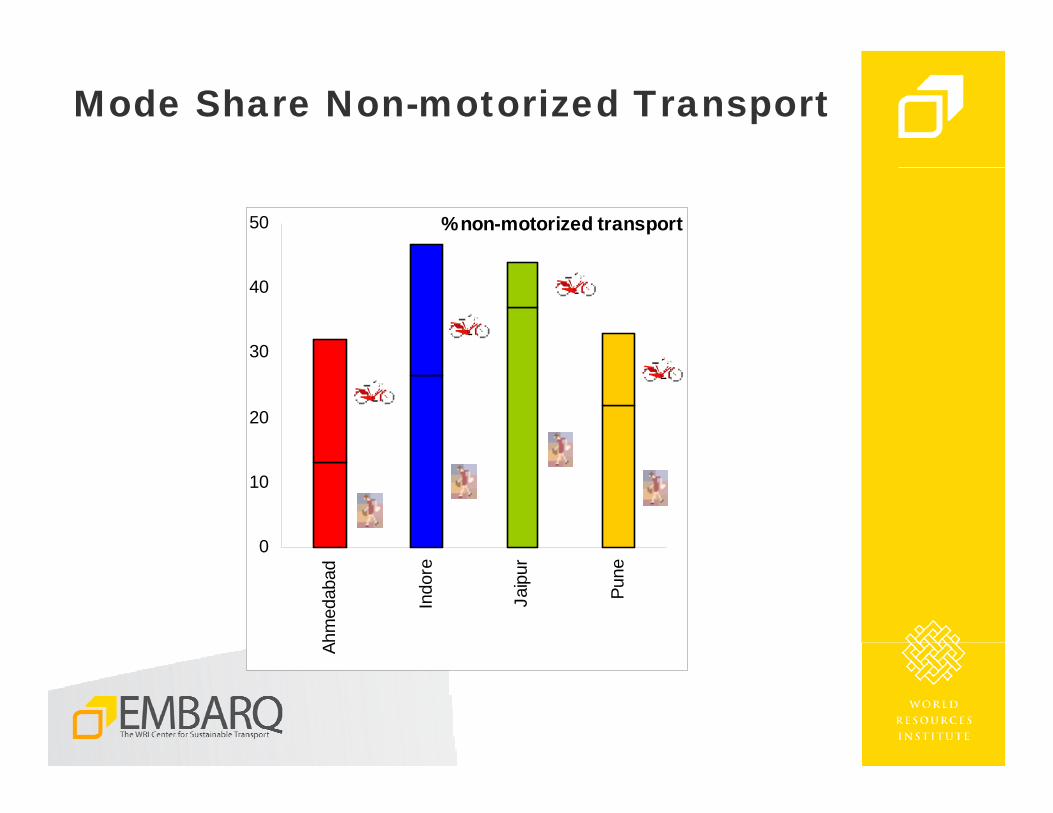
Mode Share Non-motorized Transport
% non-motorized transport
0
10
20
30
40
50
Ahm
edab
ad
Indo
re
Jaip
ur
Pune
Projects
1. Ahmedabad (Janmarg)
2. Indore (MetroJet)
3. Jaipur
4. Pune
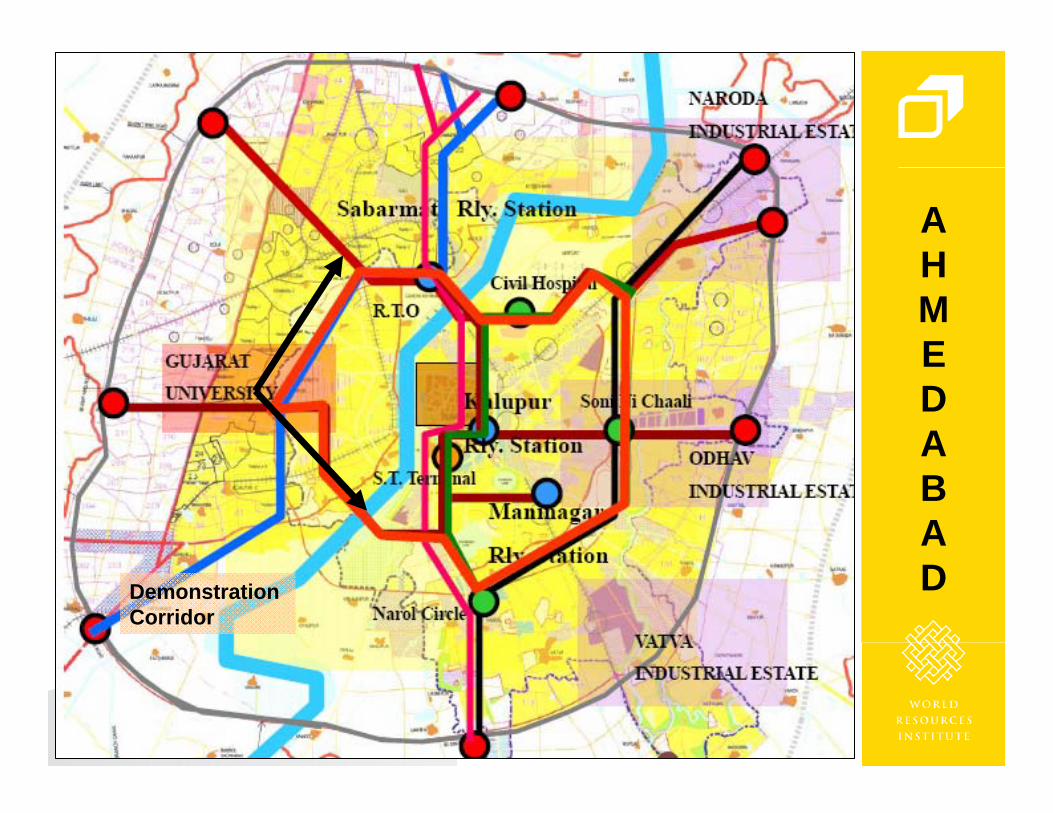
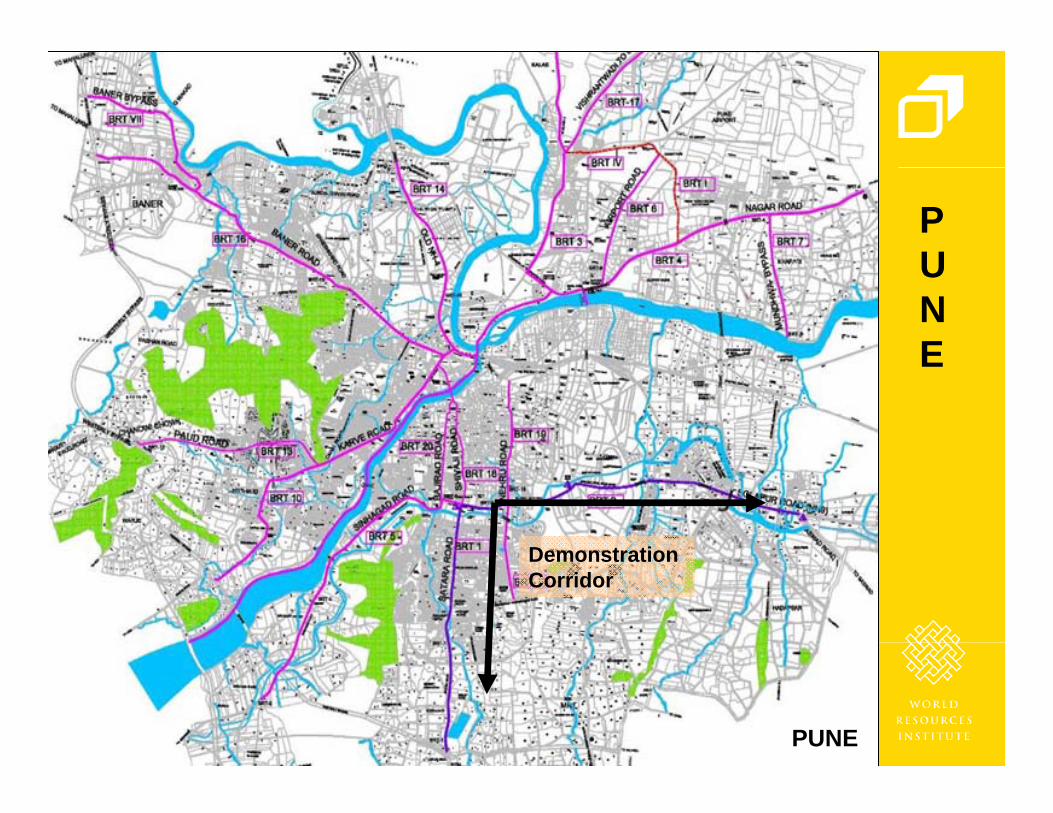
Demonstration Corridor
AHMEDABAD
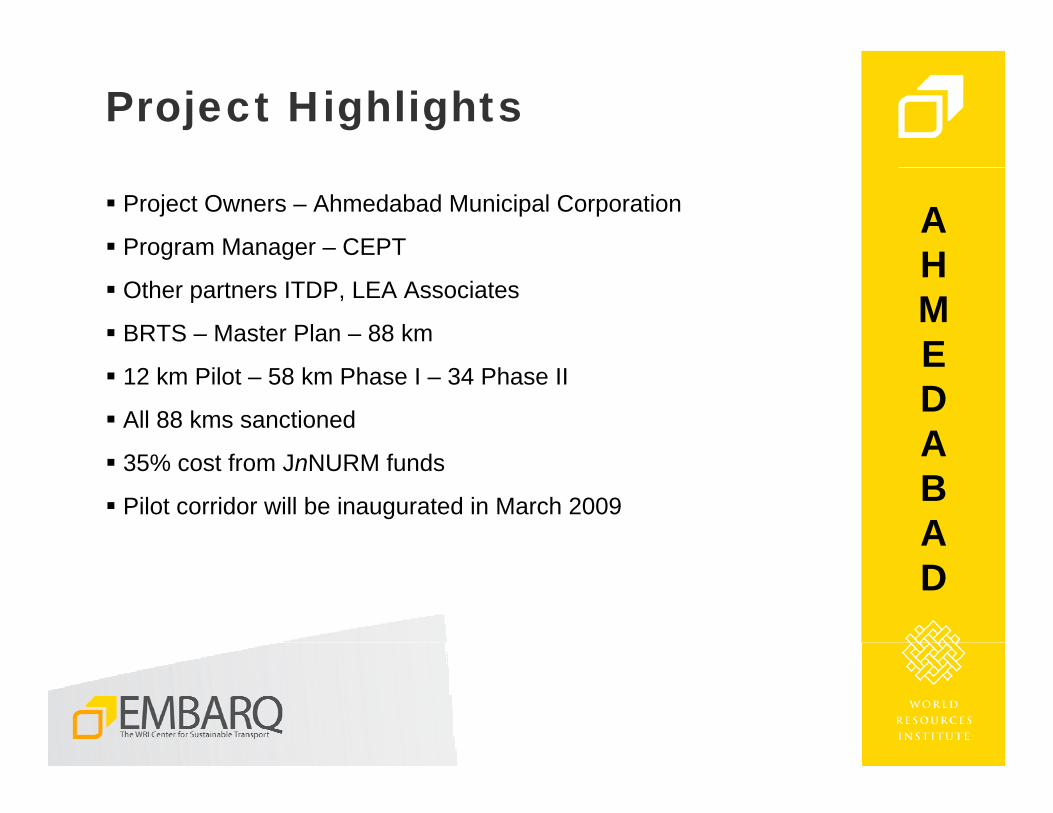
Project Highlights
Project Owners – Ahmedabad Municipal Corporation
Program Manager – CEPT
Other partners ITDP, LEA Associates
BRTS – Master Plan – 88 km
12 km Pilot – 58 km Phase I – 34 Phase II
All 88 kms sanctioned
35% cost from JnNURM funds
Pilot corridor will be inaugurated in March 2009
AHMEDABAD
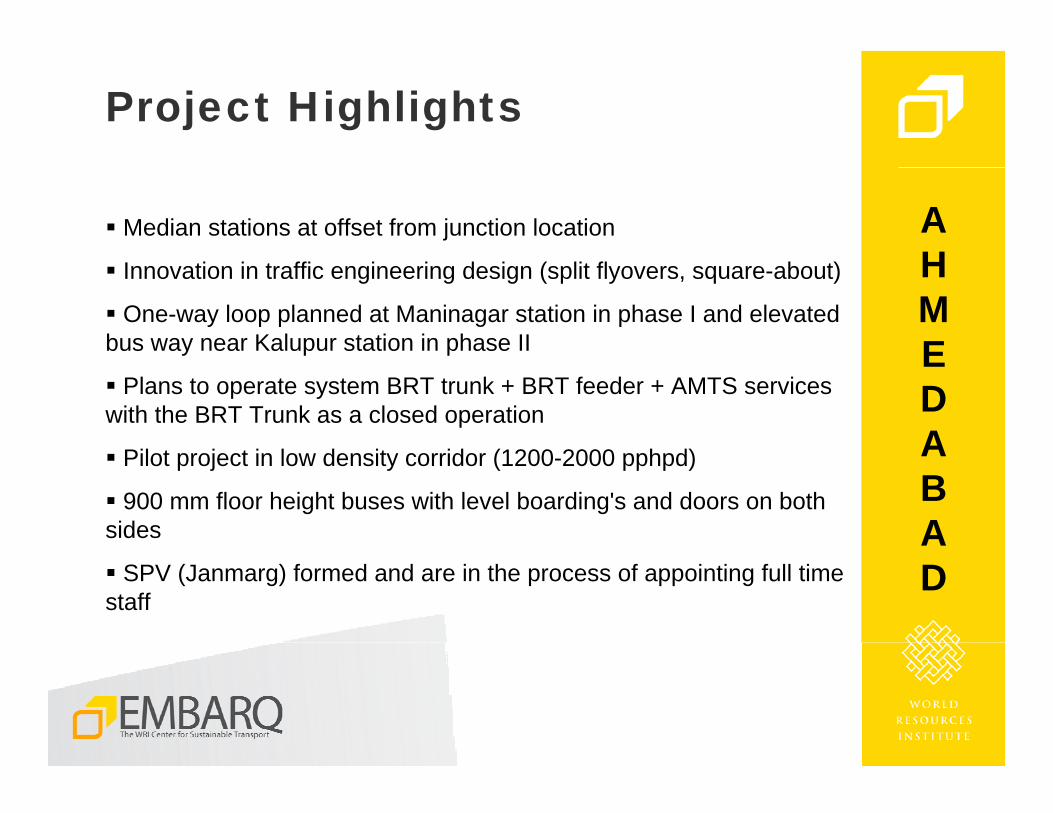
Project Highlights
Median stations at offset from junction location
Innovation in traffic engineering design (split flyovers, square-about)
One-way loop planned at Maninagar station in phase I and elevated bus way near Kalupur station in phase II
Plans to operate system BRT trunk + BRT feeder + AMTS services with the BRT Trunk as a closed operation
Pilot project in low density corridor (1200-2000 pphpd)
900 mm floor height buses with level boarding's and doors on both sides
SPV (Janmarg) formed and are in the process of appointing full time staff
AHMEDABAD
Demonstration Corridor
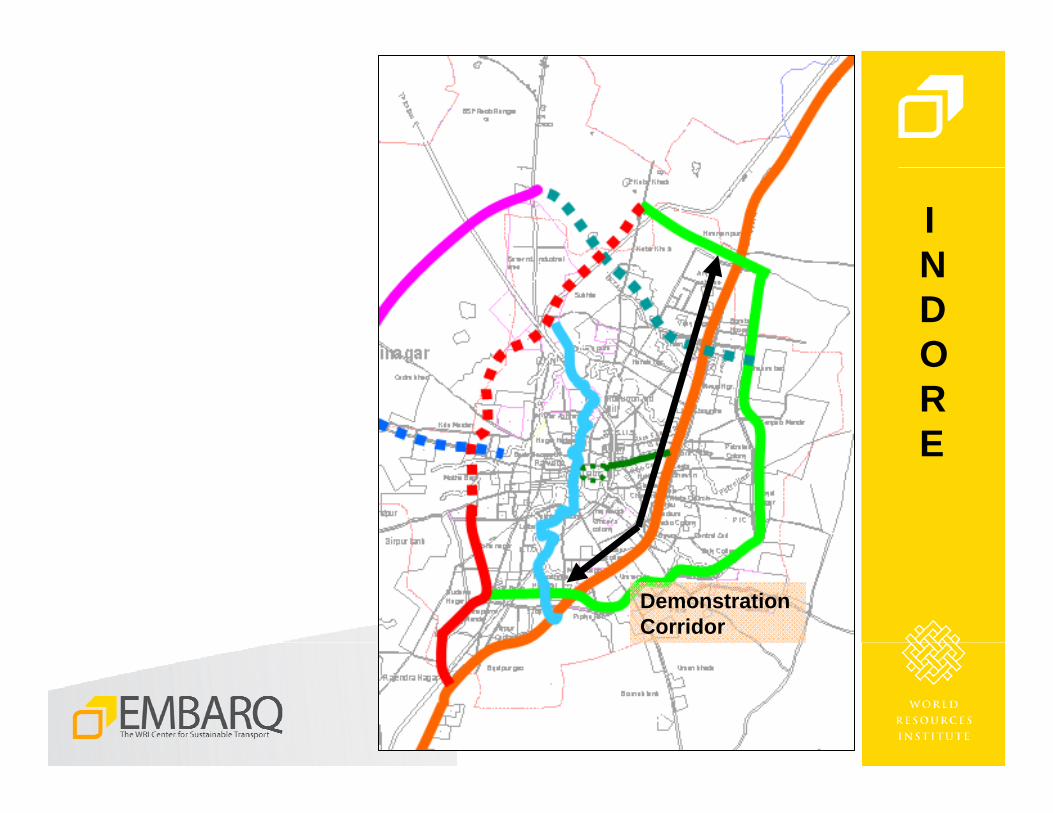
INDORE
Project Highlights
Project Owners – District Collectorate
Program Manager – ICTSL
Other partners IDA, Mehta & Associates, PMC, EMBARQ
BRTS Master Plan – 88 km
12 km Pilot – 47 km Phase I – 39 km Phase II
12 kms sanctioned
50% funds from JnNURM
Pilot will be inaugurated December 2009
INDORE
Project Highlights
Stations close to intersections with staggered stations
Plan to operate only ICTSL buses (5 routes) in pilot corridor
SPV - ICTSL created and has been managing operations for over 2 years
Private bus operations under route concessions since inception in 2005
Use of high quality low floor Tata star buses to run operations
Demonstrated use of GPS technology to track vehicles
INDORE
Demonstration Corridor
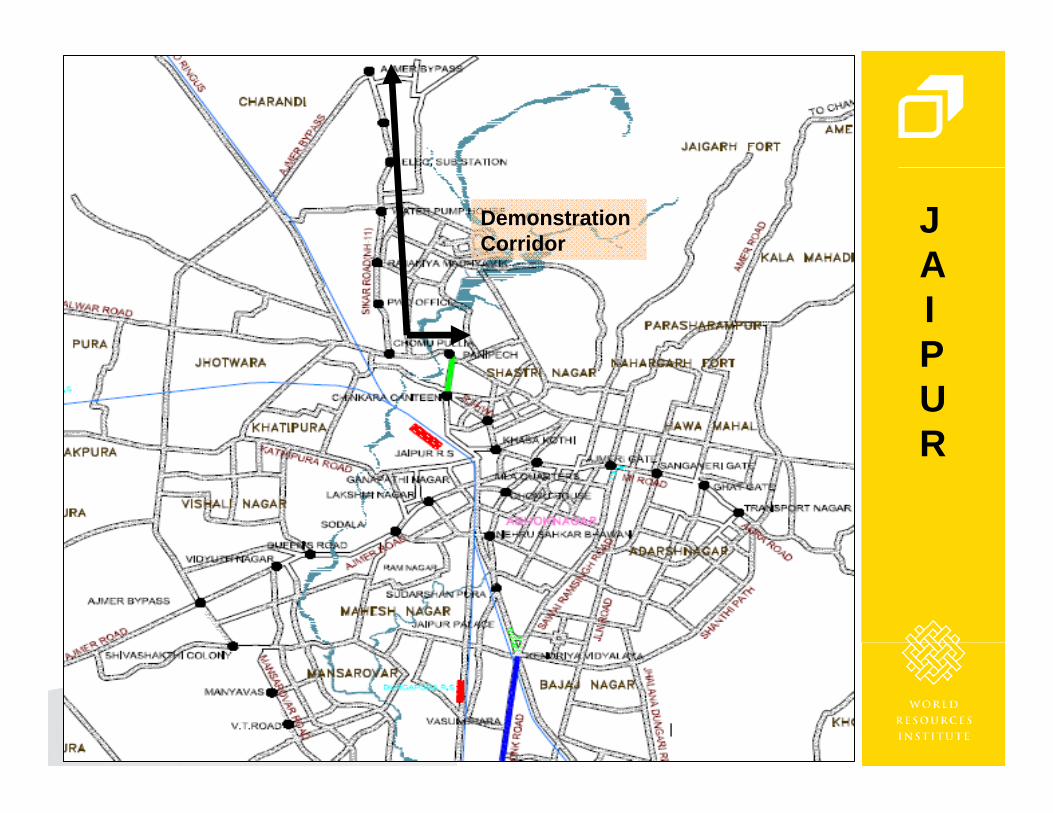
JAIPUR
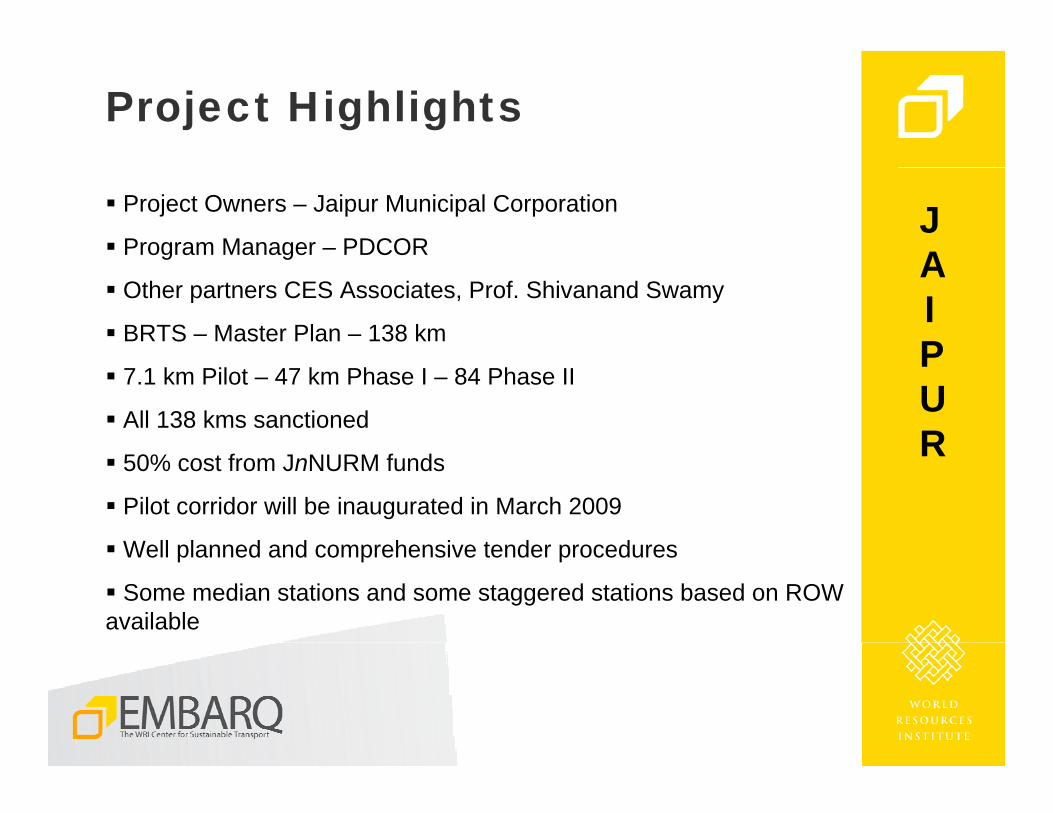
Project Highlights
Project Owners – Jaipur Municipal Corporation
Program Manager – PDCOR
Other partners CES Associates, Prof. Shivanand Swamy
BRTS – Master Plan – 138 km
7.1 km Pilot – 47 km Phase I – 84 Phase II
All 138 kms sanctioned
50% cost from JnNURM funds
Pilot corridor will be inaugurated in March 2009
Well planned and comprehensive tender procedures
Some median stations and some staggered stations based on ROW available
JAIPUR
Demonstration Corridor
PUNE
PUNE
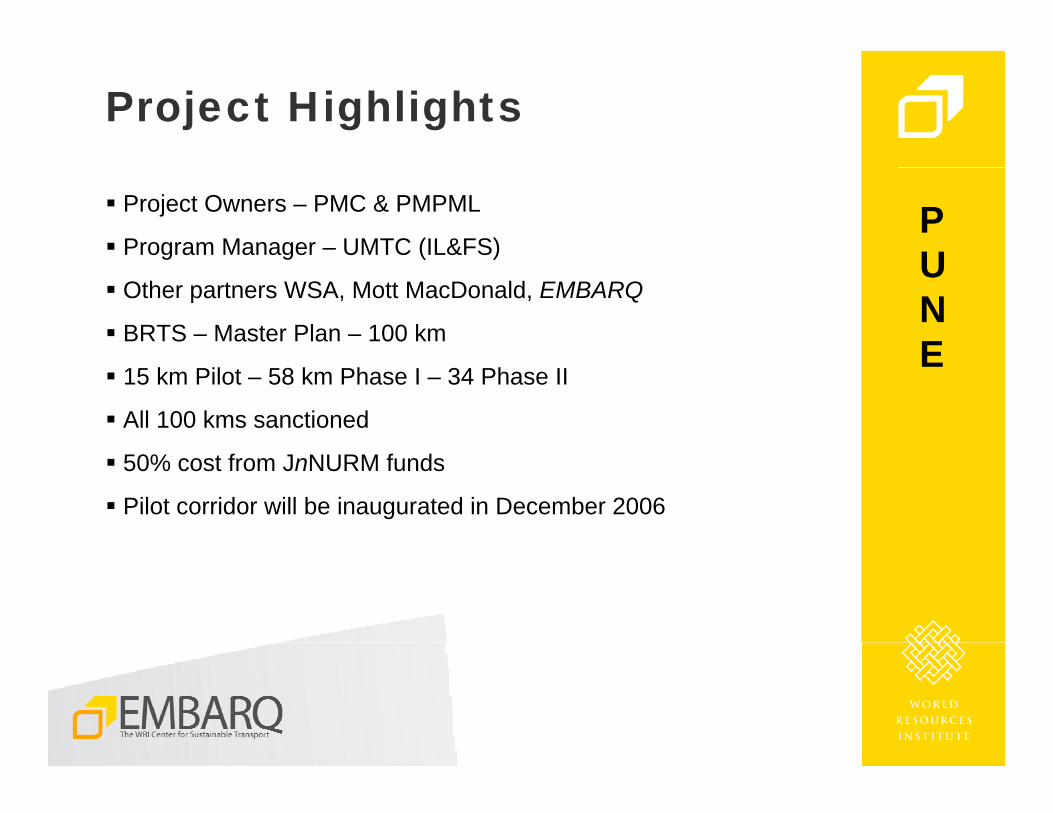
Project Highlights
Project Owners – PMC & PMPML
Program Manager – UMTC (IL&FS)
Other partners WSA, Mott MacDonald, EMBARQ
BRTS – Master Plan – 100 km
15 km Pilot – 58 km Phase I – 34 Phase II
All 100 kms sanctioned
50% cost from JnNURM funds
Pilot corridor will be inaugurated in December 2006
PUNE
Broad Observations from Case Studies
Bus Boost to Bus Based - Public Transport
A need for bus based public transport and preferential treatmentof buses realized by central government (Ministry of Urban Development)
Change in perspective of senior city bureaucrats towards bus-based public transport system due to national workshops and exposure trips.
Realization in city bureaucracy for restructuring state/municipal corporation owned bus companies and implementing organized bus based public transport in cities where IPT has major share.
Internal capacity building for City staff

Bus Capacity BuildingBus Industry
Bus body building was a cottage industry until a few years ago.
In the last four years manufacturers through internal research and joint ventures have rapidly built capacity.
Tata and Ashok Leyland have launched new buses in the last years
New experiments in seating and other arrangements for internal space are in progress.
Bus Capacity BuildingITS Industry
Local manufacturers are working very hard to build capacity in manufacturing GPS devices, traffic signal technology and other ITS equipment.
Local manufacturers have managed to significantly drop costs
Consulting Expertise
Contractors
Exposure visits, MoUD workshops and conferences like this have provided an excellent platform for exchange
Difficulties of working with new vendors
Costs for technology haven’t stabilized, which makes financial planning extremely difficult
Technologies (buses and equipment) haven’t been fully tested and systems have endure a learning process as industry matures
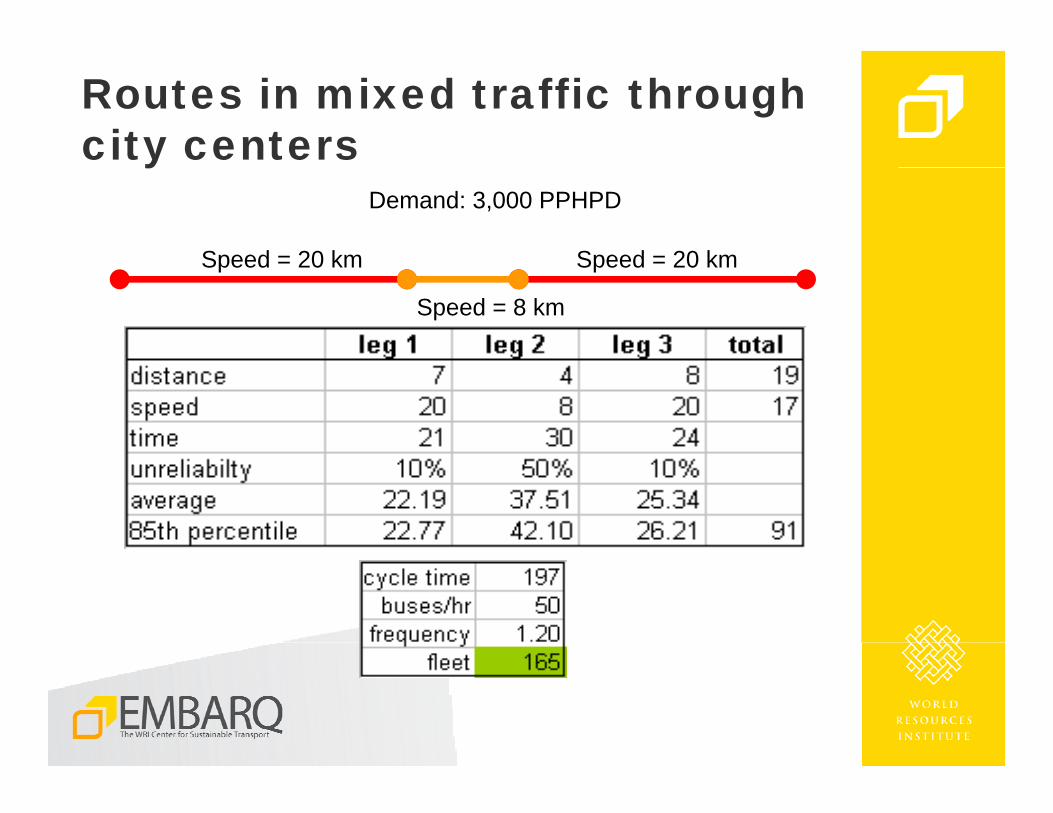
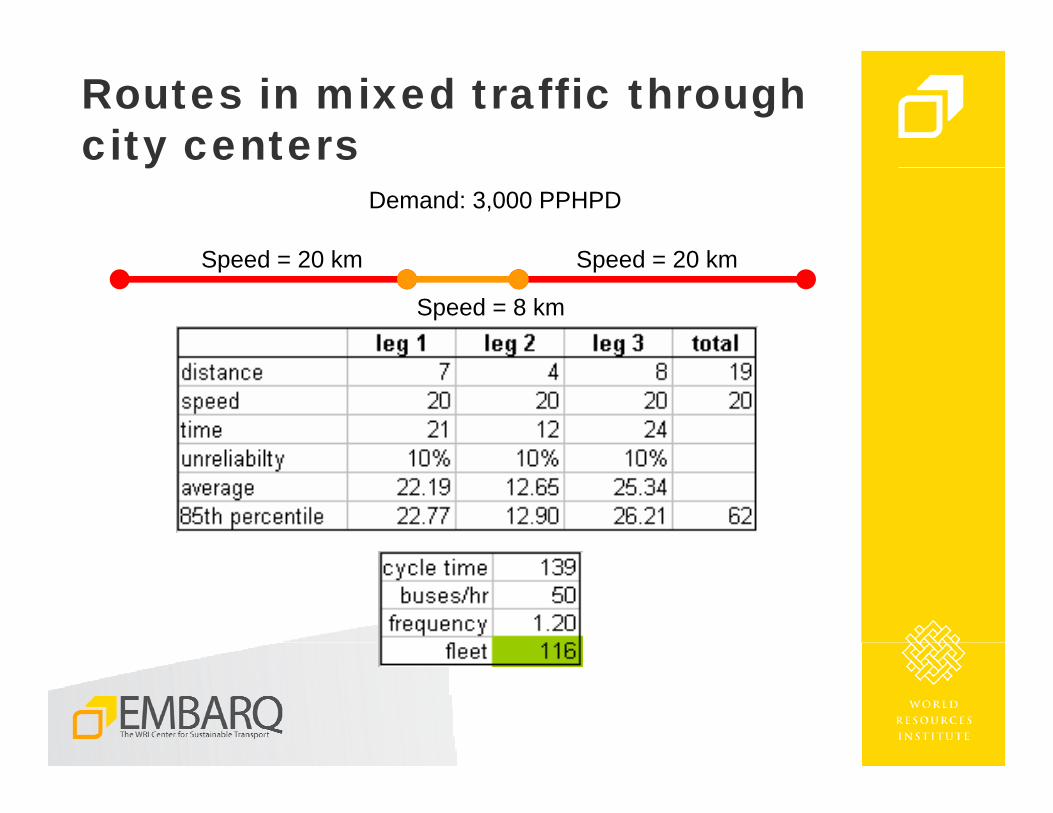
Routes in mixed traffic through city centers
Demand: 3,000 PPHPD
Speed = 20 km Speed = 20 km
Speed = 8 km
Routes in mixed traffic through city centers
Demand: 3,000 PPHPD
Speed = 20 km Speed = 20 km
Speed = 8 km
Fare Levels
Fare levels are low, one rupee per kilometer or lower
Planned services maybe faster, more reliable and with better bus and information technologies, however planned bus occupancy is very high
Fares at these levels alone are not sufficient to provide adequate level of service and make the system financially sustainable
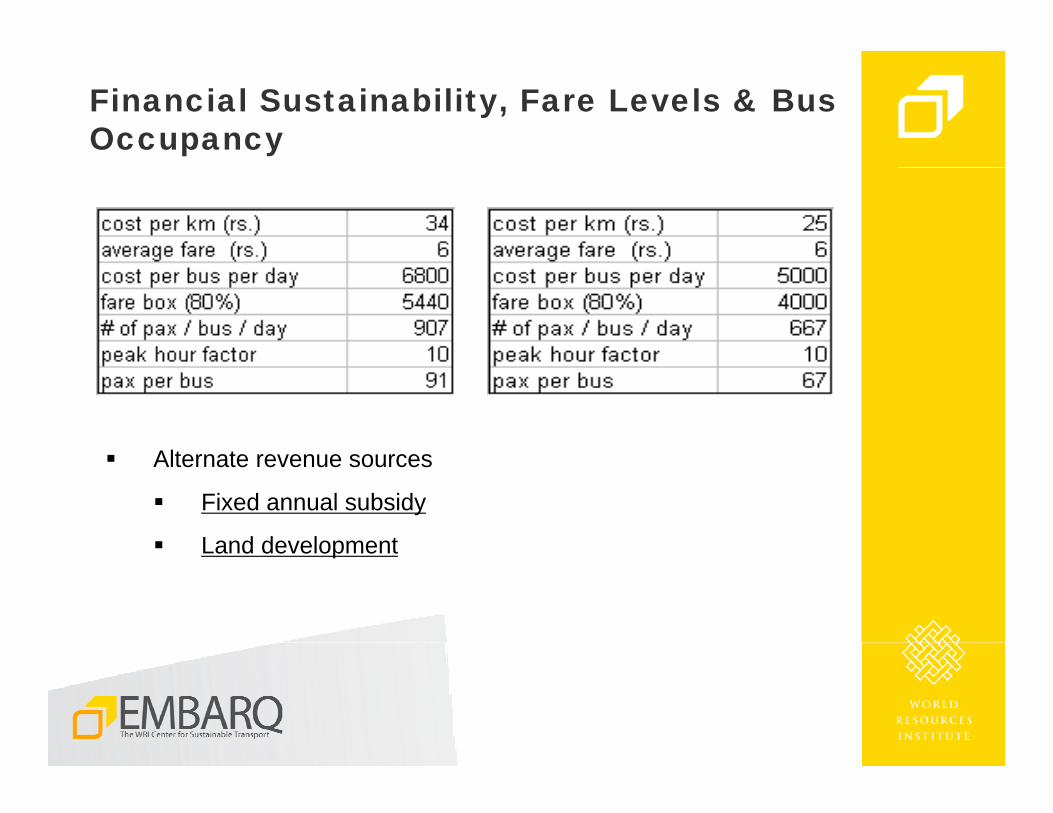
Financial Sustainability, Fare Levels & Bus Occupancy
Alternate revenue sources
Fixed annual subsidy
Land development
Convincing all City Staff
There is buy-in from the main stakeholders of the project, Engineers, contractors, land development authorities implementing the project are not fully convinced.
Logic of running the buses in median lanes continues to be questioned
Buy-in and confidence in the project is required to make bold decisions
Transfers of primary stakeholder has been a big concern
Special efforts to emphasize the need for equitable allocation of road space to all its constituents (Pedestrians, Bicyclists, Public transport, IPT and Personal vehicles).
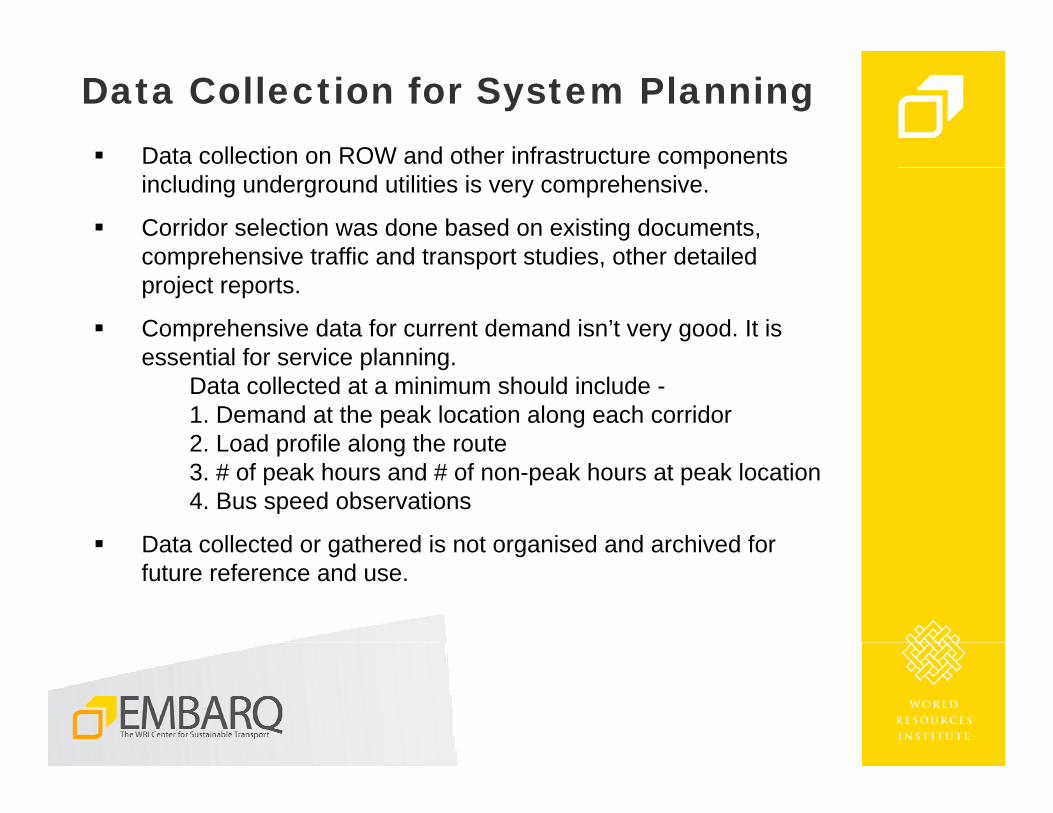
Data Collection for System PlanningData collection on ROW and other infrastructure components including underground utilities is very comprehensive.
Corridor selection was done based on existing documents, comprehensive traffic and transport studies, other detailed project reports.
Comprehensive data for current demand isn’t very good. It is essential for service planning.
Data collected at a minimum should include -1. Demand at the peak location along each corridor 2. Load profile along the route 3. # of peak hours and # of non-peak hours at peak location4. Bus speed observations
Data collected or gathered is not organised and archived for future reference and use.
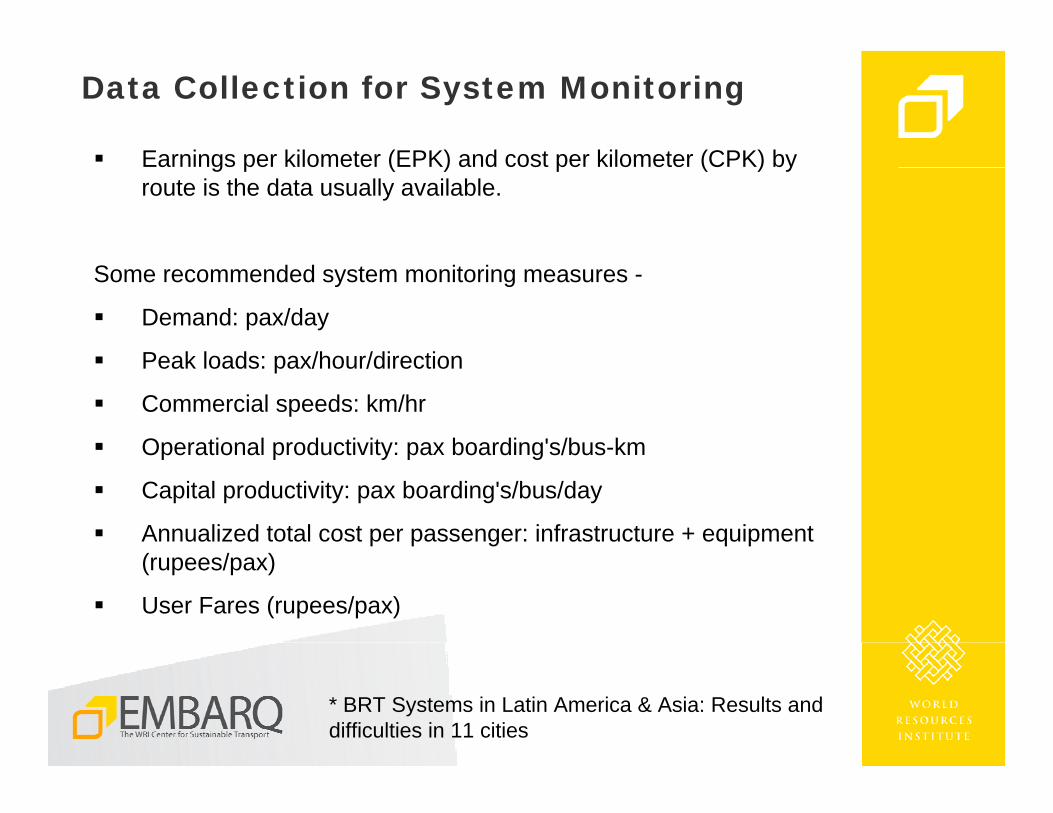
Data Collection for System Monitoring
Earnings per kilometer (EPK) and cost per kilometer (CPK) by route is the data usually available.
Some recommended system monitoring measures -
Demand: pax/day
Peak loads: pax/hour/direction
Commercial speeds: km/hr
Operational productivity: pax boarding's/bus-km
Capital productivity: pax boarding's/bus/day
Annualized total cost per passenger: infrastructure + equipment (rupees/pax)
User Fares (rupees/pax)
* BRT Systems in Latin America & Asia: Results and difficulties in 11 cities
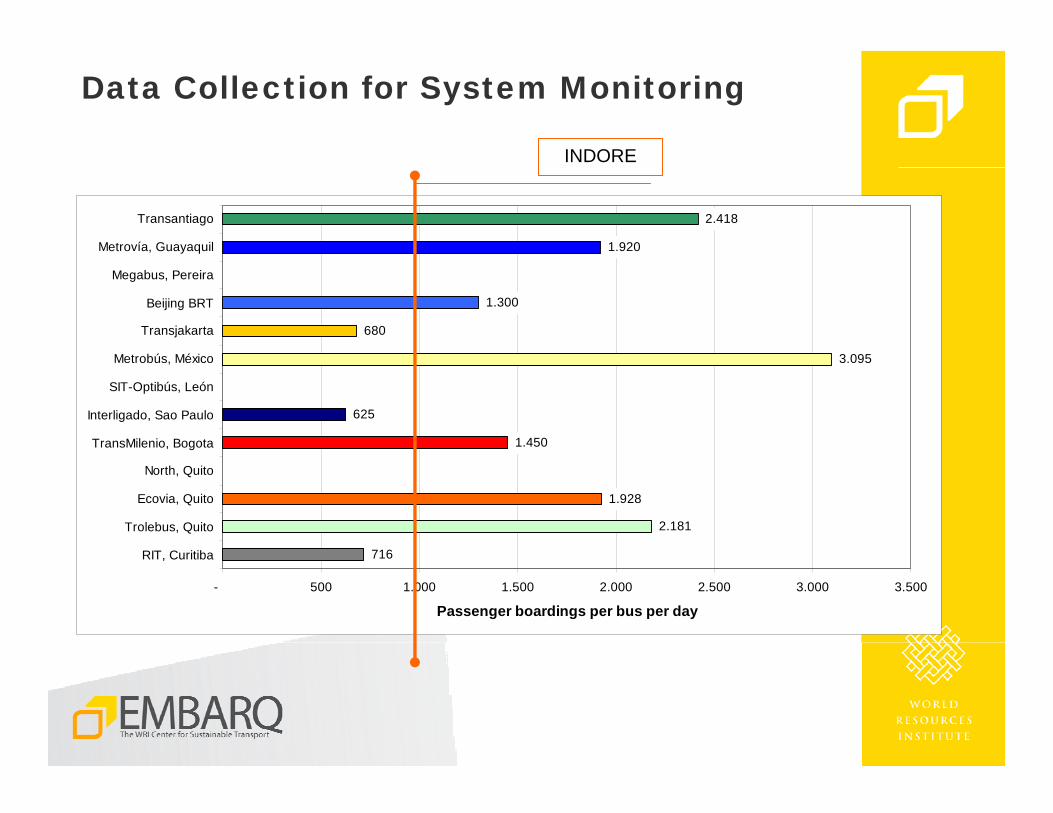
Data Collection for System Monitoring
716
2.181
1.928
1.450
625
3.095
680
1.300
1.920
2.418
- 500 1.000 1.500 2.000 2.500 3.000 3.500
RIT, Curitiba
Trolebus, Quito
Ecovia, Quito
North, Quito
TransMilenio, Bogota
Interligado, Sao Paulo
SIT-Optibús, León
Metrobús, México
Transjakarta
Beijing BRT
Megabus, Pereira
Metrovía, Guayaquil
Transantiago
Passenger boardings per bus per day
INDORE
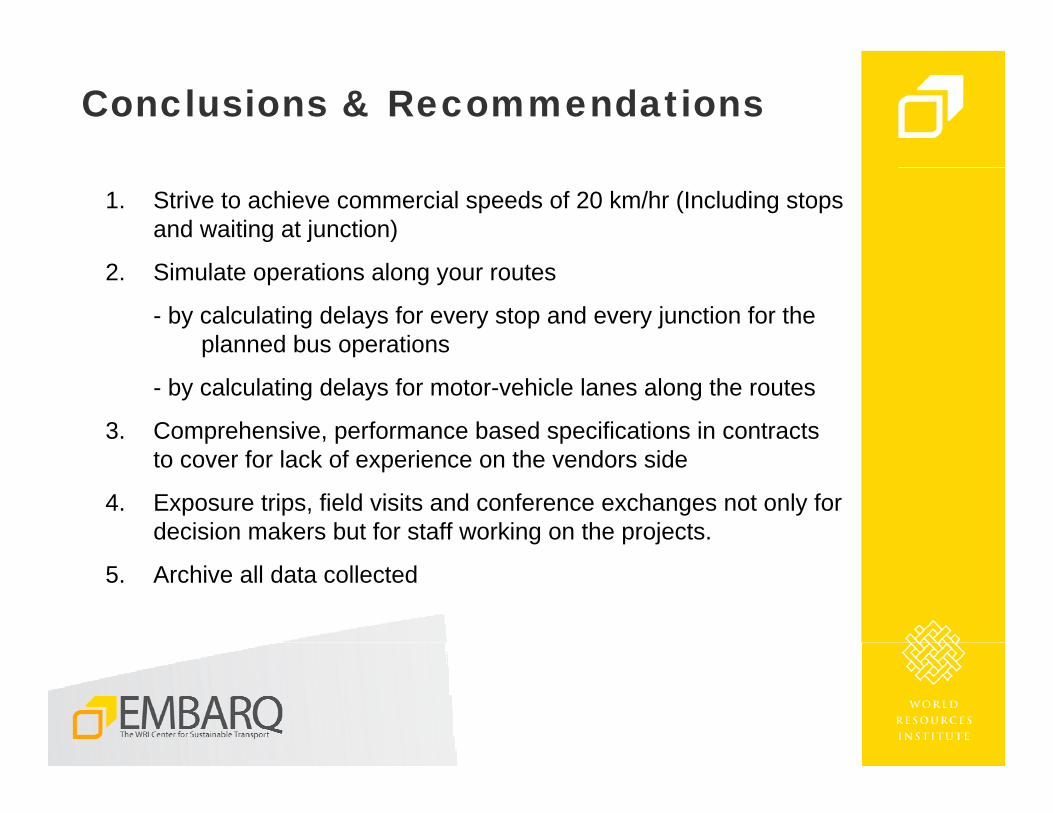
Conclusions & Recommendations
1. Strive to achieve commercial speeds of 20 km/hr (Including stopsand waiting at junction)
2. Simulate operations along your routes
- by calculating delays for every stop and every junction for theplanned bus operations
- by calculating delays for motor-vehicle lanes along the routes
3. Comprehensive, performance based specifications in contracts to cover for lack of experience on the vendors side
4. Exposure trips, field visits and conference exchanges not only for decision makers but for staff working on the projects.
5. Archive all data collected
EMBARQ, is the World Resources Institute Center for Sustainable Transport, a non-profit (501 C 3) organization head quartered in Washington, DC, founded with a grant from the Shell Foundation.
Since 2002, EMBARQ has worked to implement sustainable transport solutions in effort to improve the environment and quality of life in cities worldwide.

www.embarq.wri.org
¡Muchas Gracias!
Foundation
Global Strategic Partners
SUMA PartnershipSustainable Urban Mobility in Asia
CAI Asia – ADB - SIDA