TOD Case Studies: Density Bonusing & Bus Rapid Transit · TOD Case Studies: Density Bonusing & Bus...
29
© OECD/IEA 2016 © OECD/IEA 2015 TOD Case Studies: Density Bonusing & Bus Rapid Transit Holly Foxcroft Urban Analyst June 8, 2016
Transcript of TOD Case Studies: Density Bonusing & Bus Rapid Transit · TOD Case Studies: Density Bonusing & Bus...

© OECD/IEA 2016 © OECD/IEA 2015
TOD Case Studies: Density Bonusing & Bus Rapid Transit
Holly Foxcroft
Urban Analyst June 8, 2016

© OECD/IEA 2016
Transit Oriented Development
An urban planning policy tool to create dense, mixed-use development (office, retail, and residential) within walking distance of a rapid transit station (rail, light rail, or bus rapid transit).
500 m 1 km
© OECD/IEA 2016
MAXIMIZING THE BENEFITS OF DENSITY IN BANGKOK, THAILAND
Case Study

© OECD/IEA 2016
Bangkok and Vicinity Development Structure Plan
Source: Comprehensive Plan 2013 (City of Bangkok)
© OECD/IEA 2016
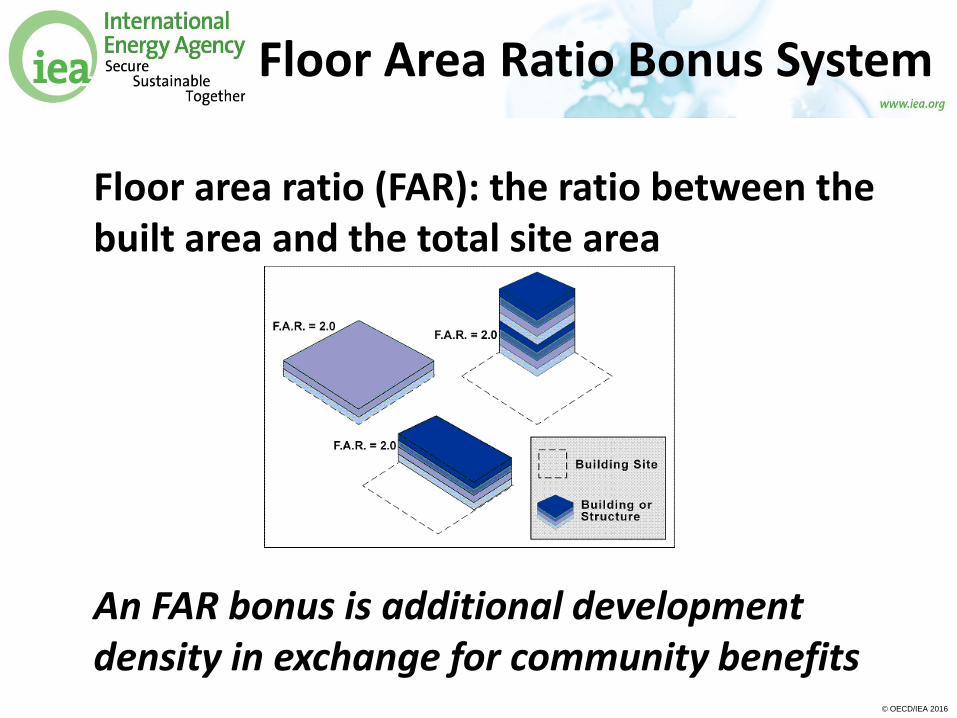
Floor Area Ratio Bonus System
Floor area ratio (FAR): the ratio between the built area and the total site area
An FAR bonus is additional development density in exchange for community benefits

© OECD/IEA 2016
Discussion Question
What are the benefits of increasing density in your city?
(5 minutes discussion time)
© OECD/IEA 2016
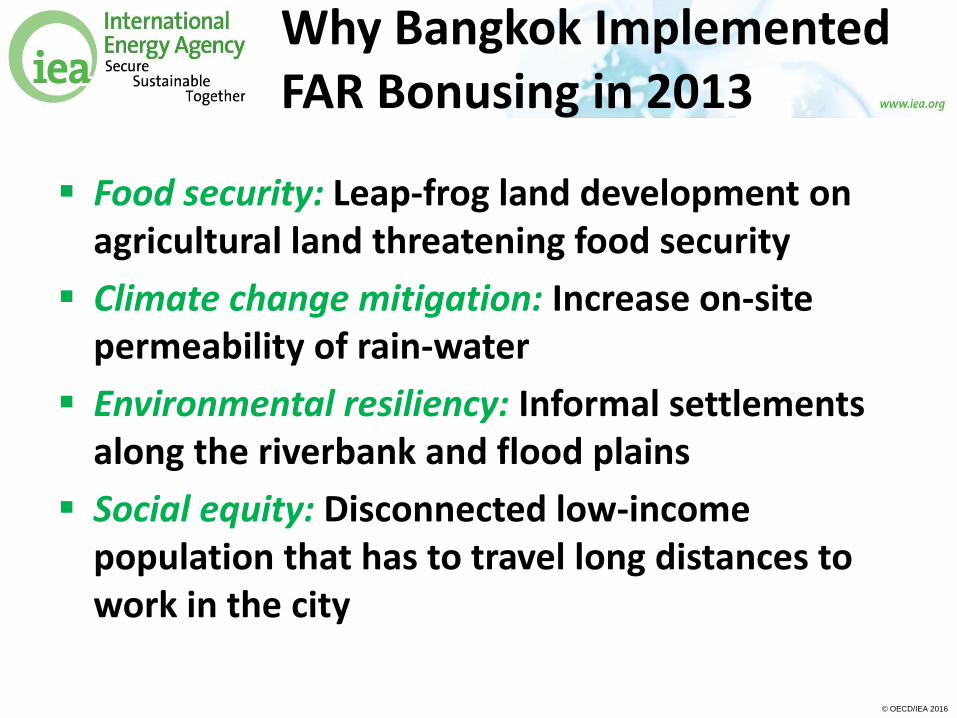
Why Bangkok Implemented FAR Bonusing in 2013
Food security: Leap-frog land development on agricultural land threatening food security
Climate change mitigation: Increase on-site permeability of rain-water
Environmental resiliency: Informal settlements along the riverbank and flood plains
Social equity: Disconnected low-income population that has to travel long distances to work in the city
© OECD/IEA 2016
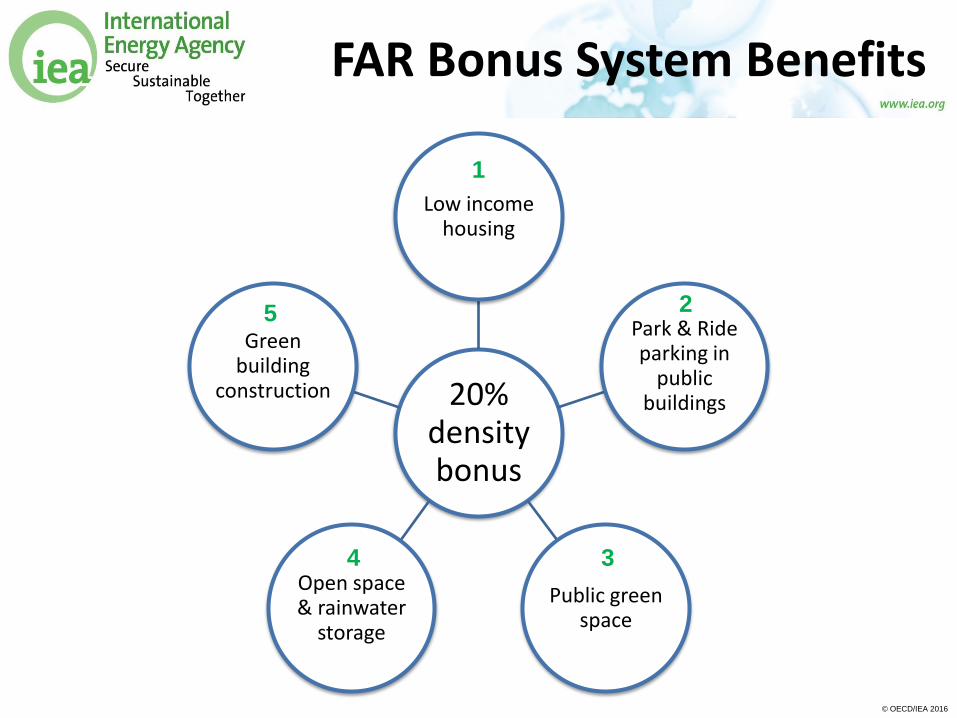
FAR Bonus System Benefits
20% density bonus
Low income housing
Park & Ride parking in
public buildings
Public green space
Open space & rainwater
storage
Green building
construction
1
2
3 4
5

© OECD/IEA 2016
Applying the FAR Bonus 1/3
Low income housing
Park & Ride parking in
public buildings
1
2
Source: Comprehensive Plan 2013 (City of Bangkok)

© OECD/IEA 2016
Applying the FAR Bonus 2/3
Public green space
Open space & rainwater
storage
3
4
Source: Comprehensive Plan 2013 (City of Bangkok)

© OECD/IEA 2016
Applying the FAR Bonus 3/3
Green building
construction
5
Source: Comprehensive Plan 2013 (City of Bangkok)
© OECD/IEA 2016
Discussion Question
What are potential challenges in your city that could be improved by using the density bonusing tool?
(5 minutes discussion time)
© OECD/IEA 2016
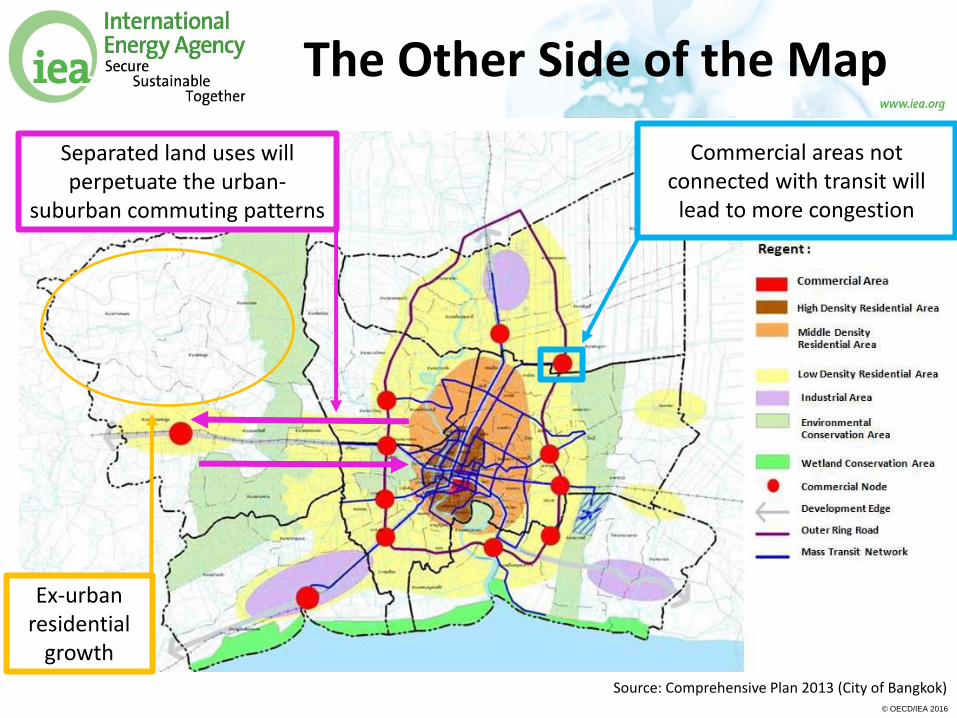
The Other Side of the Map
Separated land uses will perpetuate the urban-
suburban commuting patterns
Commercial areas not connected with transit will
lead to more congestion
Ex-urban residential
growth
Source: Comprehensive Plan 2013 (City of Bangkok)

© OECD/IEA 2016
Lessons Learned
TOD does not exist in Bangkok: planning policy has been incremental, iterative, and is clearly delineated
FAR bonusing only applies to new buildings and building sites: incentivizing existing buildings and building sites with FAR may recapture land in desirable areas
Greater coordination with planning and transit: compact urban form relies on mixed-use spaces that have access to rapid transit
© OECD/IEA 2016
BUS RAPID TRANSIT & LAGOS, NIGERIA
Case Study
© OECD/IEA 2016
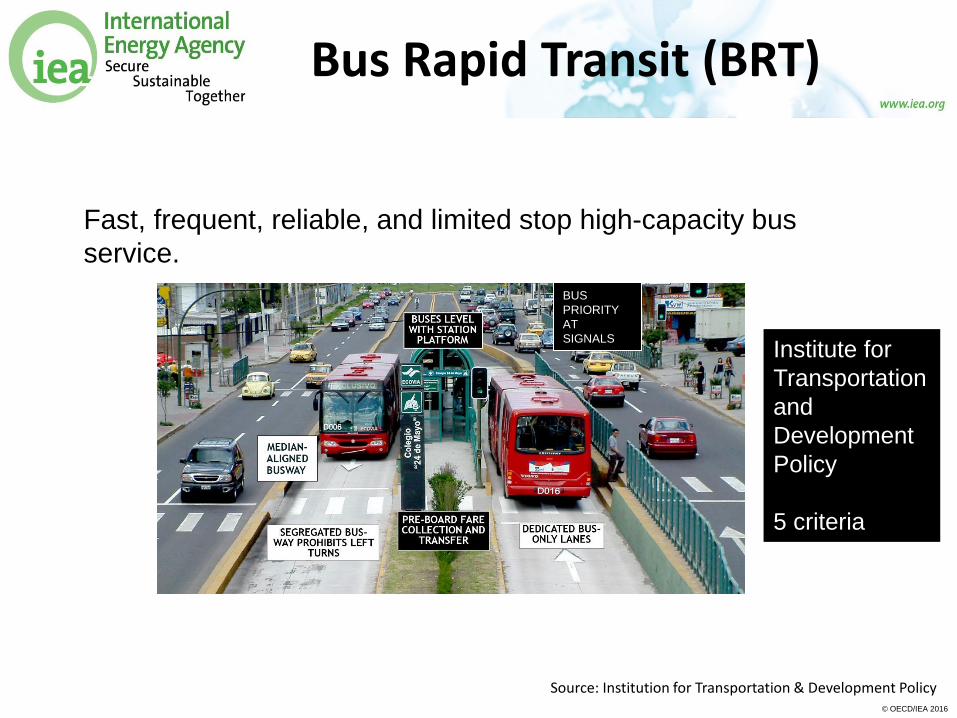
Bus Rapid Transit (BRT)
Fast, frequent, reliable, and limited stop high-capacity bus
service.
BUS
PRIORITY
AT
SIGNALS
Institute for
Transportation
and
Development
Policy
5 criteria
Source: Institution for Transportation & Development Policy
© OECD/IEA 2016
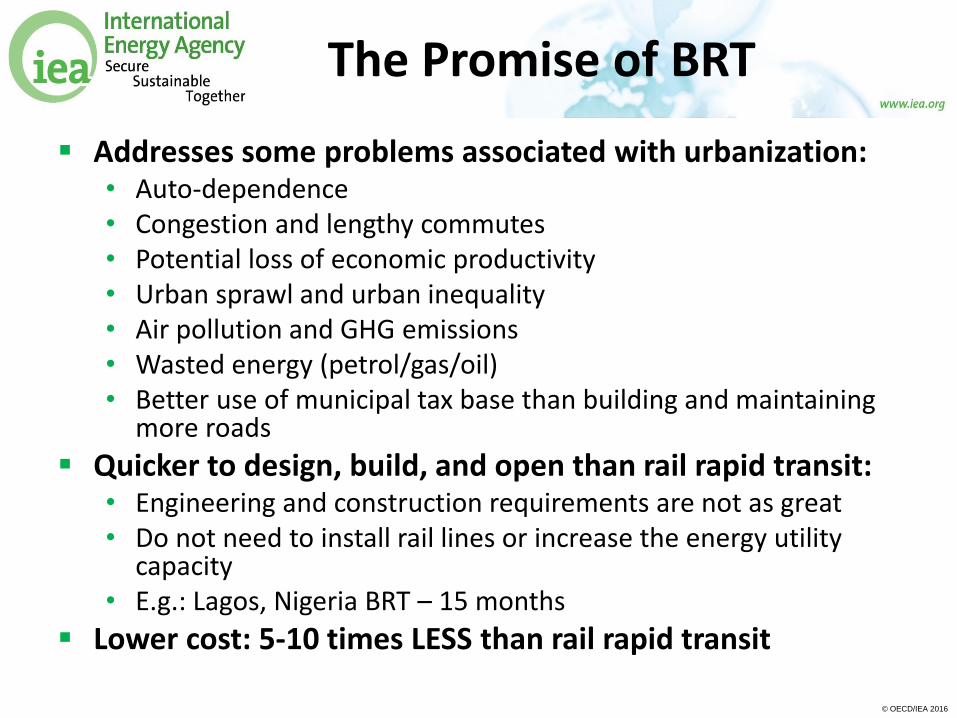
The Promise of BRT
Addresses some problems associated with urbanization: • Auto-dependence • Congestion and lengthy commutes • Potential loss of economic productivity • Urban sprawl and urban inequality • Air pollution and GHG emissions • Wasted energy (petrol/gas/oil) • Better use of municipal tax base than building and maintaining
more roads
Quicker to design, build, and open than rail rapid transit: • Engineering and construction requirements are not as great • Do not need to install rail lines or increase the energy utility
capacity • E.g.: Lagos, Nigeria BRT – 15 months
Lower cost: 5-10 times LESS than rail rapid transit

© OECD/IEA 2016
BRT & Energy Use
Land Development Benefits
Can encourages higher density development
Less fuel consumption from private vehicles because VKT is reduced
BRT Operating Benefits
Opportunity to shift to more fuel efficient transit vehicles – compressed natural gas, electric
Less energy intensive form of transportation

© OECD/IEA 2016
Energy Intensity of Passenger Transport
Colour Country
World (range)
OECD
World
Non-OECD
Source: IEA, Energy Technology Perspective 2016
Buses and
minibuses are
up to 3 times
more efficient at
moving people
© OECD/IEA 2016
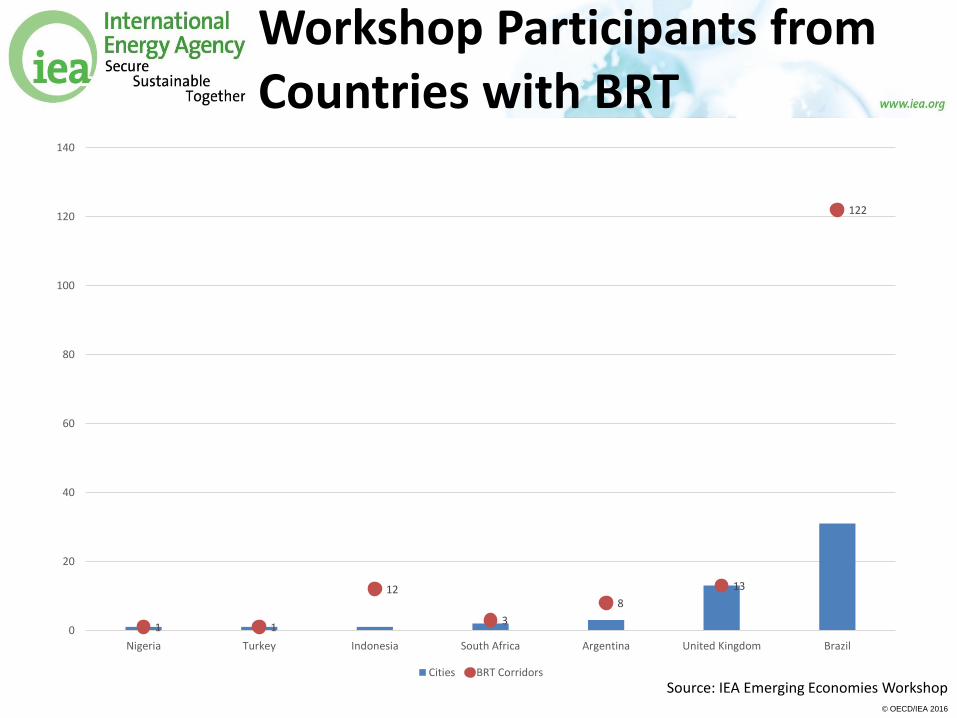
Workshop Participants from Countries with BRT
1 1
12
3
8
13
122
0
20
40
60
80
100
120
140
Nigeria Turkey Indonesia South Africa Argentina United Kingdom Brazil
Cities BRT Corridors
Source: IEA Emerging Economies Workshop

© OECD/IEA 2016
Discussion Questions
For those participants that do not have BRT in their cities – What is the main barrier to implementation?
For those participants that have BRT in their cities – What has been the biggest challenge after implementation?
(7 minutes discussion time)

© OECD/IEA 2016
Case Study: Lagos, Nigeria
Source: Lagos Metropolitan Area Transportation Authority
© OECD/IEA 2016
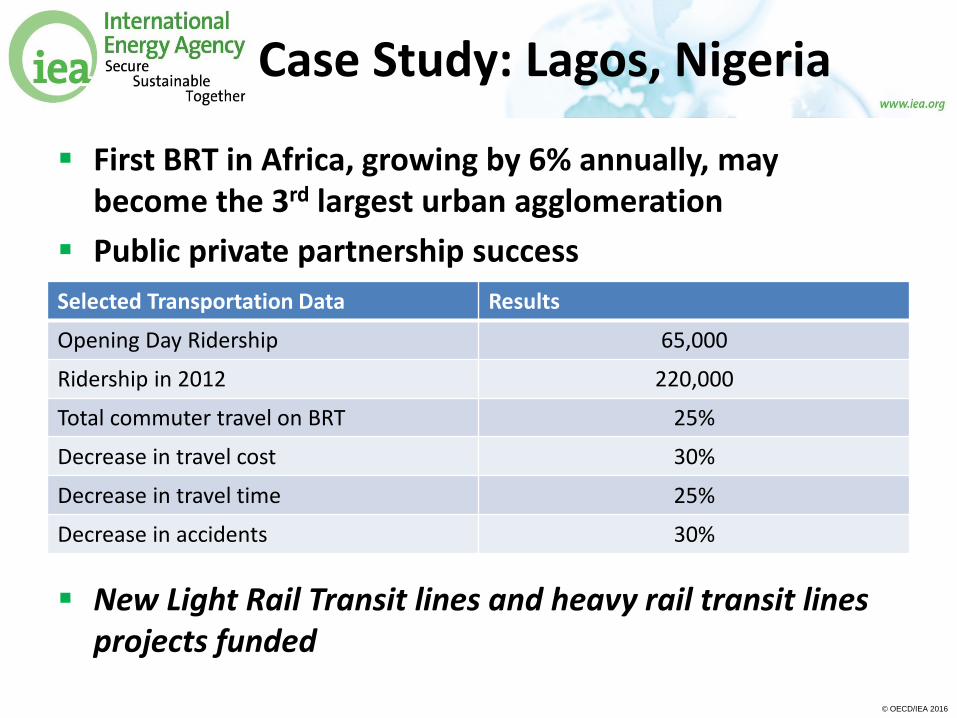
Case Study: Lagos, Nigeria
First BRT in Africa, growing by 6% annually, may become the 3rd largest urban agglomeration
Public private partnership success
New Light Rail Transit lines and heavy rail transit lines projects funded
Selected Transportation Data Results
Opening Day Ridership 65,000
Ridership in 2012 220,000
Total commuter travel on BRT 25%
Decrease in travel cost 30%
Decrease in travel time 25%
Decrease in accidents 30%

© OECD/IEA 2016
Lessons Learned: Community Participation and Education
• Community consultation was critical to success Understanding of project objectives, principles, rules, and
regulations is necessary for community support and trust of the process and project partners
Incorrect placement of stations may pervert important travel demand indicators
• Citizen behaviour may disrupt the functioning of the travel time reliability Pedestrians illegally crossing the road
Unauthorized vehicles using the BRT lane
© OECD/IEA 2016
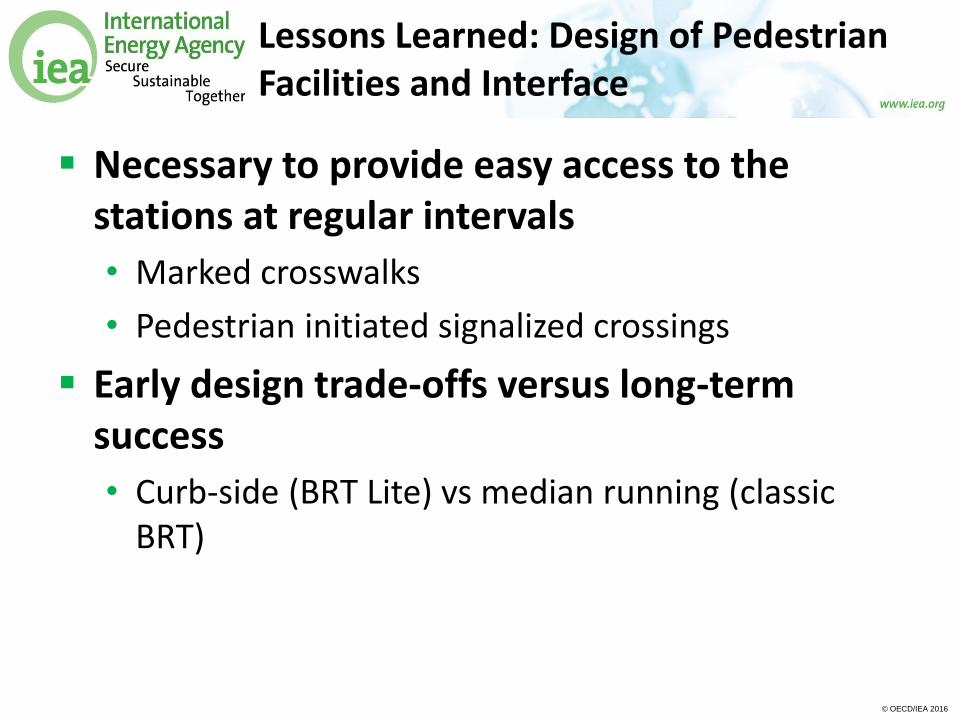
Lessons Learned: Design of Pedestrian Facilities and Interface
Necessary to provide easy access to the stations at regular intervals
• Marked crosswalks
• Pedestrian initiated signalized crossings
Early design trade-offs versus long-term success
• Curb-side (BRT Lite) vs median running (classic BRT)

© OECD/IEA 2016
Lessons Learned: Policy Consistency
Consistency in land use and transportation policies to ensure that high density, mixed use development occurs near transit areas
• This has been planned for the forthcoming Blue Line (Heavy Rail)
• Coordination with multiple layers of governments
Scaleability of the network
Land speculation & incentivization of sprawl vs. capturing the property value lift from transit

© OECD/IEA 2016
Final Thoughts
TOD and BRT are complimentary but require extensive coordination across levels of government and departments (transportation, planning, energy) and buy-in from the community
Both are tools to develop cities that are more resilient, equitable, efficient, and sustainable

© OECD/IEA 2016 © OECD/IEA 2015
Thanks!
Holly Foxcroft
Urban Analyst
© OECD/IEA 2016
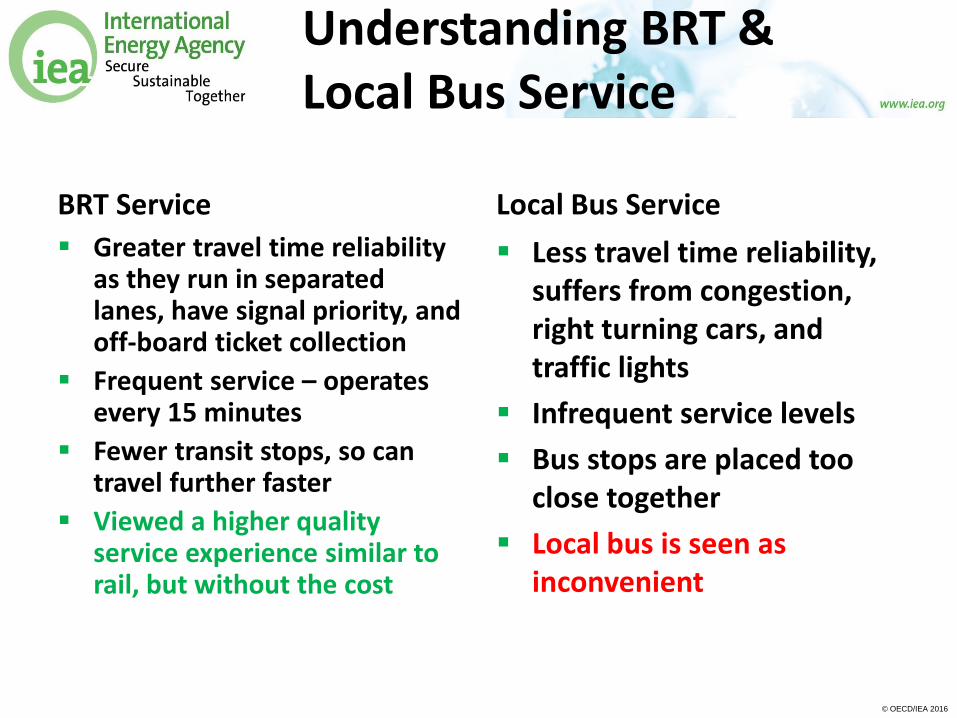
Understanding BRT & Local Bus Service
BRT Service
Greater travel time reliability as they run in separated lanes, have signal priority, and off-board ticket collection
Frequent service – operates every 15 minutes
Fewer transit stops, so can travel further faster
Viewed a higher quality service experience similar to rail, but without the cost
Local Bus Service
Less travel time reliability, suffers from congestion, right turning cars, and traffic lights
Infrequent service levels
Bus stops are placed too close together
Local bus is seen as inconvenient


