Formulated Beverages Survey Questionnaire Development and Testing ... ‘energy drinks’ ... Sample...
66
Roy Morgan Research Page 1 1 ATTACHMENT 3 Formulated Beverages Survey September 7, 2006 - Prepared for - Food Standards Australia New Zealand PO Box 7186 Canberra ACT 2610 Australia - Prepared by - Roy Morgan Research 401 Collins Street Melbourne, Victoria 3000
Transcript of Formulated Beverages Survey Questionnaire Development and Testing ... ‘energy drinks’ ... Sample...
Roy Morgan Research Page 1
1
ATTACHMENT 3
Formulated Beverages Survey
September 7, 2006
- Prepared for -
Food Standards Australia New Zealand
PO Box 7186
Canberra ACT 2610
Australia
- Prepared by -
Roy Morgan Research
401 Collins Street
Melbourne, Victoria 3000
Formulated Beverages Survey
43
INDEX
1. INTRODUCTION ............................................................................................................... 44
1.1 Background..................................................................................................................... 44
1.2 Objectives ....................................................................................................................... 44
2. METHODOLOGY .................................................................................................................... 45
2.1 Questionnaire Development and Testing ....................................................................... 45
2.2 Sample 45
2.3 Weighting ........................................................................................................................ 46
2.4 Statistical Significance Testing....................................................................................... 47
2.5 Outputs and Deliverables ............................................................................................... 47
3. MAIN FINDINGS ............................................................................................................... 48
3.1 Non-Alcoholic Beverage Consumption .......................................................................... 48
3.1.1 Non-Alcoholic Beverages Consumed in a Typical Week 48
3.1.2 Non-Alcoholic Beverages Consumed the Most 50
3.2 Formulated Beverage Consumption ............................................................................... 56
3.2.1 Formulated Beverages Tried in the Last 12 Months 56
3.2.2 Frequency of Drinking Formulated Beverages 57
3.2.3 Formulated Beverage Brand Consumed the Most 59
3.2.4 Other Non-Alcoholic Beverages Consumed on Days that Formulated Beverages are
Consumed 62
3.2.5 Total Daily Non-Alcoholic Fluid Consumption when Formulated Beverages are
Consumed 65
3.2.6 Formulated Beverage as a Substitute or Supplement for other Non-Alcoholic
Beverages 66
3.2.7 Non-Alcoholic Drinks Typically Replaced by Formulated Beverages 68
3.2.8 Non-Alcoholic Drinks that Typically Substitute Formulated Beverages 71
3.2.9 Reasons for First Trial of Formulated Beverage 73
3.3 Drink Choice Motivation ................................................................................................ 74
3.4 Comparison of Beverages............................................................................................... 81
Appendix One – Technical Notes
Appendix Two – Final Questionnaire
Formulated Beverages Survey
44
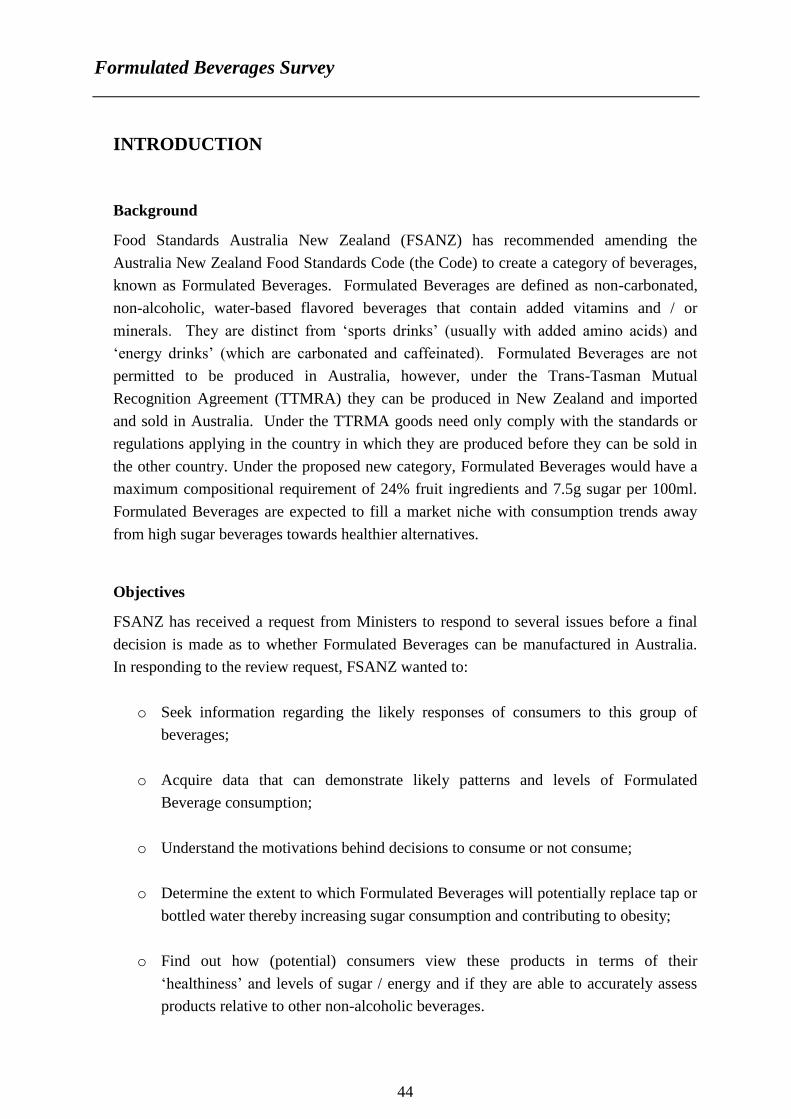
INTRODUCTION
Background
Food Standards Australia New Zealand (FSANZ) has recommended amending the
Australia New Zealand Food Standards Code (the Code) to create a category of beverages,
known as Formulated Beverages. Formulated Beverages are defined as non-carbonated,
non-alcoholic, water-based flavored beverages that contain added vitamins and / or
minerals. They are distinct from ‘sports drinks’ (usually with added amino acids) and
‘energy drinks’ (which are carbonated and caffeinated). Formulated Beverages are not
permitted to be produced in Australia, however, under the Trans-Tasman Mutual
Recognition Agreement (TTMRA) they can be produced in New Zealand and imported
and sold in Australia. Under the TTRMA goods need only comply with the standards or
regulations applying in the country in which they are produced before they can be sold in
the other country. Under the proposed new category, Formulated Beverages would have a
maximum compositional requirement of 24% fruit ingredients and 7.5g sugar per 100ml.
Formulated Beverages are expected to fill a market niche with consumption trends away
from high sugar beverages towards healthier alternatives.
Objectives
FSANZ has received a request from Ministers to respond to several issues before a final
decision is made as to whether Formulated Beverages can be manufactured in Australia.
In responding to the review request, FSANZ wanted to:
o Seek information regarding the likely responses of consumers to this group of
beverages;
o Acquire data that can demonstrate likely patterns and levels of Formulated
Beverage consumption;
o Understand the motivations behind decisions to consume or not consume;
o Determine the extent to which Formulated Beverages will potentially replace tap or
bottled water thereby increasing sugar consumption and contributing to obesity;
o Find out how (potential) consumers view these products in terms of their
‘healthiness’ and levels of sugar / energy and if they are able to accurately assess
products relative to other non-alcoholic beverages.
Formulated Beverages Survey
45
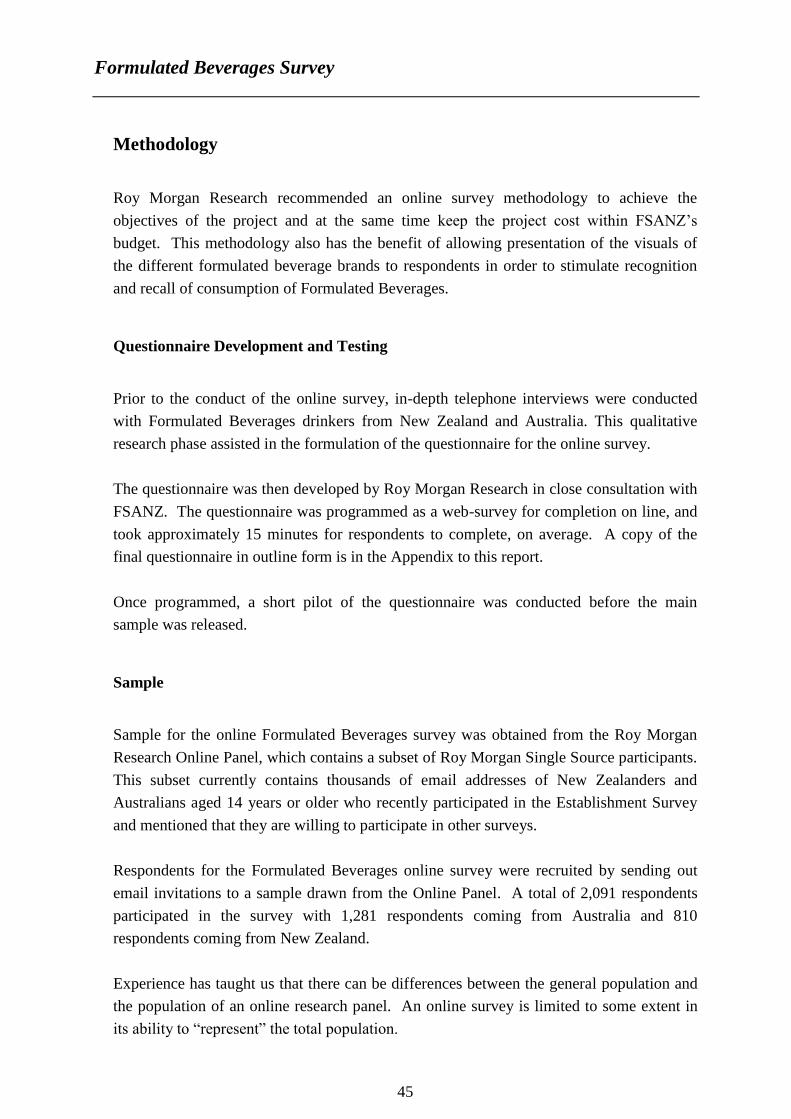
Methodology
Roy Morgan Research recommended an online survey methodology to achieve the
objectives of the project and at the same time keep the project cost within FSANZ’s
budget. This methodology also has the benefit of allowing presentation of the visuals of
the different formulated beverage brands to respondents in order to stimulate recognition
and recall of consumption of Formulated Beverages.
Questionnaire Development and Testing
Prior to the conduct of the online survey, in-depth telephone interviews were conducted
with Formulated Beverages drinkers from New Zealand and Australia. This qualitative
research phase assisted in the formulation of the questionnaire for the online survey.
The questionnaire was then developed by Roy Morgan Research in close consultation with
FSANZ. The questionnaire was programmed as a web-survey for completion on line, and
took approximately 15 minutes for respondents to complete, on average. A copy of the
final questionnaire in outline form is in the Appendix to this report.
Once programmed, a short pilot of the questionnaire was conducted before the main
sample was released.
Sample
Sample for the online Formulated Beverages survey was obtained from the Roy Morgan
Research Online Panel, which contains a subset of Roy Morgan Single Source participants.
This subset currently contains thousands of email addresses of New Zealanders and
Australians aged 14 years or older who recently participated in the Establishment Survey
and mentioned that they are willing to participate in other surveys.
Respondents for the Formulated Beverages online survey were recruited by sending out
email invitations to a sample drawn from the Online Panel. A total of 2,091 respondents
participated in the survey with 1,281 respondents coming from Australia and 810
respondents coming from New Zealand.
Experience has taught us that there can be differences between the general population and
the population of an online research panel. An online survey is limited to some extent in
its ability to “represent” the total population.
Formulated Beverages Survey
46
For instance, younger people who live in metropolitan areas and have a higher socio-
economic status are more likely to have access to the internet. Potential internet biases
were addressed in several ways:
Quotas were set to ensure that key demographic segments were not under-
represented in the online sample. Quotas for the different age groups were set to
ensure that the sample was representative of each country’s population. In order to
obtain a representative geographical spread, the sample was stratified by region
within each country.
To help understand the extent to which the online sample differed from the overall
population, we examined the income and education patterns of both the New
Zealand respondents and the Australian respondents compared to the New Zealand
and Australian population patterns of income and education division. While there
were differences, they were minor. There was insufficient justification in using
these differences to add a further level of weighting to attempt to correct for the
differences between the online sample and the general population.
Chi-square tests were conducted on the age and location groups for both the New
Zealand respondents and the Australian respondents compared to the New Zealand
and Australian population patterns (see Appendix One Technical Notes for
additional information). The tests showed that within both countries, for both age
and location, the differences between the sample distribution and the population
distribution were not statistically significant.
Weighting
Australia and New Zealand have been sampled deliberately at very different rates for this
study in order to ensure adequate representation of formulated beverage consumers. In this
regard, weights were applied to the data in order to correct for these disproportions and
combine the data from the two countries in a meaningful way.
As mentioned previously, the study produced a reasonably balanced sample by age and sex
and area within each country but still with some slight discrepancies compared to the
proportions of the actual population. Therefore the data were weighted by age, sex and
area within each country in order to correct for the remaining discrepancies in sampling,
removing any slight biases that might have arisen from over or under representing any age,
sex or area groups. The weights applied were based on the 2006 Australian Bureau of
Statistics (ABS) and Statistics New Zealand (SNZ) population estimates. The weights
applied, thus, sufficiently enabled projection of survey figures to the population.
Formulated Beverages Survey
47
Statistical Significance Testing
Statistical significance testing of the survey results has been conducted for individual cells
within each county and between the two countries For significance testing within each
country, individual cells were compared with corresponding row totals. For significance
testing between the two countries, individual cells from Australia were compared with
corresponding cells from New Zealand. Statistical significance is indicated in the following
tables when appropriate (see Appendix One Technical Notes for additional information).
Outputs and Deliverables
This report comprises a set of summary tables and brief descriptive text. The other main
deliverables were:
An ASTEROID dataset
An SPSS dataset
Formulated Beverages Survey
48
MAIN FINDINGS
Non-Alcoholic Beverage Consumption
Non-Alcoholic Beverages Consumed in a Typical Week
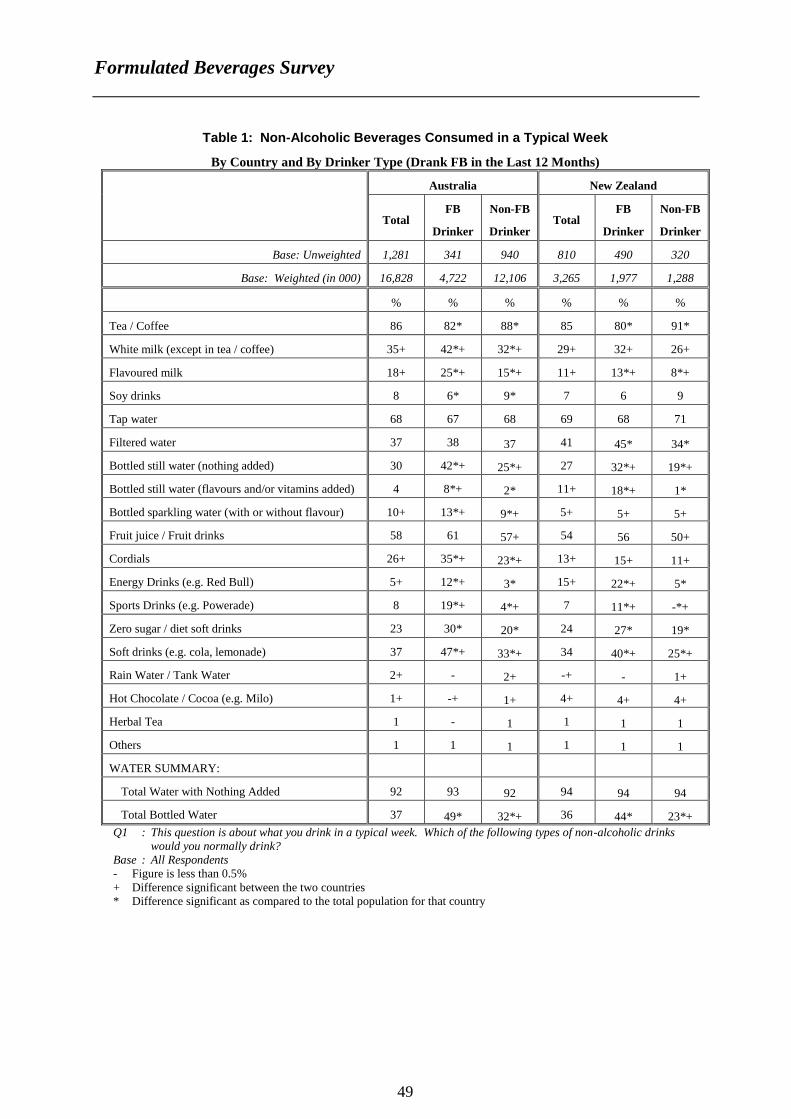
In a typical week, the most commonly consumed non-alcoholic beverages in both Australia
and New Zealand are tea and coffee (86% Australia; 85% New Zealand) followed by tap
water (68% Australia; 69% New Zealand) and fruit juice or fruit drinks (58% Australia;
54% New Zealand).
More than 9 out of 10 Australians and New Zealanders drink water with nothing added to
it (92% Australia; 94% New Zealand) in a typical week. This includes tap water, filtered
water and plain bottled water.
Just over a third of Australians and New Zealanders drink any kind of bottled water in a
typical week (37% Australia; 36% New Zealand). This includes bottled water with and
without additives.
As a proportion of each country’s population, there were more drinkers of white milk,
cordials, flavoured milk and bottled sparkling water in Australia than in New Zealand
(white milk 35% cf. 29%; cordials 26% cf. 13%; flavoured milk 18% cf. 11%; bottled
sparkling water 10% cf. 5%).
On the other hand, there were more drinkers of energy drinks and flavoured bottled still
water or bottled still water with vitamins added in New Zealand compared to Australia
(energy drinks 15% cf. 5%; bottled water or with vitamins or flavours added 11% cf. 4%).
Formulated Beverages Survey
49
Table 1: Non-Alcoholic Beverages Consumed in a Typical Week
By Country and By Drinker Type (Drank FB in the Last 12 Months)
Australia New Zealand
Total FB
Drinker
Non-FB
Drinker Total
FB
Drinker
Non-FB
Drinker
Base: Unweighted 1,281 341 940 810 490 320
Base: Weighted (in 000) 16,828 4,722 12,106 3,265 1,977 1,288
% % % % % %
Tea / Coffee 86 82* 88* 85 80* 91*
White milk (except in tea / coffee) 35+ 42*+ 32*+ 29+ 32+ 26+
Flavoured milk 18+ 25*+ 15*+ 11+ 13*+ 8*+
Soy drinks 8 6* 9* 7 6 9
Tap water 68 67 68 69 68 71
Filtered water 37 38 37 41 45* 34*
Bottled still water (nothing added) 30 42*+ 25*+ 27 32*+ 19*+
Bottled still water (flavours and/or vitamins added) 4 8*+ 2* 11+ 18*+ 1*
Bottled sparkling water (with or without flavour) 10+ 13*+ 9*+ 5+ 5+ 5+
Fruit juice / Fruit drinks 58 61 57+ 54 56 50+
Cordials 26+ 35*+ 23*+ 13+ 15+ 11+
Energy Drinks (e.g. Red Bull) 5+ 12*+ 3* 15+ 22*+ 5*
Sports Drinks (e.g. Powerade) 8 19*+ 4*+ 7 11*+ -*+
Zero sugar / diet soft drinks 23 30* 20* 24 27* 19*
Soft drinks (e.g. cola, lemonade) 37 47*+ 33*+ 34 40*+ 25*+
Rain Water / Tank Water 2+ - 2+ -+ - 1+
Hot Chocolate / Cocoa (e.g. Milo) 1+ -+ 1+ 4+ 4+ 4+
Herbal Tea 1 - 1 1 1 1
Others 1 1 1 1 1 1
WATER SUMMARY:
Total Water with Nothing Added 92 93 92 94 94 94
Total Bottled Water 37 49* 32*+ 36 44* 23*+
Q1 : This question is about what you drink in a typical week. Which of the following types of non-alcoholic drinks
would you normally drink?
Base : All Respondents
- Figure is less than 0.5%
+ Difference significant between the two countries * Difference significant as compared to the total population for that country
Formulated Beverages Survey
50
Table 2: Non-Alcoholic Beverages Consumed in a Typical Week
By Age Group
Australia New Zealand
14
to
17
18
to
24
25
to
34
35
to
44
45
to
54
55+
14
to
17
18
to
24
25
to
34
35
to
44
45
to
54
55+
Base: Unweighted 74 127 203 249 268 360 60 101 132 162 151 204
Base: Weighted (in 000) 1128 2016 2836 3012 2832 5003 253 404 536 640 555 876
% % % % % % % % % % % %
Tea / Coffee 52* 74* 82 86 92* 98* 38* 71* 82 89 93* 98*
White milk (except in tea / coffee) 49* 49* 40 33 26* 30* 44 35 29 36 22* 22*
Flavoured milk 24 32* 21 21 12* 9* 28* 28* 12 9 5* 4*
Soy drinks 12 7 7 4* 11 9 0 8 9 6 9 7
Tap water 66 62 69 77* 64 66 65 75 73 74 59* 68
Filtered water 38 35 43 34 37 36 29* 47 42 43 43 37
Bottled still water (nothing added) 24 45* 40* 33 30 17* 25 46* 27 28 31 14*
Bottled still water (flavours and/or
vitamins added) 7 10* 4 4 3 2* 10 17 17 14 7 6*
Bottled sparkling water (with or
without flavour) 2* 10 9 10 14* 11 1 5 5 5 8 5
Fruit juice / Fruit drinks 68 67* 63 56 52* 54 70* 76* 50 52 47 46
Cordials 44* 28 33* 32* 20* 18* 24* 14 19 17 9* 7*
Energy Drinks (e.g. Red Bull) 14* 11* 11* 5 2* 0 28* 36* 15 21* 7* 2*
Sports Drinks (e.g. Powerade) 19* 13 11 11 6 2* 11 11 9 8 6 3*
Zero sugar / diet soft drinks 22 21 23 31* 29* 15* 21 36* 25 28 25 15*
Soft drinks (e.g. cola, lemonade) 60* 62* 38 38 29* 24* 65* 55* 41 31 24* 21*
Rain Water / Tank Water 1 0 3 1 3 2 0 0 0 - 0 -
Hot Chocolate / Cocoa (e.g. Milo) 1 1 - 1 1 1 5 4 8 3 2 4
Herbal Tea 2 - - 1 1 - 0 0 2 1 0 1
Others 3 0 0 1 1 - 0 0 0 2* 0 1
WATER SUMMARY:
Total Water with Nothing Added 94 95* 92 95* 91 91 89 97 96 95 93 94
Total Bottled Water 27* 50* 45* 39 39 26* 32 59* 38 37 40 21*
Q1 : This question is about what you drink in a typical week. Which of the following types of non-alcoholic drinks
would you normally drink?
Base : All Respondents
- Figure is less than 0.5%
* Difference significant as compared to the total population for that country
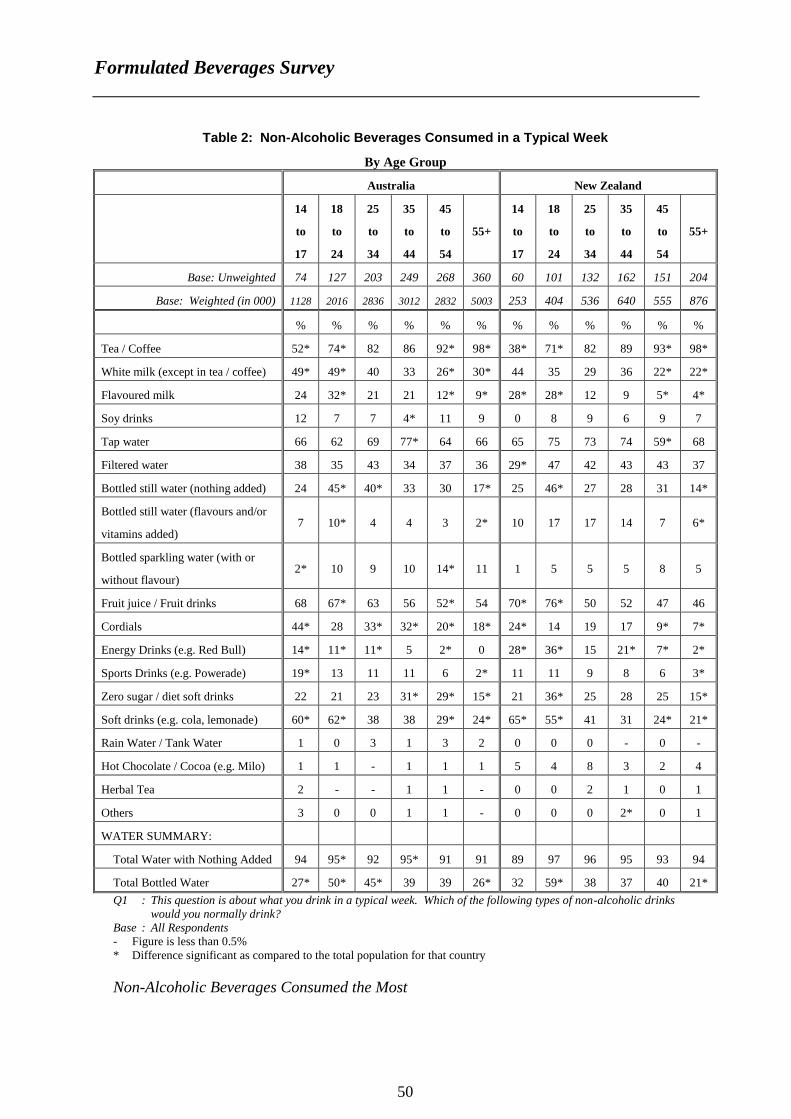
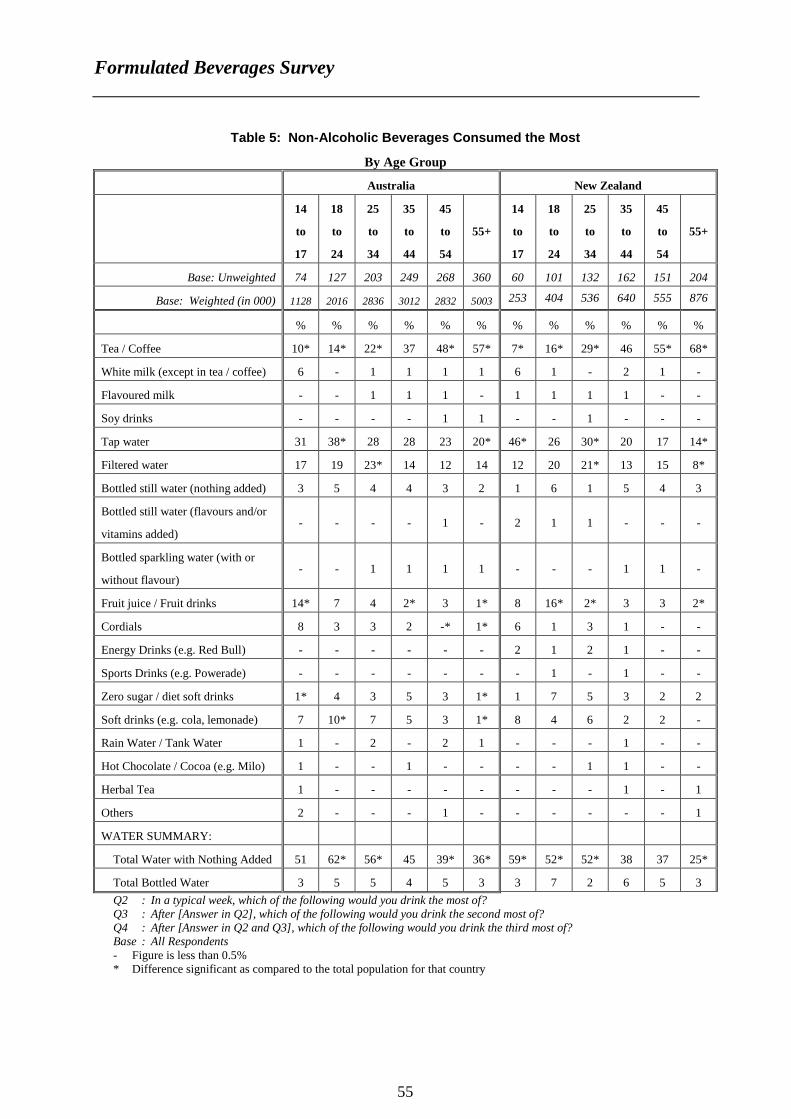
Non-Alcoholic Beverages Consumed the Most
Formulated Beverages Survey
51
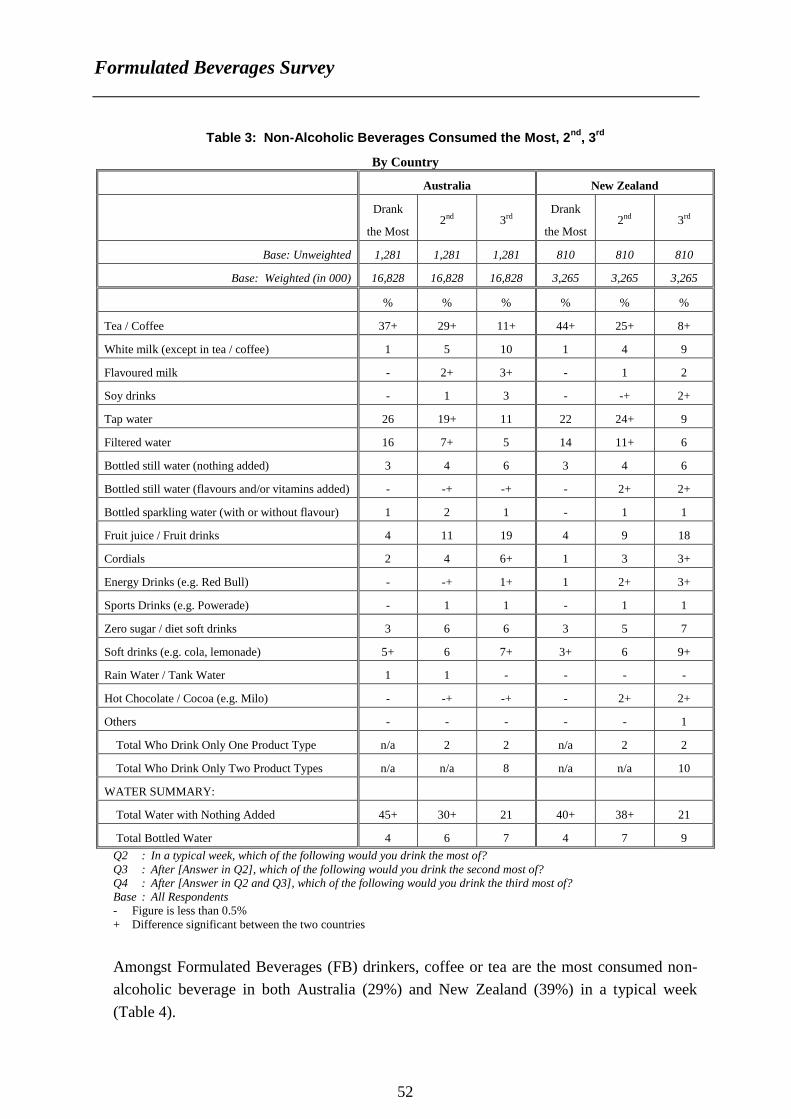
Coffee or tea were also the most consumed non-alcoholic beverage in both Australia (37%)
and New Zealand (44%) in a typical week (Table 3). Tap water is the non-alcoholic
beverage next most consumed (26% in Australia; 22% in New Zealand). Filtered water
ranks third (16% in Australia; 14% in New Zealand).
As a proportion of each country’s population, more people in Australia mentioned water
with nothing added as the most consumed non-alcoholic beverage than in New Zealand
(45% cf. 40%).
Formulated Beverages Survey
52
Table 3: Non-Alcoholic Beverages Consumed the Most, 2nd
, 3rd
By Country
Australia New Zealand
Drank
the Most 2nd 3rd
Drank
the Most 2nd 3rd
Base: Unweighted 1,281 1,281 1,281 810 810 810
Base: Weighted (in 000) 16,828 16,828 16,828 3,265 3,265 3,265
% % % % % %
Tea / Coffee 37+ 29+ 11+ 44+ 25+ 8+
White milk (except in tea / coffee) 1 5 10 1 4 9
Flavoured milk - 2+ 3+ - 1 2
Soy drinks - 1 3 - -+ 2+
Tap water 26 19+ 11 22 24+ 9
Filtered water 16 7+ 5 14 11+ 6
Bottled still water (nothing added) 3 4 6 3 4 6
Bottled still water (flavours and/or vitamins added) - -+ -+ - 2+ 2+
Bottled sparkling water (with or without flavour) 1 2 1 - 1 1
Fruit juice / Fruit drinks 4 11 19 4 9 18
Cordials 2 4 6+ 1 3 3+
Energy Drinks (e.g. Red Bull) - -+ 1+ 1 2+ 3+
Sports Drinks (e.g. Powerade) - 1 1 - 1 1
Zero sugar / diet soft drinks 3 6 6 3 5 7
Soft drinks (e.g. cola, lemonade) 5+ 6 7+ 3+ 6 9+
Rain Water / Tank Water 1 1 - - - -
Hot Chocolate / Cocoa (e.g. Milo) - -+ -+ - 2+ 2+
Others - - - - - 1
Total Who Drink Only One Product Type n/a 2 2 n/a 2 2
Total Who Drink Only Two Product Types n/a n/a 8 n/a n/a 10
WATER SUMMARY:
Total Water with Nothing Added 45+ 30+ 21 40+ 38+ 21
Total Bottled Water 4 6 7 4 7 9
Q2 : In a typical week, which of the following would you drink the most of?
Q3 : After [Answer in Q2], which of the following would you drink the second most of?
Q4 : After [Answer in Q2 and Q3], which of the following would you drink the third most of?
Base : All Respondents
- Figure is less than 0.5%
+ Difference significant between the two countries
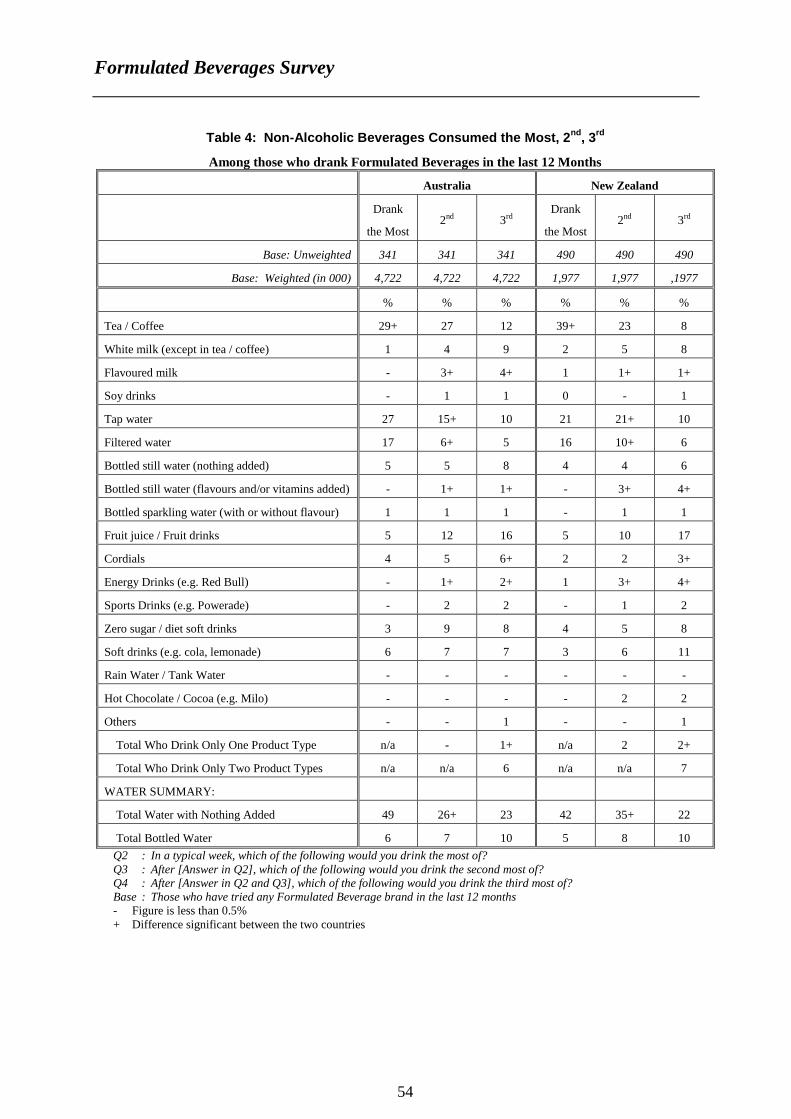
Amongst Formulated Beverages (FB) drinkers, coffee or tea are the most consumed non-
alcoholic beverage in both Australia (29%) and New Zealand (39%) in a typical week
(Table 4).
Formulated Beverages Survey
53
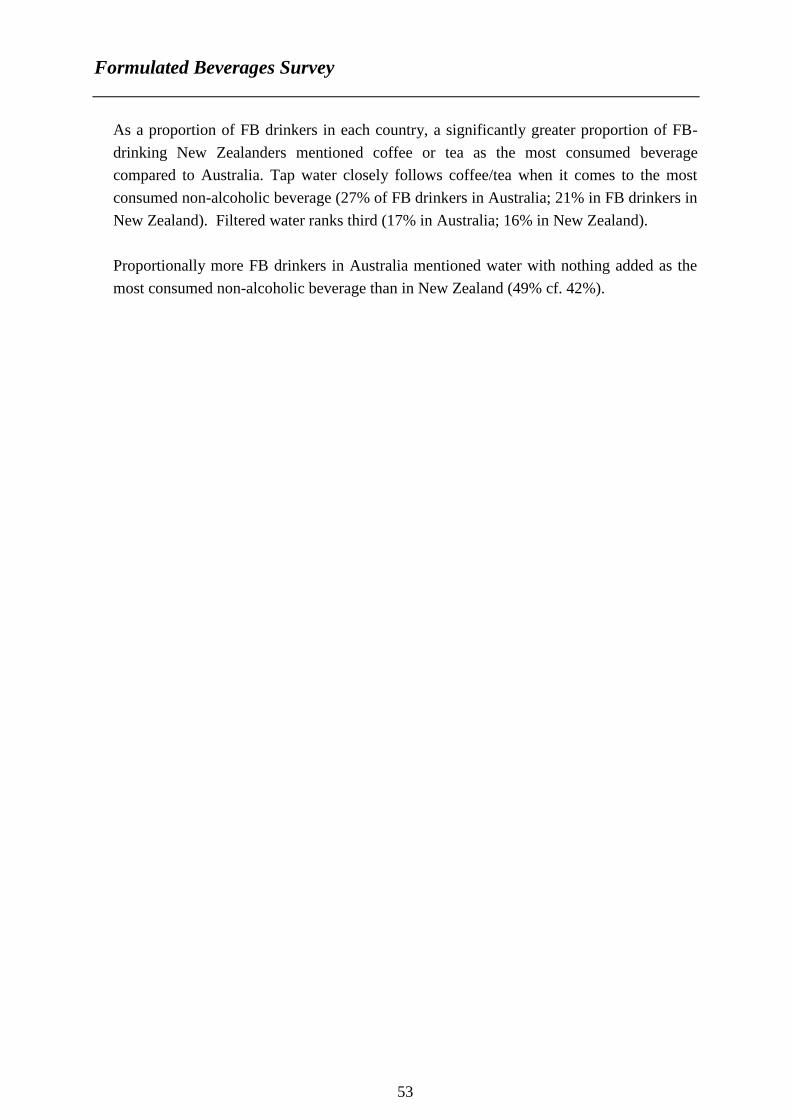
As a proportion of FB drinkers in each country, a significantly greater proportion of FB-
drinking New Zealanders mentioned coffee or tea as the most consumed beverage
compared to Australia. Tap water closely follows coffee/tea when it comes to the most
consumed non-alcoholic beverage (27% of FB drinkers in Australia; 21% in FB drinkers in
New Zealand). Filtered water ranks third (17% in Australia; 16% in New Zealand).
Proportionally more FB drinkers in Australia mentioned water with nothing added as the
most consumed non-alcoholic beverage than in New Zealand (49% cf. 42%).
Formulated Beverages Survey
54
Table 4: Non-Alcoholic Beverages Consumed the Most, 2nd
, 3rd
Among those who drank Formulated Beverages in the last 12 Months
Australia New Zealand
Drank
the Most 2nd 3rd
Drank
the Most 2nd 3rd
Base: Unweighted 341 341 341 490 490 490
Base: Weighted (in 000) 4,722 4,722 4,722 1,977 1,977 ,1977
% % % % % %
Tea / Coffee 29+ 27 12 39+ 23 8
White milk (except in tea / coffee) 1 4 9 2 5 8
Flavoured milk - 3+ 4+ 1 1+ 1+
Soy drinks - 1 1 0 - 1
Tap water 27 15+ 10 21 21+ 10
Filtered water 17 6+ 5 16 10+ 6
Bottled still water (nothing added) 5 5 8 4 4 6
Bottled still water (flavours and/or vitamins added) - 1+ 1+ - 3+ 4+
Bottled sparkling water (with or without flavour) 1 1 1 - 1 1
Fruit juice / Fruit drinks 5 12 16 5 10 17
Cordials 4 5 6+ 2 2 3+
Energy Drinks (e.g. Red Bull) - 1+ 2+ 1 3+ 4+
Sports Drinks (e.g. Powerade) - 2 2 - 1 2
Zero sugar / diet soft drinks 3 9 8 4 5 8
Soft drinks (e.g. cola, lemonade) 6 7 7 3 6 11
Rain Water / Tank Water - - - - - -
Hot Chocolate / Cocoa (e.g. Milo) - - - - 2 2
Others - - 1 - - 1
Total Who Drink Only One Product Type n/a - 1+ n/a 2 2+
Total Who Drink Only Two Product Types n/a n/a 6 n/a n/a 7
WATER SUMMARY:
Total Water with Nothing Added 49 26+ 23 42 35+ 22
Total Bottled Water 6 7 10 5 8 10
Q2 : In a typical week, which of the following would you drink the most of?
Q3 : After [Answer in Q2], which of the following would you drink the second most of?
Q4 : After [Answer in Q2 and Q3], which of the following would you drink the third most of?
Base : Those who have tried any Formulated Beverage brand in the last 12 months
- Figure is less than 0.5%
+ Difference significant between the two countries
Formulated Beverages Survey
55
Table 5: Non-Alcoholic Beverages Consumed the Most
By Age Group
Australia New Zealand
14
to
17
18
to
24
25
to
34
35
to
44
45
to
54
55+
14
to
17
18
to
24
25
to
34
35
to
44
45
to
54
55+
Base: Unweighted 74 127 203 249 268 360 60 101 132 162 151 204
Base: Weighted (in 000) 1128 2016 2836 3012 2832 5003 253 404 536 640 555 876
% % % % % % % % % % % %
Tea / Coffee 10* 14* 22* 37 48* 57* 7* 16* 29* 46 55* 68*
White milk (except in tea / coffee) 6 - 1 1 1 1 6 1 - 2 1 -
Flavoured milk - - 1 1 1 - 1 1 1 1 - -
Soy drinks - - - - 1 1 - - 1 - - -
Tap water 31 38* 28 28 23 20* 46* 26 30* 20 17 14*
Filtered water 17 19 23* 14 12 14 12 20 21* 13 15 8*
Bottled still water (nothing added) 3 5 4 4 3 2 1 6 1 5 4 3
Bottled still water (flavours and/or
vitamins added) - - - - 1 - 2 1 1 - - -
Bottled sparkling water (with or
without flavour) - - 1 1 1 1 - - - 1 1 -
Fruit juice / Fruit drinks 14* 7 4 2* 3 1* 8 16* 2* 3 3 2*
Cordials 8 3 3 2 -* 1* 6 1 3 1 - -
Energy Drinks (e.g. Red Bull) - - - - - - 2 1 2 1 - -
Sports Drinks (e.g. Powerade) - - - - - - - 1 - 1 - -
Zero sugar / diet soft drinks 1* 4 3 5 3 1* 1 7 5 3 2 2
Soft drinks (e.g. cola, lemonade) 7 10* 7 5 3 1* 8 4 6 2 2 -
Rain Water / Tank Water 1 - 2 - 2 1 - - - 1 - -
Hot Chocolate / Cocoa (e.g. Milo) 1 - - 1 - - - - 1 1 - -
Herbal Tea 1 - - - - - - - - 1 - 1
Others 2 - - - 1 - - - - - - 1
WATER SUMMARY:
Total Water with Nothing Added 51 62* 56* 45 39* 36* 59* 52* 52* 38 37 25*
Total Bottled Water 3 5 5 4 5 3 3 7 2 6 5 3
Q2 : In a typical week, which of the following would you drink the most of?
Q3 : After [Answer in Q2], which of the following would you drink the second most of?
Q4 : After [Answer in Q2 and Q3], which of the following would you drink the third most of?
Base : All Respondents
- Figure is less than 0.5%
* Difference significant as compared to the total population for that country
Formulated Beverages Survey
56
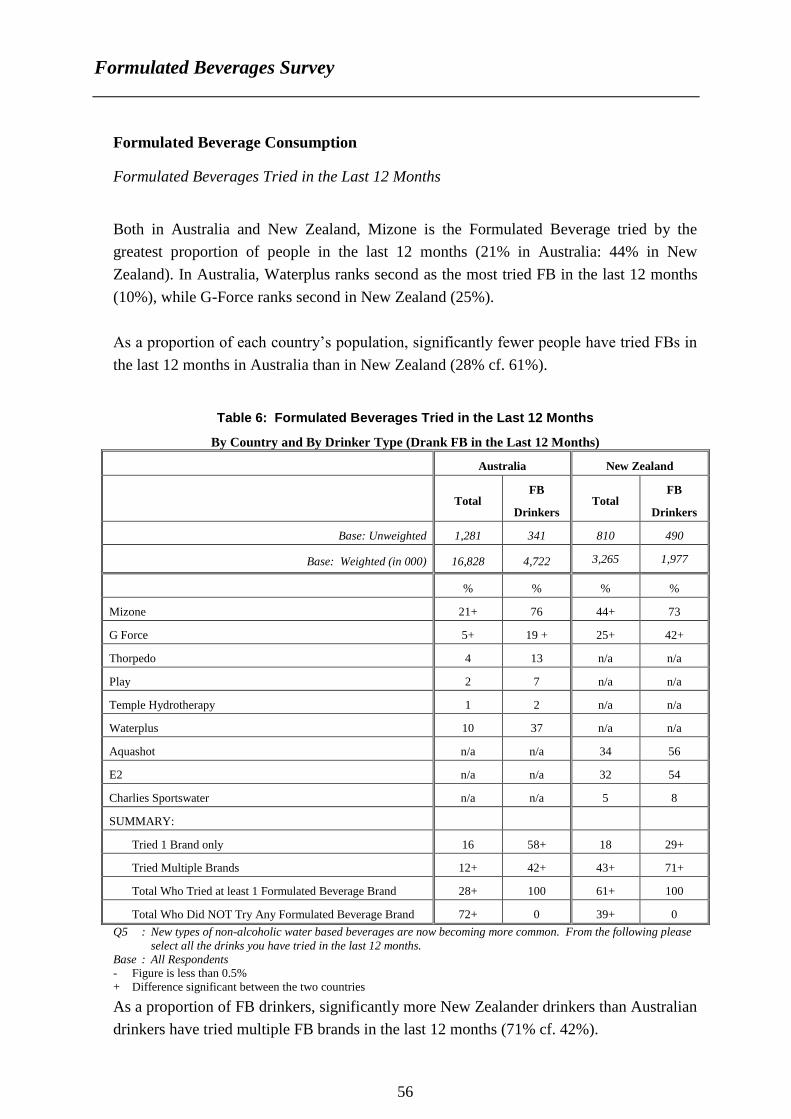
Formulated Beverage Consumption
Formulated Beverages Tried in the Last 12 Months
Both in Australia and New Zealand, Mizone is the Formulated Beverage tried by the
greatest proportion of people in the last 12 months (21% in Australia: 44% in New
Zealand). In Australia, Waterplus ranks second as the most tried FB in the last 12 months
(10%), while G-Force ranks second in New Zealand (25%).
As a proportion of each country’s population, significantly fewer people have tried FBs in
the last 12 months in Australia than in New Zealand (28% cf. 61%).
Table 6: Formulated Beverages Tried in the Last 12 Months
By Country and By Drinker Type (Drank FB in the Last 12 Months)
Australia New Zealand
Total FB
Drinkers Total
FB
Drinkers
Base: Unweighted 1,281 341 810 490
Base: Weighted (in 000) 16,828 4,722 3,265 1,977
% % % %
Mizone 21+ 76 44+ 73
G Force 5+ 19 + 25+ 42+
Thorpedo 4 13 n/a n/a
Play 2 7 n/a n/a
Temple Hydrotherapy 1 2 n/a n/a
Waterplus 10 37 n/a n/a
Aquashot n/a n/a 34 56
E2 n/a n/a 32 54
Charlies Sportswater n/a n/a 5 8
SUMMARY:
Tried 1 Brand only 16 58+ 18 29+
Tried Multiple Brands 12+ 42+ 43+ 71+
Total Who Tried at least 1 Formulated Beverage Brand 28+ 100 61+ 100
Total Who Did NOT Try Any Formulated Beverage Brand 72+ 0 39+ 0
Q5 : New types of non-alcoholic water based beverages are now becoming more common. From the following please
select all the drinks you have tried in the last 12 months.
Base : All Respondents
- Figure is less than 0.5%
+ Difference significant between the two countries
As a proportion of FB drinkers, significantly more New Zealander drinkers than Australian
drinkers have tried multiple FB brands in the last 12 months (71% cf. 42%).
Formulated Beverages Survey
57
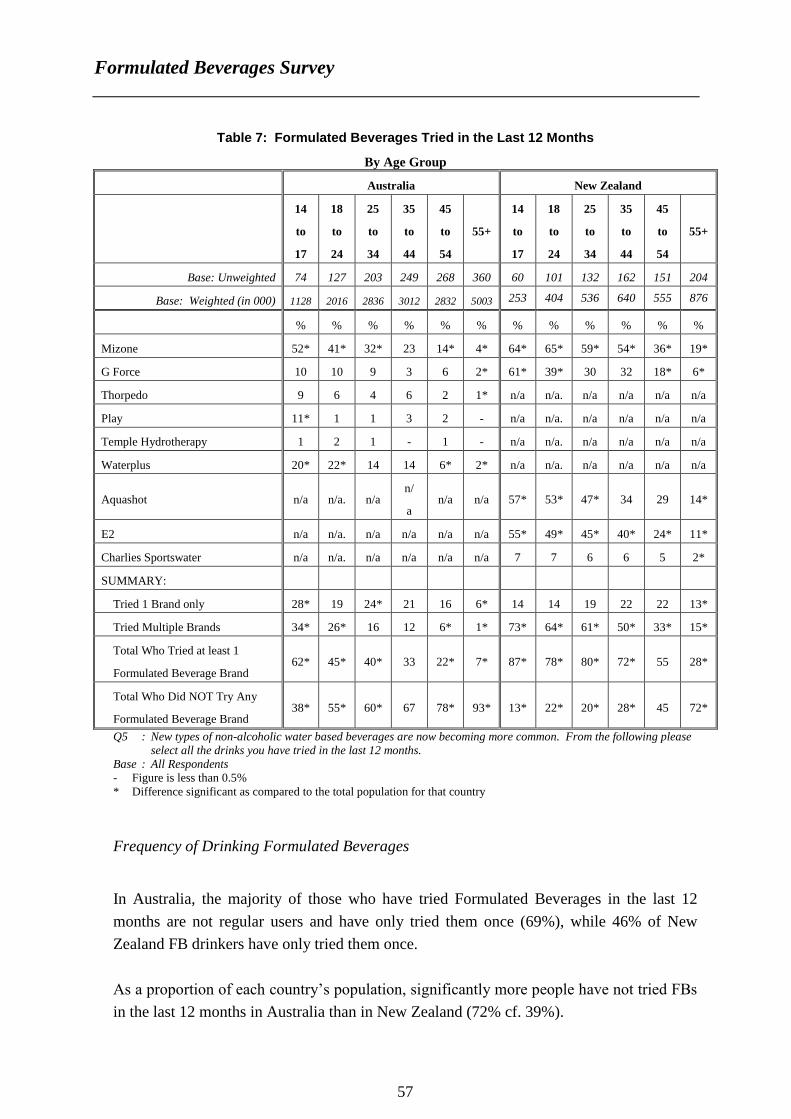
Table 7: Formulated Beverages Tried in the Last 12 Months
By Age Group
Australia New Zealand
14
to
17
18
to
24
25
to
34
35
to
44
45
to
54
55+
14
to
17
18
to
24
25
to
34
35
to
44
45
to
54
55+
Base: Unweighted 74 127 203 249 268 360 60 101 132 162 151 204
Base: Weighted (in 000) 1128 2016 2836 3012 2832 5003 253 404 536 640 555 876
% % % % % % % % % % % %
Mizone 52* 41* 32* 23 14* 4* 64* 65* 59* 54* 36* 19*
G Force 10 10 9 3 6 2* 61* 39* 30 32 18* 6*
Thorpedo 9 6 4 6 2 1* n/a n/a. n/a n/a n/a n/a
Play 11* 1 1 3 2 - n/a n/a. n/a n/a n/a n/a
Temple Hydrotherapy 1 2 1 - 1 - n/a n/a. n/a n/a n/a n/a
Waterplus 20* 22* 14 14 6* 2* n/a n/a. n/a n/a n/a n/a
Aquashot n/a n/a. n/a n/
a n/a n/a 57* 53* 47* 34 29 14*
E2 n/a n/a. n/a n/a n/a n/a 55* 49* 45* 40* 24* 11*
Charlies Sportswater n/a n/a. n/a n/a n/a n/a 7 7 6 6 5 2*
SUMMARY:
Tried 1 Brand only 28* 19 24* 21 16 6* 14 14 19 22 22 13*
Tried Multiple Brands 34* 26* 16 12 6* 1* 73* 64* 61* 50* 33* 15*
Total Who Tried at least 1
Formulated Beverage Brand 62* 45* 40* 33 22* 7* 87* 78* 80* 72* 55 28*
Total Who Did NOT Try Any
Formulated Beverage Brand 38* 55* 60* 67 78* 93* 13* 22* 20* 28* 45 72*
Q5 : New types of non-alcoholic water based beverages are now becoming more common. From the following please
select all the drinks you have tried in the last 12 months.
Base : All Respondents
- Figure is less than 0.5%
* Difference significant as compared to the total population for that country
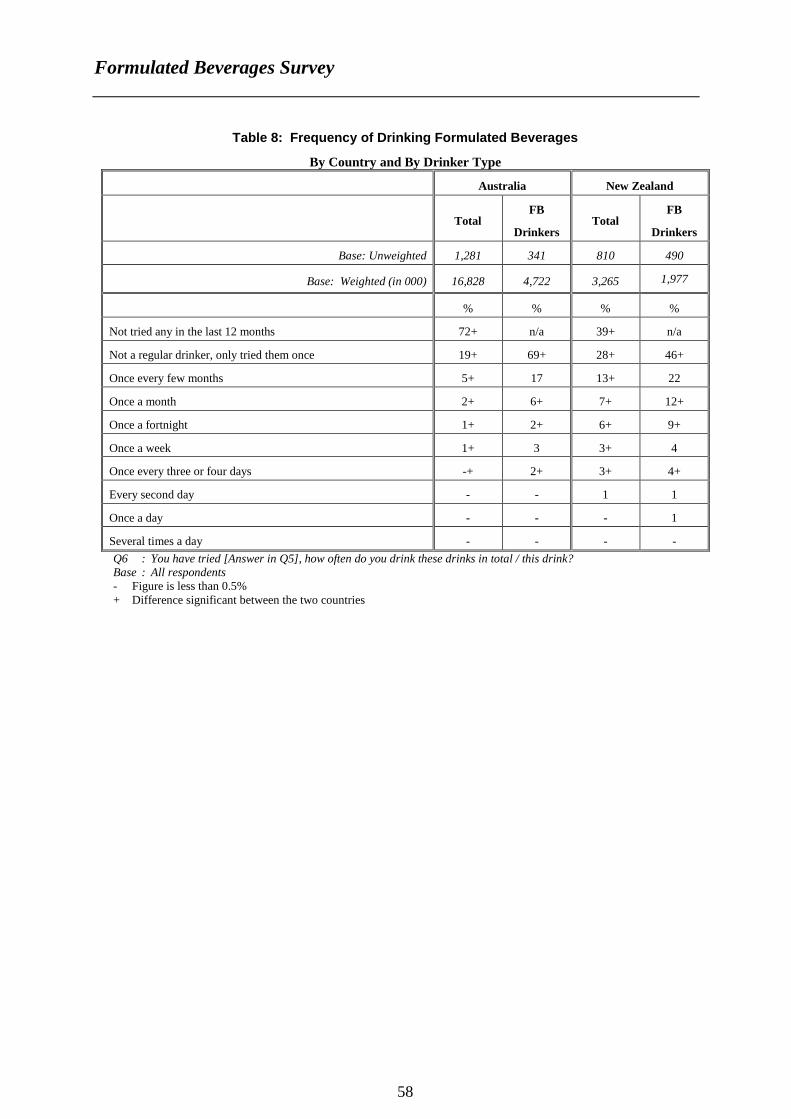
Frequency of Drinking Formulated Beverages
In Australia, the majority of those who have tried Formulated Beverages in the last 12
months are not regular users and have only tried them once (69%), while 46% of New
Zealand FB drinkers have only tried them once.
As a proportion of each country’s population, significantly more people have not tried FBs
in the last 12 months in Australia than in New Zealand (72% cf. 39%).
Formulated Beverages Survey
58
Table 8: Frequency of Drinking Formulated Beverages
By Country and By Drinker Type
Australia New Zealand
Total FB
Drinkers Total
FB
Drinkers
Base: Unweighted 1,281 341 810 490
Base: Weighted (in 000) 16,828 4,722 3,265 1,977
% % % %
Not tried any in the last 12 months 72+ n/a 39+ n/a
Not a regular drinker, only tried them once 19+ 69+ 28+ 46+
Once every few months 5+ 17 13+ 22
Once a month 2+ 6+ 7+ 12+
Once a fortnight 1+ 2+ 6+ 9+
Once a week 1+ 3 3+ 4
Once every three or four days -+ 2+ 3+ 4+
Every second day - - 1 1
Once a day - - - 1
Several times a day - - - -
Q6 : You have tried [Answer in Q5], how often do you drink these drinks in total / this drink?
Base : All respondents
- Figure is less than 0.5%
+ Difference significant between the two countries
Formulated Beverages Survey
59
Table 9: Frequency of Drinking Formulated Beverages
By Age Group
Australia New Zealand
14
to
17
18
to
24
25
to
34
35
to
44
45
to
54
55+
14
to
17
18
to
24
25
to
34
35
to
44
45
to
54
55+
Base: Unweighted 74 127 203 249 268 360 60 101 132 162 151 204
Base: Weighted (in 000) 1128 2016 2836 3012 2832 5003 253 404 536 640 555 876
% % % % % % % % % % % %
Not tried any in the last 12 months 38* 55* 60* 67* 78* 93* 13* 22* 20* 28* 45 72*
Not a regular drinker, only tried
them once 50* 30* 26* 23 17 4* 38 22 34 37* 32 15*
Once every few months 9 7 9* 5 3 1* 22 25* 20* 13 10 3*
Once a month 1 4 4* 1 1 - 11 9 11 8 6 4*
Once a fortnight 1 3 - 1 - - 9 14* 5 6 2* 2*
Once a week - 1 1 3* 1 - 4 1* 3 5 3 1*
Once every three or four days 1 - - - - 1 2 6 5 2 1 1
Every second day - - - - - - - - 1 1 1 1
Once a day - - - - - - 2 - 1 - 1 -
Several times a day - - - - - - - - 1 - - -
Q6 : You have tried [Answer in Q5], how often do you drink these drinks in total / this drink?
Base : All respondents
- Figure is less than 0.5%
* Difference significant as compared to the total population for that country
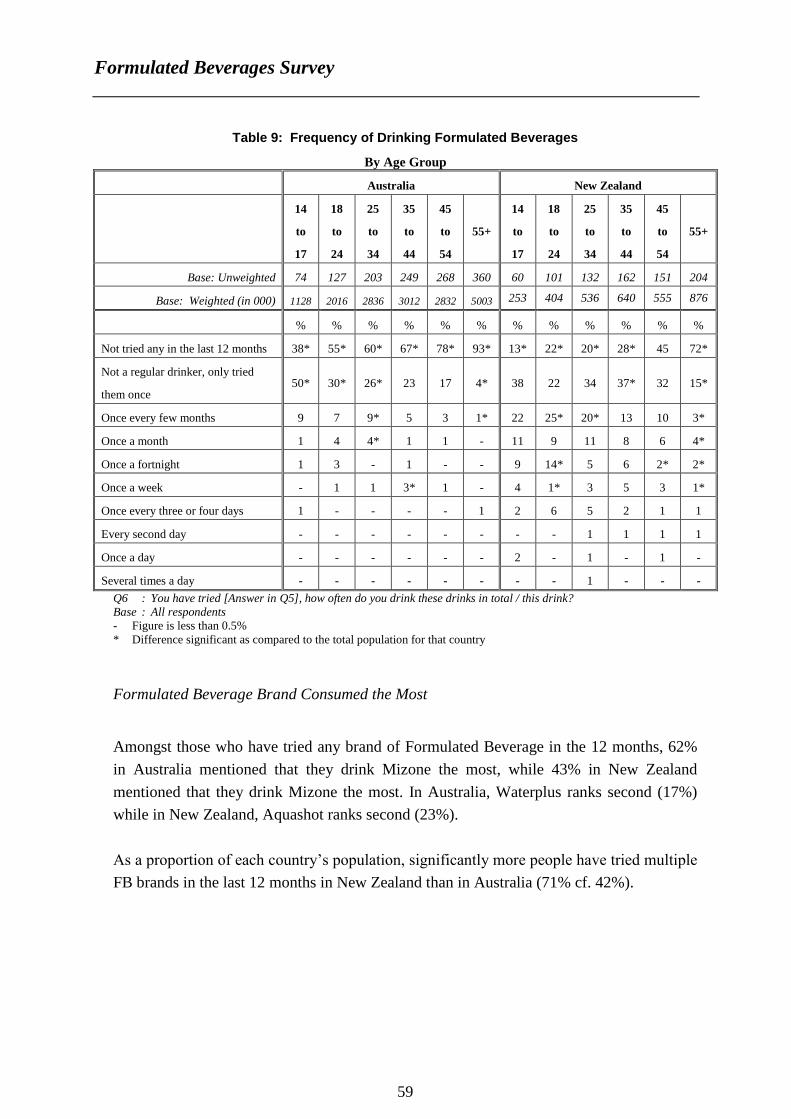
Formulated Beverage Brand Consumed the Most
Amongst those who have tried any brand of Formulated Beverage in the 12 months, 62%
in Australia mentioned that they drink Mizone the most, while 43% in New Zealand
mentioned that they drink Mizone the most. In Australia, Waterplus ranks second (17%)
while in New Zealand, Aquashot ranks second (23%).
As a proportion of each country’s population, significantly more people have tried multiple
FB brands in the last 12 months in New Zealand than in Australia (71% cf. 42%).

Formulated Beverages Survey
60
Table 10: Formulated Beverage Brand Consumed the Most
By Country
Australia New
Zealand
Base: Unweighted 341 490
Base: Weighted (in 000) 4,722 1,977
% %
Mizone 62+ 43+
G Force 11 13
Thorpedo 4 n/a
Play 4 n/a
Temple Hydrotherapy 1 n/a
Waterplus 17 n/a
Aquashot n/a 23
E2 n/a 20
Charlies Sportswater n/a 1
Q7 : Which of these do you drink the most?
Base : Those who have tried any Formulated Beverage brand in the last 12 months - Figure is less than 0.5%
+ Difference significant between the two countries
Table 11: Formulated Beverage Brand Consumed the Most
By Age Group
Australia New Zealand
14
to
17
18
to
24
25
to
34
35
to
44
45
to
54
55+
14
to
17
18
to
24
25
to
34
35
to
44
45
to
54
55+
Base: Unweighted 45 57 78 78 58 25 50 78 104 117 84 57
Base: Weighted (in 000) 699 912 1141 996 636 337 219 314 428 463 308 244
% % % % % % % % % % % %
Mizone 71 66 68 57 52 52 42 47 41 45 37 48
G Force 7 7 13 6 21* 25 23 9 11 13 18 7
Thorpedo 2 2 2 9 2 7 n/a n/a. n/a n/a n/a n/a
Play 12 2 1 4 5 - n/a n/a. n/a n/a n/a n/a
Temple Hydrotherapy 1 3 - - 2 - n/a n/a. n/a n/a n/a n/a
Waterplus 7* 21 15 23 17 17 n/a n/a. n/a n/a n/a n/a
Aquashot n/a n/a. n/a n/a n/a n/a 11* 27 23 20 31 30
E2 n/a n/a. n/a n/a n/a n/a 24 17 24 23 13 15
Charlies Sportswater n/a n/a. n/a n/a n/a n/a - 1 1 - 1 -
Q7 : Which of these do you drink the most?
Base : Those who have tried any Formulated Beverage brand in the last 12 months
- Figure is less than 0.5%
* Difference significant as compared to the total population for that country
Formulated Beverages Survey
61
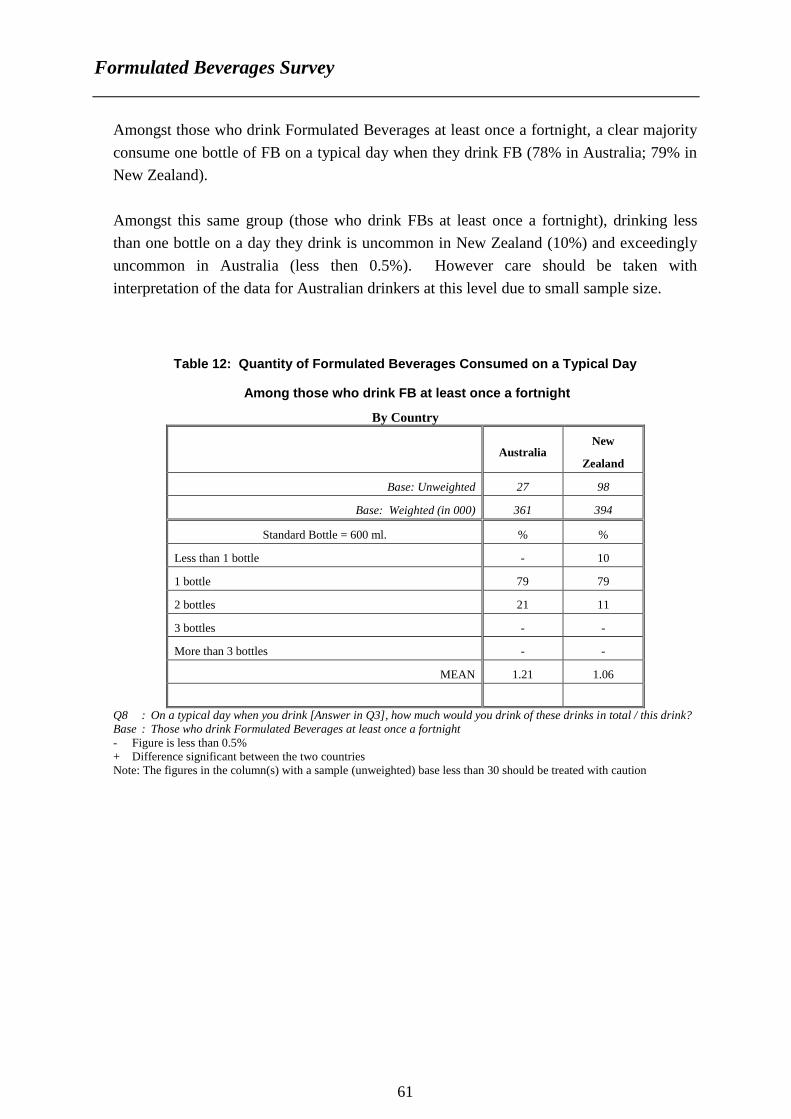
Amongst those who drink Formulated Beverages at least once a fortnight, a clear majority
consume one bottle of FB on a typical day when they drink FB (78% in Australia; 79% in
New Zealand).
Amongst this same group (those who drink FBs at least once a fortnight), drinking less
than one bottle on a day they drink is uncommon in New Zealand (10%) and exceedingly
uncommon in Australia (less then 0.5%). However care should be taken with
interpretation of the data for Australian drinkers at this level due to small sample size.
Table 12: Quantity of Formulated Beverages Consumed on a Typical Day
Among those who drink FB at least once a fortnight
By Country
Australia New
Zealand
Base: Unweighted 27 98
Base: Weighted (in 000) 361 394
Standard Bottle = 600 ml. % %
Less than 1 bottle - 10
1 bottle 79 79
2 bottles 21 11
3 bottles - -
More than 3 bottles - -
MEAN 1.21 1.06
Q8 : On a typical day when you drink [Answer in Q3], how much would you drink of these drinks in total / this drink?
Base : Those who drink Formulated Beverages at least once a fortnight
- Figure is less than 0.5%
+ Difference significant between the two countries Note: The figures in the column(s) with a sample (unweighted) base less than 30 should be treated with caution
Formulated Beverages Survey
62
Table 13: Quantity of Formulated Beverages Consumed on a Typical Day
Among those who drink FB at least once a fortnight
By Age Group
Australia New Zealand
14
to
17
18
to
24
25
to
34
35
to
44
45
to
54
55+
14
to
17
18
to
24
25
to
34
35
to
44
45
to
54
55+
Base: Unweighted 2 5 3 7 4 6 10 20 20 24 13 11
Base: Weighted (in 000) 23 84 36 107 37 73 40 87 81 96 43 46
Standard Bottle = 600 ml. % % % % % % % % % % % %
Less than 1 bottle - - - - - - 8 - 10 21 12 9
1 bottle 100 88 69 84 100 47 83 92 74 76 78 64
2 bottles - 12 31 16 - 53* 10 8 16 3 10 27
3 bottles or more - - - - - - - - - - - -
MEAN 1.00 1.12 1.31 1.16 1.00 1.53 1.06 1.08 1.11 0.93 1.04 1.23
Q8 : On a typical day when you drink [Answer in Q3], how much would you drink of these drinks in total / this drink?
Base : Those who drink Formulated Beverages at least once a fortnight
- Figure is less than 0.5%
* Difference significant as compared to the total population for that country
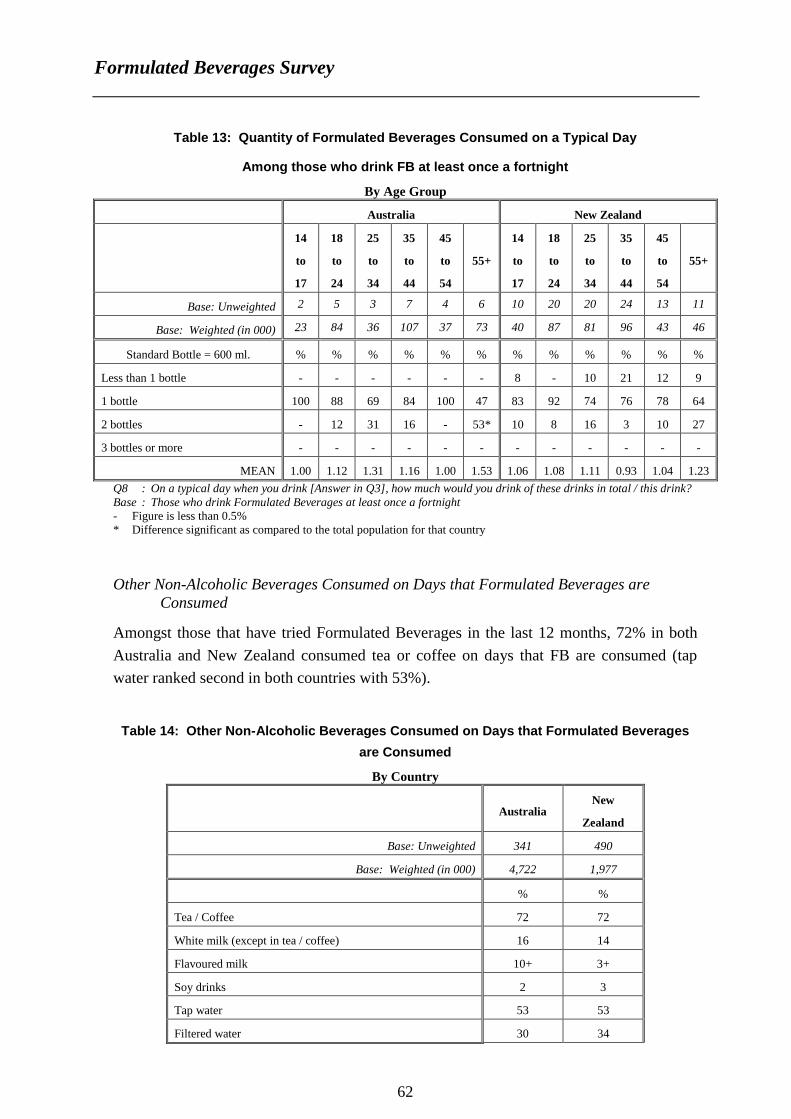
Other Non-Alcoholic Beverages Consumed on Days that Formulated Beverages are
Consumed
Amongst those that have tried Formulated Beverages in the last 12 months, 72% in both
Australia and New Zealand consumed tea or coffee on days that FB are consumed (tap
water ranked second in both countries with 53%).
Table 14: Other Non-Alcoholic Beverages Consumed on Days that Formulated Beverages
are Consumed
By Country
Australia New
Zealand
Base: Unweighted 341 490
Base: Weighted (in 000) 4,722 1,977
% %
Tea / Coffee 72 72
White milk (except in tea / coffee) 16 14
Flavoured milk 10+ 3+
Soy drinks 2 3
Tap water 53 53
Filtered water 30 34
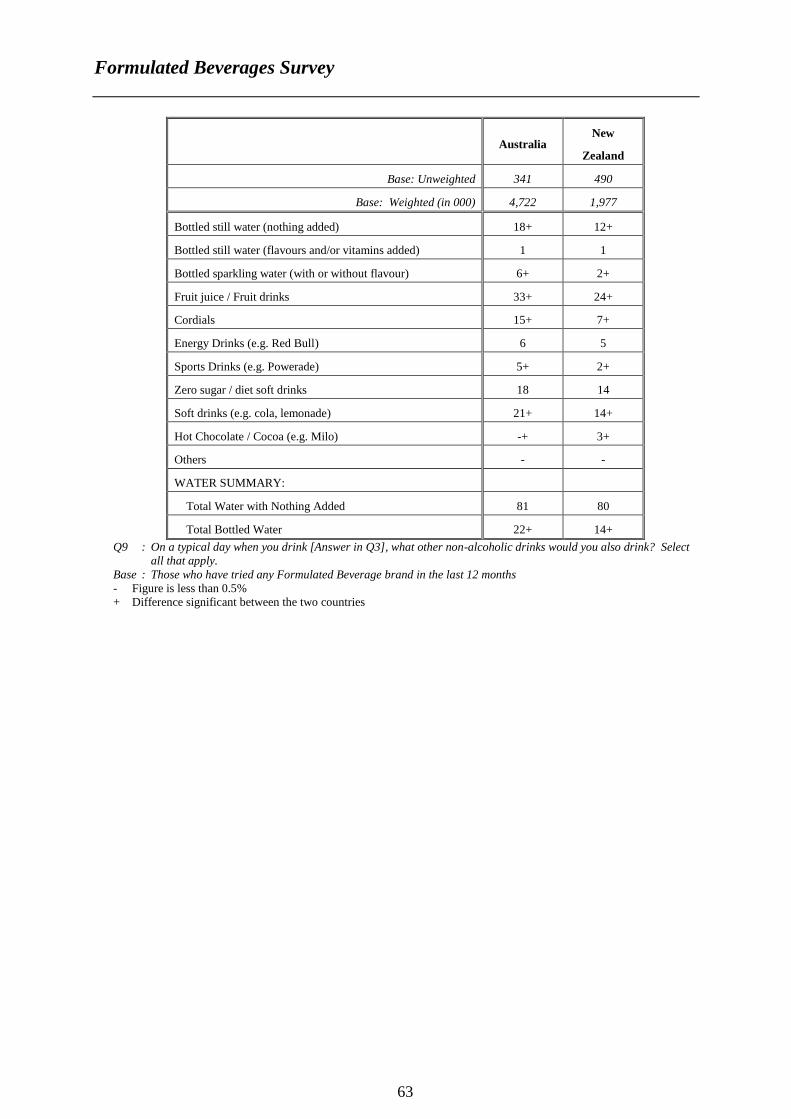
Formulated Beverages Survey
63
Australia New
Zealand
Base: Unweighted 341 490
Base: Weighted (in 000) 4,722 1,977
Bottled still water (nothing added) 18+ 12+
Bottled still water (flavours and/or vitamins added) 1 1
Bottled sparkling water (with or without flavour) 6+ 2+
Fruit juice / Fruit drinks 33+ 24+
Cordials 15+ 7+
Energy Drinks (e.g. Red Bull) 6 5
Sports Drinks (e.g. Powerade) 5+ 2+
Zero sugar / diet soft drinks 18 14
Soft drinks (e.g. cola, lemonade) 21+ 14+
Hot Chocolate / Cocoa (e.g. Milo) -+ 3+
Others - -
WATER SUMMARY:
Total Water with Nothing Added 81 80
Total Bottled Water 22+ 14+
Q9 : On a typical day when you drink [Answer in Q3], what other non-alcoholic drinks would you also drink? Select
all that apply.
Base : Those who have tried any Formulated Beverage brand in the last 12 months
- Figure is less than 0.5%
+ Difference significant between the two countries
Formulated Beverages Survey
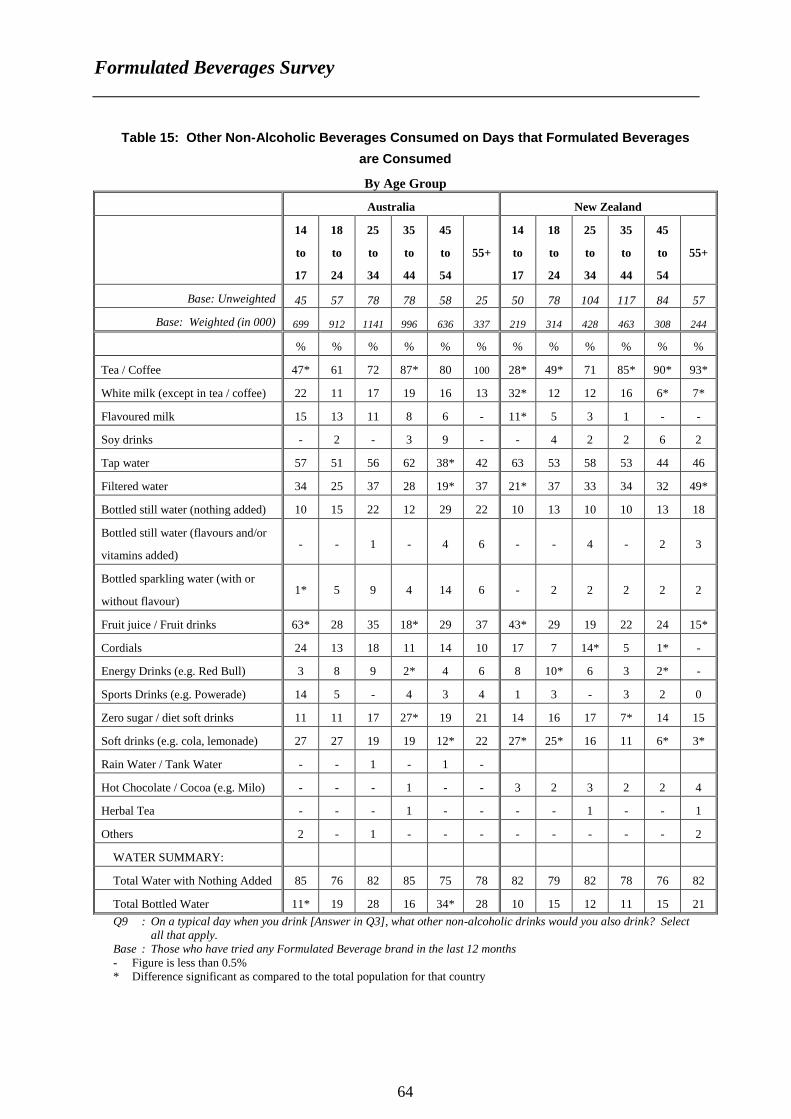
64
Table 15: Other Non-Alcoholic Beverages Consumed on Days that Formulated Beverages
are Consumed
By Age Group
Australia New Zealand
14
to
17
18
to
24
25
to
34
35
to
44
45
to
54
55+
14
to
17
18
to
24
25
to
34
35
to
44
45
to
54
55+
Base: Unweighted 45 57 78 78 58 25 50 78 104 117 84 57
Base: Weighted (in 000) 699 912 1141 996 636 337 219 314 428 463 308 244
% % % % % % % % % % % %
Tea / Coffee 47* 61 72 87* 80 100 28* 49* 71 85* 90* 93*
White milk (except in tea / coffee) 22 11 17 19 16 13 32* 12 12 16 6* 7*
Flavoured milk 15 13 11 8 6 - 11* 5 3 1 - -
Soy drinks - 2 - 3 9 - - 4 2 2 6 2
Tap water 57 51 56 62 38* 42 63 53 58 53 44 46
Filtered water 34 25 37 28 19* 37 21* 37 33 34 32 49*
Bottled still water (nothing added) 10 15 22 12 29 22 10 13 10 10 13 18
Bottled still water (flavours and/or
vitamins added) - - 1 - 4 6 - - 4 - 2 3
Bottled sparkling water (with or
without flavour) 1* 5 9 4 14 6 - 2 2 2 2 2
Fruit juice / Fruit drinks 63* 28 35 18* 29 37 43* 29 19 22 24 15*
Cordials 24 13 18 11 14 10 17 7 14* 5 1* -
Energy Drinks (e.g. Red Bull) 3 8 9 2* 4 6 8 10* 6 3 2* -
Sports Drinks (e.g. Powerade) 14 5 - 4 3 4 1 3 - 3 2 0
Zero sugar / diet soft drinks 11 11 17 27* 19 21 14 16 17 7* 14 15
Soft drinks (e.g. cola, lemonade) 27 27 19 19 12* 22 27* 25* 16 11 6* 3*
Rain Water / Tank Water - - 1 - 1 -
Hot Chocolate / Cocoa (e.g. Milo) - - - 1 - - 3 2 3 2 2 4
Herbal Tea - - - 1 - - - - 1 - - 1
Others 2 - 1 - - - - - - - - 2
WATER SUMMARY:
Total Water with Nothing Added 85 76 82 85 75 78 82 79 82 78 76 82
Total Bottled Water 11* 19 28 16 34* 28 10 15 12 11 15 21
Q9 : On a typical day when you drink [Answer in Q3], what other non-alcoholic drinks would you also drink? Select
all that apply.
Base : Those who have tried any Formulated Beverage brand in the last 12 months
- Figure is less than 0.5%
* Difference significant as compared to the total population for that country
Formulated Beverages Survey
65
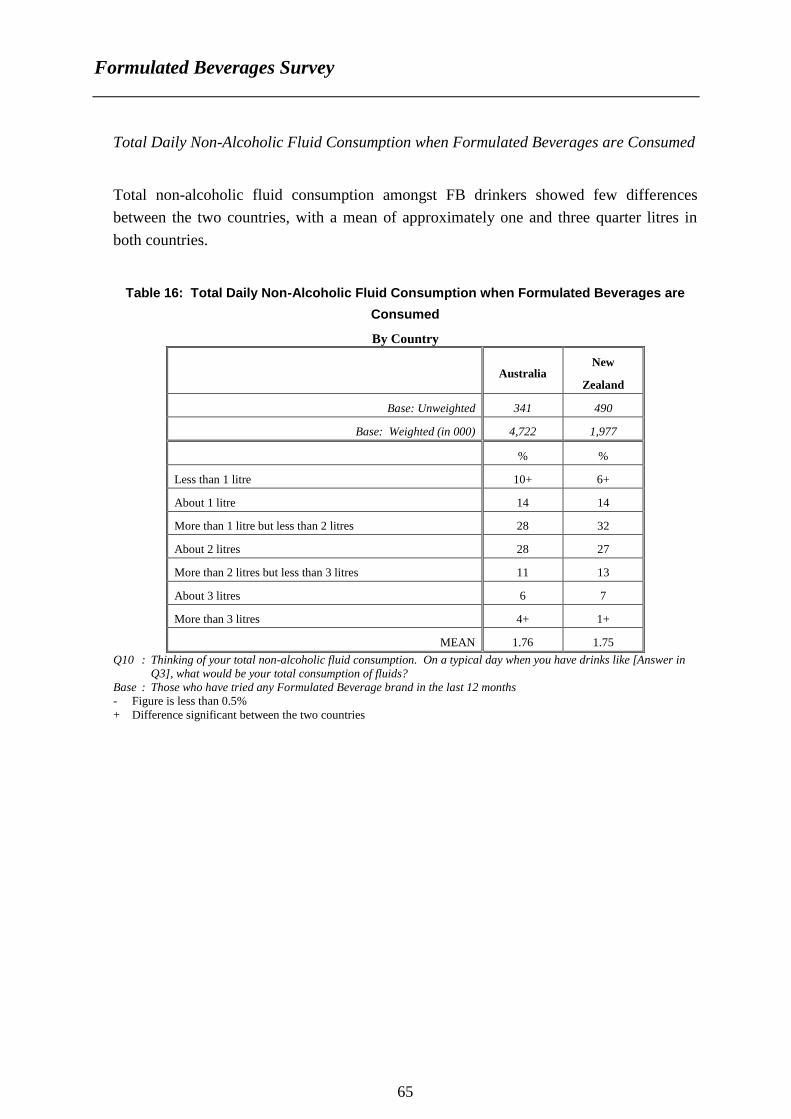
Total Daily Non-Alcoholic Fluid Consumption when Formulated Beverages are Consumed
Total non-alcoholic fluid consumption amongst FB drinkers showed few differences
between the two countries, with a mean of approximately one and three quarter litres in
both countries.
Table 16: Total Daily Non-Alcoholic Fluid Consumption when Formulated Beverages are
Consumed
By Country
Australia New
Zealand
Base: Unweighted 341 490
Base: Weighted (in 000) 4,722 1,977
% %
Less than 1 litre 10+ 6+
About 1 litre 14 14
More than 1 litre but less than 2 litres 28 32
About 2 litres 28 27
More than 2 litres but less than 3 litres 11 13
About 3 litres 6 7
More than 3 litres 4+ 1+
MEAN 1.76 1.75
Q10 : Thinking of your total non-alcoholic fluid consumption. On a typical day when you have drinks like [Answer in
Q3], what would be your total consumption of fluids?
Base : Those who have tried any Formulated Beverage brand in the last 12 months
- Figure is less than 0.5%
+ Difference significant between the two countries
Formulated Beverages Survey
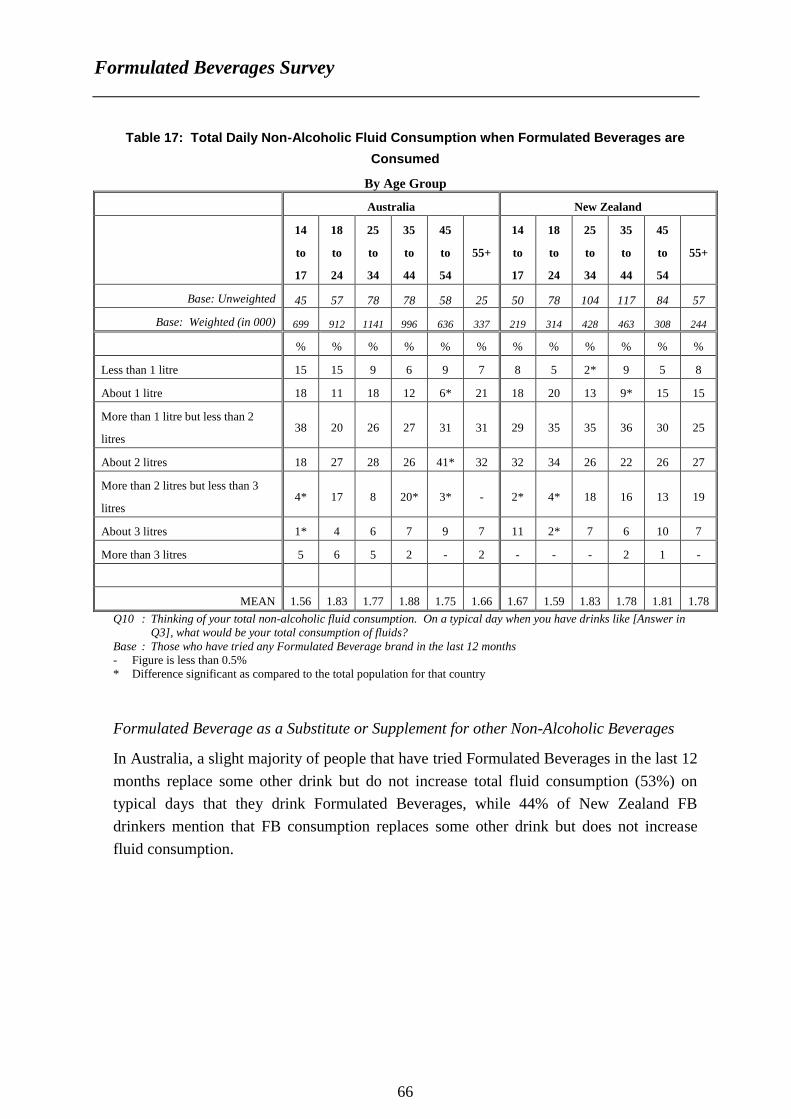
66
Table 17: Total Daily Non-Alcoholic Fluid Consumption when Formulated Beverages are
Consumed
By Age Group
Australia New Zealand
14
to
17
18
to
24
25
to
34
35
to
44
45
to
54
55+
14
to
17
18
to
24
25
to
34
35
to
44
45
to
54
55+
Base: Unweighted 45 57 78 78 58 25 50 78 104 117 84 57
Base: Weighted (in 000) 699 912 1141 996 636 337 219 314 428 463 308 244
% % % % % % % % % % % %
Less than 1 litre 15 15 9 6 9 7 8 5 2* 9 5 8
About 1 litre 18 11 18 12 6* 21 18 20 13 9* 15 15
More than 1 litre but less than 2
litres 38 20 26 27 31 31 29 35 35 36 30 25
About 2 litres 18 27 28 26 41* 32 32 34 26 22 26 27
More than 2 litres but less than 3
litres 4* 17 8 20* 3* - 2* 4* 18 16 13 19
About 3 litres 1* 4 6 7 9 7 11 2* 7 6 10 7
More than 3 litres 5 6 5 2 - 2 - - - 2 1 -
MEAN 1.56 1.83 1.77 1.88 1.75 1.66 1.67 1.59 1.83 1.78 1.81 1.78
Q10 : Thinking of your total non-alcoholic fluid consumption. On a typical day when you have drinks like [Answer in
Q3], what would be your total consumption of fluids?
Base : Those who have tried any Formulated Beverage brand in the last 12 months
- Figure is less than 0.5%
* Difference significant as compared to the total population for that country
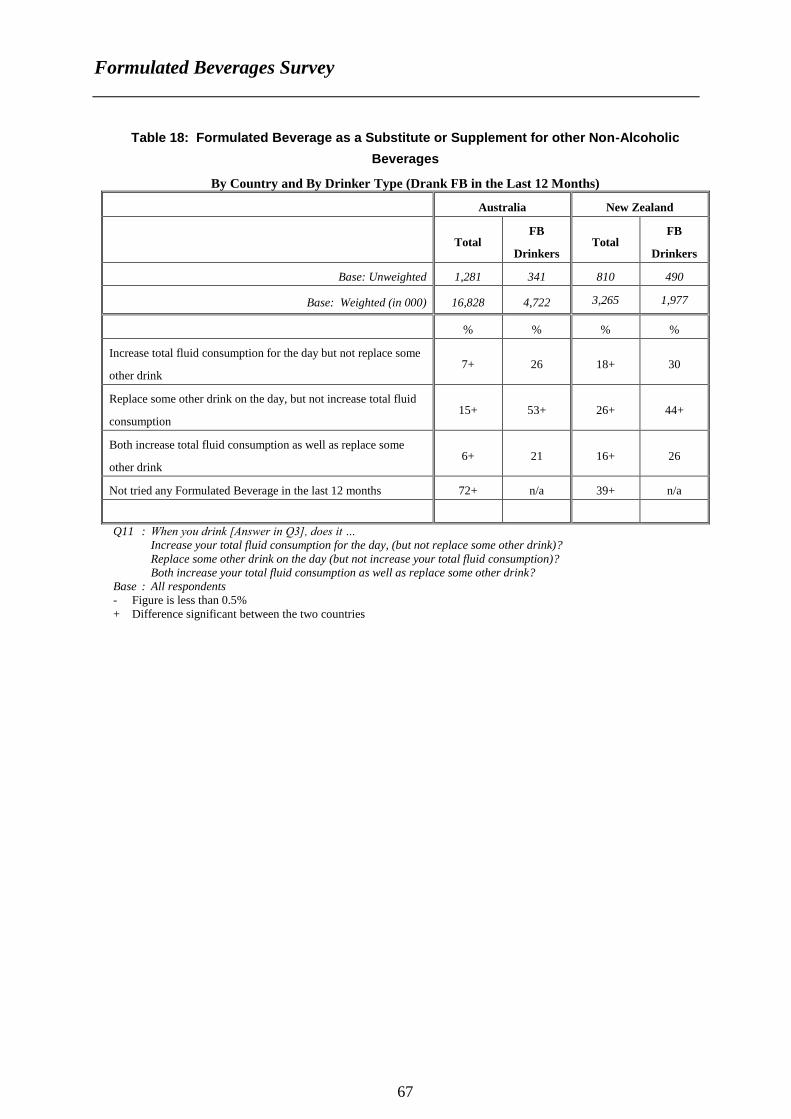
Formulated Beverage as a Substitute or Supplement for other Non-Alcoholic Beverages
In Australia, a slight majority of people that have tried Formulated Beverages in the last 12
months replace some other drink but do not increase total fluid consumption (53%) on
typical days that they drink Formulated Beverages, while 44% of New Zealand FB
drinkers mention that FB consumption replaces some other drink but does not increase
fluid consumption.
Formulated Beverages Survey
67
Table 18: Formulated Beverage as a Substitute or Supplement for other Non-Alcoholic
Beverages
By Country and By Drinker Type (Drank FB in the Last 12 Months)
Australia New Zealand
Total FB
Drinkers Total
FB
Drinkers
Base: Unweighted 1,281 341 810 490
Base: Weighted (in 000) 16,828 4,722 3,265 1,977
% % % %
Increase total fluid consumption for the day but not replace some
other drink 7+ 26 18+ 30
Replace some other drink on the day, but not increase total fluid
consumption 15+ 53+ 26+ 44+
Both increase total fluid consumption as well as replace some
other drink 6+ 21 16+ 26
Not tried any Formulated Beverage in the last 12 months 72+ n/a 39+ n/a
Q11 : When you drink [Answer in Q3], does it …
Increase your total fluid consumption for the day, (but not replace some other drink)?
Replace some other drink on the day (but not increase your total fluid consumption)?
Both increase your total fluid consumption as well as replace some other drink?
Base : All respondents
- Figure is less than 0.5%
+ Difference significant between the two countries
Formulated Beverages Survey
68
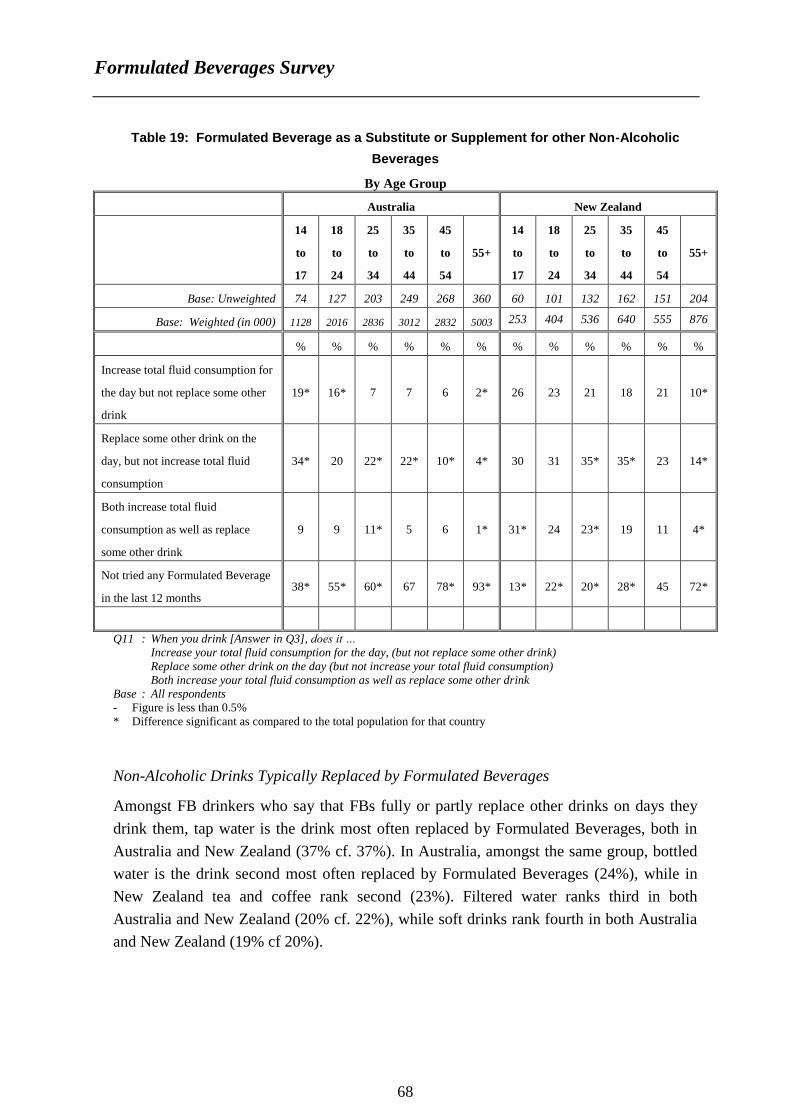
Table 19: Formulated Beverage as a Substitute or Supplement for other Non-Alcoholic
Beverages
By Age Group
Australia New Zealand
14
to
17
18
to
24
25
to
34
35
to
44
45
to
54
55+
14
to
17
18
to
24
25
to
34
35
to
44
45
to
54
55+
Base: Unweighted 74 127 203 249 268 360 60 101 132 162 151 204
Base: Weighted (in 000) 1128 2016 2836 3012 2832 5003 253 404 536 640 555 876
% % % % % % % % % % % %
Increase total fluid consumption for
the day but not replace some other
drink
19* 16* 7 7 6 2* 26 23 21 18 21 10*
Replace some other drink on the
day, but not increase total fluid
consumption
34* 20 22* 22* 10* 4* 30 31 35* 35* 23 14*
Both increase total fluid
consumption as well as replace
some other drink
9 9 11* 5 6 1* 31* 24 23* 19 11 4*
Not tried any Formulated Beverage
in the last 12 months 38* 55* 60* 67 78* 93* 13* 22* 20* 28* 45 72*
Q11 : When you drink [Answer in Q3], does it …
Increase your total fluid consumption for the day, (but not replace some other drink)
Replace some other drink on the day (but not increase your total fluid consumption)
Both increase your total fluid consumption as well as replace some other drink
Base : All respondents - Figure is less than 0.5%
* Difference significant as compared to the total population for that country
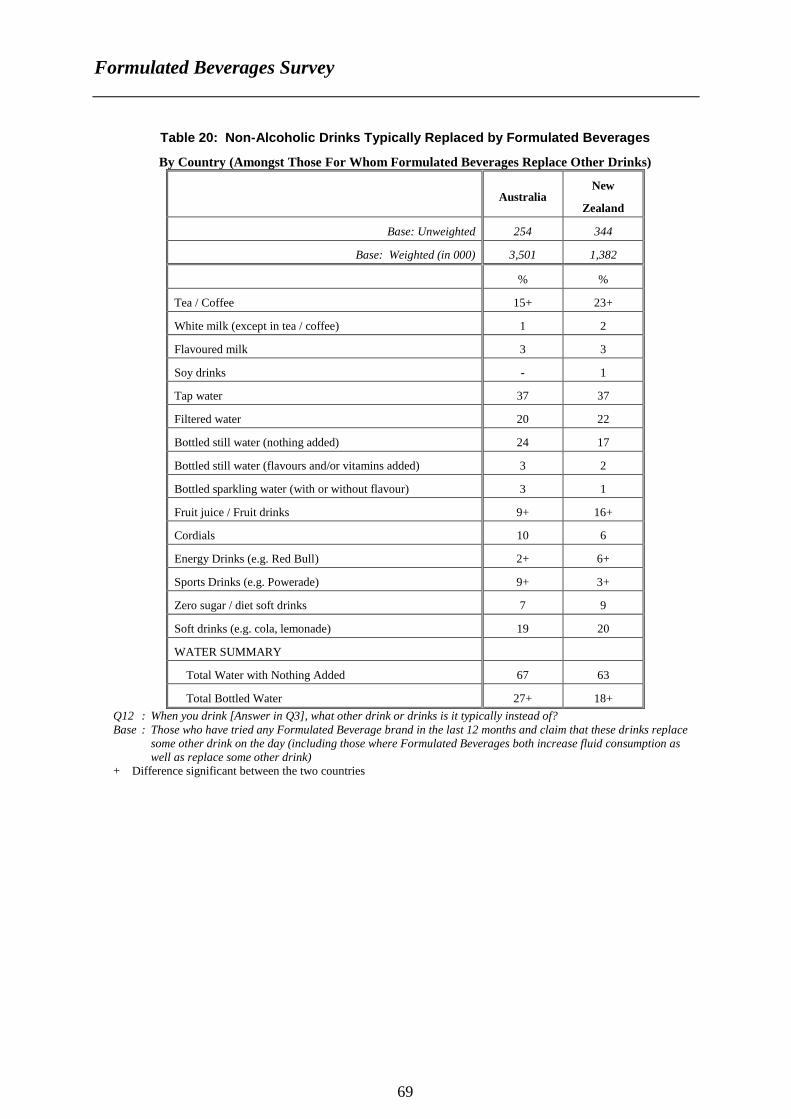
Non-Alcoholic Drinks Typically Replaced by Formulated Beverages
Amongst FB drinkers who say that FBs fully or partly replace other drinks on days they
drink them, tap water is the drink most often replaced by Formulated Beverages, both in
Australia and New Zealand (37% cf. 37%). In Australia, amongst the same group, bottled
water is the drink second most often replaced by Formulated Beverages (24%), while in
New Zealand tea and coffee rank second (23%). Filtered water ranks third in both
Australia and New Zealand (20% cf. 22%), while soft drinks rank fourth in both Australia
and New Zealand (19% cf 20%).
Formulated Beverages Survey
69
Table 20: Non-Alcoholic Drinks Typically Replaced by Formulated Beverages
By Country (Amongst Those For Whom Formulated Beverages Replace Other Drinks)
Australia New
Zealand
Base: Unweighted 254 344
Base: Weighted (in 000) 3,501 1,382
% %
Tea / Coffee 15+ 23+
White milk (except in tea / coffee) 1 2
Flavoured milk 3 3
Soy drinks - 1
Tap water 37 37
Filtered water 20 22
Bottled still water (nothing added) 24 17
Bottled still water (flavours and/or vitamins added) 3 2
Bottled sparkling water (with or without flavour) 3 1
Fruit juice / Fruit drinks 9+ 16+
Cordials 10 6
Energy Drinks (e.g. Red Bull) 2+ 6+
Sports Drinks (e.g. Powerade) 9+ 3+
Zero sugar / diet soft drinks 7 9
Soft drinks (e.g. cola, lemonade) 19 20
WATER SUMMARY
Total Water with Nothing Added 67 63
Total Bottled Water 27+ 18+
Q12 : When you drink [Answer in Q3], what other drink or drinks is it typically instead of?
Base : Those who have tried any Formulated Beverage brand in the last 12 months and claim that these drinks replace
some other drink on the day (including those where Formulated Beverages both increase fluid consumption as
well as replace some other drink)
+ Difference significant between the two countries
Formulated Beverages Survey
70
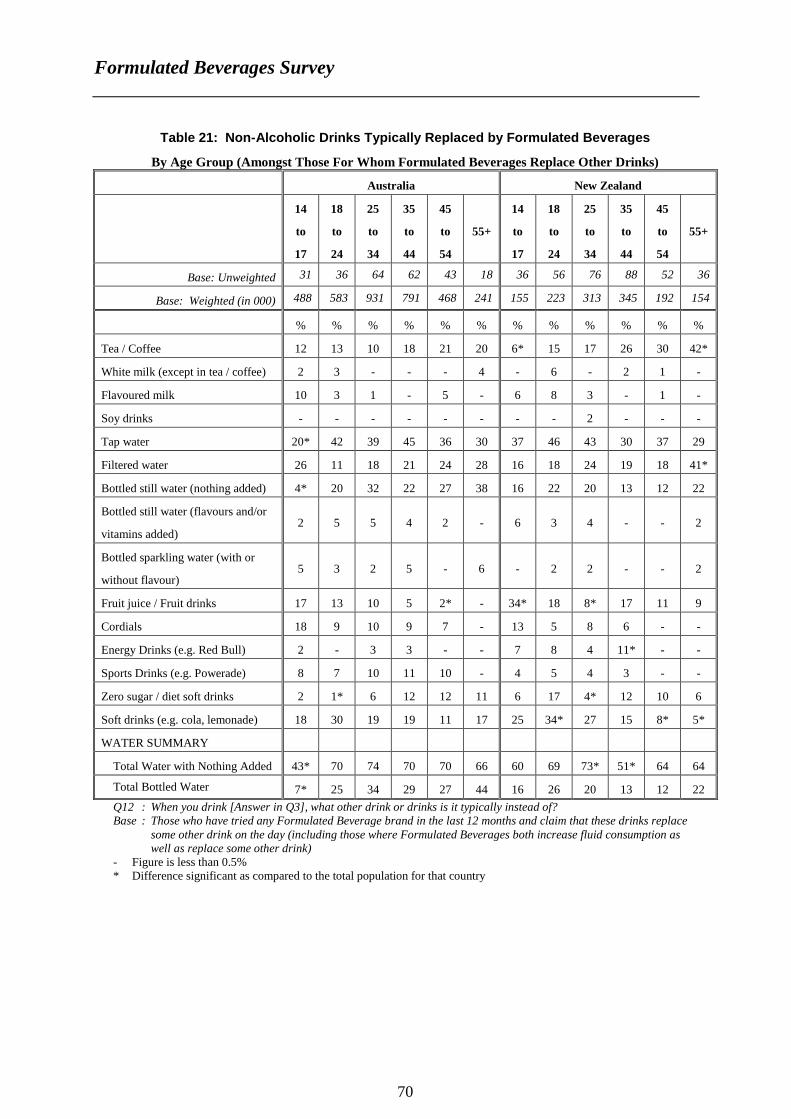
Table 21: Non-Alcoholic Drinks Typically Replaced by Formulated Beverages
By Age Group (Amongst Those For Whom Formulated Beverages Replace Other Drinks)
Australia New Zealand
14
to
17
18
to
24
25
to
34
35
to
44
45
to
54
55+
14
to
17
18
to
24
25
to
34
35
to
44
45
to
54
55+
Base: Unweighted 31 36 64 62 43 18 36 56 76 88 52 36
Base: Weighted (in 000) 488 583 931 791 468 241 155 223 313 345 192 154
% % % % % % % % % % % %
Tea / Coffee 12 13 10 18 21 20 6* 15 17 26 30 42*
White milk (except in tea / coffee) 2 3 - - - 4 - 6 - 2 1 -
Flavoured milk 10 3 1 - 5 - 6 8 3 - 1 -
Soy drinks - - - - - - - - 2 - - -
Tap water 20* 42 39 45 36 30 37 46 43 30 37 29
Filtered water 26 11 18 21 24 28 16 18 24 19 18 41*
Bottled still water (nothing added) 4* 20 32 22 27 38 16 22 20 13 12 22
Bottled still water (flavours and/or
vitamins added) 2 5 5 4 2 - 6 3 4 - - 2
Bottled sparkling water (with or
without flavour) 5 3 2 5 - 6 - 2 2 - - 2
Fruit juice / Fruit drinks 17 13 10 5 2* - 34* 18 8* 17 11 9
Cordials 18 9 10 9 7 - 13 5 8 6 - -
Energy Drinks (e.g. Red Bull) 2 - 3 3 - - 7 8 4 11* - -
Sports Drinks (e.g. Powerade) 8 7 10 11 10 - 4 5 4 3 - -
Zero sugar / diet soft drinks 2 1* 6 12 12 11 6 17 4* 12 10 6
Soft drinks (e.g. cola, lemonade) 18 30 19 19 11 17 25 34* 27 15 8* 5*
WATER SUMMARY
Total Water with Nothing Added 43* 70 74 70 70 66 60 69 73* 51* 64 64
Total Bottled Water 7* 25 34 29 27 44 16 26 20 13 12 22
Q12 : When you drink [Answer in Q3], what other drink or drinks is it typically instead of?
Base : Those who have tried any Formulated Beverage brand in the last 12 months and claim that these drinks replace
some other drink on the day (including those where Formulated Beverages both increase fluid consumption as
well as replace some other drink)
- Figure is less than 0.5%
* Difference significant as compared to the total population for that country
Formulated Beverages Survey
71
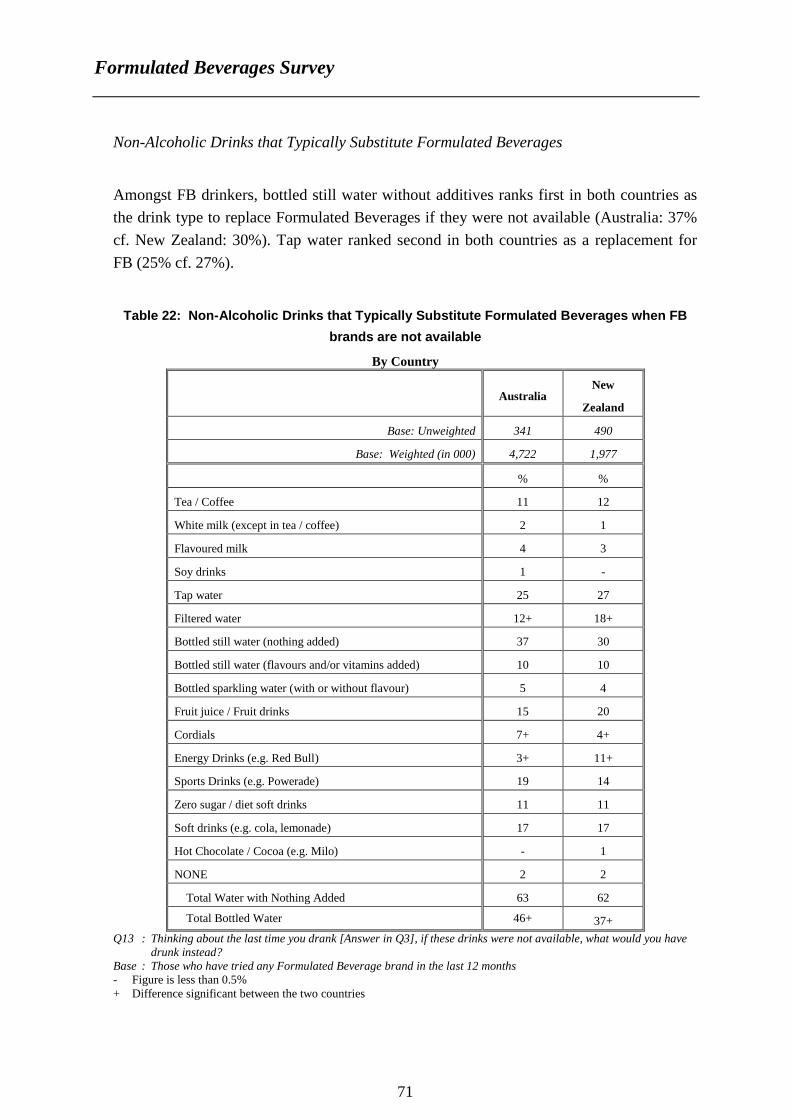
Non-Alcoholic Drinks that Typically Substitute Formulated Beverages
Amongst FB drinkers, bottled still water without additives ranks first in both countries as
the drink type to replace Formulated Beverages if they were not available (Australia: 37%
cf. New Zealand: 30%). Tap water ranked second in both countries as a replacement for
FB (25% cf. 27%).
Table 22: Non-Alcoholic Drinks that Typically Substitute Formulated Beverages when FB
brands are not available
By Country
Australia New
Zealand
Base: Unweighted 341 490
Base: Weighted (in 000) 4,722 1,977
% %
Tea / Coffee 11 12
White milk (except in tea / coffee) 2 1
Flavoured milk 4 3
Soy drinks 1 -
Tap water 25 27
Filtered water 12+ 18+
Bottled still water (nothing added) 37 30
Bottled still water (flavours and/or vitamins added) 10 10
Bottled sparkling water (with or without flavour) 5 4
Fruit juice / Fruit drinks 15 20
Cordials 7+ 4+
Energy Drinks (e.g. Red Bull) 3+ 11+
Sports Drinks (e.g. Powerade) 19 14
Zero sugar / diet soft drinks 11 11
Soft drinks (e.g. cola, lemonade) 17 17
Hot Chocolate / Cocoa (e.g. Milo) - 1
NONE 2 2
Total Water with Nothing Added 63 62
Total Bottled Water 46+ 37+
Q13 : Thinking about the last time you drank [Answer in Q3], if these drinks were not available, what would you have
drunk instead?
Base : Those who have tried any Formulated Beverage brand in the last 12 months
- Figure is less than 0.5%
+ Difference significant between the two countries
Formulated Beverages Survey
72
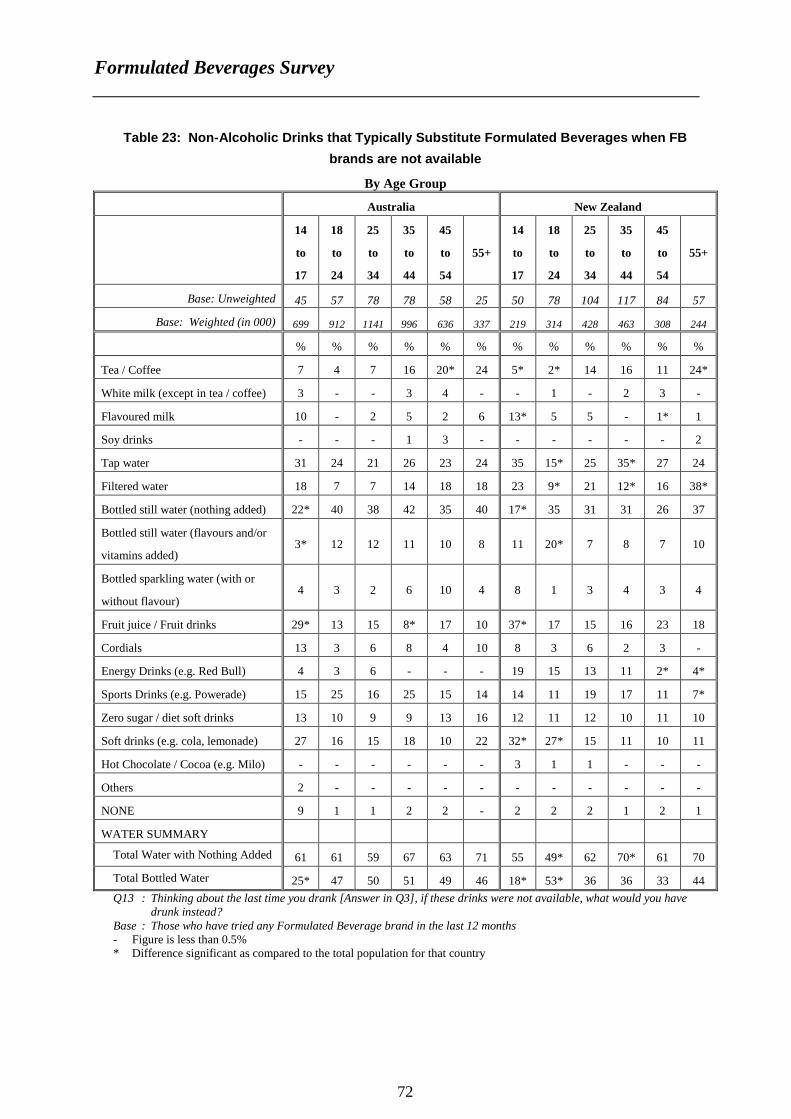
Table 23: Non-Alcoholic Drinks that Typically Substitute Formulated Beverages when FB
brands are not available
By Age Group
Australia New Zealand
14
to
17
18
to
24
25
to
34
35
to
44
45
to
54
55+
14
to
17
18
to
24
25
to
34
35
to
44
45
to
54
55+
Base: Unweighted 45 57 78 78 58 25 50 78 104 117 84 57
Base: Weighted (in 000) 699 912 1141 996 636 337 219 314 428 463 308 244
% % % % % % % % % % % %
Tea / Coffee 7 4 7 16 20* 24 5* 2* 14 16 11 24*
White milk (except in tea / coffee) 3 - - 3 4 - - 1 - 2 3 -
Flavoured milk 10 - 2 5 2 6 13* 5 5 - 1* 1
Soy drinks - - - 1 3 - - - - - - 2
Tap water 31 24 21 26 23 24 35 15* 25 35* 27 24
Filtered water 18 7 7 14 18 18 23 9* 21 12* 16 38*
Bottled still water (nothing added) 22* 40 38 42 35 40 17* 35 31 31 26 37
Bottled still water (flavours and/or
vitamins added) 3* 12 12 11 10 8 11 20* 7 8 7 10
Bottled sparkling water (with or
without flavour) 4 3 2 6 10 4 8 1 3 4 3 4
Fruit juice / Fruit drinks 29* 13 15 8* 17 10 37* 17 15 16 23 18
Cordials 13 3 6 8 4 10 8 3 6 2 3 -
Energy Drinks (e.g. Red Bull) 4 3 6 - - - 19 15 13 11 2* 4*
Sports Drinks (e.g. Powerade) 15 25 16 25 15 14 14 11 19 17 11 7*
Zero sugar / diet soft drinks 13 10 9 9 13 16 12 11 12 10 11 10
Soft drinks (e.g. cola, lemonade) 27 16 15 18 10 22 32* 27* 15 11 10 11
Hot Chocolate / Cocoa (e.g. Milo) - - - - - - 3 1 1 - - -
Others 2 - - - - - - - - - - -
NONE 9 1 1 2 2 - 2 2 2 1 2 1
WATER SUMMARY
Total Water with Nothing Added 61 61 59 67 63 71 55 49* 62 70* 61 70
Total Bottled Water 25* 47 50 51 49 46 18* 53* 36 36 33 44
Q13 : Thinking about the last time you drank [Answer in Q3], if these drinks were not available, what would you have
drunk instead?
Base : Those who have tried any Formulated Beverage brand in the last 12 months
- Figure is less than 0.5%
* Difference significant as compared to the total population for that country
Formulated Beverages Survey
73
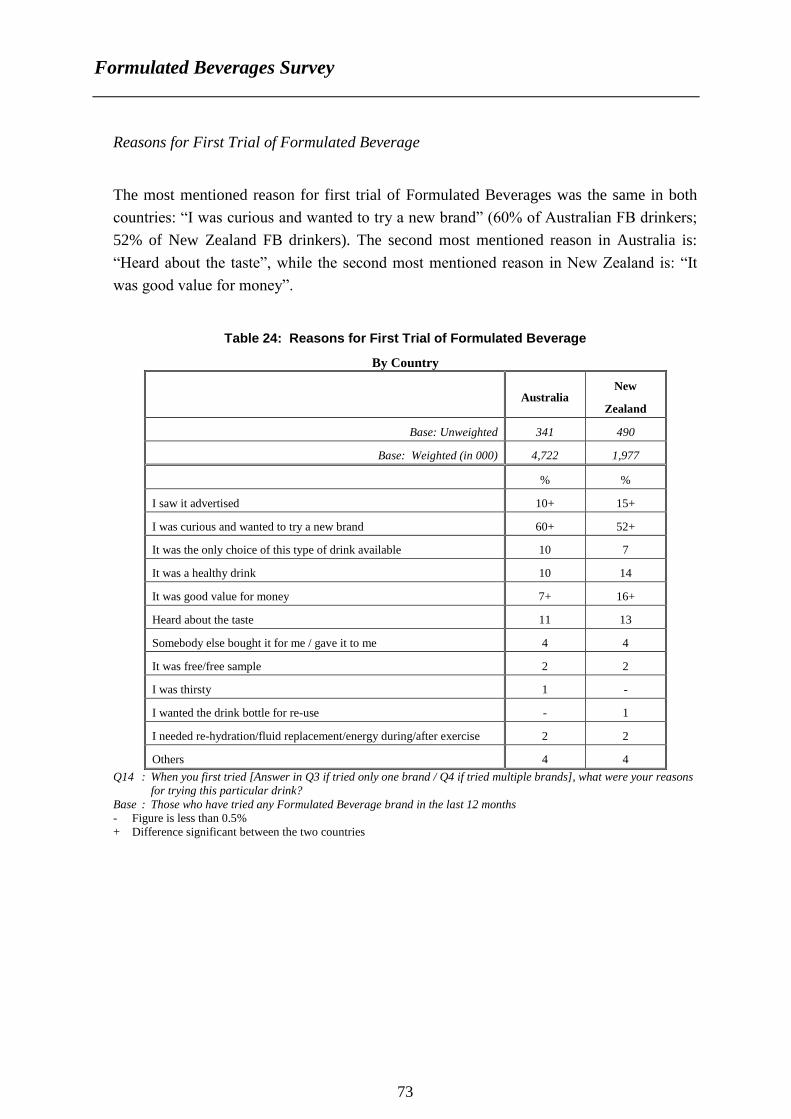
Reasons for First Trial of Formulated Beverage
The most mentioned reason for first trial of Formulated Beverages was the same in both
countries: “I was curious and wanted to try a new brand” (60% of Australian FB drinkers;
52% of New Zealand FB drinkers). The second most mentioned reason in Australia is:
“Heard about the taste”, while the second most mentioned reason in New Zealand is: “It
was good value for money”.
Table 24: Reasons for First Trial of Formulated Beverage
By Country
Australia New
Zealand
Base: Unweighted 341 490
Base: Weighted (in 000) 4,722 1,977
% %
I saw it advertised 10+ 15+
I was curious and wanted to try a new brand 60+ 52+
It was the only choice of this type of drink available 10 7
It was a healthy drink 10 14
It was good value for money 7+ 16+
Heard about the taste 11 13
Somebody else bought it for me / gave it to me 4 4
It was free/free sample 2 2
I was thirsty 1 -
I wanted the drink bottle for re-use - 1
I needed re-hydration/fluid replacement/energy during/after exercise 2 2
Others 4 4
Q14 : When you first tried [Answer in Q3 if tried only one brand / Q4 if tried multiple brands], what were your reasons
for trying this particular drink?
Base : Those who have tried any Formulated Beverage brand in the last 12 months
- Figure is less than 0.5%
+ Difference significant between the two countries
Formulated Beverages Survey
74
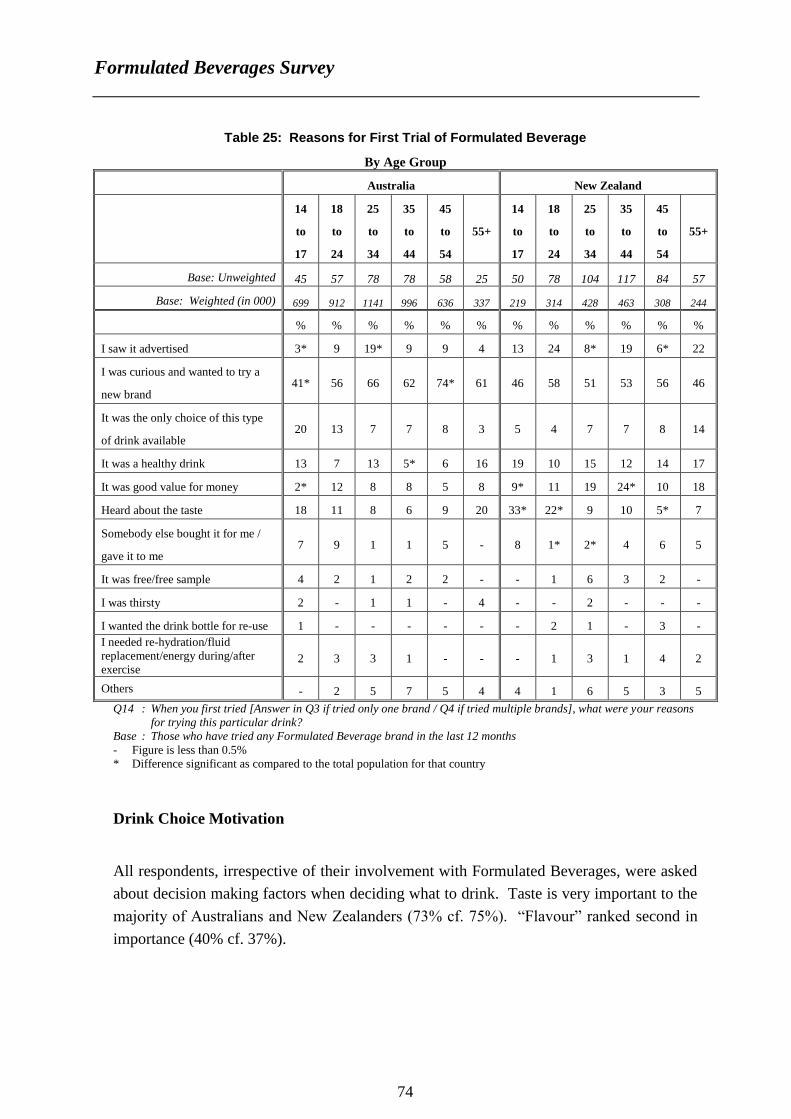
Table 25: Reasons for First Trial of Formulated Beverage
By Age Group
Australia New Zealand
14
to
17
18
to
24
25
to
34
35
to
44
45
to
54
55+
14
to
17
18
to
24
25
to
34
35
to
44
45
to
54
55+
Base: Unweighted 45 57 78 78 58 25 50 78 104 117 84 57
Base: Weighted (in 000) 699 912 1141 996 636 337 219 314 428 463 308 244
% % % % % % % % % % % %
I saw it advertised 3* 9 19* 9 9 4 13 24 8* 19 6* 22
I was curious and wanted to try a
new brand 41* 56 66 62 74* 61 46 58 51 53 56 46
It was the only choice of this type
of drink available 20 13 7 7 8 3 5 4 7 7 8 14
It was a healthy drink 13 7 13 5* 6 16 19 10 15 12 14 17
It was good value for money 2* 12 8 8 5 8 9* 11 19 24* 10 18
Heard about the taste 18 11 8 6 9 20 33* 22* 9 10 5* 7
Somebody else bought it for me /
gave it to me 7 9 1 1 5 - 8 1* 2* 4 6 5
It was free/free sample 4 2 1 2 2 - - 1 6 3 2 -
I was thirsty 2 - 1 1 - 4 - - 2 - - -
I wanted the drink bottle for re-use 1 - - - - - - 2 1 - 3 -
I needed re-hydration/fluid
replacement/energy during/after
exercise 2 3 3 1 - - - 1 3 1 4 2
Others - 2 5 7 5 4 4 1 6 5 3 5
Q14 : When you first tried [Answer in Q3 if tried only one brand / Q4 if tried multiple brands], what were your reasons
for trying this particular drink?
Base : Those who have tried any Formulated Beverage brand in the last 12 months
- Figure is less than 0.5%
* Difference significant as compared to the total population for that country
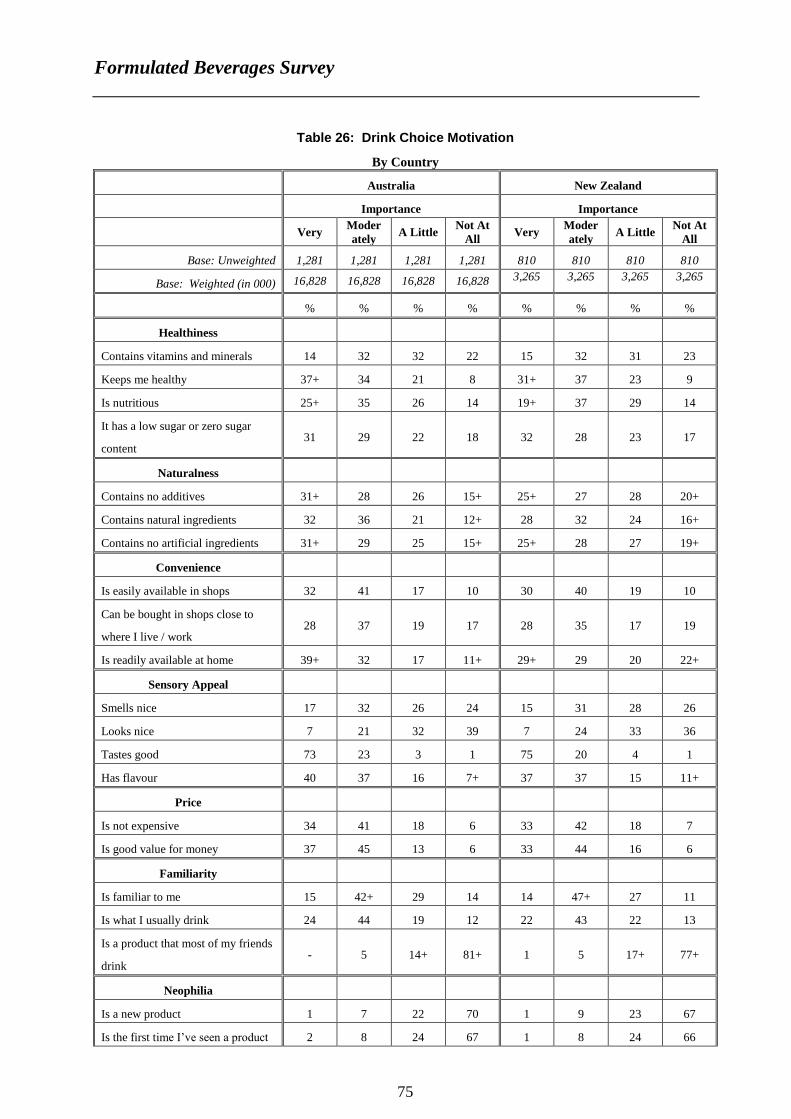
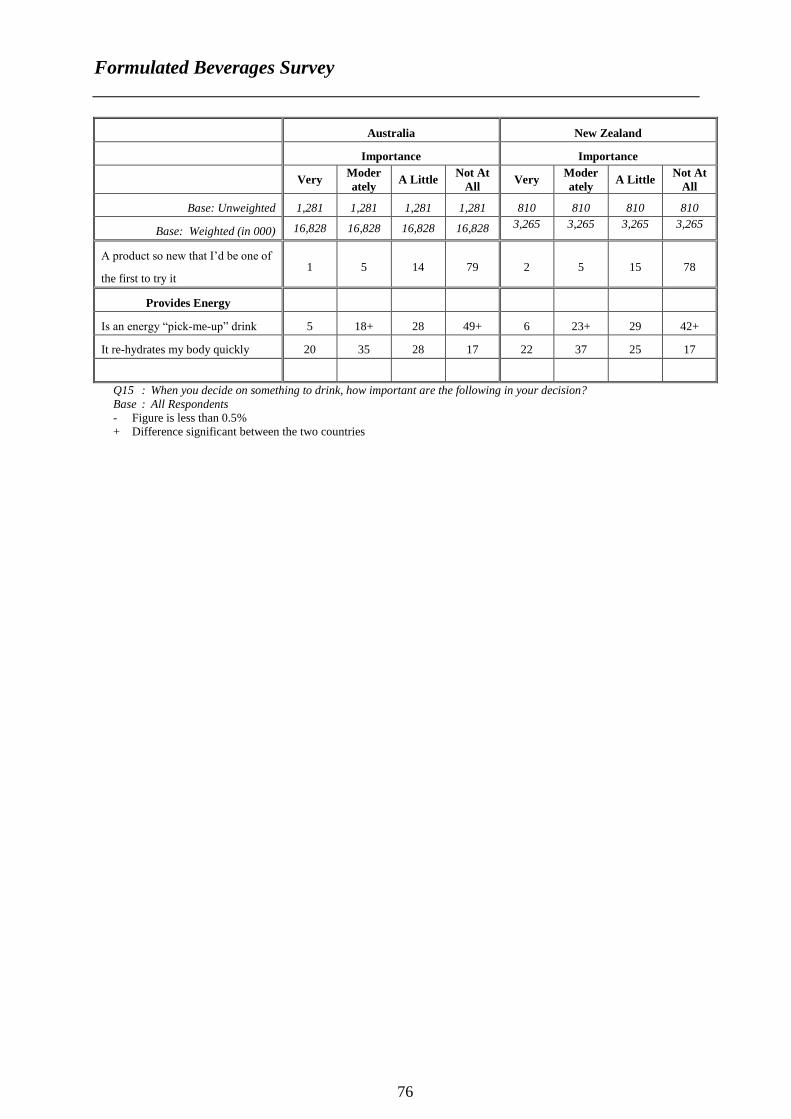
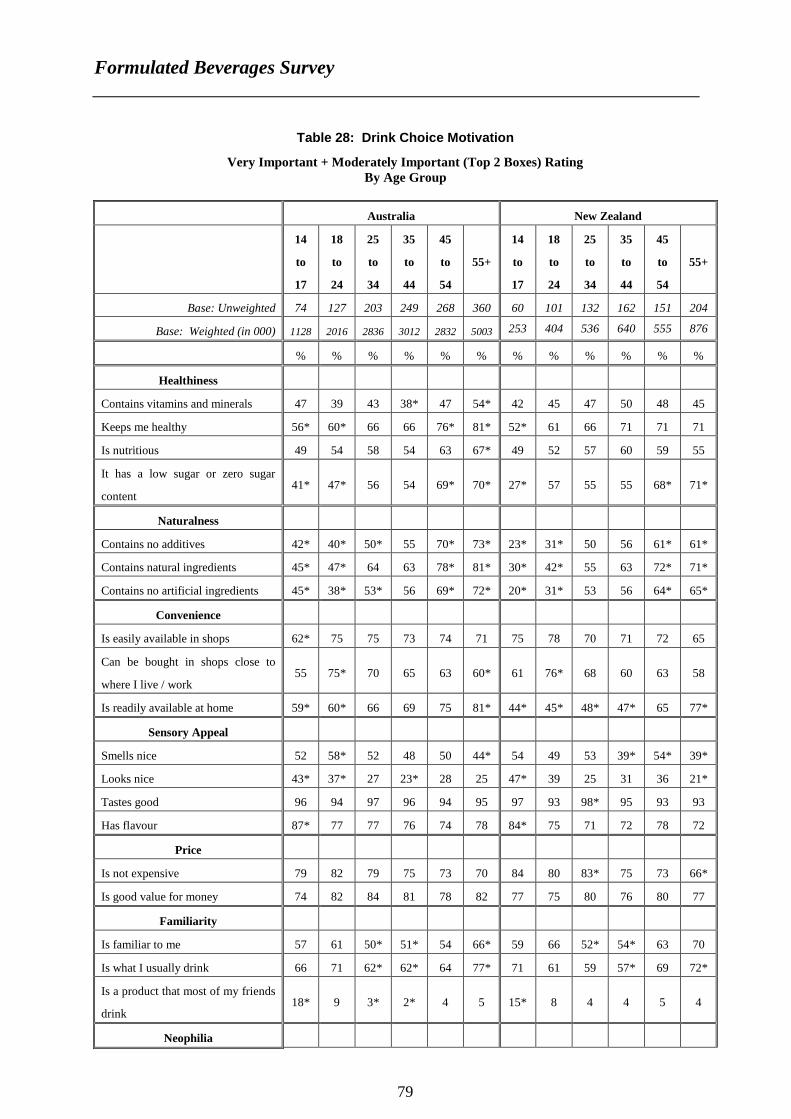
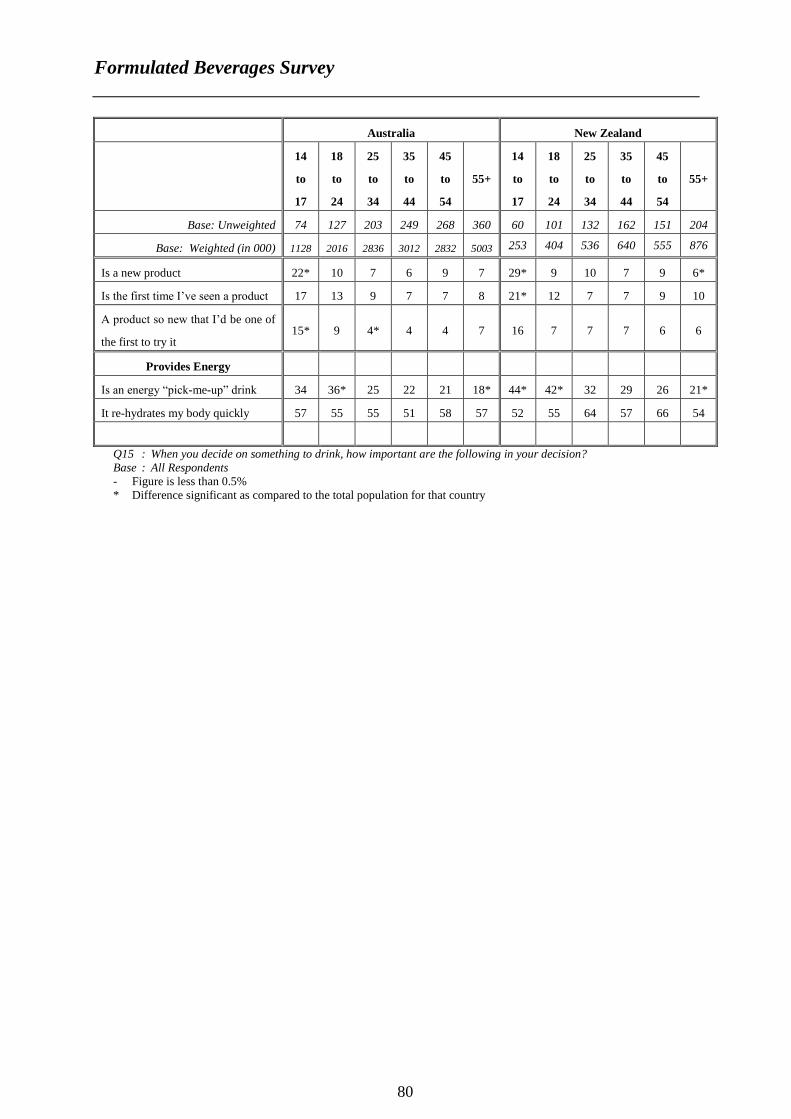
Drink Choice Motivation
All respondents, irrespective of their involvement with Formulated Beverages, were asked
about decision making factors when deciding what to drink. Taste is very important to the
majority of Australians and New Zealanders (73% cf. 75%). “Flavour” ranked second in
importance (40% cf. 37%).
Formulated Beverages Survey
75
Table 26: Drink Choice Motivation
By Country
Australia New Zealand
Importance Importance
Very Moder
ately A Little
Not At
All Very
Moder
ately A Little
Not At
All
Base: Unweighted 1,281 1,281 1,281 1,281 810 810 810 810
Base: Weighted (in 000) 16,828 16,828 16,828 16,828 3,265 3,265 3,265 3,265
% % % % % % % %
Healthiness
Contains vitamins and minerals 14 32 32 22 15 32 31 23
Keeps me healthy 37+ 34 21 8 31+ 37 23 9
Is nutritious 25+ 35 26 14 19+ 37 29 14
It has a low sugar or zero sugar
content 31 29 22 18 32 28 23 17
Naturalness
Contains no additives 31+ 28 26 15+ 25+ 27 28 20+
Contains natural ingredients 32 36 21 12+ 28 32 24 16+
Contains no artificial ingredients 31+ 29 25 15+ 25+ 28 27 19+
Convenience
Is easily available in shops 32 41 17 10 30 40 19 10
Can be bought in shops close to
where I live / work 28 37 19 17 28 35 17 19
Is readily available at home 39+ 32 17 11+ 29+ 29 20 22+
Sensory Appeal
Smells nice 17 32 26 24 15 31 28 26
Looks nice 7 21 32 39 7 24 33 36
Tastes good 73 23 3 1 75 20 4 1
Has flavour 40 37 16 7+ 37 37 15 11+
Price
Is not expensive 34 41 18 6 33 42 18 7
Is good value for money 37 45 13 6 33 44 16 6
Familiarity
Is familiar to me 15 42+ 29 14 14 47+ 27 11
Is what I usually drink 24 44 19 12 22 43 22 13
Is a product that most of my friends
drink - 5 14+ 81+ 1 5 17+ 77+
Neophilia
Is a new product 1 7 22 70 1 9 23 67
Is the first time I’ve seen a product 2 8 24 67 1 8 24 66
Formulated Beverages Survey
76
Australia New Zealand
Importance Importance
Very Moder
ately A Little
Not At
All Very
Moder
ately A Little
Not At
All
Base: Unweighted 1,281 1,281 1,281 1,281 810 810 810 810
Base: Weighted (in 000) 16,828 16,828 16,828 16,828 3,265 3,265 3,265 3,265
A product so new that I’d be one of
the first to try it 1 5 14 79 2 5 15 78
Provides Energy
Is an energy “pick-me-up” drink 5 18+ 28 49+ 6 23+ 29 42+
It re-hydrates my body quickly 20 35 28 17 22 37 25 17
Q15 : When you decide on something to drink, how important are the following in your decision?
Base : All Respondents - Figure is less than 0.5%
+ Difference significant between the two countries
Formulated Beverages Survey
77
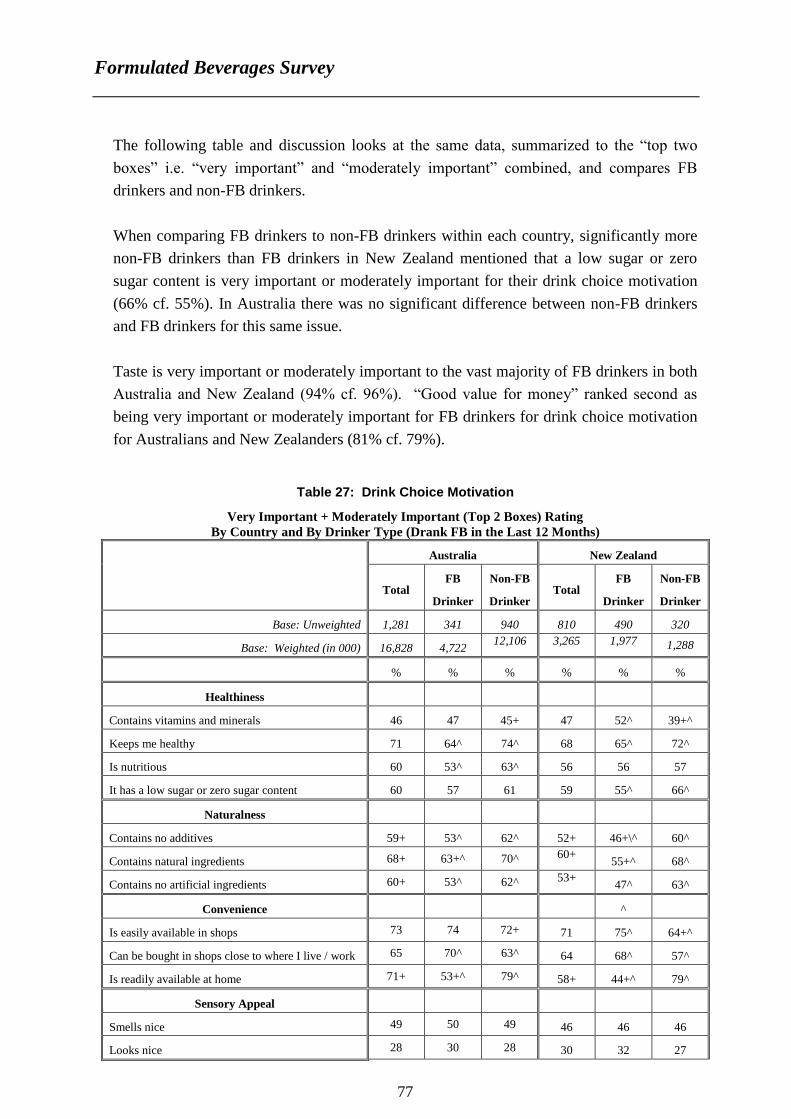
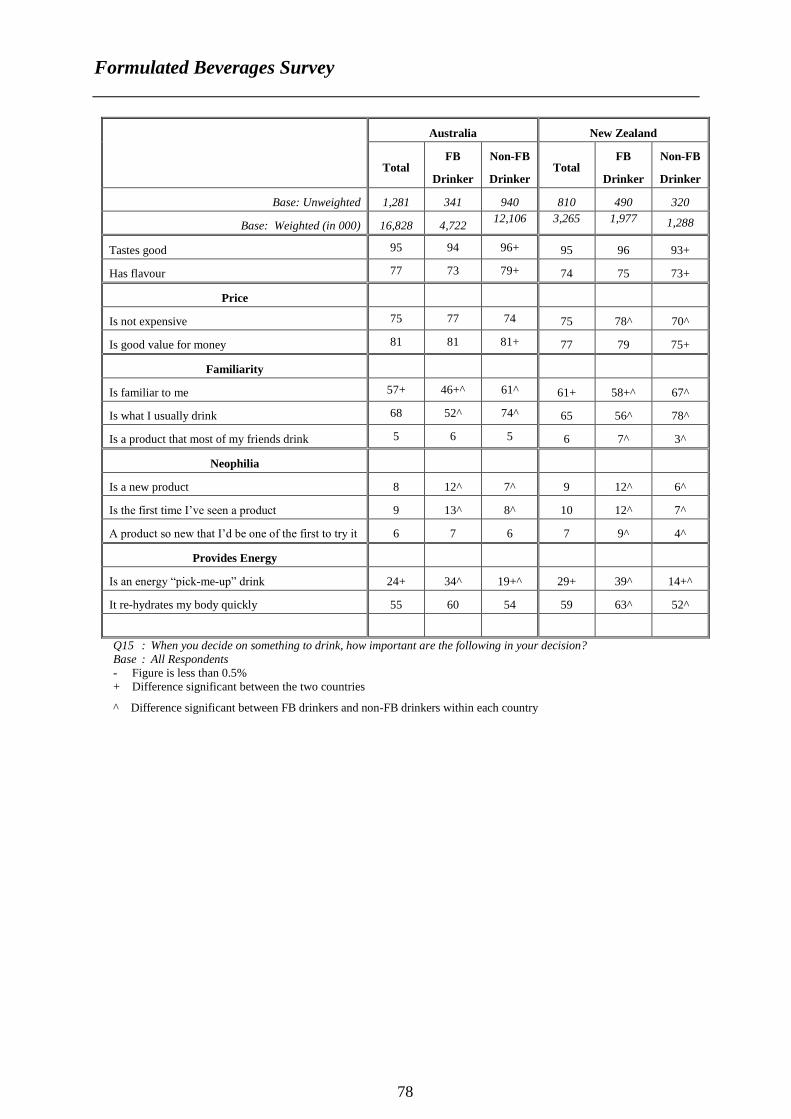
The following table and discussion looks at the same data, summarized to the “top two
boxes” i.e. “very important” and “moderately important” combined, and compares FB
drinkers and non-FB drinkers.
When comparing FB drinkers to non-FB drinkers within each country, significantly more
non-FB drinkers than FB drinkers in New Zealand mentioned that a low sugar or zero
sugar content is very important or moderately important for their drink choice motivation
(66% cf. 55%). In Australia there was no significant difference between non-FB drinkers
and FB drinkers for this same issue.
Taste is very important or moderately important to the vast majority of FB drinkers in both
Australia and New Zealand (94% cf. 96%). “Good value for money” ranked second as
being very important or moderately important for FB drinkers for drink choice motivation
for Australians and New Zealanders (81% cf. 79%).
Table 27: Drink Choice Motivation
Very Important + Moderately Important (Top 2 Boxes) Rating
By Country and By Drinker Type (Drank FB in the Last 12 Months)
Australia New Zealand
Total FB
Drinker
Non-FB
Drinker Total
FB
Drinker
Non-FB
Drinker
Base: Unweighted 1,281 341 940 810 490 320
Base: Weighted (in 000) 16,828 4,722 12,106 3,265 1,977 1,288
% % % % % %
Healthiness
Contains vitamins and minerals 46 47 45+ 47 52^ 39+^
Keeps me healthy 71 64^ 74^ 68 65^ 72^
Is nutritious 60 53^ 63^ 56 56 57
It has a low sugar or zero sugar content 60 57 61 59 55^ 66^
Naturalness
Contains no additives 59+ 53^ 62^ 52+ 46+\^ 60^
Contains natural ingredients 68+ 63+^ 70^ 60+ 55+^ 68^
Contains no artificial ingredients 60+ 53^ 62^ 53+ 47^ 63^
Convenience ^
Is easily available in shops 73 74 72+ 71 75^ 64+^
Can be bought in shops close to where I live / work 65 70^ 63^ 64 68^ 57^
Is readily available at home 71+ 53+^ 79^ 58+ 44+^ 79^
Sensory Appeal
Smells nice 49 50 49 46 46 46
Looks nice 28 30 28 30 32 27
Formulated Beverages Survey
78
Australia New Zealand
Total FB
Drinker
Non-FB
Drinker Total
FB
Drinker
Non-FB
Drinker
Base: Unweighted 1,281 341 940 810 490 320
Base: Weighted (in 000) 16,828 4,722 12,106 3,265 1,977 1,288
Tastes good 95 94 96+ 95 96 93+
Has flavour 77 73 79+ 74 75 73+
Price
Is not expensive 75 77 74 75 78^ 70^
Is good value for money 81 81 81+ 77 79 75+
Familiarity
Is familiar to me 57+ 46+^ 61^ 61+ 58+^ 67^
Is what I usually drink 68 52^ 74^ 65 56^ 78^
Is a product that most of my friends drink 5 6 5 6 7^ 3^
Neophilia
Is a new product 8 12^ 7^ 9 12^ 6^
Is the first time I’ve seen a product 9 13^ 8^ 10 12^ 7^
A product so new that I’d be one of the first to try it 6 7 6 7 9^ 4^
Provides Energy
Is an energy “pick-me-up” drink 24+ 34^ 19+^ 29+ 39^ 14+^
It re-hydrates my body quickly 55 60 54 59 63^ 52^
Q15 : When you decide on something to drink, how important are the following in your decision?
Base : All Respondents - Figure is less than 0.5%
+ Difference significant between the two countries
^ Difference significant between FB drinkers and non-FB drinkers within each country
Formulated Beverages Survey
79
Table 28: Drink Choice Motivation
Very Important + Moderately Important (Top 2 Boxes) Rating
By Age Group
Australia New Zealand
14
to
17
18
to
24
25
to
34
35
to
44
45
to
54
55+
14
to
17
18
to
24
25
to
34
35
to
44
45
to
54
55+
Base: Unweighted 74 127 203 249 268 360 60 101 132 162 151 204
Base: Weighted (in 000) 1128 2016 2836 3012 2832 5003 253 404 536 640 555 876
% % % % % % % % % % % %
Healthiness
Contains vitamins and minerals 47 39 43 38* 47 54* 42 45 47 50 48 45
Keeps me healthy 56* 60* 66 66 76* 81* 52* 61 66 71 71 71
Is nutritious 49 54 58 54 63 67* 49 52 57 60 59 55
It has a low sugar or zero sugar
content 41* 47* 56 54 69* 70* 27* 57 55 55 68* 71*
Naturalness
Contains no additives 42* 40* 50* 55 70* 73* 23* 31* 50 56 61* 61*
Contains natural ingredients 45* 47* 64 63 78* 81* 30* 42* 55 63 72* 71*
Contains no artificial ingredients 45* 38* 53* 56 69* 72* 20* 31* 53 56 64* 65*
Convenience
Is easily available in shops 62* 75 75 73 74 71 75 78 70 71 72 65
Can be bought in shops close to
where I live / work 55 75* 70 65 63 60* 61 76* 68 60 63 58
Is readily available at home 59* 60* 66 69 75 81* 44* 45* 48* 47* 65 77*
Sensory Appeal
Smells nice 52 58* 52 48 50 44* 54 49 53 39* 54* 39*
Looks nice 43* 37* 27 23* 28 25 47* 39 25 31 36 21*
Tastes good 96 94 97 96 94 95 97 93 98* 95 93 93
Has flavour 87* 77 77 76 74 78 84* 75 71 72 78 72
Price
Is not expensive 79 82 79 75 73 70 84 80 83* 75 73 66*
Is good value for money 74 82 84 81 78 82 77 75 80 76 80 77
Familiarity
Is familiar to me 57 61 50* 51* 54 66* 59 66 52* 54* 63 70
Is what I usually drink 66 71 62* 62* 64 77* 71 61 59 57* 69 72*
Is a product that most of my friends
drink 18* 9 3* 2* 4 5 15* 8 4 4 5 4
Neophilia
Formulated Beverages Survey
80
Australia New Zealand
14
to
17
18
to
24
25
to
34
35
to
44
45
to
54
55+
14
to
17
18
to
24
25
to
34
35
to
44
45
to
54
55+
Base: Unweighted 74 127 203 249 268 360 60 101 132 162 151 204
Base: Weighted (in 000) 1128 2016 2836 3012 2832 5003 253 404 536 640 555 876
Is a new product 22* 10 7 6 9 7 29* 9 10 7 9 6*
Is the first time I’ve seen a product 17 13 9 7 7 8 21* 12 7 7 9 10
A product so new that I’d be one of
the first to try it 15* 9 4* 4 4 7 16 7 7 7 6 6
Provides Energy
Is an energy “pick-me-up” drink 34 36* 25 22 21 18* 44* 42* 32 29 26 21*
It re-hydrates my body quickly 57 55 55 51 58 57 52 55 64 57 66 54
Q15 : When you decide on something to drink, how important are the following in your decision?
Base : All Respondents - Figure is less than 0.5%
* Difference significant as compared to the total population for that country
Formulated Beverages Survey
81
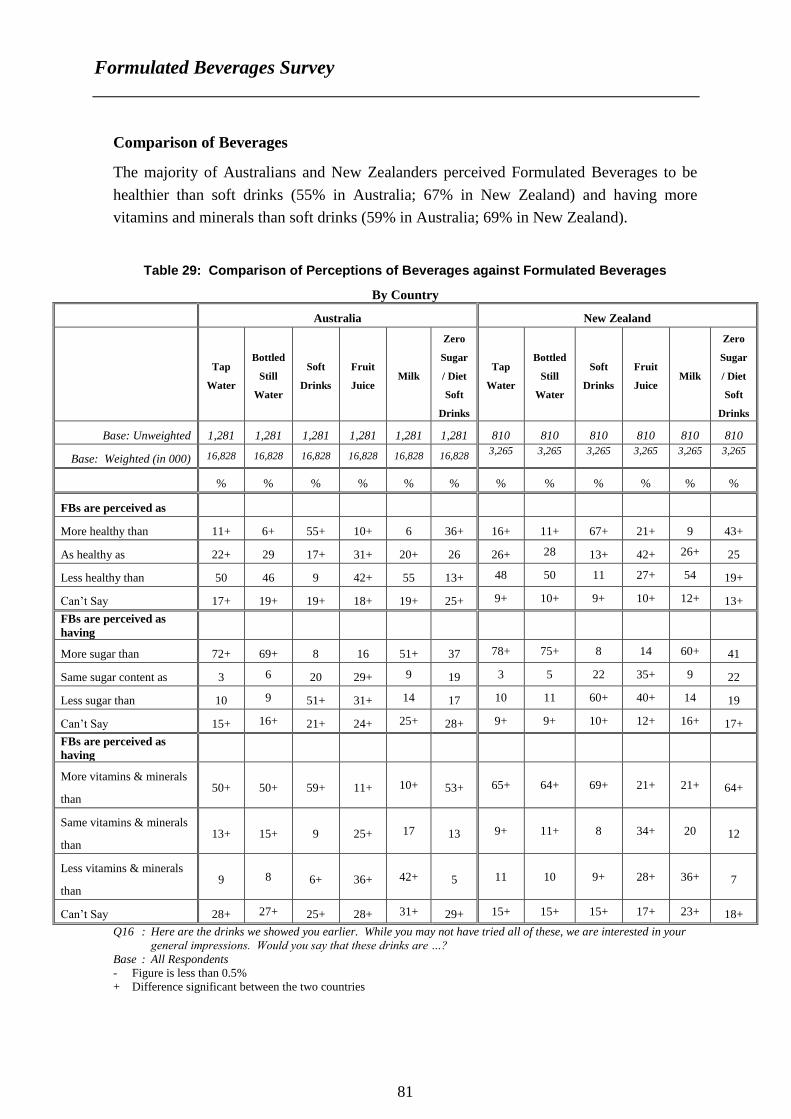
Comparison of Beverages
The majority of Australians and New Zealanders perceived Formulated Beverages to be
healthier than soft drinks (55% in Australia; 67% in New Zealand) and having more
vitamins and minerals than soft drinks (59% in Australia; 69% in New Zealand).
Table 29: Comparison of Perceptions of Beverages against Formulated Beverages
By Country
Australia New Zealand
Tap
Water
Bottled
Still
Water
Soft
Drinks
Fruit
Juice Milk
Zero
Sugar
/ Diet
Soft
Drinks
Tap
Water
Bottled
Still
Water
Soft
Drinks
Fruit
Juice Milk
Zero
Sugar
/ Diet
Soft
Drinks
Base: Unweighted 1,281 1,281 1,281 1,281 1,281 1,281 810 810 810 810 810 810
Base: Weighted (in 000) 16,828 16,828 16,828 16,828 16,828 16,828 3,265 3,265 3,265 3,265 3,265 3,265
% % % % % % % % % % % %
FBs are perceived as
More healthy than 11+ 6+ 55+ 10+ 6 36+ 16+ 11+ 67+ 21+ 9 43+
As healthy as 22+ 29 17+ 31+ 20+ 26 26+ 28 13+ 42+ 26+ 25
Less healthy than 50 46 9 42+ 55 13+ 48 50 11 27+ 54 19+
Can’t Say 17+ 19+ 19+ 18+ 19+ 25+ 9+ 10+ 9+ 10+ 12+ 13+
FBs are perceived as
having
More sugar than 72+ 69+ 8 16 51+ 37 78+ 75+ 8 14 60+ 41
Same sugar content as 3 6 20 29+ 9 19 3 5 22 35+ 9 22
Less sugar than 10 9 51+ 31+ 14 17 10 11 60+ 40+ 14 19
Can’t Say 15+ 16+ 21+ 24+ 25+ 28+ 9+ 9+ 10+ 12+ 16+ 17+
FBs are perceived as
having
More vitamins & minerals
than 50+ 50+ 59+ 11+ 10+ 53+ 65+ 64+ 69+ 21+ 21+ 64+
Same vitamins & minerals
than 13+ 15+ 9 25+ 17 13 9+ 11+ 8 34+ 20 12
Less vitamins & minerals
than 9 8 6+ 36+ 42+ 5 11 10 9+ 28+ 36+ 7
Can’t Say 28+ 27+ 25+ 28+ 31+ 29+ 15+ 15+ 15+ 17+ 23+ 18+
Q16 : Here are the drinks we showed you earlier. While you may not have tried all of these, we are interested in your
general impressions. Would you say that these drinks are …?
Base : All Respondents - Figure is less than 0.5%
+ Difference significant between the two countries
Formulated Beverages Survey
82
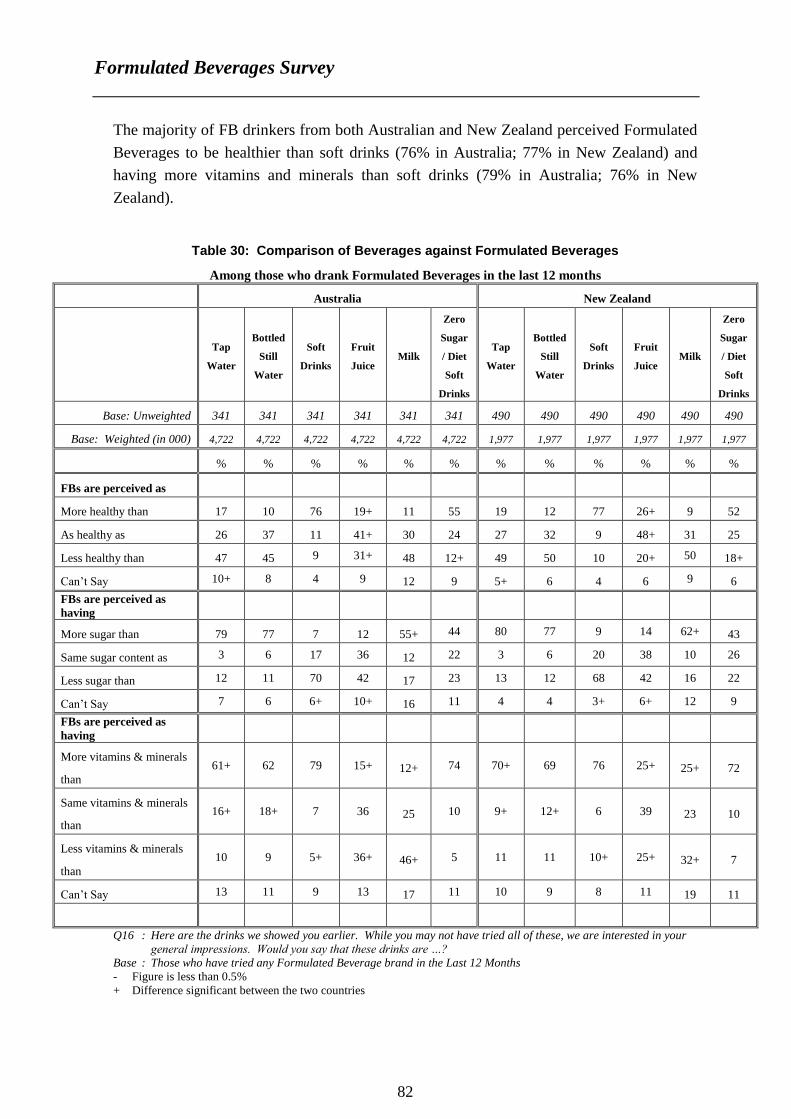
The majority of FB drinkers from both Australian and New Zealand perceived Formulated
Beverages to be healthier than soft drinks (76% in Australia; 77% in New Zealand) and
having more vitamins and minerals than soft drinks (79% in Australia; 76% in New
Zealand).
Table 30: Comparison of Beverages against Formulated Beverages
Among those who drank Formulated Beverages in the last 12 months
Australia New Zealand
Tap
Water
Bottled
Still
Water
Soft
Drinks
Fruit
Juice Milk
Zero
Sugar
/ Diet
Soft
Drinks
Tap
Water
Bottled
Still
Water
Soft
Drinks
Fruit
Juice Milk
Zero
Sugar
/ Diet
Soft
Drinks
Base: Unweighted 341 341 341 341 341 341 490 490 490 490 490 490
Base: Weighted (in 000) 4,722 4,722 4,722 4,722 4,722 4,722 1,977 1,977 1,977 1,977 1,977 1,977
% % % % % % % % % % % %
FBs are perceived as
More healthy than 17 10 76 19+ 11 55 19 12 77 26+ 9 52
As healthy as 26 37 11 41+ 30 24 27 32 9 48+ 31 25
Less healthy than 47 45 9 31+ 48 12+ 49 50 10 20+ 50 18+
Can’t Say 10+ 8 4 9 12 9 5+ 6 4 6 9 6
FBs are perceived as
having
More sugar than 79 77 7 12 55+ 44 80 77 9 14 62+ 43
Same sugar content as 3 6 17 36 12 22 3 6 20 38 10 26
Less sugar than 12 11 70 42 17 23 13 12 68 42 16 22
Can’t Say 7 6 6+ 10+ 16 11 4 4 3+ 6+ 12 9
FBs are perceived as
having
More vitamins & minerals
than
61+ 62 79 15+ 12+ 74 70+ 69 76 25+ 25+ 72
Same vitamins & minerals
than
16+ 18+ 7 36 25 10 9+ 12+ 6 39 23 10
Less vitamins & minerals
than
10 9 5+ 36+ 46+ 5 11 11 10+ 25+ 32+ 7
Can’t Say 13 11 9 13 17 11 10 9 8 11 19 11
Q16 : Here are the drinks we showed you earlier. While you may not have tried all of these, we are interested in your
general impressions. Would you say that these drinks are …?
Base : Those who have tried any Formulated Beverage brand in the Last 12 Months - Figure is less than 0.5%
+ Difference significant between the two countries
Formulated Beverages Survey
83
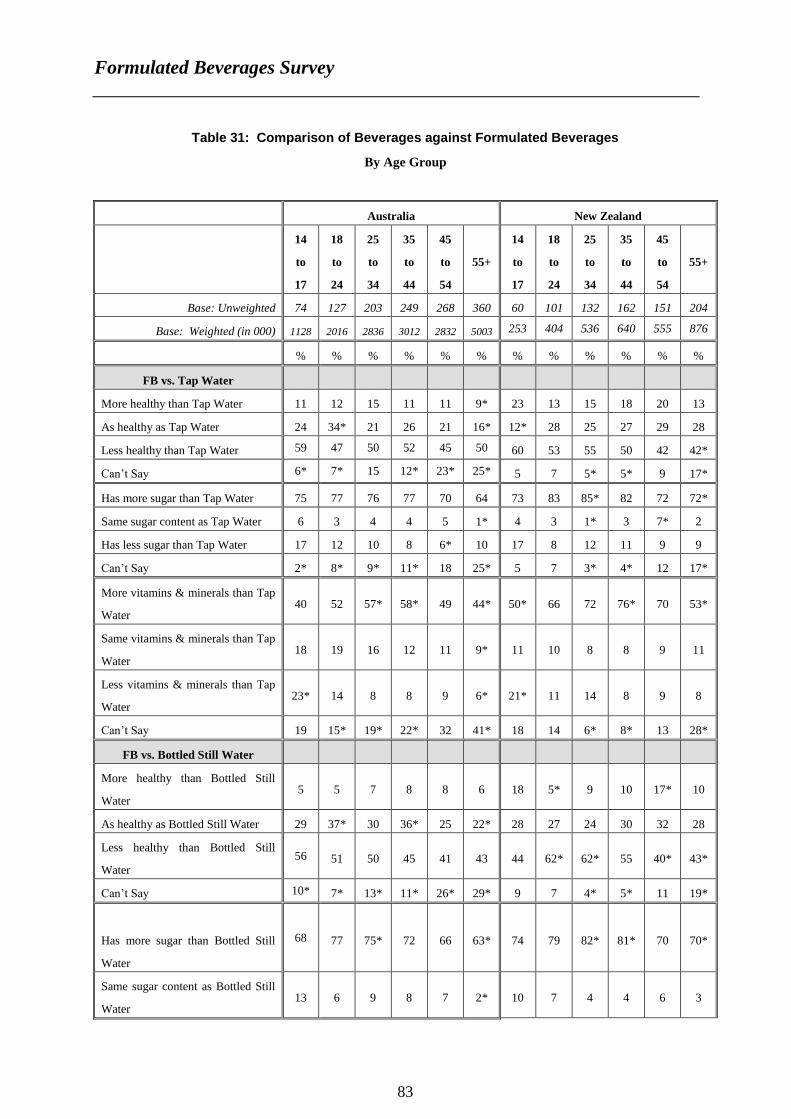
Table 31: Comparison of Beverages against Formulated Beverages
By Age Group
Australia New Zealand
14
to
17
18
to
24
25
to
34
35
to
44
45
to
54
55+
14
to
17
18
to
24
25
to
34
35
to
44
45
to
54
55+
Base: Unweighted 74 127 203 249 268 360 60 101 132 162 151 204
Base: Weighted (in 000) 1128 2016 2836 3012 2832 5003 253 404 536 640 555 876
% % % % % % % % % % % %
FB vs. Tap Water
More healthy than Tap Water 11 12 15 11 11 9* 23 13 15 18 20 13
As healthy as Tap Water 24 34* 21 26 21 16* 12* 28 25 27 29 28
Less healthy than Tap Water 59 47 50 52 45 50 60 53 55 50 42 42*
Can’t Say 6* 7* 15 12* 23* 25* 5 7 5* 5* 9 17*
Has more sugar than Tap Water 75 77 76 77 70 64 73 83 85* 82 72 72*
Same sugar content as Tap Water 6 3 4 4 5 1* 4 3 1* 3 7* 2
Has less sugar than Tap Water 17 12 10 8 6* 10 17 8 12 11 9 9
Can’t Say 2* 8* 9* 11* 18 25* 5 7 3* 4* 12 17*
More vitamins & minerals than Tap
Water 40 52 57* 58* 49 44* 50* 66 72 76* 70 53*
Same vitamins & minerals than Tap
Water 18 19 16 12 11 9* 11 10 8 8 9 11
Less vitamins & minerals than Tap
Water 23* 14 8 8 9 6* 21* 11 14 8 9 8
Can’t Say 19 15* 19* 22* 32 41* 18 14 6* 8* 13 28*
FB vs. Bottled Still Water
More healthy than Bottled Still
Water 5 5 7 8 8 6 18 5* 9 10 17* 10
As healthy as Bottled Still Water 29 37* 30 36* 25 22* 28 27 24 30 32 28
Less healthy than Bottled Still
Water
56 51 50 45 41 43 44 62* 62* 55 40* 43*
Can’t Say 10* 7* 13* 11* 26* 29* 9 7 4* 5* 11 19*
Has more sugar than Bottled Still
Water
68 77 75* 72 66 63* 74 79 82* 81* 70 70*
Same sugar content as Bottled Still
Water 13 6 9 8 7 2* 10 7 4 4 6 3
Formulated Beverages Survey
84
Australia New Zealand
14
to
17
18
to
24
25
to
34
35
to
44
45
to
54
55+
14
to
17
18
to
24
25
to
34
35
to
44
45
to
54
55+
Base: Unweighted 74 127 203 249 268 360 60 101 132 162 151 204
Base: Weighted (in 000) 1128 2016 2836 3012 2832 5003 253 404 536 640 555 876
Has less sugar than Bottled Still
Water 15 10 9 6* 6 10 14 8 11 10 12 10
Can’t Say 3* 7* 7* 15 20 25* 3* 6 3* 6 12 16*
More vitamins & minerals than
Bottled Still Water 38* 52 55 56* 49 44* 46* 66 70 77* 66 55*
Same vitamins & minerals than
Bottled Still Water 21 28* 18 15 13 8* 268 9 11 7* 12 9
Less vitamins & minerals than
Bottled Still Water 21* 12 5 7 7 6 12 12 13 8 8 7
Can’t Say 20 8* 22* 22* 31 41* 16 13 6* 8* 13 28*
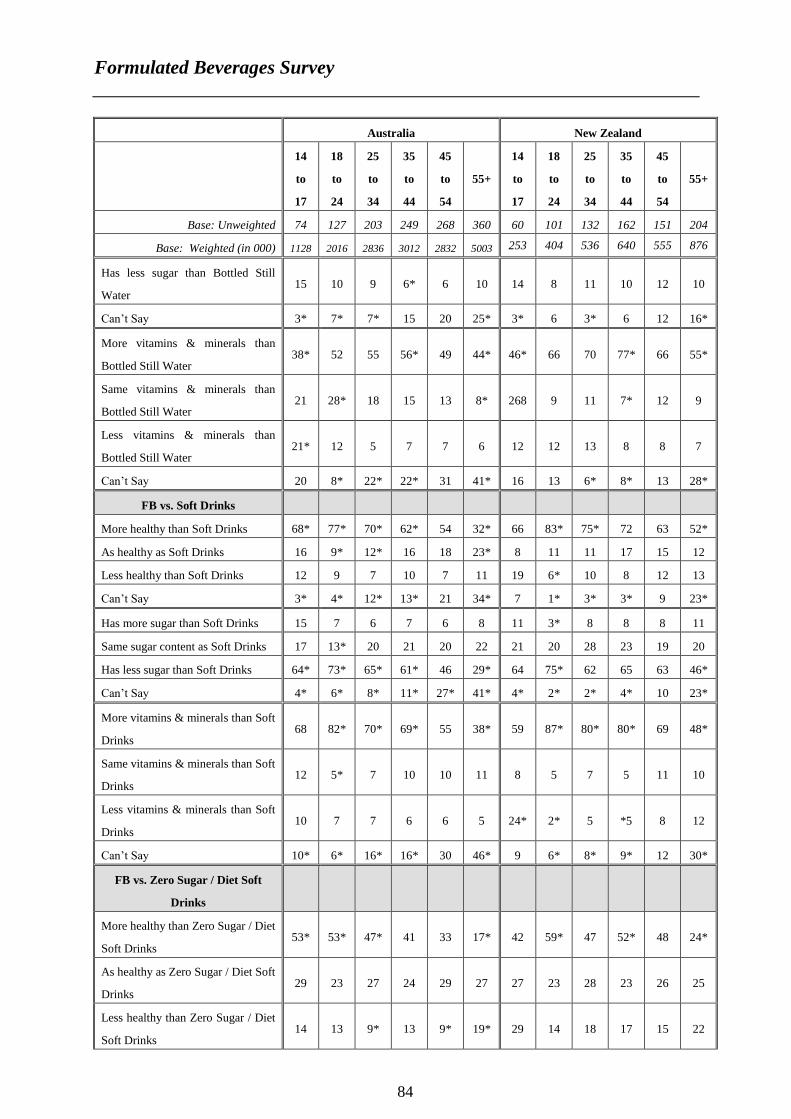
FB vs. Soft Drinks
More healthy than Soft Drinks 68* 77* 70* 62* 54 32* 66 83* 75* 72 63 52*
As healthy as Soft Drinks 16 9* 12* 16 18 23* 8 11 11 17 15 12
Less healthy than Soft Drinks 12 9 7 10 7 11 19 6* 10 8 12 13
Can’t Say 3* 4* 12* 13* 21 34* 7 1* 3* 3* 9 23*
Has more sugar than Soft Drinks 15 7 6 7 6 8 11 3* 8 8 8 11
Same sugar content as Soft Drinks 17 13* 20 21 20 22 21 20 28 23 19 20
Has less sugar than Soft Drinks 64* 73* 65* 61* 46 29* 64 75* 62 65 63 46*
Can’t Say 4* 6* 8* 11* 27* 41* 4* 2* 2* 4* 10 23*
More vitamins & minerals than Soft
Drinks 68 82* 70* 69* 55 38* 59 87* 80* 80* 69 48*
Same vitamins & minerals than Soft
Drinks 12 5* 7 10 10 11 8 5 7 5 11 10
Less vitamins & minerals than Soft
Drinks 10 7 7 6 6 5 24* 2* 5 *5 8 12
Can’t Say 10* 6* 16* 16* 30 46* 9 6* 8* 9* 12 30*
FB vs. Zero Sugar / Diet Soft
Drinks
More healthy than Zero Sugar / Diet
Soft Drinks 53* 53* 47* 41 33 17* 42 59* 47 52* 48 24*
As healthy as Zero Sugar / Diet Soft
Drinks 29 23 27 24 29 27 27 23 28 23 26 25
Less healthy than Zero Sugar / Diet
Soft Drinks 14 13 9* 13 9* 19* 29 14 18 17 15 22
Formulated Beverages Survey
85
Australia New Zealand
14
to
17
18
to
24
25
to
34
35
to
44
45
to
54
55+
14
to
17
18
to
24
25
to
34
35
to
44
45
to
54
55+
Base: Unweighted 74 127 203 249 268 360 60 101 132 162 151 204
Base: Weighted (in 000) 1128 2016 2836 3012 2832 5003 253 404 536 640 555 876
Can’t Say 4* 11* 17* 23 29* 37* 2* 4* 7* 8* 11 29*
Has more sugar than Zero Sugar /
Diet Soft Drinks 45 35 39 45* 32 33 45 52* 42 49* 34 34*
Same sugar content as Zero Sugar /
Diet Soft Drinks
24 23 22 22 16 14* 21 27 29 20 21 18
Has less sugar than Zero Sugar /
Diet Soft Drinks 25 26* 21 17 14 9* 24 19 22 21 24 13*
Can’t Say 6* 16* 17* 17* 38* 44* 10 2* 7* 11* 21 36*
More vitamins & minerals than
Zero Sugar / Diet Soft Drinks 68* 74* 66* 60* 48 31* 57 84* 75* 73* 66 41*
Same vitamins & minerals than
Zero Sugar / Diet Soft Drinks 13 6* 11 18* 13 14 13 6* 9 10 12 15*
Less vitamins & minerals than Zero
Sugar / Diet Soft Drinks 8 6 6 4 3 4 15 4 6 5 5 8
Can’t Say 11* 14* 16* 18* 36* 51* 15 6* 9* 11* 17 36*
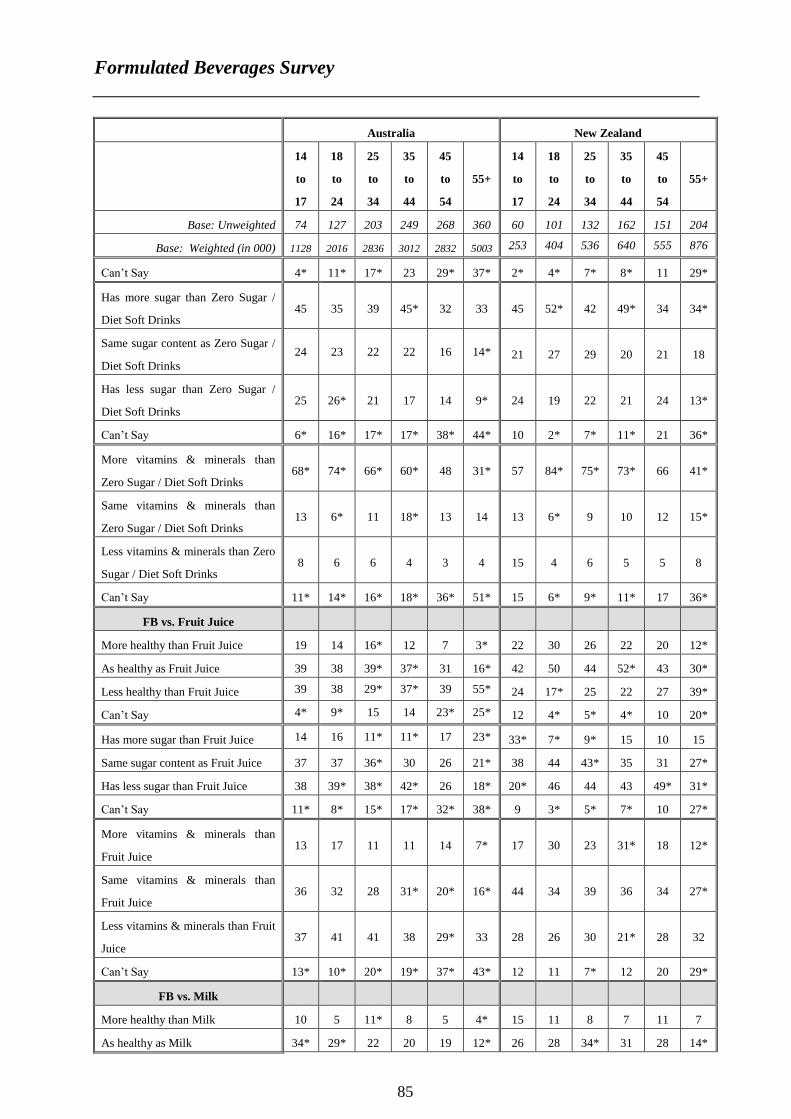
FB vs. Fruit Juice
More healthy than Fruit Juice 19 14 16* 12 7 3* 22 30 26 22 20 12*
As healthy as Fruit Juice 39 38 39* 37* 31 16* 42 50 44 52* 43 30*
Less healthy than Fruit Juice 39 38 29* 37* 39 55* 24 17* 25 22 27 39*
Can’t Say 4* 9* 15 14 23* 25* 12 4* 5* 4* 10 20*
Has more sugar than Fruit Juice 14 16 11* 11* 17 23* 33* 7* 9* 15 10 15
Same sugar content as Fruit Juice 37 37 36* 30 26 21* 38 44 43* 35 31 27*
Has less sugar than Fruit Juice 38 39* 38* 42* 26 18* 20* 46 44 43 49* 31*
Can’t Say 11* 8* 15* 17* 32* 38* 9 3* 5* 7* 10 27*
More vitamins & minerals than
Fruit Juice 13 17 11 11 14 7* 17 30 23 31* 18 12*
Same vitamins & minerals than
Fruit Juice 36 32 28 31* 20* 16* 44 34 39 36 34 27*
Less vitamins & minerals than Fruit
Juice 37 41 41 38 29* 33 28 26 30 21* 28 32
Can’t Say 13* 10* 20* 19* 37* 43* 12 11 7* 12 20 29*
FB vs. Milk
More healthy than Milk 10 5 11* 8 5 4* 15 11 8 7 11 7
As healthy as Milk 34* 29* 22 20 19 12* 26 28 34* 31 28 14*
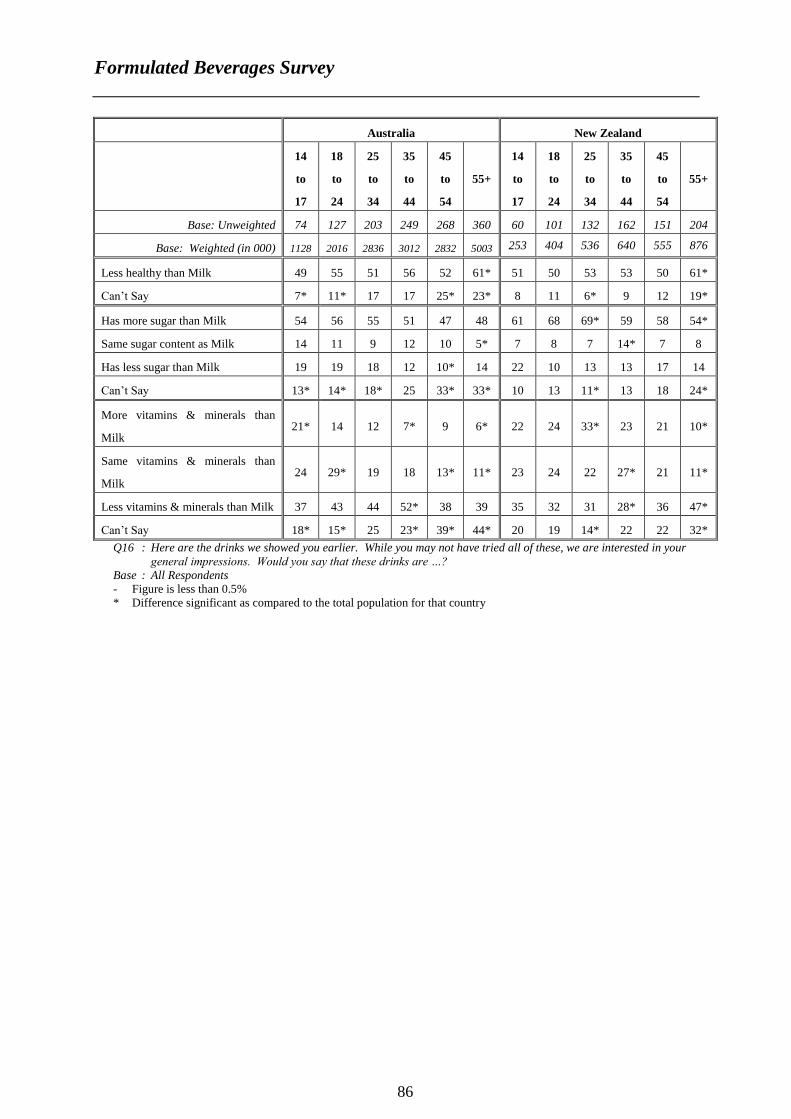
Formulated Beverages Survey
86
Australia New Zealand
14
to
17
18
to
24
25
to
34
35
to
44
45
to
54
55+
14
to
17
18
to
24
25
to
34
35
to
44
45
to
54
55+
Base: Unweighted 74 127 203 249 268 360 60 101 132 162 151 204
Base: Weighted (in 000) 1128 2016 2836 3012 2832 5003 253 404 536 640 555 876
Less healthy than Milk 49 55 51 56 52 61* 51 50 53 53 50 61*
Can’t Say 7* 11* 17 17 25* 23* 8 11 6* 9 12 19*
Has more sugar than Milk 54 56 55 51 47 48 61 68 69* 59 58 54*
Same sugar content as Milk 14 11 9 12 10 5* 7 8 7 14* 7 8
Has less sugar than Milk 19 19 18 12 10* 14 22 10 13 13 17 14
Can’t Say 13* 14* 18* 25 33* 33* 10 13 11* 13 18 24*
More vitamins & minerals than
Milk 21* 14 12 7* 9 6* 22 24 33* 23 21 10*
Same vitamins & minerals than
Milk 24 29* 19 18 13* 11* 23 24 22 27* 21 11*
Less vitamins & minerals than Milk 37 43 44 52* 38 39 35 32 31 28* 36 47*
Can’t Say 18* 15* 25 23* 39* 44* 20 19 14* 22 22 32*
Q16 : Here are the drinks we showed you earlier. While you may not have tried all of these, we are interested in your
general impressions. Would you say that these drinks are …?
Base : All Respondents - Figure is less than 0.5%
* Difference significant as compared to the total population for that country
87
APPENDIX ONE
TECHNICAL NOTES
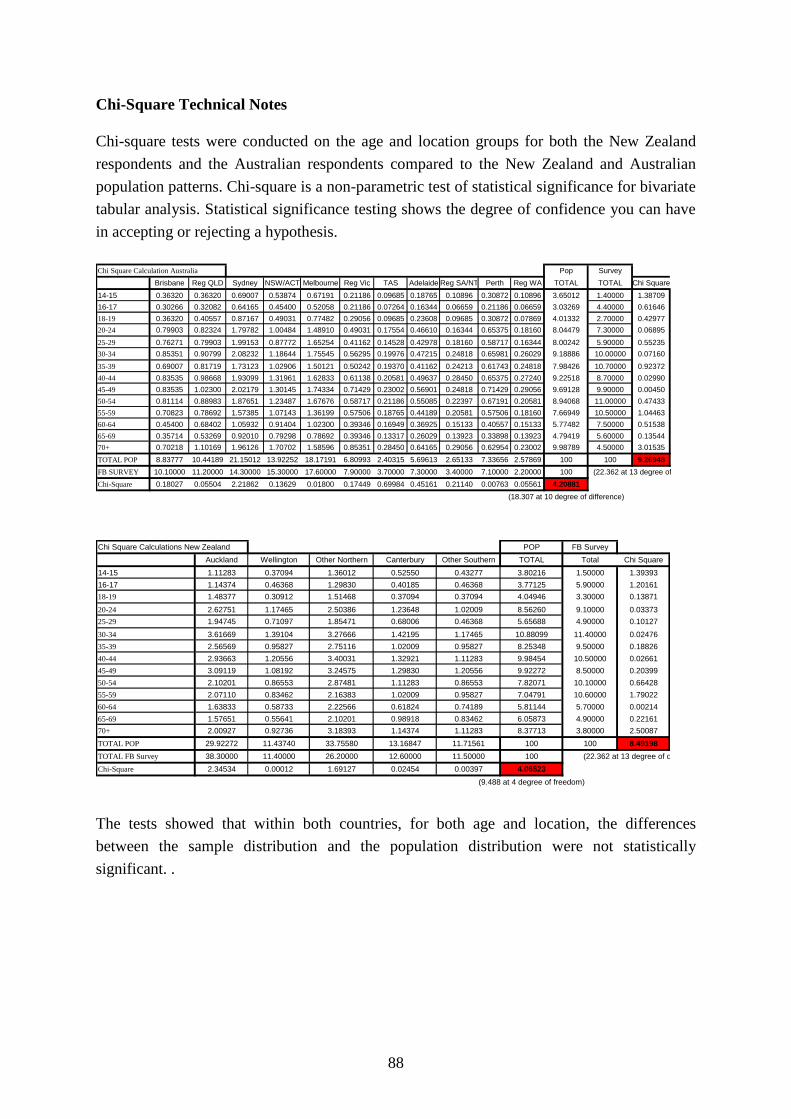
88
Chi-Square Technical Notes
Chi-square tests were conducted on the age and location groups for both the New Zealand
respondents and the Australian respondents compared to the New Zealand and Australian
population patterns. Chi-square is a non-parametric test of statistical significance for bivariate
tabular analysis. Statistical significance testing shows the degree of confidence you can have
in accepting or rejecting a hypothesis.
The tests showed that within both countries, for both age and location, the differences
between the sample distribution and the population distribution were not statistically
significant. .
Chi Square Calculation Australia Pop Survey
Brisbane Reg QLD Sydney NSW/ACT Melbourne Reg Vic TAS Adelaide Reg SA/NT Perth Reg WA TOTAL TOTAL Chi Square
14-15 0.36320 0.36320 0.69007 0.53874 0.67191 0.21186 0.09685 0.18765 0.10896 0.30872 0.10896 3.65012 1.40000 1.38709
16-17 0.30266 0.32082 0.64165 0.45400 0.52058 0.21186 0.07264 0.16344 0.06659 0.21186 0.06659 3.03269 4.40000 0.61646
18-19 0.36320 0.40557 0.87167 0.49031 0.77482 0.29056 0.09685 0.23608 0.09685 0.30872 0.07869 4.01332 2.70000 0.42977
20-24 0.79903 0.82324 1.79782 1.00484 1.48910 0.49031 0.17554 0.46610 0.16344 0.65375 0.18160 8.04479 7.30000 0.06895
25-29 0.76271 0.79903 1.99153 0.87772 1.65254 0.41162 0.14528 0.42978 0.18160 0.58717 0.16344 8.00242 5.90000 0.55235
30-34 0.85351 0.90799 2.08232 1.18644 1.75545 0.56295 0.19976 0.47215 0.24818 0.65981 0.26029 9.18886 10.00000 0.07160
35-39 0.69007 0.81719 1.73123 1.02906 1.50121 0.50242 0.19370 0.41162 0.24213 0.61743 0.24818 7.98426 10.70000 0.92372
40-44 0.83535 0.98668 1.93099 1.31961 1.62833 0.61138 0.20581 0.49637 0.28450 0.65375 0.27240 9.22518 8.70000 0.02990
45-49 0.83535 1.02300 2.02179 1.30145 1.74334 0.71429 0.23002 0.56901 0.24818 0.71429 0.29056 9.69128 9.90000 0.00450
50-54 0.81114 0.88983 1.87651 1.23487 1.67676 0.58717 0.21186 0.55085 0.22397 0.67191 0.20581 8.94068 11.00000 0.47433
55-59 0.70823 0.78692 1.57385 1.07143 1.36199 0.57506 0.18765 0.44189 0.20581 0.57506 0.18160 7.66949 10.50000 1.04463
60-64 0.45400 0.68402 1.05932 0.91404 1.02300 0.39346 0.16949 0.36925 0.15133 0.40557 0.15133 5.77482 7.50000 0.51538
65-69 0.35714 0.53269 0.92010 0.79298 0.78692 0.39346 0.13317 0.26029 0.13923 0.33898 0.13923 4.79419 5.60000 0.13544
70+ 0.70218 1.10169 1.96126 1.70702 1.58596 0.85351 0.28450 0.64165 0.29056 0.62954 0.23002 9.98789 4.50000 3.01535
TOTAL POP 8.83777 10.44189 21.15012 13.92252 18.17191 6.80993 2.40315 5.69613 2.65133 7.33656 2.57869 100 100 9.26948
FB SURVEY 10.10000 11.20000 14.30000 15.30000 17.60000 7.90000 3.70000 7.30000 3.40000 7.10000 2.20000 100 (22.362 at 13 degree of difference)
Chi-Square 0.18027 0.05504 2.21862 0.13629 0.01800 0.17449 0.69984 0.45161 0.21140 0.00763 0.05561 4.20881
(18.307 at 10 degree of difference)
Chi Square Calculations New Zealand POP FB Survey
Auckland Wellington Other Northern Canterbury Other Southern TOTAL Total Chi Square
14-15 1.11283 0.37094 1.36012 0.52550 0.43277 3.80216 1.50000 1.39393
16-17 1.14374 0.46368 1.29830 0.40185 0.46368 3.77125 5.90000 1.20161
18-19 1.48377 0.30912 1.51468 0.37094 0.37094 4.04946 3.30000 0.13871
20-24 2.62751 1.17465 2.50386 1.23648 1.02009 8.56260 9.10000 0.03373
25-29 1.94745 0.71097 1.85471 0.68006 0.46368 5.65688 4.90000 0.10127
30-34 3.61669 1.39104 3.27666 1.42195 1.17465 10.88099 11.40000 0.02476
35-39 2.56569 0.95827 2.75116 1.02009 0.95827 8.25348 9.50000 0.18826
40-44 2.93663 1.20556 3.40031 1.32921 1.11283 9.98454 10.50000 0.02661
45-49 3.09119 1.08192 3.24575 1.29830 1.20556 9.92272 8.50000 0.20399
50-54 2.10201 0.86553 2.87481 1.11283 0.86553 7.82071 10.10000 0.66428
55-59 2.07110 0.83462 2.16383 1.02009 0.95827 7.04791 10.60000 1.79022
60-64 1.63833 0.58733 2.22566 0.61824 0.74189 5.81144 5.70000 0.00214
65-69 1.57651 0.55641 2.10201 0.98918 0.83462 6.05873 4.90000 0.22161
70+ 2.00927 0.92736 3.18393 1.14374 1.11283 8.37713 3.80000 2.50087
TOTAL POP 29.92272 11.43740 33.75580 13.16847 11.71561 100 100 8.49198
TOTAL FB Survey 38.30000 11.40000 26.20000 12.60000 11.50000 100 (22.362 at 13 degree of difference)
Chi-Square 2.34534 0.00012 1.69127 0.02454 0.00397 4.06523
(9.488 at 4 degree of freedom)

89
Significance Testing Technical Notes
Statistical significance testing of the survey results has been conducted for individual cells
within each country and between the two countries. Individual cells were compared with
corresponding row totals for significance testing within each country. For significance testing
between the two countries, individual cells from Australia were compared with corresponding
cells from New Zealand.
Significance tests were conducted at the 95 percent confidence level using a two-tailed test. If
significance occurs at the 95 percent significance level, it means that there is less than a 5
percent probability that a difference occurred by chance. The test applied is a simple large-
sample two-tailed z-test. In the case of proportions this is equivalent to a 2×2 c² (chi-squared)
test. Each cell was tested independently, which ensures consistency of testing.
90
APPENDIX TWO
FINAL QUESTIONNAIRE
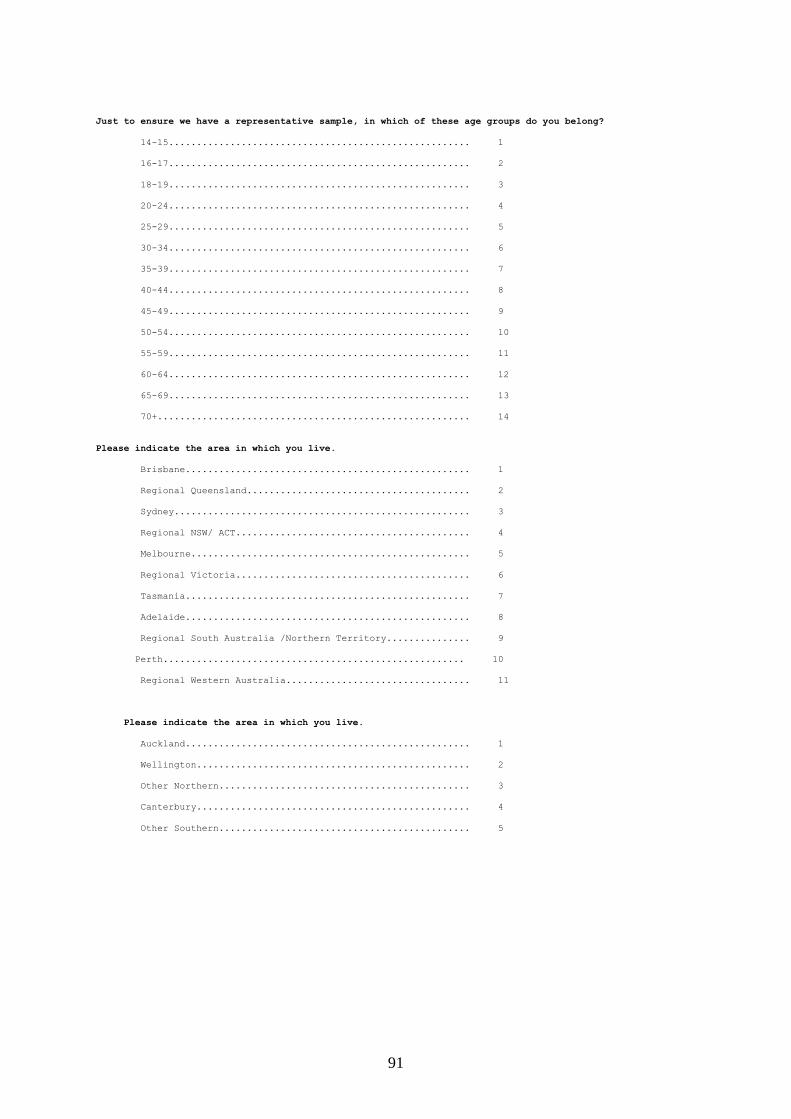
91
Just to ensure we have a representative sample, in which of these age groups do you belong?
14-15...................................................... 1
16-17...................................................... 2
18-19...................................................... 3
20-24...................................................... 4
25-29...................................................... 5
30-34...................................................... 6
35-39...................................................... 7
40-44...................................................... 8
45-49...................................................... 9
50-54...................................................... 10
55-59...................................................... 11
60-64...................................................... 12
65-69...................................................... 13
70+........................................................ 14
Please indicate the area in which you live.
Brisbane................................................... 1
Regional Queensland........................................ 2
Sydney..................................................... 3
Regional NSW/ ACT.......................................... 4
Melbourne.................................................. 5
Regional Victoria.......................................... 6
Tasmania................................................... 7
Adelaide................................................... 8
Regional South Australia /Northern Territory............... 9
Perth...................................................... 10
Regional Western Australia................................. 11
Please indicate the area in which you live.
Auckland................................................... 1
Wellington................................................. 2
Other Northern............................................. 3
Canterbury................................................. 4
Other Southern............................................. 5
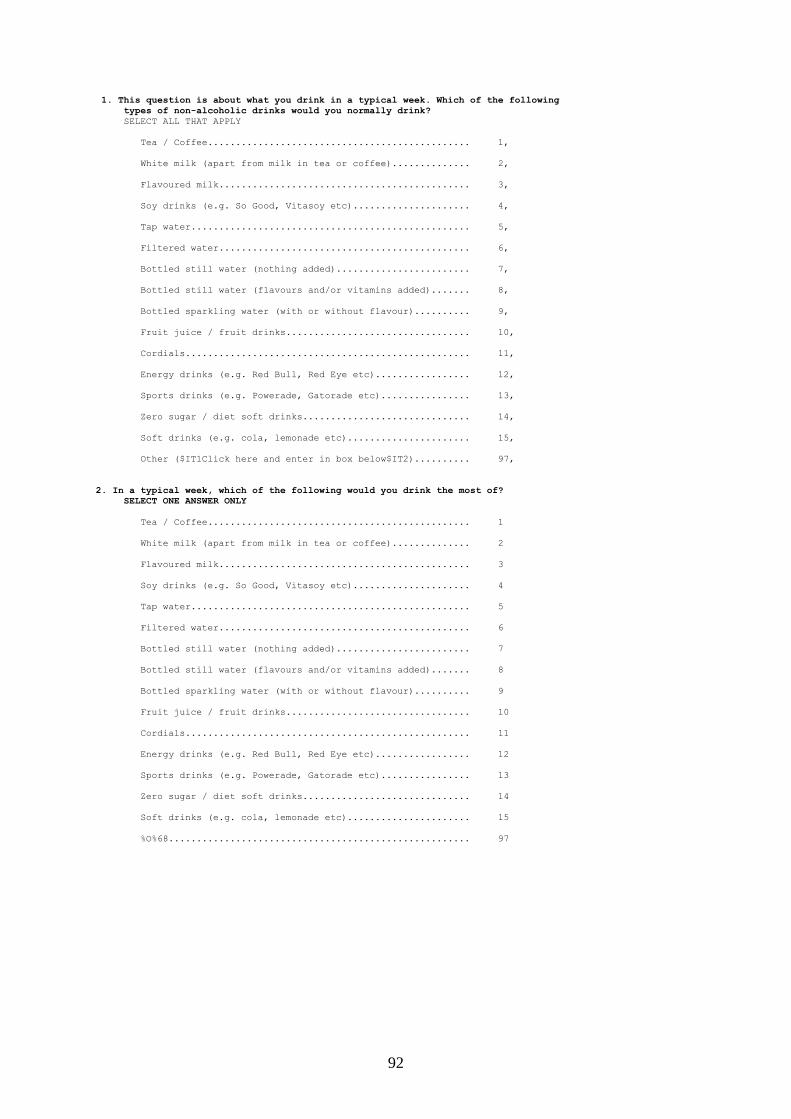
92
1. This question is about what you drink in a typical week. Which of the following
types of non-alcoholic drinks would you normally drink?
SELECT ALL THAT APPLY
Tea / Coffee............................................... 1,
White milk (apart from milk in tea or coffee).............. 2,
Flavoured milk............................................. 3,
Soy drinks (e.g. So Good, Vitasoy etc)..................... 4,
Tap water.................................................. 5,
Filtered water............................................. 6,
Bottled still water (nothing added)........................ 7,
Bottled still water (flavours and/or vitamins added)....... 8,
Bottled sparkling water (with or without flavour).......... 9,
Fruit juice / fruit drinks................................. 10,
Cordials................................................... 11,
Energy drinks (e.g. Red Bull, Red Eye etc)................. 12,
Sports drinks (e.g. Powerade, Gatorade etc)................ 13,
Zero sugar / diet soft drinks.............................. 14,
Soft drinks (e.g. cola, lemonade etc)...................... 15,
Other ($IT1Click here and enter in box below$IT2).......... 97,
2. In a typical week, which of the following would you drink the most of?
SELECT ONE ANSWER ONLY
Tea / Coffee............................................... 1
White milk (apart from milk in tea or coffee).............. 2
Flavoured milk............................................. 3
Soy drinks (e.g. So Good, Vitasoy etc)..................... 4
Tap water.................................................. 5
Filtered water............................................. 6
Bottled still water (nothing added)........................ 7
Bottled still water (flavours and/or vitamins added)....... 8
Bottled sparkling water (with or without flavour).......... 9
Fruit juice / fruit drinks................................. 10
Cordials................................................... 11
Energy drinks (e.g. Red Bull, Red Eye etc)................. 12
Sports drinks (e.g. Powerade, Gatorade etc)................ 13
Zero sugar / diet soft drinks.............................. 14
Soft drinks (e.g. cola, lemonade etc)...................... 15
%O%68...................................................... 97
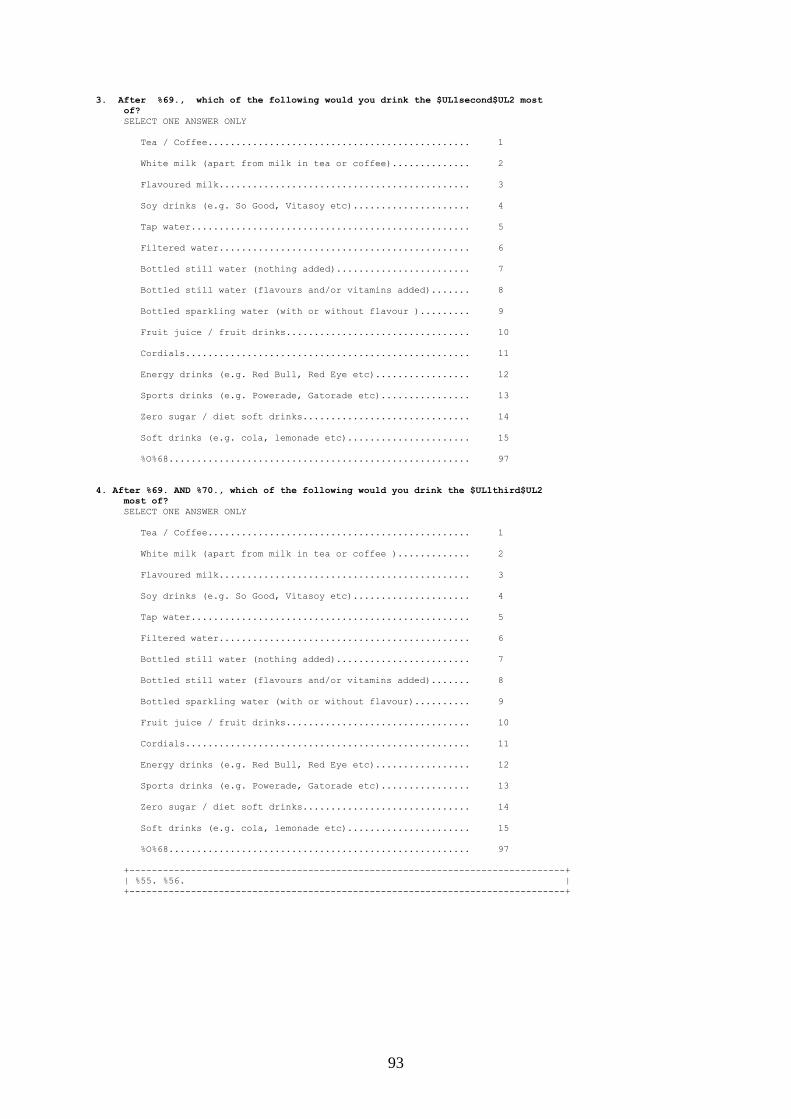
93
3. After %69., which of the following would you drink the $UL1second$UL2 most
of?
SELECT ONE ANSWER ONLY
Tea / Coffee............................................... 1
White milk (apart from milk in tea or coffee).............. 2
Flavoured milk............................................. 3
Soy drinks (e.g. So Good, Vitasoy etc)..................... 4
Tap water.................................................. 5
Filtered water............................................. 6
Bottled still water (nothing added)........................ 7
Bottled still water (flavours and/or vitamins added)....... 8
Bottled sparkling water (with or without flavour )......... 9
Fruit juice / fruit drinks................................. 10
Cordials................................................... 11
Energy drinks (e.g. Red Bull, Red Eye etc)................. 12
Sports drinks (e.g. Powerade, Gatorade etc)................ 13
Zero sugar / diet soft drinks.............................. 14
Soft drinks (e.g. cola, lemonade etc)...................... 15
%O%68...................................................... 97
4. After %69. AND %70., which of the following would you drink the $UL1third$UL2
most of?
SELECT ONE ANSWER ONLY
Tea / Coffee............................................... 1
White milk (apart from milk in tea or coffee )............. 2
Flavoured milk............................................. 3
Soy drinks (e.g. So Good, Vitasoy etc)..................... 4
Tap water.................................................. 5
Filtered water............................................. 6
Bottled still water (nothing added)........................ 7
Bottled still water (flavours and/or vitamins added)....... 8
Bottled sparkling water (with or without flavour).......... 9
Fruit juice / fruit drinks................................. 10
Cordials................................................... 11
Energy drinks (e.g. Red Bull, Red Eye etc)................. 12
Sports drinks (e.g. Powerade, Gatorade etc)................ 13
Zero sugar / diet soft drinks.............................. 14
Soft drinks (e.g. cola, lemonade etc)...................... 15
%O%68...................................................... 97
+------------------------------------------------------------------------------+
| %55. %56. |
+------------------------------------------------------------------------------+

94
5. New types of non-alcoholic water based beverages are now becoming more
common. From the following please select all the drinks you have tried in the
last 12 months ...
SELECT ALL THAT APPLY
Mizone
........................................................... 1,
G Force
........................................................... 2,
Thorpedo
........................................................... 3,
Play
........................................................... 4,
Temple
Hydrotherapy
........................................................... 5,
Waterplus
........................................................... 6,
Aquashot
........................................................... 7,
E2
........................................................... 8,
Charlies
Sportswater
........................................................... 9,
None of these
........................................................... 10,
%58.
6. You have tried %73. %74. .
How often do you drink %329,/these drinks (in total)/ this drink/ ?
Not a regular drinker, only tried them once or twice....... 1
Once every few months...................................... 2
Once a month............................................... 3
Once a fortnight........................................... 4
Once a week................................................ 5
Once every three or four days.............................. 6
Every second day........................................... 7
Once a day................................................. 8
Several times a day........................................ 9
Other ($IT1Click here and enter in box below$IT2).......... 97
Has tried multiple drinks at q3, ask:
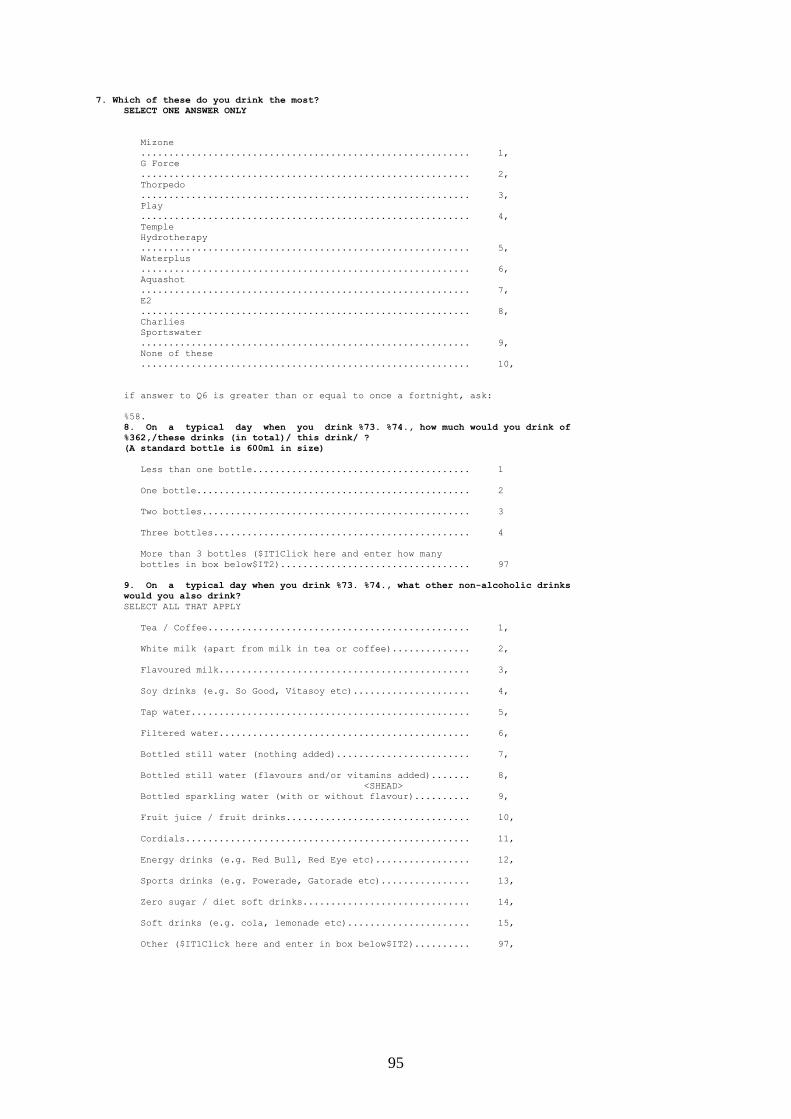
95
7. Which of these do you drink the most?
SELECT ONE ANSWER ONLY
Mizone
........................................................... 1,
G Force
........................................................... 2,
Thorpedo
........................................................... 3,
Play
........................................................... 4,
Temple
Hydrotherapy
........................................................... 5,
Waterplus
........................................................... 6,
Aquashot
........................................................... 7,
E2
........................................................... 8,
Charlies
Sportswater
........................................................... 9,
None of these
........................................................... 10,
if answer to Q6 is greater than or equal to once a fortnight, ask:
%58.
8. On a typical day when you drink %73. %74., how much would you drink of
%362,/these drinks (in total)/ this drink/ ?
(A standard bottle is 600ml in size)
Less than one bottle....................................... 1
One bottle................................................. 2
Two bottles................................................ 3
Three bottles.............................................. 4
More than 3 bottles ($IT1Click here and enter how many
bottles in box below$IT2).................................. 97
9. On a typical day when you drink %73. %74., what other non-alcoholic drinks
would you also drink?
SELECT ALL THAT APPLY
Tea / Coffee............................................... 1,
White milk (apart from milk in tea or coffee).............. 2,
Flavoured milk............................................. 3,
Soy drinks (e.g. So Good, Vitasoy etc)..................... 4,
Tap water.................................................. 5,
Filtered water............................................. 6,
Bottled still water (nothing added)........................ 7,
Bottled still water (flavours and/or vitamins added)....... 8,
<SHEAD>
Bottled sparkling water (with or without flavour).......... 9,
Fruit juice / fruit drinks................................. 10,
Cordials................................................... 11,
Energy drinks (e.g. Red Bull, Red Eye etc)................. 12,
Sports drinks (e.g. Powerade, Gatorade etc)................ 13,
Zero sugar / diet soft drinks.............................. 14,
Soft drinks (e.g. cola, lemonade etc)...................... 15,
Other ($IT1Click here and enter in box below$IT2).......... 97,
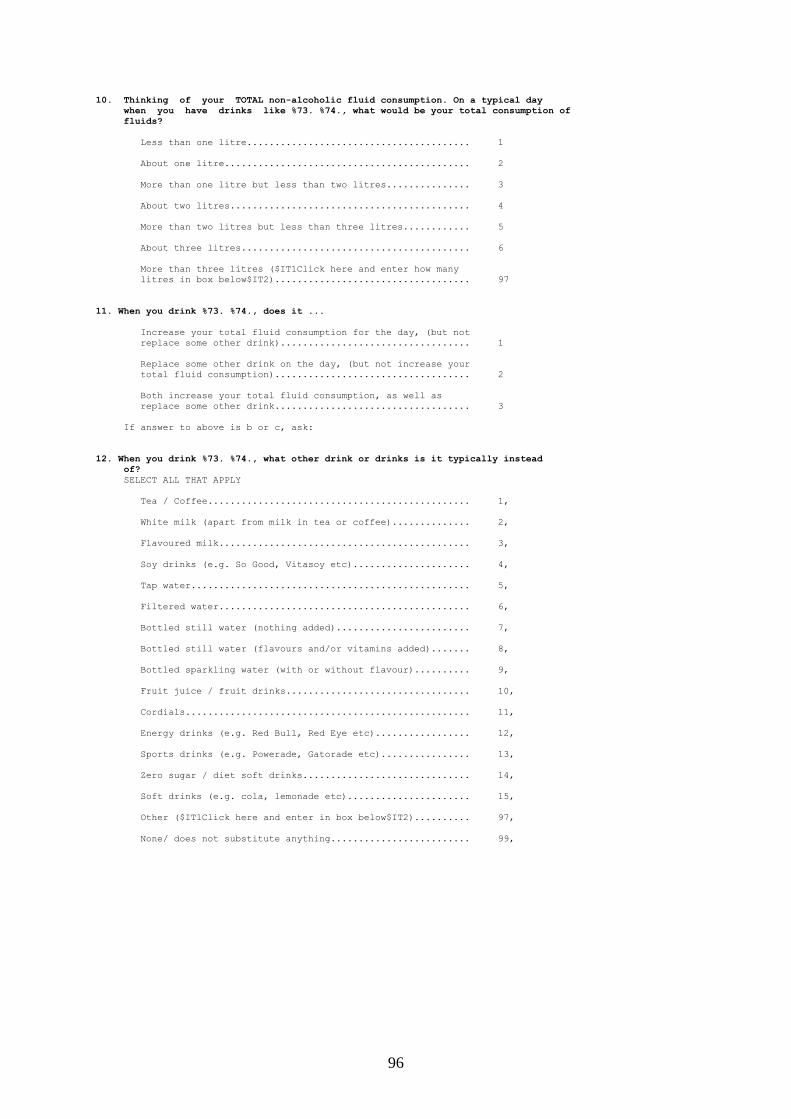
96
10. Thinking of your TOTAL non-alcoholic fluid consumption. On a typical day
when you have drinks like %73. %74., what would be your total consumption of
fluids?
Less than one litre........................................ 1
About one litre............................................ 2
More than one litre but less than two litres............... 3
About two litres........................................... 4
More than two litres but less than three litres............ 5
About three litres......................................... 6
More than three litres ($IT1Click here and enter how many
litres in box below$IT2)................................... 97
11. When you drink %73. %74., does it ...
Increase your total fluid consumption for the day, (but not
replace some other drink).................................. 1
Replace some other drink on the day, (but not increase your
total fluid consumption)................................... 2
Both increase your total fluid consumption, as well as
replace some other drink................................... 3
If answer to above is b or c, ask:
12. When you drink %73. %74., what other drink or drinks is it typically instead
of?
SELECT ALL THAT APPLY
Tea / Coffee............................................... 1,
White milk (apart from milk in tea or coffee).............. 2,
Flavoured milk............................................. 3,
Soy drinks (e.g. So Good, Vitasoy etc)..................... 4,
Tap water.................................................. 5,
Filtered water............................................. 6,
Bottled still water (nothing added)........................ 7,
Bottled still water (flavours and/or vitamins added)....... 8,
Bottled sparkling water (with or without flavour).......... 9,
Fruit juice / fruit drinks................................. 10,
Cordials................................................... 11,
Energy drinks (e.g. Red Bull, Red Eye etc)................. 12,
Sports drinks (e.g. Powerade, Gatorade etc)................ 13,
Zero sugar / diet soft drinks.............................. 14,
Soft drinks (e.g. cola, lemonade etc)...................... 15,
Other ($IT1Click here and enter in box below$IT2).......... 97,
None/ does not substitute anything......................... 99,
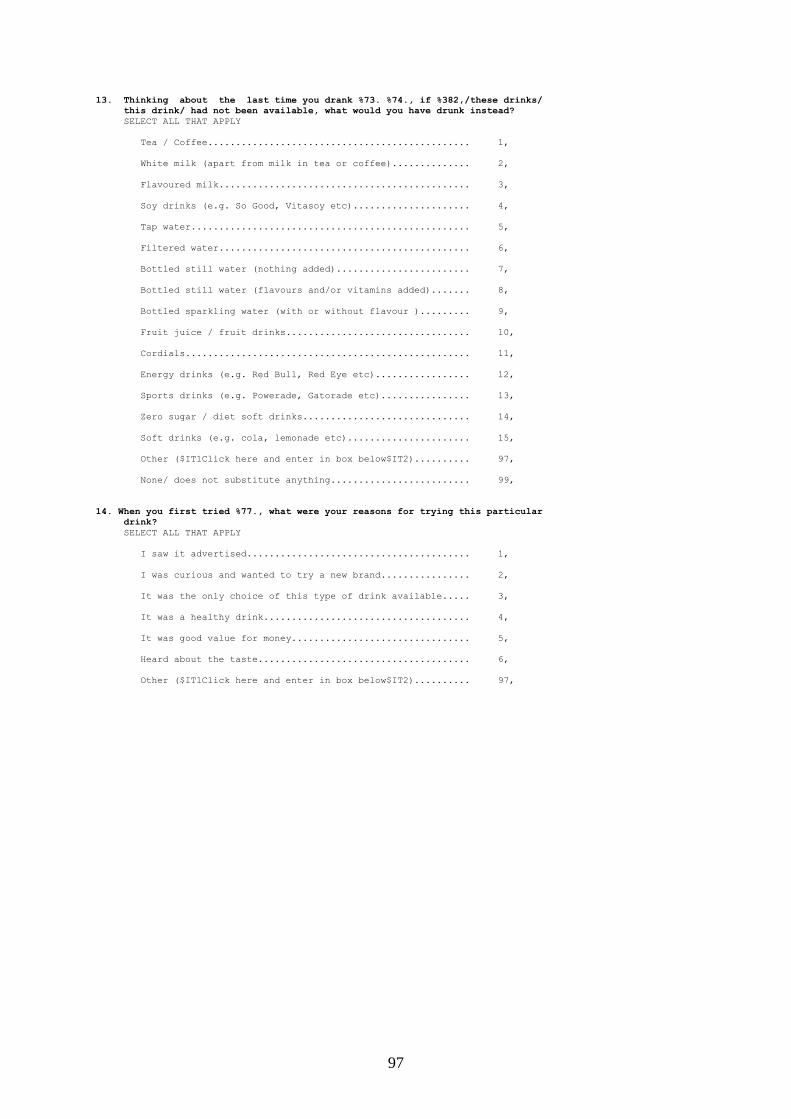
97
13. Thinking about the last time you drank %73. %74., if %382,/these drinks/
this drink/ had not been available, what would you have drunk instead?
SELECT ALL THAT APPLY
Tea / Coffee............................................... 1,
White milk (apart from milk in tea or coffee).............. 2,
Flavoured milk............................................. 3,
Soy drinks (e.g. So Good, Vitasoy etc)..................... 4,
Tap water.................................................. 5,
Filtered water............................................. 6,
Bottled still water (nothing added)........................ 7,
Bottled still water (flavours and/or vitamins added)....... 8,
Bottled sparkling water (with or without flavour )......... 9,
Fruit juice / fruit drinks................................. 10,
Cordials................................................... 11,
Energy drinks (e.g. Red Bull, Red Eye etc)................. 12,
Sports drinks (e.g. Powerade, Gatorade etc)................ 13,
Zero sugar / diet soft drinks.............................. 14,
Soft drinks (e.g. cola, lemonade etc)...................... 15,
Other ($IT1Click here and enter in box below$IT2).......... 97,
None/ does not substitute anything......................... 99,
14. When you first tried %77., what were your reasons for trying this particular
drink?
SELECT ALL THAT APPLY
I saw it advertised........................................ 1,
I was curious and wanted to try a new brand................ 2,
It was the only choice of this type of drink available..... 3,
It was a healthy drink..................................... 4,
It was good value for money................................ 5,
Heard about the taste...................................... 6,
Other ($IT1Click here and enter in box below$IT2).......... 97,
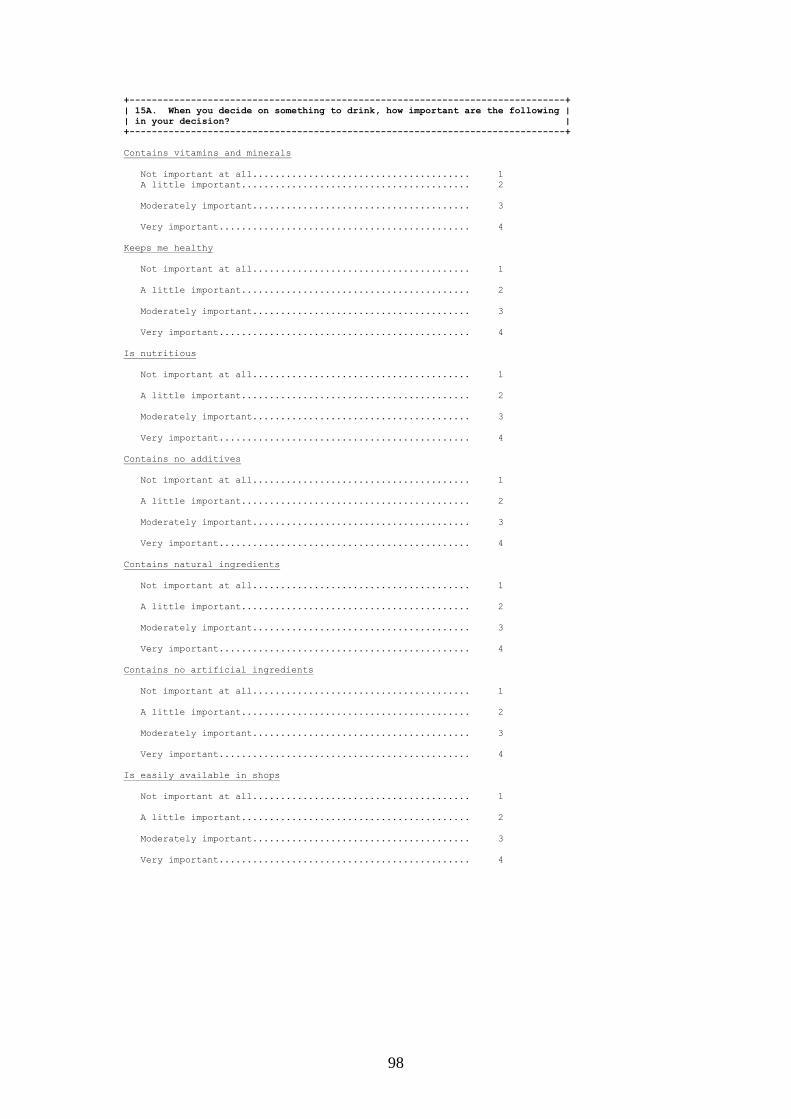
98
+------------------------------------------------------------------------------+
| 15A. When you decide on something to drink, how important are the following |
| in your decision? |
+------------------------------------------------------------------------------+
Contains vitamins and minerals
Not important at all....................................... 1
A little important......................................... 2
Moderately important....................................... 3
Very important............................................. 4
Keeps me healthy
Not important at all....................................... 1
A little important......................................... 2
Moderately important....................................... 3
Very important............................................. 4
Is nutritious
Not important at all....................................... 1
A little important......................................... 2
Moderately important....................................... 3
Very important............................................. 4
Contains no additives
Not important at all....................................... 1
A little important......................................... 2
Moderately important....................................... 3
Very important............................................. 4
Contains natural ingredients
Not important at all....................................... 1
A little important......................................... 2
Moderately important....................................... 3
Very important............................................. 4
Contains no artificial ingredients
Not important at all....................................... 1
A little important......................................... 2
Moderately important....................................... 3
Very important............................................. 4
Is easily available in shops
Not important at all....................................... 1
A little important......................................... 2
Moderately important....................................... 3
Very important............................................. 4
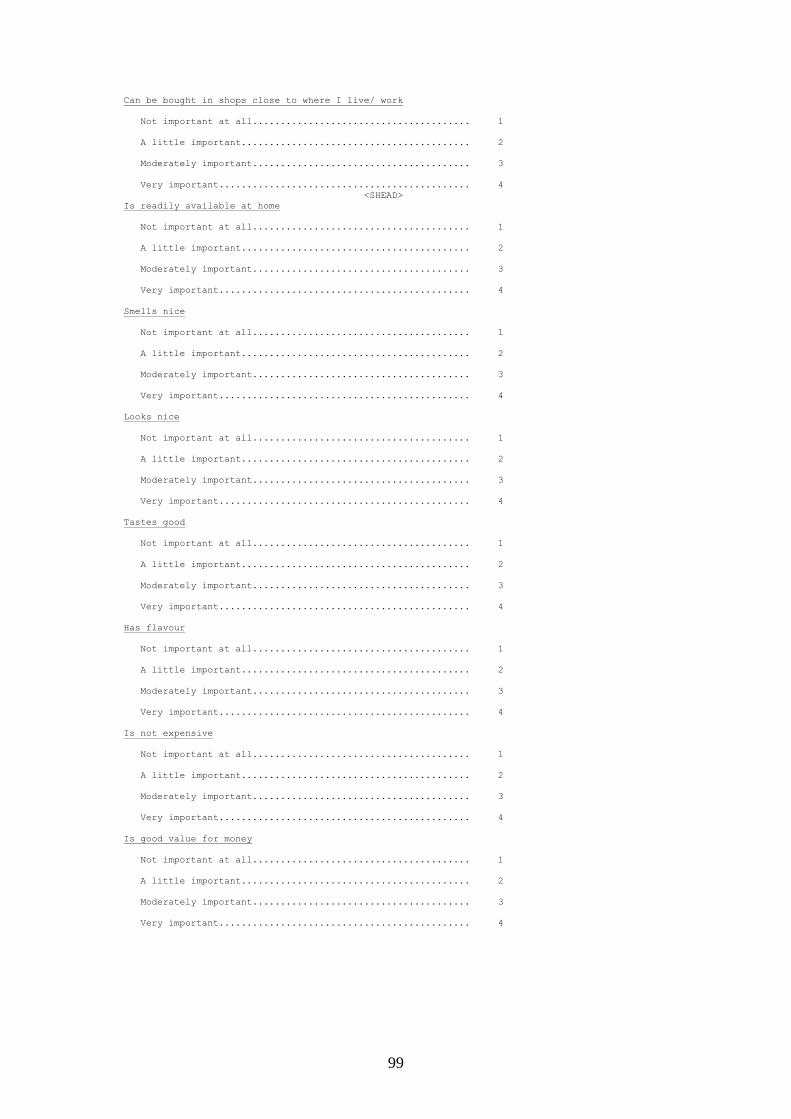
99
Can be bought in shops close to where I live/ work
Not important at all....................................... 1
A little important......................................... 2
Moderately important....................................... 3
Very important............................................. 4
<SHEAD>
Is readily available at home
Not important at all....................................... 1
A little important......................................... 2
Moderately important....................................... 3
Very important............................................. 4
Smells nice
Not important at all....................................... 1
A little important......................................... 2
Moderately important....................................... 3
Very important............................................. 4
Looks nice
Not important at all....................................... 1
A little important......................................... 2
Moderately important....................................... 3
Very important............................................. 4
Tastes good
Not important at all....................................... 1
A little important......................................... 2
Moderately important....................................... 3
Very important............................................. 4
Has flavour
Not important at all....................................... 1
A little important......................................... 2
Moderately important....................................... 3
Very important............................................. 4
Is not expensive
Not important at all....................................... 1
A little important......................................... 2
Moderately important....................................... 3
Very important............................................. 4
Is good value for money
Not important at all....................................... 1
A little important......................................... 2
Moderately important....................................... 3
Very important............................................. 4
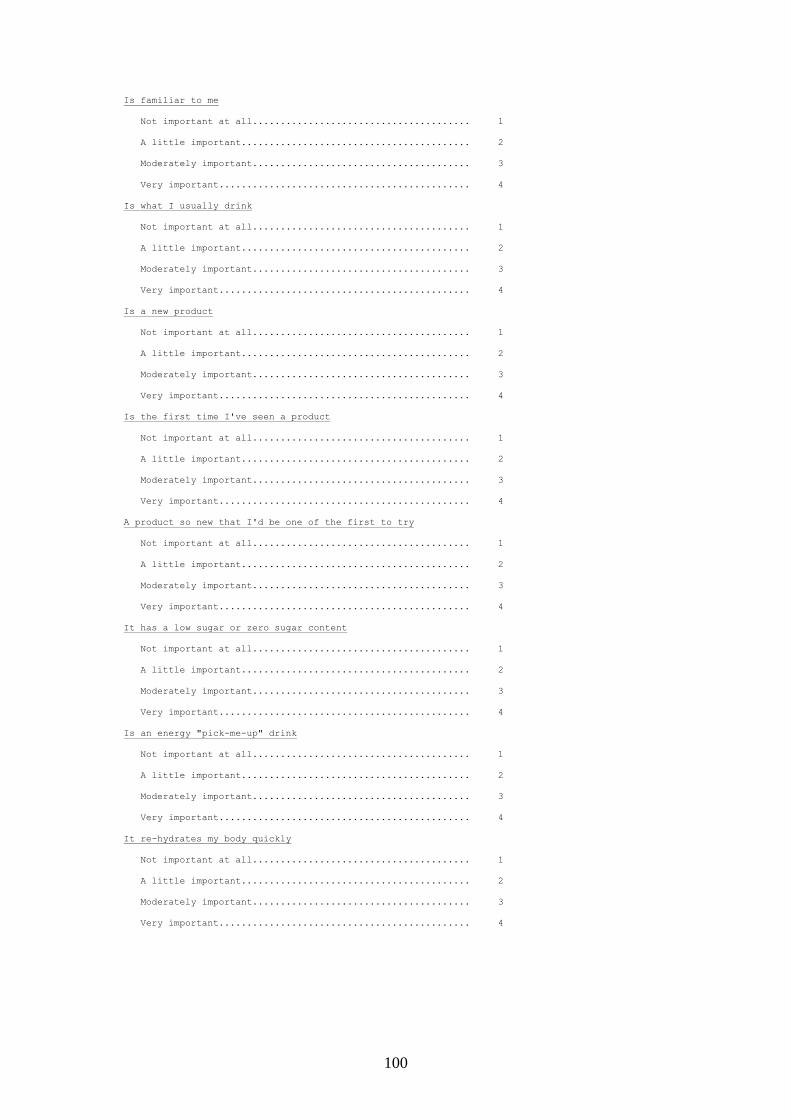
100
Is familiar to me
Not important at all....................................... 1
A little important......................................... 2
Moderately important....................................... 3
Very important............................................. 4
Is what I usually drink
Not important at all....................................... 1
A little important......................................... 2
Moderately important....................................... 3
Very important............................................. 4
Is a new product
Not important at all....................................... 1
A little important......................................... 2
Moderately important....................................... 3
Very important............................................. 4
Is the first time I've seen a product
Not important at all....................................... 1
A little important......................................... 2
Moderately important....................................... 3
Very important............................................. 4
A product so new that I'd be one of the first to try
Not important at all....................................... 1
A little important......................................... 2
Moderately important....................................... 3
Very important............................................. 4
It has a low sugar or zero sugar content
Not important at all....................................... 1
A little important......................................... 2
Moderately important....................................... 3
Very important............................................. 4
Is an energy "pick-me-up" drink
Not important at all....................................... 1
A little important......................................... 2
Moderately important....................................... 3
Very important............................................. 4
It re-hydrates my body quickly
Not important at all....................................... 1
A little important......................................... 2
Moderately important....................................... 3
Very important............................................. 4
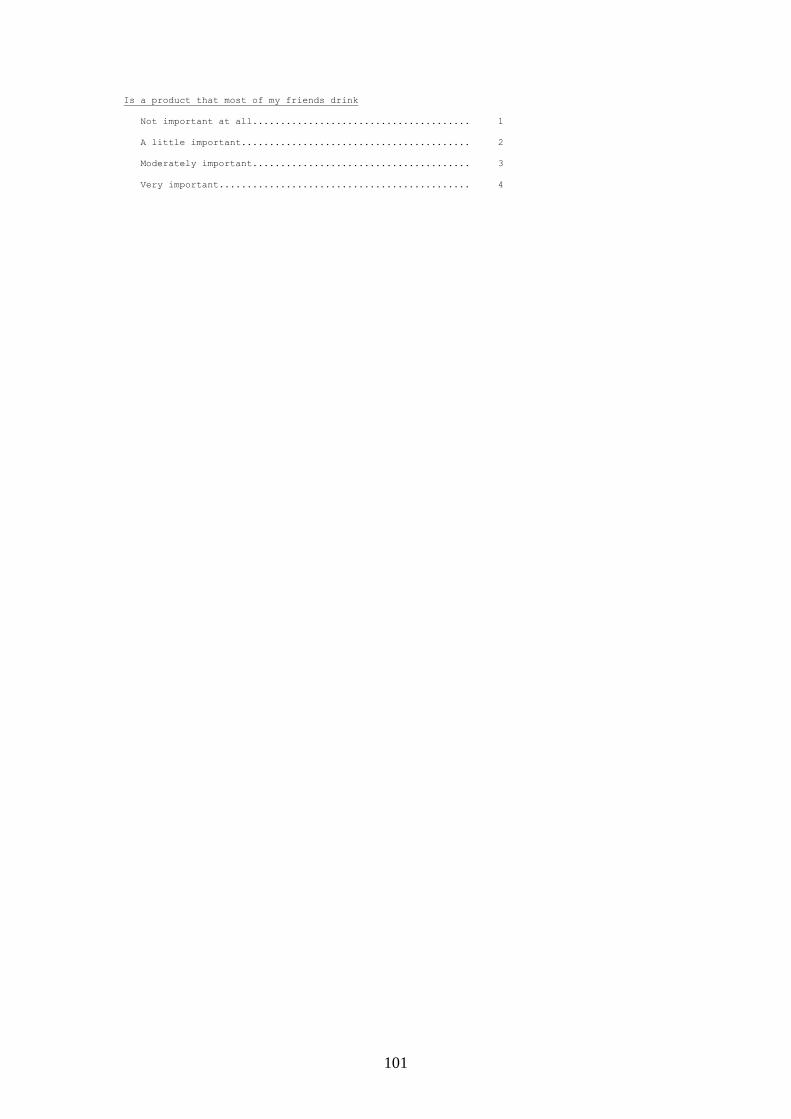
101
Is a product that most of my friends drink
Not important at all....................................... 1
A little important......................................... 2
Moderately important....................................... 3
Very important............................................. 4
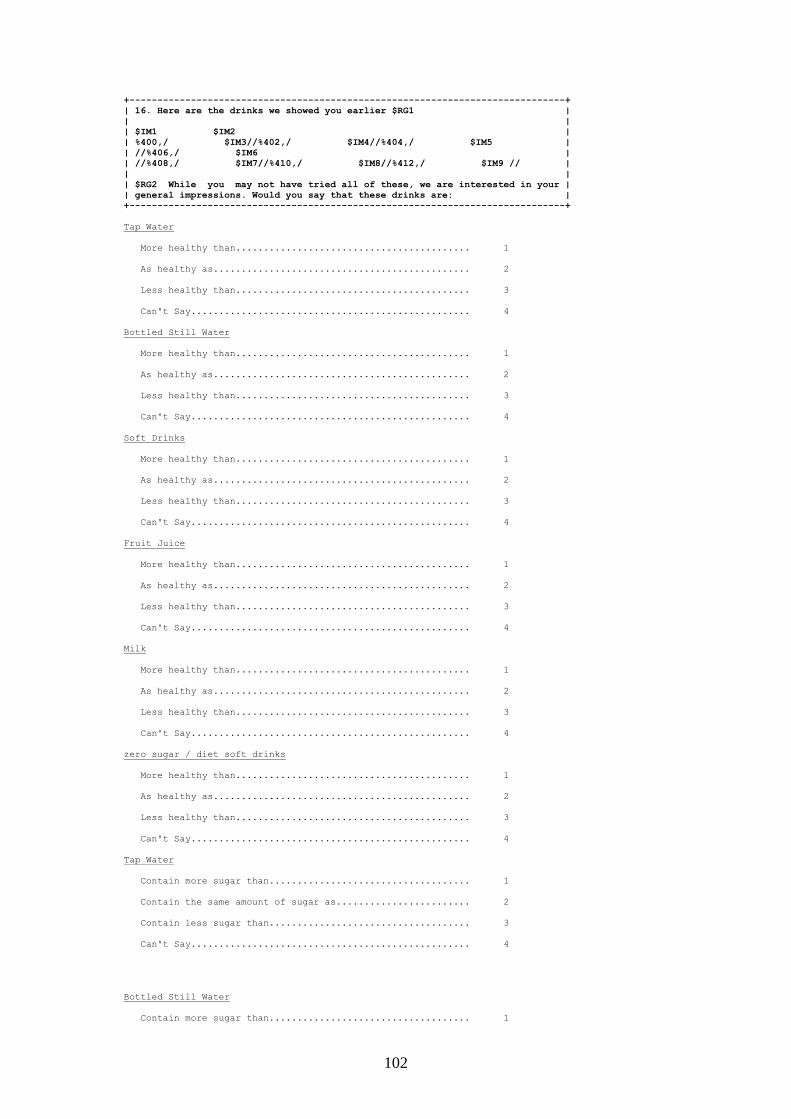
102
+------------------------------------------------------------------------------+
| 16. Here are the drinks we showed you earlier $RG1 |
| |
| $IM1 $IM2 |
| %400,/ $IM3//%402,/ $IM4//%404,/ $IM5 |
| //%406,/ $IM6 |
| //%408,/ $IM7//%410,/ $IM8//%412,/ $IM9 // |
| |
| $RG2 While you may not have tried all of these, we are interested in your |
| general impressions. Would you say that these drinks are: |
+------------------------------------------------------------------------------+
Tap Water
More healthy than.......................................... 1
As healthy as.............................................. 2
Less healthy than.......................................... 3
Can't Say.................................................. 4
Bottled Still Water
More healthy than.......................................... 1
As healthy as.............................................. 2
Less healthy than.......................................... 3
Can't Say.................................................. 4
Soft Drinks
More healthy than.......................................... 1
As healthy as.............................................. 2
Less healthy than.......................................... 3
Can't Say.................................................. 4
Fruit Juice
More healthy than.......................................... 1
As healthy as.............................................. 2
Less healthy than.......................................... 3
Can't Say.................................................. 4
Milk
More healthy than.......................................... 1
As healthy as.............................................. 2
Less healthy than.......................................... 3
Can't Say.................................................. 4
zero sugar / diet soft drinks
More healthy than.......................................... 1
As healthy as.............................................. 2
Less healthy than.......................................... 3
Can't Say.................................................. 4
Tap Water
Contain more sugar than.................................... 1
Contain the same amount of sugar as........................ 2
Contain less sugar than.................................... 3
Can't Say.................................................. 4
Bottled Still Water
Contain more sugar than.................................... 1
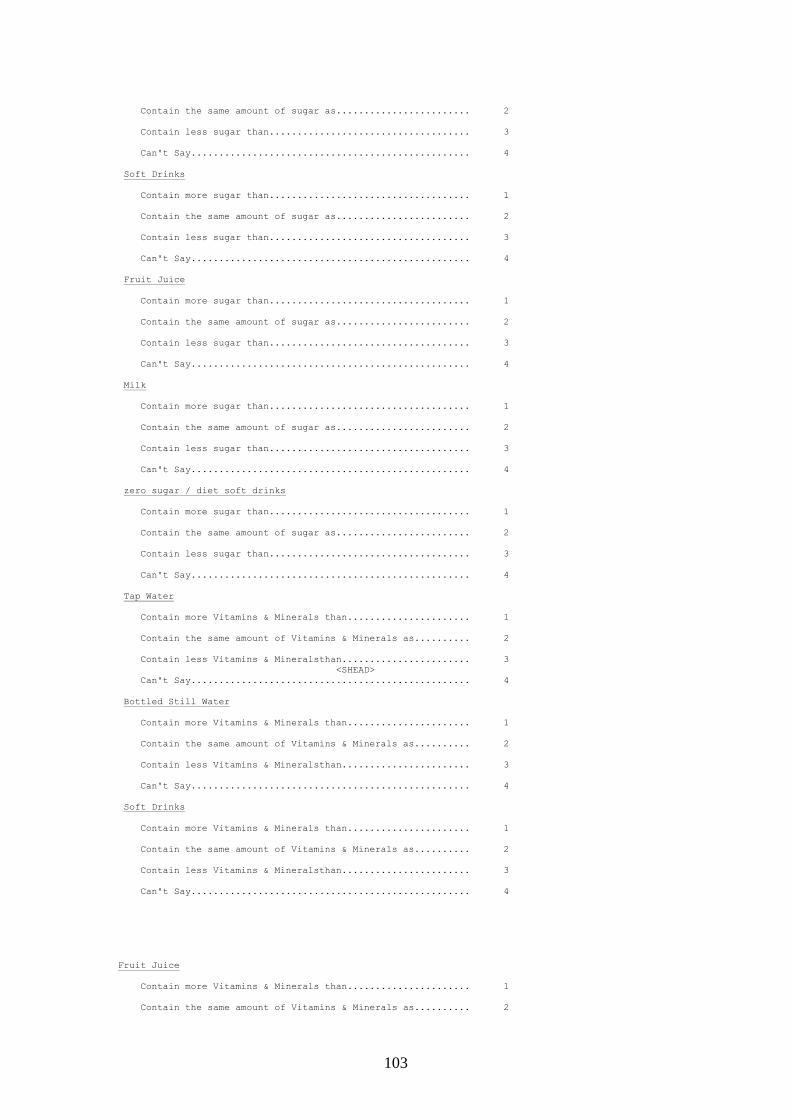
103
Contain the same amount of sugar as........................ 2
Contain less sugar than.................................... 3
Can't Say.................................................. 4
Soft Drinks
Contain more sugar than.................................... 1
Contain the same amount of sugar as........................ 2
Contain less sugar than.................................... 3
Can't Say.................................................. 4
Fruit Juice
Contain more sugar than.................................... 1
Contain the same amount of sugar as........................ 2
Contain less sugar than.................................... 3
Can't Say.................................................. 4
Milk
Contain more sugar than.................................... 1
Contain the same amount of sugar as........................ 2
Contain less sugar than.................................... 3
Can't Say.................................................. 4
zero sugar / diet soft drinks
Contain more sugar than.................................... 1
Contain the same amount of sugar as........................ 2
Contain less sugar than.................................... 3
Can't Say.................................................. 4
Tap Water
Contain more Vitamins & Minerals than...................... 1
Contain the same amount of Vitamins & Minerals as.......... 2
Contain less Vitamins & Mineralsthan....................... 3
<SHEAD>
Can't Say.................................................. 4
Bottled Still Water
Contain more Vitamins & Minerals than...................... 1
Contain the same amount of Vitamins & Minerals as.......... 2
Contain less Vitamins & Mineralsthan....................... 3
Can't Say.................................................. 4
Soft Drinks
Contain more Vitamins & Minerals than...................... 1
Contain the same amount of Vitamins & Minerals as.......... 2
Contain less Vitamins & Mineralsthan....................... 3
Can't Say.................................................. 4
Fruit Juice
Contain more Vitamins & Minerals than...................... 1
Contain the same amount of Vitamins & Minerals as.......... 2
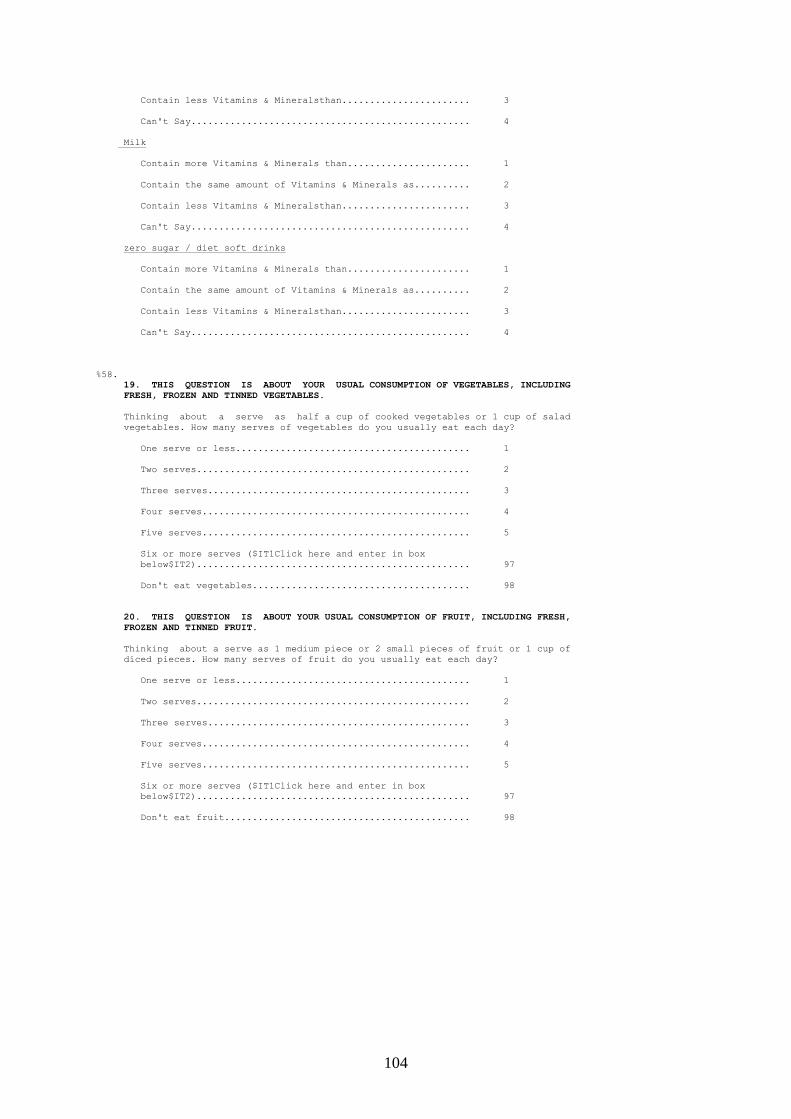
104
Contain less Vitamins & Mineralsthan....................... 3
Can't Say.................................................. 4
Milk
Contain more Vitamins & Minerals than...................... 1
Contain the same amount of Vitamins & Minerals as.......... 2
Contain less Vitamins & Mineralsthan....................... 3
Can't Say.................................................. 4
zero sugar / diet soft drinks
Contain more Vitamins & Minerals than...................... 1
Contain the same amount of Vitamins & Minerals as.......... 2
Contain less Vitamins & Mineralsthan....................... 3
Can't Say.................................................. 4
%58.
19. THIS QUESTION IS ABOUT YOUR USUAL CONSUMPTION OF VEGETABLES, INCLUDING
FRESH, FROZEN AND TINNED VEGETABLES.
Thinking about a serve as half a cup of cooked vegetables or 1 cup of salad
vegetables. How many serves of vegetables do you usually eat each day?
One serve or less.......................................... 1
Two serves................................................. 2
Three serves............................................... 3
Four serves................................................ 4
Five serves................................................ 5
Six or more serves ($IT1Click here and enter in box
below$IT2)................................................. 97
Don't eat vegetables....................................... 98
20. THIS QUESTION IS ABOUT YOUR USUAL CONSUMPTION OF FRUIT, INCLUDING FRESH,
FROZEN AND TINNED FRUIT.
Thinking about a serve as 1 medium piece or 2 small pieces of fruit or 1 cup of
diced pieces. How many serves of fruit do you usually eat each day?
One serve or less.......................................... 1
Two serves................................................. 2
Three serves............................................... 3
Four serves................................................ 4
Five serves................................................ 5
Six or more serves ($IT1Click here and enter in box
below$IT2)................................................. 97
Don't eat fruit............................................ 98
105
21. In the last two weeks, how many times have you walked for sport, recreation
or fitness or to get to or from places for at least 10 minutes continuously?
|__|__+
WARNING4
ArialRED Please check your response. You mentioned earlier
that there were %172. occasions when you walked for at
least 10 minutes continuously. Please review the page and
answer questions........................................... 1,
If walked at least once, ASK:
+------------------------------------------------------------------------------+
| %173. |
+------------------------------------------------------------------------------+
<SHEAD>
22. IN TOTAL, how long would you estimate that you spent walking in the last two
weeks on %446,/ this/ these/ %172. occasions?
PLEASE ENTER THE NUMBER OF HOURS IN THE FIRST BOX AND THE NUMBER OF MINUTES IN
THE SECOND BOX BELOW
|__|__+
|__|__+
+------------------------------------------------------------------------------+
| hours minutes |
+------------------------------------------------------------------------------+
23. Thinking about moderate exercise excluding walking. By moderate exercise, we
mean any exercise which caused a moderate increase in your heart rate or
breathing. In the last two weeks, did you do any moderate exercise?
Yes........................................................ 1
No......................................................... 2
Can't say.................................................. 3
if participate in moderate exercise, ask:
24. In the last two weeks, how many times have you done any moderate exercise?
|__|__+
If done moderate exercise, ASK:
+------------------------------------------------------------------------------+
| %55. |
+------------------------------------------------------------------------------+
25. IN TOTAL, how long would you estimate that you spent doing moderate exercise
in the last two weeks on %454,/this/these/ %176. occassions?
PLEASE ENTER THE NUMBER OF HOURS IN THE FIRST BOX AND THE NUMBER OF MINUTES IN
THE SECOND BOX BELOW
|__|__+
|__|__+
+------------------------------------------------------------------------------+
| hours minutes |
+------------------------------------------------------------------------------+
26. Thinking about vigorous exercise. By vigorous exercise , we mean any
exercise which caused a large increase in your heart rate or breathing. In the
last two weeks, did you do any vigorous exercise?
Yes........................................................ 1
No......................................................... 2
Can't say.................................................. 3
if participate in vigorous exercise, ask:
106
27. In the last two weeks, how many times have you done any vigorous exercise?
|__|__+
If done vigorous exercise, ASK:
+------------------------------------------------------------------------------+
| %55. |
+------------------------------------------------------------------------------+
<SHEAD>
28. IN TOTAL, how long would you estimate that you spent doing vigorous exercise
in the last two weeks on %462,/this/these/ %179. occasions ?
PLEASE ENTER THE NUMBER OF HOURS IN THE FIRST BOX AND THE NUMBER OF MINUTES IN
THE SECOND BOX BELOW
|__|__+
|__|__+
+------------------------------------------------------------------------------+
| hours minutes |
+------------------------------------------------------------------------------+
29. Below are statements about buying food. Which of these best describes how
you choose when buying food for your household?
I never deliberately choose the healthy or nutritious
alternative................................................ 1
I seldom deliberately choose the healthy or nutritious
alternative................................................ 2
I sometimes choose the healthy or nutritious alternative... 3
I mostly deliberately choose the healthy or nutritious
alternative................................................ 4
I always deliberately choose the healthy or nutritious
alternative................................................ 5
I never purchase food for my household..................... 6
30. Do you read the labels on bottles of drinks to check the
ingredients/contents?
Yes, always................................................ 1
Yes, often................................................. 2
Yes, sometimes............................................. 3
Yes, the first time I buy a new product.................... 4
No......................................................... 5
Don't know................................................. 6
31. Please indicate if you are male or female
Male....................................................... 1
Female..................................................... 2
<SHEAD>
107
32. Please indicate your household's TOTAL approximate annual income from all
sources, before tax?
IF YOU ARE NOT CERTAIN, PLEASE GIVE YOUR BEST ESTIMATE (WEEKLY EQUIVALENTS IN
BRACKETS).
Nil income................................................. 1
$1 - $10,000 per year ($1-$192 per week)................... 2
$10,001 - $25,000 per year ($193-$480 per week)............ 3
$25,001 - $40,000 per year ($481-$769 per week)............ 4
$40,001 - $55,000 per year ($770-$1057 per week)........... 5
$55,001 - $70,000 per year ($1058-$1346 per week )......... 6
$70,001 - $85,000 per year ($1347-$1634 per week )......... 7
$85,001 - $100,000 per year ($1635-$1923 per week )........ 8
$100,001 or more per year ($1924 or more per week)......... 9
Prefer not to answer....................................... 10
33. What is the highest level of education you've reached?
Primary school............................................. 1
Secondary school up to year 10 (previously also called 4th
form)...................................................... 2
Secondary school up to year 11 or 12 (previously also
called 5th form or 6th form)............................... 3
Trade qualifications....................................... 4
Certificate (non-trade) and Diplomas....................... 5
Bachelor Degree............................................ 6
Higher Qualifications/Postgraduate Degree.................. 7
Other...................................................... 8
+------------------------------------------------------------------------------+
| END-OF-QUESTIONNAIRE |
+------------------------------------------------------------------------------+