Formula to fortune - NagaCorp Ltd to fortune NagaCorp-BUY 26 January 2012 [email protected] 5...
35
NagaCorp HK$2.70 - BUY Financials Year to 31 Dec 09A 10A 11CL 12CL 13CL Revenue (US$m) 118 151 222 261 291 Net profit (US$m) 25 30 89 111 129 EPS (US$) 0.01 0.01 0.04 0.05 0.06 CL/consensus (1) (EPS%) - - 105 119 126 EPS growth (% YoY) (36.4) 17.8 197.4 24.4 15.7 PE (x) 28.4 24.0 8.1 6.5 5.6 Dividend yield (%) 2.1 4.3 8.6 10.7 12.4 FCF yield (%) 1.4 7.5 11.6 16.7 19.3 PB (x) 2.5 2.3 2.1 1.9 1.7 ROE (%) 9.1 10.1 27.1 30.2 31.9 Net debt/equity (%) (5.2) (7.4) (20.8) (31.4) (42.0) Source: CLSA Asia-Pacific Markets Find CLSA research on Bloomberg, Thomson Reuters, CapIQ and themarkets.com - and profit from our evalu@tor ® proprietary database at clsa.com Richard Huang [email protected] (852) 26008455 Aaron Fischer, CFA (852)26008256 26 January 2012 Hong Kong Hotels & Leisure Reuters 3918.HK Bloomberg 3918 HK Priced on 20 January 2012 HK HSI @ 20,110.4 12M hi/lo HK$2.75/1.47 12M price target HK$3.20 ±% potential +19% Shares in issue 2,082.1m Free float (est.) 40.0% Market cap US$724m 3M average daily volume HK$5.0m (US$.6m) Major shareholders Tan Sri Dr Chen 60.0% Stock performance (%) 1M 3M 12M Absolute 39.2 44.4 57.0 Relative 28.9 29.4 86.4 Abs (US$) 39.5 44.7 57.5 0 50 100 150 200 250 300 350 400 0.7 1.1 1.6 2.0 2.5 2.9 Jan 10 Jul 10 Jan 11 Jul 11 NagaCorp (LHS) Rel to HSI (RHS) (%) (HK$) Source: Bloomberg www.clsa.com Initiating coverage Formula to fortune Nagacorp is the only licensed casino operator in Phnom Penh with a 70 years license and exclusivity until 2035. We expect the company to deliver Ebitda Cagr of 15% in 2012-14, underpinned by property upgrades, robust gaming demand in Indo-China and enhanced marketing efforts. We initiated with a BUY on NagaCorp. Our DCF target price of HK$3.20 implies 19% upside, which combined with the 11% 12CL yield would represent 30% total return. Cambodia: Rising from a low base According to IMF, Cambodia is expected to enjoy rapid economic growth over the next five years, driven by the current low base, government’s healthy balance sheet and the government’s intention to rely more heavily on higher value-adding tourism services to drive economic growth. Highly profitable Nagacorp operates the only licensed casino – Nagaworld in Phnom Penh (capital city of Cambodia) with a 70 years license till 2065 and exclusivity until 2035 within 200km radius of Phnom Penh. The Nagaworld is a mass market property generating Ebitda margin of 50% in 1H11 (vs. 25-30% in Macau), thanks to the low gaming tax and labour cost. The company adopts a prudent management style by maintaining zero-debt and being highly selective in granting credit. Multiple catalysts We are positive on the earnings outlook of Nagacorp and would expect the company to deliver Ebitda Cagr of 15% in 2012-14, underpinned by property upgrades, robust gaming demand in the Indo-China region and enhanced marketing efforts to improve brand recognition. Acquisition of the Naga2 will be a significant addition to the company, which will drive the longer term earnings growth of Nagacorp. Initiate with BUY; Target Price HK$3.20 We initiate coverage on Nagacorp with a BUY recommendation. DCF valuation is used to account for the 75% dilution post closure of the Naga2 transaction in 2014-15. Our target price of HK$3.20 implies 19% upside, which combined with the 11% 12CL dividend yield would imply a 12-month expected return of 30% for Nagacorp. We favour Nagacorp for its attractive yields (fifth highest in the entire CLSA universe) and cheap valuation. HK$3.20 fair value of Nagacorp includes HK$0.36 of value from Naga2.
-
Upload
duongthien -
Category
Documents
-
view
216 -
download
1
Transcript of Formula to fortune - NagaCorp Ltd to fortune NagaCorp-BUY 26 January 2012 [email protected] 5...

NagaCorpHK$2.70 - BUY
FinancialsYear to 31 Dec 09A 10A 11CL 12CL 13CLRevenue (US$m) 118 151 222 261 291Net profit (US$m) 25 30 89 111 129EPS (US$) 0.01 0.01 0.04 0.05 0.06CL/consensus (1) (EPS%) - - 105 119 126EPS growth (% YoY) (36.4) 17.8 197.4 24.4 15.7PE (x) 28.4 24.0 8.1 6.5 5.6Dividend yield (%) 2.1 4.3 8.6 10.7 12.4FCF yield (%) 1.4 7.5 11.6 16.7 19.3PB (x) 2.5 2.3 2.1 1.9 1.7ROE (%) 9.1 10.1 27.1 30.2 31.9Net debt/equity (%) (5.2) (7.4) (20.8) (31.4) (42.0)Source: CLSA Asia-Pacific Markets
Find CLSA research on Bloomberg, Thomson Reuters, CapIQ and themarkets.com - and profit from our evalu@tor® proprietary database at clsa.com
Richard [email protected](852) 26008455
Aaron Fischer, CFA(852)26008256
26 January 2012
Hong KongHotels & Leisure
Reuters 3918.HKBloomberg 3918 HK
Priced on 20 January 2012HK HSI @ 20,110.4
12M hi/lo HK$2.75/1.47
12M price target HK$3.20±% potential +19%
Shares in issue 2,082.1mFree float (est.) 40.0%
Market cap US$724m
3M average daily volumeHK$5.0m (US$.6m)
Major shareholdersTan Sri Dr Chen 60.0%
Stock performance (%)1M 3M 12M
Absolute 39.2 44.4 57.0Relative 28.9 29.4 86.4Abs (US$) 39.5 44.7 57.5
0
50
100
150
200
250
300
350
400
0.7
1.1
1.6
2.0
2.5
2.9
Jan 10 Jul 10 Jan 11 Jul 11NagaCorp (LHS)
Rel to HSI (RHS)
(%)(HK$)
Source: Bloomberg
www.clsa.com
Initia
ting co
vera
ge
Formula to fortuneNagacorp is the only licensed casino operator in Phnom Penh with a 70 years license and exclusivity until 2035. We expect the company to deliver Ebitda Cagr of 15% in 2012-14, underpinned by property upgrades, robust gaming demand in Indo-China and enhanced marketing efforts. We initiated with a BUY on NagaCorp. Our DCF target price of HK$3.20 implies 19% upside, which combined with the 11% 12CL yield would represent 30% total return.
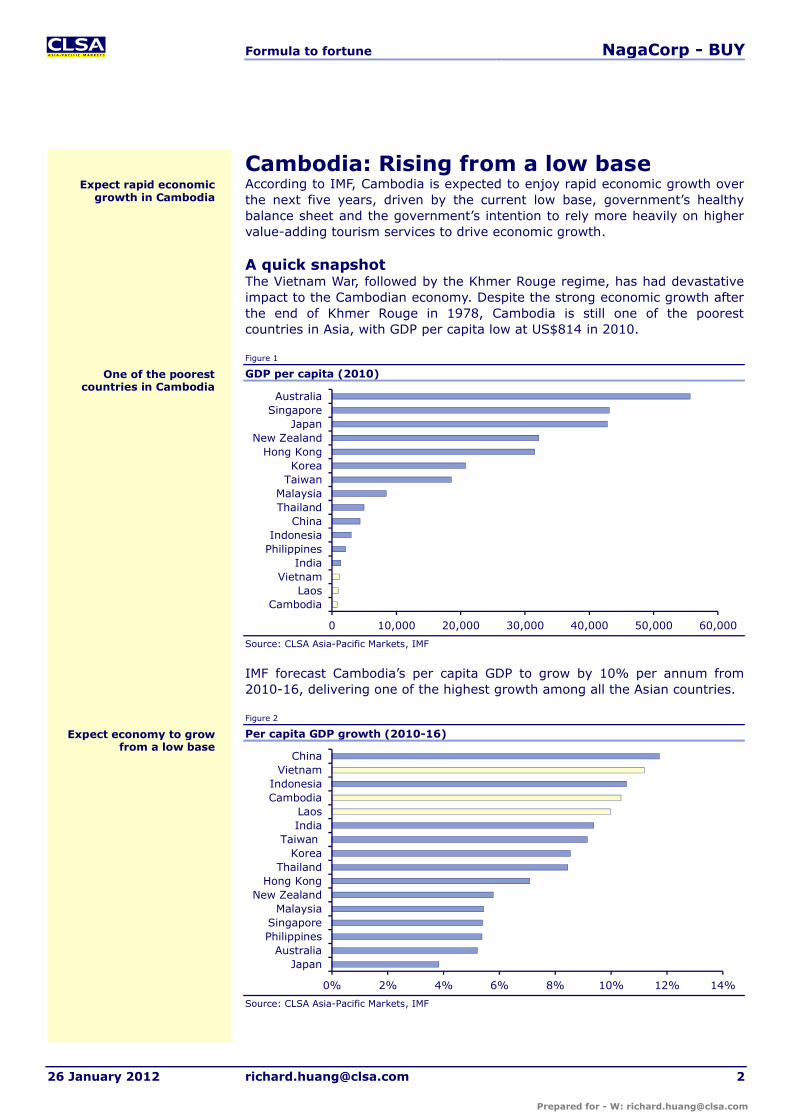
Cambodia: Rising from a low baseAccording to IMF, Cambodia is expected to enjoy rapid economic growth over the next five years, driven by the current low base, government’s healthy balance sheet and the government’s intention to rely more heavily on higher value-adding tourism services to drive economic growth.
Highly profitableNagacorp operates the only licensed casino – Nagaworld in Phnom Penh (capital city of Cambodia) with a 70 years license till 2065 and exclusivity until 2035 within 200km radius of Phnom Penh. The Nagaworld is a mass market property generating Ebitda margin of 50% in 1H11 (vs. 25-30% in Macau), thanks to the low gaming tax and labour cost. The company adopts a prudent management style by maintaining zero-debt and being highly selective in granting credit.
Multiple catalystsWe are positive on the earnings outlook of Nagacorp and would expect the company to deliver Ebitda Cagr of 15% in 2012-14, underpinned by property upgrades, robust gaming demand in the Indo-China region and enhanced marketing efforts to improve brand recognition. Acquisition of the Naga2 will be a significant addition to the company, which will drive the longer term earnings growth of Nagacorp.
Initiate with BUY; Target Price HK$3.20We initiate coverage on Nagacorp with a BUY recommendation. DCF valuation is used to account for the 75% dilution post closure of the Naga2 transaction in 2014-15. Our target price of HK$3.20 implies 19% upside, which combined with the 11% 12CL dividend yield would imply a 12-month expected return of 30% for Nagacorp. We favour Nagacorp for its attractive yields (fifth highest in the entire CLSA universe) and cheap valuation. HK$3.20 fair value of Nagacorp includes HK$0.36 of value from Naga2.
Formula to fortune NagaCorp - BUY
26 January 2012 [email protected] 2
Cambodia: Rising from a low baseAccording to IMF, Cambodia is expected to enjoy rapid economic growth over the next five years, driven by the current low base, government’s healthy balance sheet and the government’s intention to rely more heavily on higher value-adding tourism services to drive economic growth.
A quick snapshotThe Vietnam War, followed by the Khmer Rouge regime, has had devastative impact to the Cambodian economy. Despite the strong economic growth after the end of Khmer Rouge in 1978, Cambodia is still one of the poorest countries in Asia, with GDP per capita low at US$814 in 2010.
Figure 1
GDP per capita (2010)
Source: CLSA Asia-Pacific Markets, IMF
IMF forecast Cambodia’s per capita GDP to grow by 10% per annum from 2010-16, delivering one of the highest growth among all the Asian countries.
Figure 2
Per capita GDP growth (2010-16)
Source: CLSA Asia-Pacific Markets, IMF
0 10,000 20,000 30,000 40,000 50,000 60,000
CambodiaLaos
VietnamIndia
PhilippinesIndonesia
ChinaThailandMalaysia
TaiwanKorea
Hong KongNew Zealand
JapanSingaporeAustralia
0% 2% 4% 6% 8% 10% 12% 14%
JapanAustralia
PhilippinesSingapore
MalaysiaNew Zealand
Hong KongThailand
KoreaTaiwan
IndiaLaos
CambodiaIndonesia
VietnamChina
Expect rapid economic growth in Cambodia
One of the poorest countries in Cambodia
Expect economy to grow from a low base

Formula to fortune NagaCorp - BUY
26 January 2012 [email protected] 3
Government balance sheet has been healthy, which provides room for the government to develop the economy. Government debt as % of GDP has been at 30% in 2010, which is on the lower end as compared to Thailand’s 44% and Vietnam’s 53%.
Figure 3
Government debt as % of GDP (2010)
Source: CLSA Asia-Pacific Markets, IMF
Other macroeconomic indicators also highlight the healthiness of the Cambodian economy. Rapid economic growth has resulted in inflation, but inflation rate has been manageable at 4%. Cambodia is currently in current account deficit, but the amount is small at 4% of GDP, which is similar to that of India, Australia and Vietnam.
Figure 4 Figure 5
Inflation (%, 2010) Current account balance as % of GDP
Source: CLSA Asia-Pacific Markets, IMF Source: CLSA Asia-Pacific Markets, IMF
Global credit agencies recognize that the Cambodian economy is still in the initial growth stage and could subject to high credit risk. Moody’s gives Cambodia a B2 rating, highlighting that the country subjects to high credit risk and generally have poor credit quality. Standard & Poor’s give Cambodia a B rating, highlighting that the country has the capacity to meet its financial commitments but adverse business, financial, or economic conditions will likely impair the country’s capacity or willingness to meet its financial commitments.
0 50 100 150 200 250
AustraliaIndonesiaCambodia
New ZealandKoreaChina
Hong KongTaiwan
ThailandPhilippines
VietnamMalaysia
LaosIndia
SingaporeJapan
(2) 0 2 4 6 8 10 12 14
JapanTaiwan
MalaysiaNew Zealand
Hong KongSingaporeAustralia
KoreaThailand
ChinaPhilippinesCambodiaIndonesia
LaosVietnam
India
(30) (20) (10) 0 10 20 30
LaosCambodia
New ZealandVietnamAustralia
IndiaIndonesia
KoreaJapan
PhilippinesThailand
ChinaHong Kong
TaiwanMalaysia
Singapore
Healthy government balance sheet
B2 rating from Moody’s and B rating from S&P

Formula to fortune NagaCorp - BUY
26 January 2012 [email protected] 4
Diversifying the economyThe Cambodian economy currently relies heavily on Agriculture. In 2010, 36% of the country’s GDP is sourced from Agriculture, which compares with 10% in China and 1% in Japan.
Figure 6
GDP composition
Source: CLSA Asia-Pacific Markets, World Bank
Hun Sen, Prime Minister of the Kingdom of Cambodia, has considered tourism as one of the priority sectors, after rice exportation, contributing to socio-economic development. The Cambodian government aims to increase international tourist arrival from 2.5 million in 2010 to 4.5 million in 2015 and 7 million in 2020 via the implementation of the following initiatives.
Figure7
List of government initiatives
Improve air connectivityImprove regional and global communication networksDevelopment of ecotourismIntensify Sub-Mekong and ASEAN cooperationImplement Visa exemption policyImprove travel facilitation and tourist transportationSource: CLSA Asia-Pacific Markets, Ministry of Tourism of Cambodia
Currently, majority of the visitor arrival enters the country via land and water transport. Despite direct flight from Phnom Penh to most key Asian cities, including Bangkok, Beijing, Guangzhou, Hanoi, Hong Kong, Kuala Lumpar, Ho Chi Minh City, Singapore, Shanghai, Taipei, Vientiane and Incheon, half of the visitor arrival is still from land and water transport.
With the improvement in air connectivity and implementation of Visa exemption policy, tourist arrival from planes is expected to increase, which would drive the overall tourist arrival of the country.
0
10
20
30
40
50
60
70
80
Cambodia China Japan
Agriculture Industrial Services
High reliance on agriculture
List of government initiatives to develop international tourism
Formula to fortune NagaCorp - BUY
26 January 2012 [email protected] 5
Figure 8
Tourist arrival breakdown
Note: 11YTD refers to 2011 Year to date August; Source: CLSA Asia-Pacific Markets, Ministry of Tourism of Cambodia
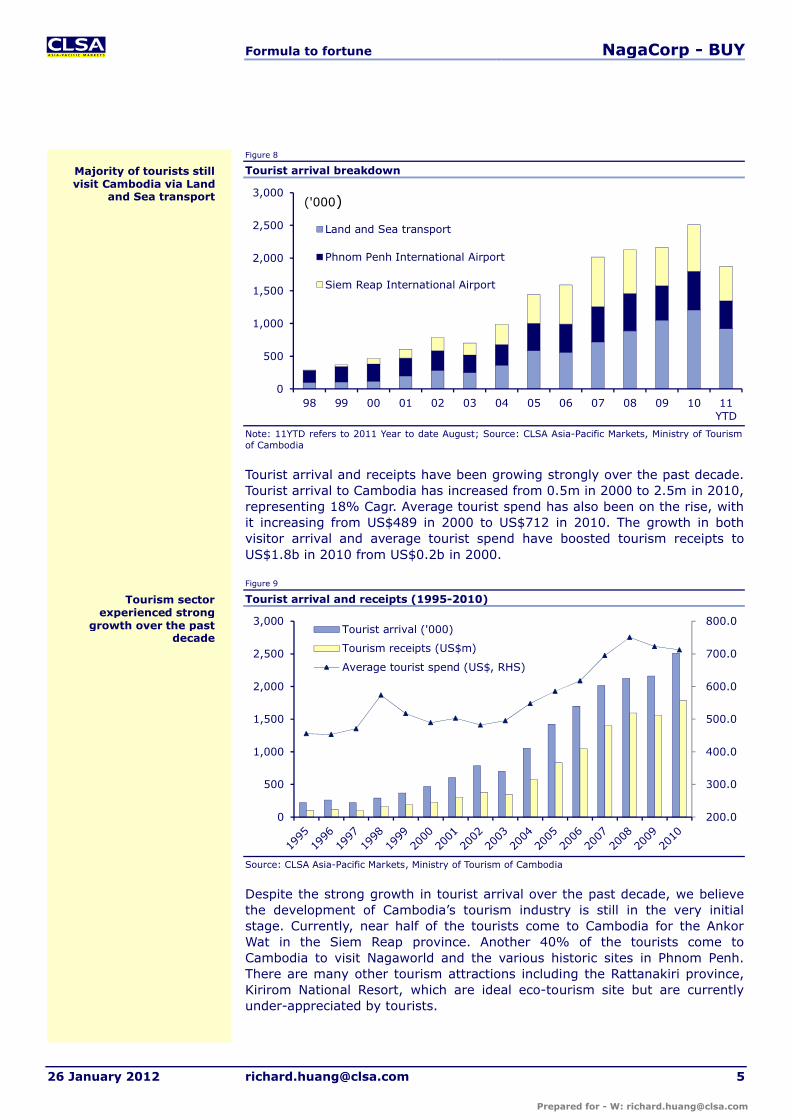
Tourist arrival and receipts have been growing strongly over the past decade. Tourist arrival to Cambodia has increased from 0.5m in 2000 to 2.5m in 2010, representing 18% Cagr. Average tourist spend has also been on the rise, with it increasing from US$489 in 2000 to US$712 in 2010. The growth in both visitor arrival and average tourist spend have boosted tourism receipts to US$1.8b in 2010 from US$0.2b in 2000.
Figure 9
Tourist arrival and receipts (1995-2010)
Source: CLSA Asia-Pacific Markets, Ministry of Tourism of Cambodia
Despite the strong growth in tourist arrival over the past decade, we believe the development of Cambodia’s tourism industry is still in the very initial stage. Currently, near half of the tourists come to Cambodia for the Ankor Wat in the Siem Reap province. Another 40% of the tourists come to Cambodia to visit Nagaworld and the various historic sites in Phnom Penh. There are many other tourism attractions including the Rattanakiri province,Kirirom National Resort, which are ideal eco-tourism site but are currently under-appreciated by tourists.
0
500
1,000
1,500
2,000
2,500
3,000
98 99 00 01 02 03 04 05 06 07 08 09 10 11YTD
Land and Sea transport
Phnom Penh International Airport
Siem Reap International Airport
('000)
200.0
300.0
400.0
500.0
600.0
700.0
800.0
0
500
1,000
1,500
2,000
2,500
3,000Tourist arrival ('000)
Tourism receipts (US$m)
Average tourist spend (US$, RHS)
Tourism sector experienced strong
growth over the past decade
Majority of tourists still visit Cambodia via Land
and Sea transport

Formula to fortune NagaCorp - BUY
26 January 2012 [email protected] 6
Figure 10 Figure 11
Percentage of tourist arrival by destination (1Q-3Q10) Percentage of tourist arrival by destination (1Q-3Q11)
Source: CLSA Asia-Pacific Markets, Ministry of Tourism of Cambodia Source: CLSA Asia-Pacific Markets, Ministry of Tourism of Cambodia
Figure 12 Figure 13
Ankor Wat (Siem Reap) Nagaworld (Phnom Penh)
Source: CLSA Asia-Pacific Markets, Ministry of Tourism of Cambodia Source: CLSA Asia-Pacific Markets, company
Phnom Penh & Others
49%Siem Reap
51%
Phnom Penh & Others
44%
Siem Reap56%
Formula to fortune NagaCorp - BUY
26 January 2012 [email protected] 7
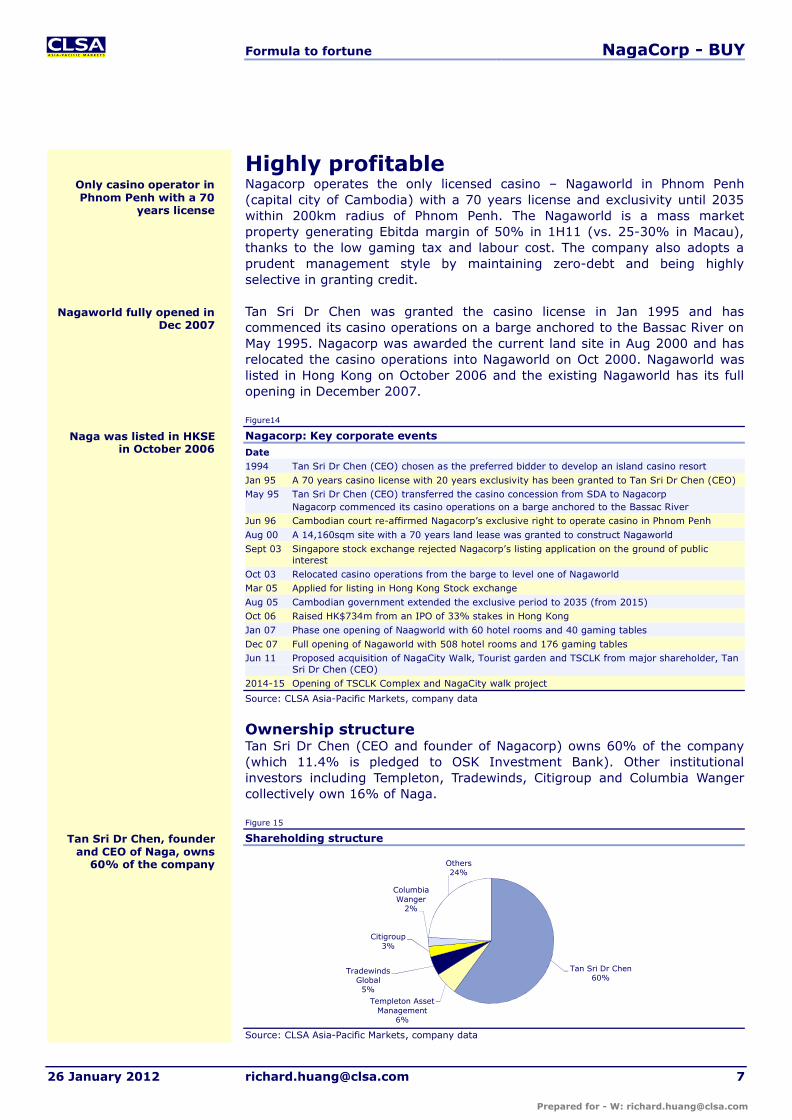
Highly profitableNagacorp operates the only licensed casino – Nagaworld in Phnom Penh (capital city of Cambodia) with a 70 years license and exclusivity until 2035within 200km radius of Phnom Penh. The Nagaworld is a mass market property generating Ebitda margin of 50% in 1H11 (vs. 25-30% in Macau), thanks to the low gaming tax and labour cost. The company also adopts a prudent management style by maintaining zero-debt and being highly selective in granting credit.
Tan Sri Dr Chen was granted the casino license in Jan 1995 and has commenced its casino operations on a barge anchored to the Bassac River on May 1995. Nagacorp was awarded the current land site in Aug 2000 and has relocated the casino operations into Nagaworld on Oct 2000. Nagaworld was listed in Hong Kong on October 2006 and the existing Nagaworld has its full opening in December 2007.
Figure14
Nagacorp: Key corporate eventsDate1994 Tan Sri Dr Chen (CEO) chosen as the preferred bidder to develop an island casino resortJan 95 A 70 years casino license with 20 years exclusivity has been granted to Tan Sri Dr Chen (CEO) May 95 Tan Sri Dr Chen (CEO) transferred the casino concession from SDA to Nagacorp
Nagacorp commenced its casino operations on a barge anchored to the Bassac RiverJun 96 Cambodian court re-affirmed Nagacorp’s exclusive right to operate casino in Phnom PenhAug 00 A 14,160sqm site with a 70 years land lease was granted to construct NagaworldSept 03 Singapore stock exchange rejected Nagacorp’s listing application on the ground of public
interestOct 03 Relocated casino operations from the barge to level one of NagaworldMar 05 Applied for listing in Hong Kong Stock exchangeAug 05 Cambodian government extended the exclusive period to 2035 (from 2015)Oct 06 Raised HK$734m from an IPO of 33% stakes in Hong KongJan 07 Phase one opening of Naagworld with 60 hotel rooms and 40 gaming tablesDec 07 Full opening of Nagaworld with 508 hotel rooms and 176 gaming tablesJun 11 Proposed acquisition of NagaCity Walk, Tourist garden and TSCLK from major shareholder, Tan
Sri Dr Chen (CEO)2014-15 Opening of TSCLK Complex and NagaCity walk project
Source: CLSA Asia-Pacific Markets, company data
Ownership structureTan Sri Dr Chen (CEO and founder of Nagacorp) owns 60% of the company(which 11.4% is pledged to OSK Investment Bank). Other institutional investors including Templeton, Tradewinds, Citigroup and Columbia Wanger collectively own 16% of Naga.
Figure 15
Shareholding structure
Source: CLSA Asia-Pacific Markets, company data
Tan Sri Dr Chen60%
Templeton Asset Management
6%
Tradewinds Global5%
Citigroup3%
Columbia Wanger
2%
Others24%
Tan Sri Dr Chen, founder and CEO of Naga, owns
60% of the company
Naga was listed in HKSE in October 2006
Only casino operator in Phnom Penh with a 70
years license
Nagaworld fully opened in Dec 2007

Formula to fortune NagaCorp - BUY
26 January 2012 [email protected] 8
In addition to its flagship investment - Nagacorp, Dr. Chen also owns three other companies listed on the Bursa Malaysia Berhad. These Malaysian listed companies are however much smaller than Nagacorp, in terms of market cap.
Figure 16
Shareholding structure
Source: CLSA Asia-Pacific Markets, company data
Location of propertyNagaworld is ideally located in the central district of Phnom Penh (capital of Cambodia) with the National Assembly and the Ministry of Foreign affairs sitting behind the Nagaworld complex. Thanks to the favourable location, visitors to Nagaworld can enjoy a nice view overlooking the Mekong River and the Hun Sen Park.
Figure 17 Figure 18
Location of Nagaworld View from Nagaworld
Source: CLSA Asia-Pacific Markets, Google Source: CLSA Asia-Pacific Markets
The NagaworldNagaworld is a large scale entertainment complex that was fully opened in December 2007. The integrated resort has a 58k sq feet gaming floor, 130 gaming tables, 500 hotel rooms, 10 F&B outlets and a wide array ofentertainment venues.
Tan Sri Dr ChenNagacorp.
MktCap: US$721mOwnership: 60%
Karambunai Corp.Mkt Cap: US$100mOwnership: 43.9%
FACB IndustriesMkt Cap: US$12mOwnership: 19.9%
Petaling TinMkt Cap: US$32mOwnership: 26.5%
Nagacorp is the flagship investment of Dr. Chen
Entertainment complex with 130 gaming tables, 500 hotel rooms and 10
F&B outlets

Formula to fortune NagaCorp - BUY
26 January 2012 [email protected] 9
Figure 19 Figure 20
Casino lobby Hotel room
Source: Company Source: Company
Most gaming facilities are in mass gaming floor (located in level one and twoof Nagaworld), which has 66 gaming tables and over 1,000 slot machines. Another 65 gaming tables are in the junket VIP rooms in the upper floors of the building.
Figure 21 Figure 22
Slots machines Main gaming floor
Source: Company Source: Company
Nagaworld also has a broad portfolio of non-gaming facilities. The Club 88 Karaoke and the Aristrocrat Wine and Cigar Bar are popular entertainment venues for international and local visitors. Nagaworld also has 22 Spa suites, equipped with personal sauna and massage pool, for visitors looking for a relaxing Cambodian therapy. Lastly, there are also 10 food and beverages outlets in the property, offering Italian, French, Korean, Chinese and culinary offerings to the gaming patrons.

Formula to fortune NagaCorp - BUY
26 January 2012 [email protected] 10
Figure 23 Figure 24
Club 88 Karaoke Cigar Bar
Source: Company Source: Company
Figure 25 Figure 26
Spa Italian restaurant
Source: Company Source: Company
Customer mixNagacorp is a direct beneficiary of the rising Asian travel demand, with most of its visitors coming from the neighbouring Asian countries. From 1Q –3Q11, 22% of the visitor arrival is from Vietnam. Korea accounts for another 12%, while China accounts for 9% of the total visitors visiting Cambodia.
Asians account for a huge proportion of Nagaworld’s business. In 1H11, 47% of the total junket rollings are contributed by Vietnamese. Malaysians account for 17% of the total junket rolling, while Chinese account for another 13%.
Beneficiary of the rising Asian travel demand
Vietnam is the biggest market for Nagaworld

Formula to fortune NagaCorp - BUY
26 January 2012 [email protected] 11
Figure 27 Figure 28
Cambodia: Tourist arrival mix (1Q-3Q11) Nagaworld: Junket rolling break by country (1H11)
Source: CLSA Asia-Pacific Markets, Ministry of Tourism of Cambodia Source: CLSA Asia-Pacific Markets, Ministry of Tourism of Cambodia
Gaming revenue mixOver the past few years, Nagaworld has been increasing its exposure towards the mass market segment. In 2008, 92% of the total revenue is sourced from the junket VIP segment. With reduction in credit to junkets and Nagaworld’s success in growing the mass market and slots business, the percentage of total revenue accounted for by the junket VIP segment has declined significantly to only 32% in 1H11, while mass market gaming and the slots operations respectively accounts for 25% and 35% of the total revenue.
Figure 29 Figure 30
Gaming revenue mix (2008) Gaming revenue mix (1H11)
Source: CLSA Asia-Pacific Markets, Ministry of Tourism of Cambodia Source: CLSA Asia-Pacific Markets, Ministry of Tourism of Cambodia
Cost analysisBuoyed by the low labour cost and gaming tax rate, Nagacorp delivered Ebitda margin of 50% in 1H11 (vs. 25-30% in Macau). Tax, junket commission and staff cost are the major operating cost items of a casino operator. In 1H11, tax has been low at 2% of gaming revenue, which explains the high Ebitda margin achieved by Naga. Staff cost is also low in Cambodia due to the ample supply of cheap labour. Junket commission rates at Naga are 1.3-1.7% (vs. 1.25% in Macau). The impact of a high junket commission rate however has been gradually reducing as the company continues to shift it’s focus to the higher margin mass market and slots business.
Thailand4%
France4% Laos
4%
USA5%
Japan6%
China9%
Korea12%
Vietnam22%
Others27%
Vietnam47%
Singapore4%
China/HK13%
Malaysia17%
Others19%
VIP92%
Mass 5%
Slots2%
Non-gaming
1% VIP32%
Mass 25%
Slots35%
Non-gaming
8%
Increasing exposure to the mass market segment
Achieved 50% Ebitda margin in 1H11
Formula to fortune NagaCorp - BUY
26 January 2012 [email protected] 12
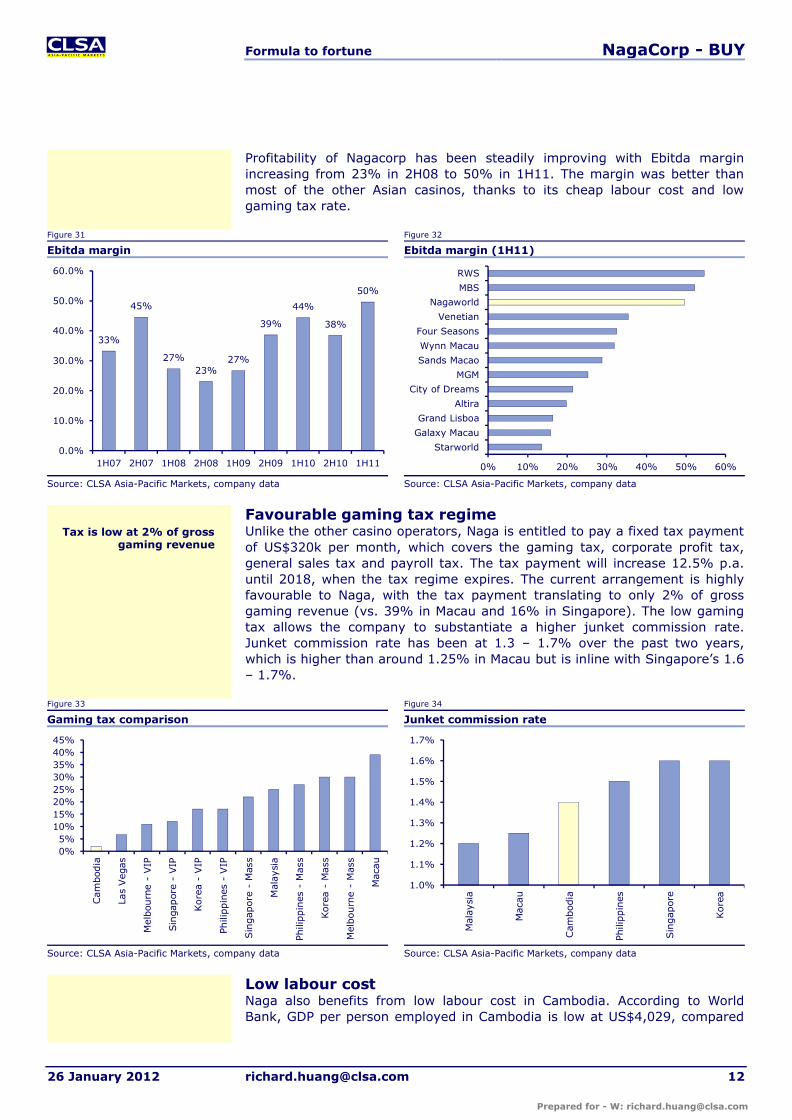
Profitability of Nagacorp has been steadily improving with Ebitda margin increasing from 23% in 2H08 to 50% in 1H11. The margin was better than most of the other Asian casinos, thanks to its cheap labour cost and low gaming tax rate.
Figure 31 Figure 32
Ebitda margin Ebitda margin (1H11)
Source: CLSA Asia-Pacific Markets, company data Source: CLSA Asia-Pacific Markets, company data
Favourable gaming tax regimeUnlike the other casino operators, Naga is entitled to pay a fixed tax payment of US$320k per month, which covers the gaming tax, corporate profit tax, general sales tax and payroll tax. The tax payment will increase 12.5% p.a. until 2018, when the tax regime expires. The current arrangement is highly favourable to Naga, with the tax payment translating to only 2% of gross gaming revenue (vs. 39% in Macau and 16% in Singapore). The low gaming tax allows the company to substantiate a higher junket commission rate. Junket commission rate has been at 1.3 – 1.7% over the past two years, which is higher than around 1.25% in Macau but is inline with Singapore’s 1.6 – 1.7%.
Figure 33 Figure 34
Gaming tax comparison Junket commission rate
Source: CLSA Asia-Pacific Markets, company data Source: CLSA Asia-Pacific Markets, company data
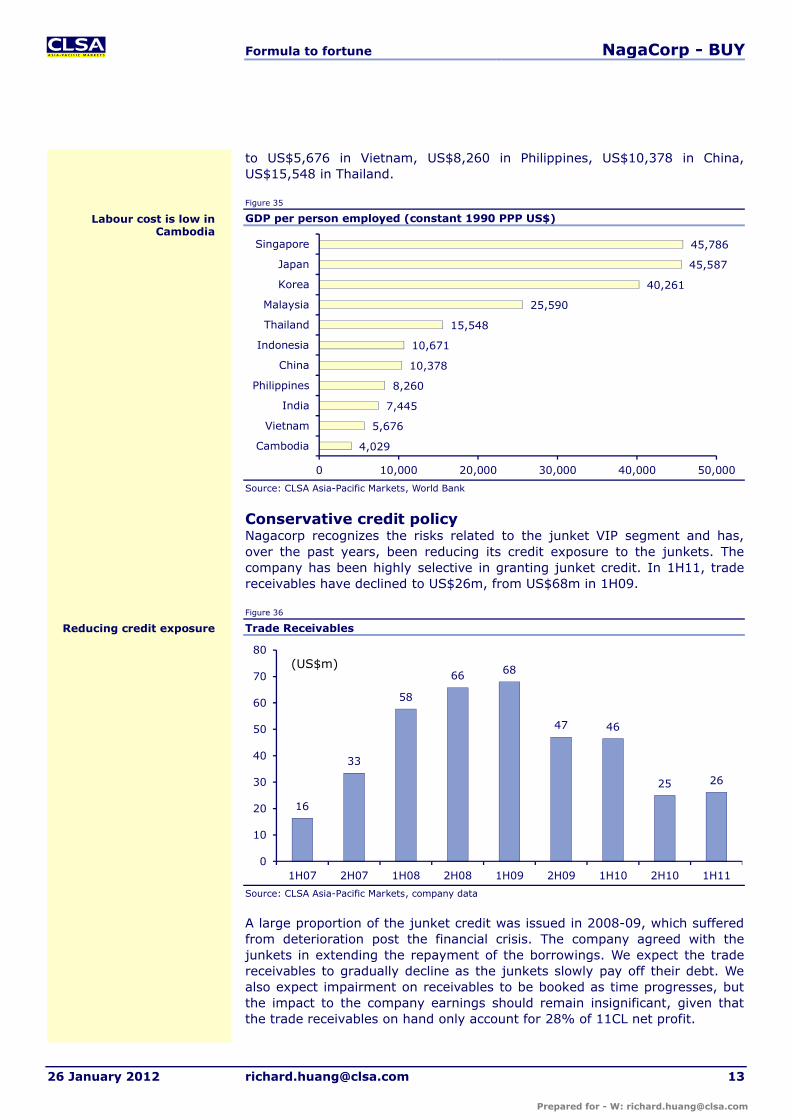
Low labour costNaga also benefits from low labour cost in Cambodia. According to World Bank, GDP per person employed in Cambodia is low at US$4,029, compared
33%
45%
27%23%
27%
39%
44%
38%
50%
0.0%
10.0%
20.0%
30.0%
40.0%
50.0%
60.0%
1H07 2H07 1H08 2H08 1H09 2H09 1H10 2H10 1H11 0% 10% 20% 30% 40% 50% 60%
Starworld
Galaxy Macau
Grand Lisboa
Altira
City of Dreams
MGM
Sands Macao
Wynn Macau
Four Seasons
Venetian
Nagaworld
MBS
RWS
0%5%
10%15%20%25%30%35%40%45%
Cam
bod
ia
Las
Veg
as
Mel
bou
rne -
VIP
Sin
gapor
e -
VIP
Kore
a -
VIP
Phili
ppin
es -
VIP
Sin
gap
ore
- M
ass
Mal
aysi
a
Phili
ppin
es -
Mass
Kore
a -
Mass
Mel
bourn
e -
Mas
s
Mac
au
1.0%
1.1%
1.2%
1.3%
1.4%
1.5%
1.6%
1.7%
Mal
aysi
a
Mac
au
Cam
bod
ia
Phili
ppin
es
Sin
gap
ore
Kore
a
Tax is low at 2% of gross gaming revenue
Formula to fortune NagaCorp - BUY
26 January 2012 [email protected] 13
to US$5,676 in Vietnam, US$8,260 in Philippines, US$10,378 in China,US$15,548 in Thailand.
Figure 35
GDP per person employed (constant 1990 PPP US$)
Source: CLSA Asia-Pacific Markets, World Bank
Conservative credit policyNagacorp recognizes the risks related to the junket VIP segment and has, over the past years, been reducing its credit exposure to the junkets. The company has been highly selective in granting junket credit. In 1H11, trade receivables have declined to US$26m, from US$68m in 1H09.
Figure 36
Trade Receivables
Source: CLSA Asia-Pacific Markets, company data
A large proportion of the junket credit was issued in 2008-09, which suffered from deterioration post the financial crisis. The company agreed with the junkets in extending the repayment of the borrowings. We expect the trade receivables to gradually decline as the junkets slowly pay off their debt. We also expect impairment on receivables to be booked as time progresses, but the impact to the company earnings should remain insignificant, given that the trade receivables on hand only account for 28% of 11CL net profit.
4,029
5,676
7,445
8,260
10,378
10,671
15,548
25,590
40,261
45,587
45,786
0 10,000 20,000 30,000 40,000 50,000
Cambodia
Vietnam
India
Philippines
China
Indonesia
Thailand
Malaysia
Korea
Japan
Singapore
16
33
58
66 68
47 46
25 26
0
10
20
30
40
50
60
70
80
1H07 2H07 1H08 2H08 1H09 2H09 1H10 2H10 1H11
(US$m)
Reducing credit exposure
Labour cost is low in Cambodia
Formula to fortune NagaCorp - BUY
26 January 2012 [email protected] 14
Figure 37
Impairment on Receivables
Source: CLSA Asia-Pacific Markets, company data
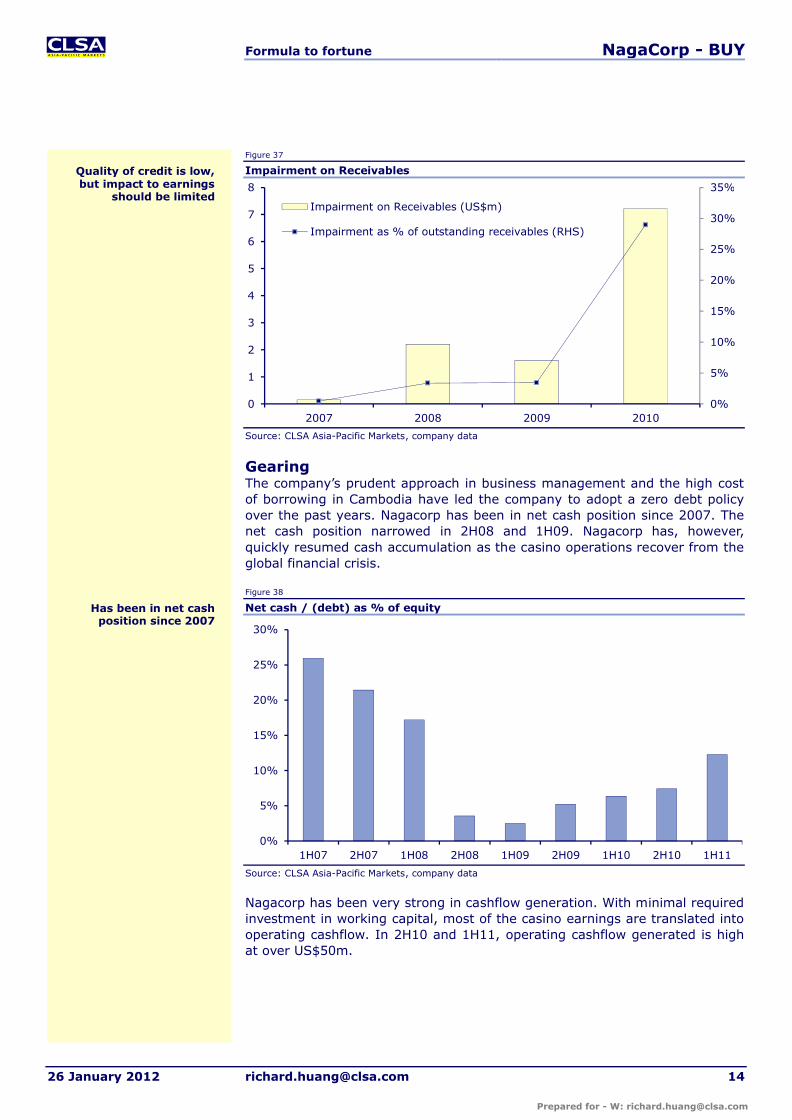
GearingThe company’s prudent approach in business management and the high cost of borrowing in Cambodia have led the company to adopt a zero debt policy over the past years. Nagacorp has been in net cash position since 2007. The net cash position narrowed in 2H08 and 1H09. Nagacorp has, however,quickly resumed cash accumulation as the casino operations recover from the global financial crisis.
Figure 38
Net cash / (debt) as % of equity
Source: CLSA Asia-Pacific Markets, company data
Nagacorp has been very strong in cashflow generation. With minimal required investment in working capital, most of the casino earnings are translated into operating cashflow. In 2H10 and 1H11, operating cashflow generated is high at over US$50m.
0%
5%
10%
15%
20%
25%
30%
35%
0
1
2
3
4
5
6
7
8
2007 2008 2009 2010
Impairment on Receivables (US$m)
Impairment as % of outstanding receivables (RHS)
0%
5%
10%
15%
20%
25%
30%
1H07 2H07 1H08 2H08 1H09 2H09 1H10 2H10 1H11
Has been in net cash position since 2007
Quality of credit is low, but impact to earnings
should be limited

Formula to fortune NagaCorp - BUY
26 January 2012 [email protected] 15
Figure 39
Operating cashflow
Source: CLSA Asia-Pacific Markets, company data
The strong cashflow generation has enabled the company to consistently pay out attractive dividends. In 1H11, the company declared US$32m interim dividend, representing an interim dividend yield of 4.4%. We forecast 2011CL dividend yield to be 8.7%.
Figure 40
Dividend payout ratio
Source: CLSA Asia-Pacific Markets, company data
0
10
20
30
40
50
60
1H07 2H07 1H08 2H08 1H09 2H09 1H10 2H10 1H11
0%
10%
20%
30%
40%
50%
60%
70%
80%
0
10
20
30
40
50
1H07 2H07 1H08 2H08 1H09 2H09 1H10 2H10 1H11
Net profit (US$m) Dividend (US$m)
Dividend payout ratio (RHS)
High dividend payout underpinned by strong
cashflow generation
Strong cashflow from casino operations

Formula to fortune NagaCorp - BUY
26 January 2012 [email protected] 16
Multiple catalystsWe are positive on the earnings outlook of Nagacorp and would expect the company to deliver Ebitda Cagr of 15% in 2012-14, underpinned by property upgrades, robust gaming demand in the Indo-China region and enhanced marketing efforts to improve brand recognition. Acquisition of the Naga2projects will be a significant addition to the company, which will drive the longer term earnings growth of Nagacorp.
Margin expansionWe expect margin expansion combined with topline growth to drive earnings growth in 2012-14CL. As Nagacorp continues to shift towards the higher margin mass and slots segment, we expect Ebitda margin to improve from 49.6% in 1H11 to 52.6% in 2H14.
Figure 41 Figure 42
Ebitda margin by segment (1H11) Ebitda margin
Source: CLSA Asia-Pacific Markets Source: CLSA Asia-Pacific Markets
Property upgradesThe increased gaming facilities and hotel rooms post the property upgrade will be near-term catalysts to drive earnings growth. The Nagarock Café (to be completed in February 2012), Saigon Palace (to be completed in June 2012) are expected to increase mass market tables in Nagaworld by 38% and slots count by 30%. The additional hotel annex (to be completed in January to March 2012) will also increase the hotel inventory of Nagaworld by 44%.
Figure 43
Addition in property facilities
Source: CLSA Asia-Pacific Markets, company data
10%
39%
50%
69%75%
0%
20%
40%
60%
80%
100%
VIP Non-gaming Overall Mass Slots
30%
35%
40%
45%
50%
55%
60%
65%
70%
75%
80%
1H10 2H10 1H11 2H11 1H12 2H12 1H13 2H13 1H14 2H14
Non-VIP revenue as % of total
Ebitda margin
100 100 100 100
15 22
23 8 44
0
20
40
60
80
100
120
140
160
Junket VIP tables Mass market tables Slots Hotel rooms
Existing operations Nagarock Café Saigon Palace New hotel annex
(%)
Property upgrades, robust gaming demand and
marketing programs to drive growth
Adding more mass market tables and slots to the
gaming floor
Margin expansion underpinned by improving
revenue mix
Formula to fortune NagaCorp - BUY
26 January 2012 [email protected] 17
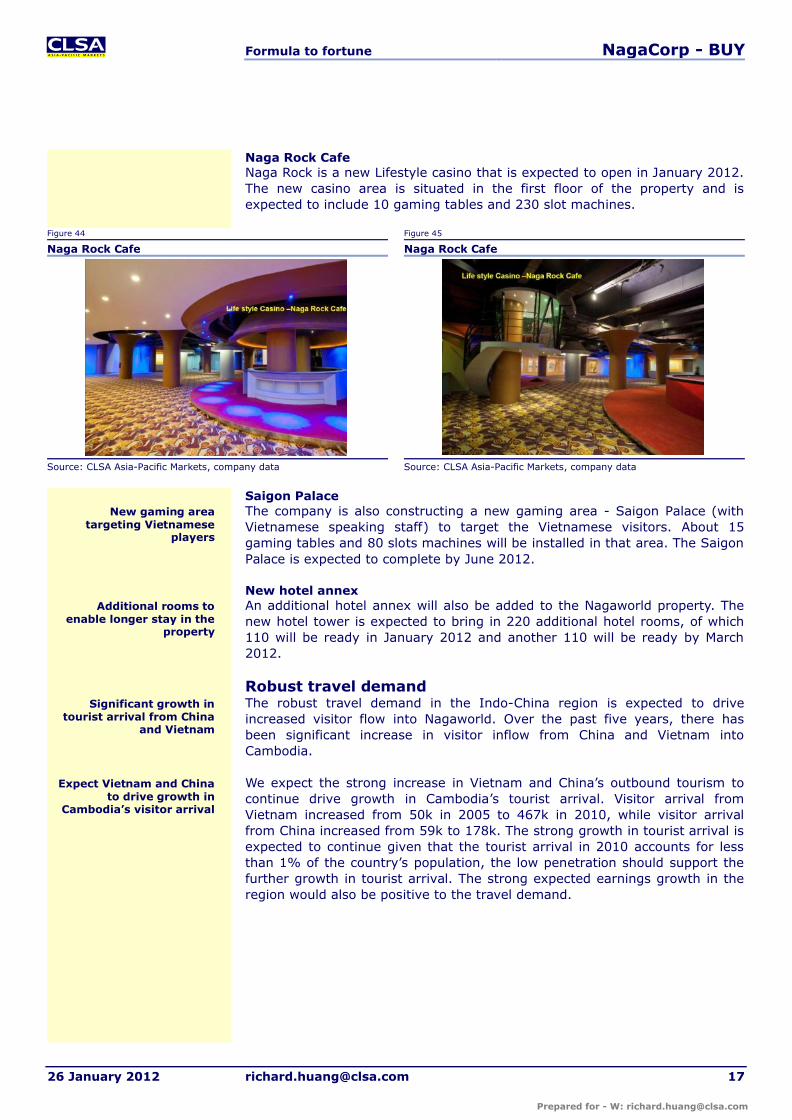
Naga Rock CafeNaga Rock is a new Lifestyle casino that is expected to open in January 2012. The new casino area is situated in the first floor of the property and is expected to include 10 gaming tables and 230 slot machines.
Figure 44 Figure 45
Naga Rock Cafe Naga Rock Cafe
Source: CLSA Asia-Pacific Markets, company data Source: CLSA Asia-Pacific Markets, company data
Saigon PalaceThe company is also constructing a new gaming area - Saigon Palace (with Vietnamese speaking staff) to target the Vietnamese visitors. About 15 gaming tables and 80 slots machines will be installed in that area. The Saigon Palace is expected to complete by June 2012.
New hotel annexAn additional hotel annex will also be added to the Nagaworld property. The new hotel tower is expected to bring in 220 additional hotel rooms, of which 110 will be ready in January 2012 and another 110 will be ready by March 2012.
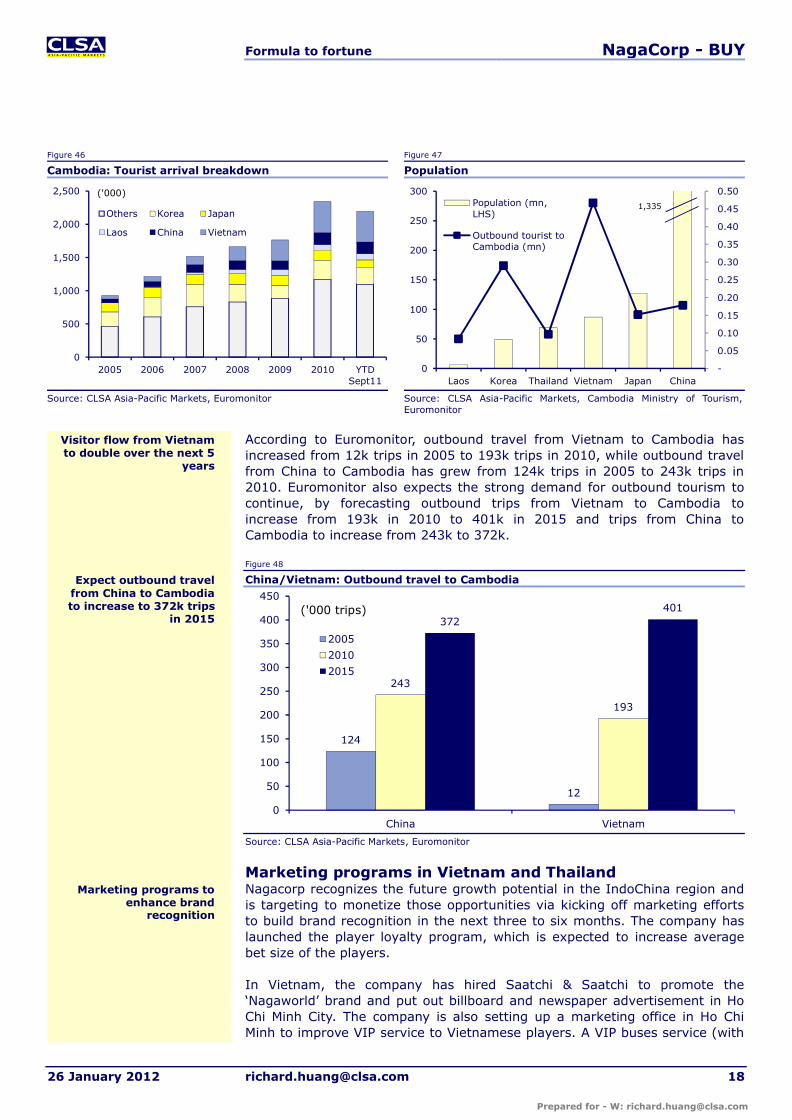
Robust travel demandThe robust travel demand in the Indo-China region is expected to drive increased visitor flow into Nagaworld. Over the past five years, there has been significant increase in visitor inflow from China and Vietnam into Cambodia.
We expect the strong increase in Vietnam and China’s outbound tourism to continue drive growth in Cambodia’s tourist arrival. Visitor arrival from Vietnam increased from 50k in 2005 to 467k in 2010, while visitor arrival from China increased from 59k to 178k. The strong growth in tourist arrival is expected to continue given that the tourist arrival in 2010 accounts for less than 1% of the country’s population, the low penetration should support the further growth in tourist arrival. The strong expected earnings growth in the region would also be positive to the travel demand.
New gaming area targeting Vietnamese
players
Additional rooms to enable longer stay in the
property
Significant growth in tourist arrival from China
and Vietnam
Expect Vietnam and Chinato drive growth in
Cambodia’s visitor arrival
Formula to fortune NagaCorp - BUY
26 January 2012 [email protected] 18
Figure 46 Figure 47
Cambodia: Tourist arrival breakdown Population
Source: CLSA Asia-Pacific Markets, Euromonitor Source: CLSA Asia-Pacific Markets, Cambodia Ministry of Tourism, Euromonitor
According to Euromonitor, outbound travel from Vietnam to Cambodia has increased from 12k trips in 2005 to 193k trips in 2010, while outbound travel from China to Cambodia has grew from 124k trips in 2005 to 243k trips in 2010. Euromonitor also expects the strong demand for outbound tourism to continue, by forecasting outbound trips from Vietnam to Cambodia to increase from 193k in 2010 to 401k in 2015 and trips from China to Cambodia to increase from 243k to 372k.
Figure 48
China/Vietnam: Outbound travel to Cambodia
Source: CLSA Asia-Pacific Markets, Euromonitor
Marketing programs in Vietnam and ThailandNagacorp recognizes the future growth potential in the IndoChina region and is targeting to monetize those opportunities via kicking off marketing efforts to build brand recognition in the next three to six months. The company has launched the player loyalty program, which is expected to increase average bet size of the players.
In Vietnam, the company has hired Saatchi & Saatchi to promote the ‘Nagaworld’ brand and put out billboard and newspaper advertisement in Ho Chi Minh City. The company is also setting up a marketing office in Ho Chi Minh to improve VIP service to Vietnamese players. A VIP buses service (with
0
500
1,000
1,500
2,000
2,500
2005 2006 2007 2008 2009 2010 YTDSept11
Others Korea Japan
Laos China Vietnam
('000)
-
0.05
0.10
0.15
0.20
0.25
0.30
0.35
0.40
0.45
0.50
0
50
100
150
200
250
300
Laos Korea Thailand Vietnam Japan China
Population (mn,LHS)
Outbound tourist toCambodia (mn)
1,335
124
12
243
193
372401
0
50
100
150
200
250
300
350
400
450
China Vietnam
2005
2010
2015
('000 trips)
Marketing programs to enhance brand
recognition
Expect outbound travel from China to Cambodia to increase to 372k trips
in 2015
Visitor flow from Vietnam to double over the next 5
years

Formula to fortune NagaCorp - BUY
26 January 2012 [email protected] 19
10 luxury buses) will also be set up between Ho Chi Minh and Nagaworld, which will enhance the visitor flow to the property. A private jet is also boughtto enable easier access to Nagaworld from its prime markets in Indochina, greater China and Southeast Asia, where there are no direct commercial flights to Phnom Penh. In Thailand, Nagacorp has also appointed J Walter Thomson to reshape the company’s brand in Bangkok.
Naga2 projectsOn the longer term, earnings growth is likely to be driven by the acquisition of the Naga2 projects (including the TSCLK complex, NagaCity Walk and the Tourist Park) from Tan Sri Dr Chen which is expected to enhance and compliment the existing Nagaworld property.
In June 2011, Nagacorp announced that it has entered into a share purchase agreement with Tan Sri Dr Chen to purchase the Naga2 at a consideration of US$369m, which will be funded by issuance of shares and convertible bonds. The company has not pursued debt financing due to the high borrowing cost in Cambodia. The intention to maintain the high dividend payout and retain cash for the increased working capital required post opening of Naga2 havealso led the company to finance the project acquisition via equity instead of by internal cashflow.
The projects designs have been finalized with relevant approvals from Royal Government of Cambodia being received. These projects are expected to commence construction in 1Q12 and to be completed in 3 to 5 years. The total costs incurred as at June 2011 by the project companies is US$17.3 m, comprising land premiums, master-planning fees and other professional fees.
Figure 49
NagaCity Walk project
Source: CLSA Asia-Pacific Markets, company data
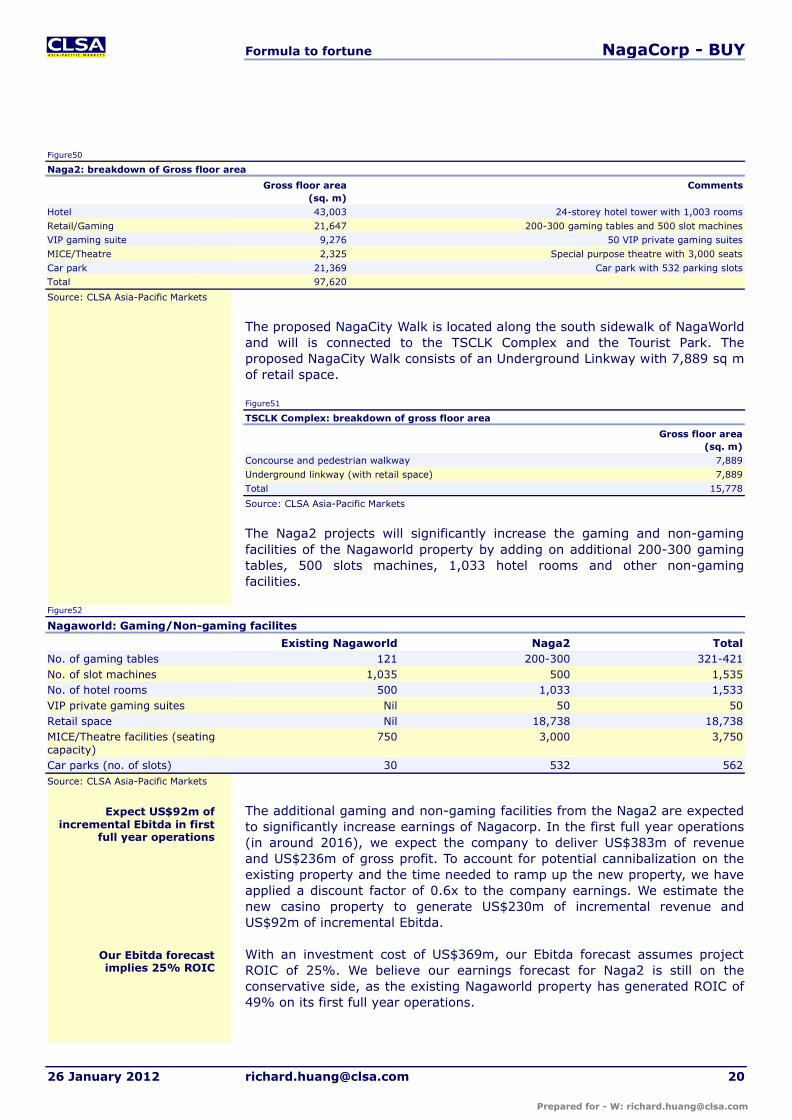
TSCLK Complex will be an integrated complex comprising podium complex with gaming, retail, conference and hotel facilities and a car park, with total gross floor area of 97,620 sq m (similar size to the existing Nagaworld).
To acquire three projects from Tan Sri Dr Chen at
US$369m
Integrated complex with gaming and non-gaming
facilities
Location of the NagaCity Walk and TSCLK complex
Construction to commence in 3Q11
Formula to fortune NagaCorp - BUY
26 January 2012 [email protected] 20
Figure50
Naga2: breakdown of Gross floor area
Gross floor area(sq. m)
Comments
Hotel 43,003 24-storey hotel tower with 1,003 roomsRetail/Gaming 21,647 200-300 gaming tables and 500 slot machinesVIP gaming suite 9,276 50 VIP private gaming suitesMICE/Theatre 2,325 Special purpose theatre with 3,000 seatsCar park 21,369 Car park with 532 parking slotsTotal 97,620
Source: CLSA Asia-Pacific Markets
The proposed NagaCity Walk is located along the south sidewalk of NagaWorld and will is connected to the TSCLK Complex and the Tourist Park. The proposed NagaCity Walk consists of an Underground Linkway with 7,889 sq m of retail space.
Figure51
TSCLK Complex: breakdown of gross floor area
Gross floor area(sq. m)
Concourse and pedestrian walkway 7,889Underground linkway (with retail space) 7,889Total 15,778
Source: CLSA Asia-Pacific Markets
The Naga2 projects will significantly increase the gaming and non-gaming facilities of the Nagaworld property by adding on additional 200-300 gaming tables, 500 slots machines, 1,033 hotel rooms and other non-gaming facilities.
Figure52
Nagaworld: Gaming/Non-gaming facilites
Existing Nagaworld Naga2 TotalNo. of gaming tables 121 200-300 321-421No. of slot machines 1,035 500 1,535No. of hotel rooms 500 1,033 1,533VIP private gaming suites Nil 50 50Retail space Nil 18,738 18,738MICE/Theatre facilities (seating capacity)
750 3,000 3,750
Car parks (no. of slots) 30 532 562Source: CLSA Asia-Pacific Markets
The additional gaming and non-gaming facilities from the Naga2 are expected to significantly increase earnings of Nagacorp. In the first full year operations(in around 2016), we expect the company to deliver US$383m of revenue and US$236m of gross profit. To account for potential cannibalization on the existing property and the time needed to ramp up the new property, we have applied a discount factor of 0.6x to the company earnings. We estimate the new casino property to generate US$230m of incremental revenue and US$92m of incremental Ebitda.
With an investment cost of US$369m, our Ebitda forecast assumes projectROIC of 25%. We believe our earnings forecast for Naga2 is still on the conservative side, as the existing Nagaworld property has generated ROIC of 49% on its first full year operations.
Expect US$92m of incremental Ebitda in first
full year operations
Our Ebitda forecast implies 25% ROIC

Formula to fortune NagaCorp - BUY
26 January 2012 [email protected] 21
Figure53
Incremental revenue from Naga2
No. of tables/slots
Win per table/slots
Revenue Gross margin Gross profit
Junket VIP floor 40 3,338 48.7 30% 14.6Mass gaming floor 160 2,569 150.0 90% 135.0Slots 500 260 47.4 90% 42.7VIP private suites 50 6,750 123.2 30% 37.0Retail1 13.5 50% 6.7Total revenue 382.9 236.0Discount factor2 0.6x 0.6xNet incremental earnings 229.7 141.6Less: operating expenses (50.0)Incremental Ebitda 91.61: Assume Nagacorp to charge a rent per square meter of US$60 on its 18,738 sq. m. of retail space; 2: We apply a discount factor of 0.6x to account for the potential cannibalization and ramp up of the new casino property; Source: CLSA Asia-Pacific Markets

Formula to fortune NagaCorp - BUY
26 January 2012 [email protected] 22
Expect Ebitda Cagr of 15%With the various growth catalysts ahead, we forecast Ebitda of Nagacorp to increase from US$109m in 2011 to US$166m in 2014, representing 15% Cagr.
We forecast modest win per VIP table growth of 2-4% in 2012-14, as the company look to limit junket credit to contain risk profile of the business. We are more positive on the public floor operations. We forecast win per mass tables and slots to grow by 3-4% in 2012 (post the property upgrade), and expect the performance to ramp up in the following years by forecasting 11-12% growth in net win per table/slot in 2013-14.
Figure54
Win per table/slot per day
(US$) 2007 2008 2009 2010 2011 2012 2013 2014VIP 9,810 9,422 2,478 2,316 2,976 3,032 3,155 3,282Mass 627 478 822 1,249 2,291 2,372 2,624 2,948Slots n/a n/a 151 210 231 238 263 296YoY %VIP -4% -74% -7% 29% 2% 4% 4%Mass -24% 72% 52% 83% 4% 11% 12%Slots n/a n/a 39% 10% 3% 11% 12%
Source: CLSA Asia-Pacific Markets
Figure55
Profit & Loss forecast
(US$m) 2007A 2008A 2009A 2010A 2011CL 2012CL 2013CL 2014CLVIP 128.9 178.1 53.4 54.1 70.6 71.9 74.8 77.9 Mass 11.9 9.777 24.6 41.5 55.2 72.3 87.2 97.9 Slots 3.1 3.07 34.3 44.9 77.2 95.9 107.2 118.4 Non-gaming 0.2 2.5 5.5 10 18.9 20.6 22.0 23.2
-0.1 0.0 0.0 0.0 -0.0 - - -Revenue 144.0 193.5 117.8 150.5 221.8 260.7 291.2 317.4 Cost of sales -65.9 -105.5 -46.5 -43.8 -63.2 -67.5 -72.2 -76.3 Gross profit 78.1 88.0 71.3 106.7 158.6 193.1 219.0 241.2 Other operating income 4.1 2.6 0.8 4.4 0.8 - - -Admin expenses -12.5 -24.3 -17.2 -31.0 -28.9 -34.7 -39.1 -42.6 Other operating expenses -12.9 -17.0 -17.0 -32.2 -21.9 -26.2 -29.6 -32.3 Ebitda 56.9 49.3 37.9 61.9 108.6 132.2 150.3 166.3 Amortisation of Casino licence premium -3.5 -3.7 -3.5 -3.5 -3.5 -3.5 -3.5 -3.5 Depreciation -1.4 -3.5 -6.8 -10.4 -11.6 -12.9 -12.8 -12.8 Profit from operations 51.9 42.0 27.6 47.9 93.5 115.8 133.9 150.0 Cost relating to postponed IPONet finance expensesProfit before tax 51.9 42.0 27.6 47.9 93.5 115.8 133.9 150.0 Income tax -1.7 -2.0 -2.1 -3.9 -4.0 -4.5 -5.0 -5.6 Net profit (US$m) 50.2 40.0 25.5 44.1 89.5 111.3 128.9 144.3 Dividend (US$m) 30.0 18.0 15.3 30.8 62.6 77.9 90.2 101.0 Retained earnings 20.2 22.0 10.2 13.2 26.8 33.4 38.7 43.3
ProfitabilityGross margin 54.3% 45.5% 60.6% 70.9% 71.5% 74.1% 75.2% 76.0%Ebitda margin 39.5% 25.5% 32.2% 41.1% 49.0% 50.7% 51.6% 52.4%Net margin 34.9% 20.7% 21.6% 29.3% 40.3% 42.7% 44.3% 45.5%
YoY %Revenue 68.6% 34.3% -39.1% 27.8% 47.4% 17.5% 11.7% 9.0%Ebitda 49.5% -13.4% -23.1% 63.4% 75.5% 21.7% 13.7% 10.7%Net profit 53.9% -20.3% -36.3% 73.0% 103.1% 24.4% 15.7% 12.0%
Source: CLSA Asia-Pacific Markets
Expect earnings growth to be driven by capacity
addition
Forecast only modest growth in VIP segment

Formula to fortune NagaCorp - BUY
26 January 2012 [email protected] 23
Balance sheet strength remainsWe expect Nagacorp’s balance sheet to remain strong and the company to remain debt free in the next couple years. We also forecast trade receivable to decline from US$24m in 2011 to US$9m in 2014 as the company gradually cuts back on junket credit.
Figure56
Balance sheet forecast
(US$m) 2007A 2008A 2009A 2010A 2011CL 2012CL 2013CL 2014CLFixed asset 190.3 217.8 245.2 247.3 256.7 255.3 250.9 246.5 Property, plant and equipment 91.5 122.6 149.4 155.8 167.6 169.7 168.9 168.1 Interest in leasehold land held for own use under operating leases
0.7 0.7 0.6 0.6 0.6 0.6 0.6 0.6
Intangible assets 98.1 94.6 91.0 87.5 83.9 80.4 76.8 73.3 Trade receivables 1.3 1.3 1.3 1.3 Deposit payments for purchase of raw materials
3.2 3.2 3.2 3.2
Current asset 92.8 76.8 67.6 75.2 143.0 185.9 237.9 292.7 Consumables 0.1 0.2 0.3 0.6 0.6 0.8 0.9 1.0 Trade & other receivables 33.5 65.8 47.1 24.9 23.6 18.6 13.6 8.6 Deposit for purchase of raw materials 3.0 1.2 1.2 5.7 5.2 5.2 5.2 5.2 Fixed deposit at bank - - 4.0 21.1 40.5 40.5 40.5 40.5 Cash at bank and in hand 56.2 9.6 15.0 22.9 73.1 120.8 177.8 237.5 Total Assets 283.1 294.6 312.8 322.5 399.6 441.1 488.8 539.3
Current liabilities 20.5 24.4 25.0 13.8 48.1 56.2 65.2 72.3 Trade and other payables 18.4 22.3 15.7 13.8 15.6 19.3 21.1 23.0
Dividend payable - - 6.9 - 32.1 36.5 43.8 49.0 Obligation under finance lease 0.0 0.0 0.0 0.0 - - - -Current tax liabilities - - 0.2 - 0.3 0.3 0.3 0.3 Provision 2.1 2.1 2.1 - - - - -Non-current liabilities 0.0 0.0 0.0 0.0 0.0 0.0 0.0 0.0 Obligations under finance lease 0.0 0.0 0.0 0.0 0.0 0.0 0.0 0.0
Total Liabilities 20.5 24.4 25.0 13.8 48.1 56.2 65.2 72.3
Capital and Reserves 262.6 270.2 287.7 308.7 351.6 385.0 423.6 466.9 Share Capital 25.9 25.9 26.0 26.0 26.0 26.0 26.0 26.0 Reserves 236.6 244.3 261.7 282.7 325.5 359.0 397.6 440.9
Source: CLSA Asia-Pacific Markets
With strong free cashflow, cash balance is expected to increase from US$73m in 2011 to US$238m in 2014, which will drive net cash as % of equity to increase from 21% in 2011 to 51% in 2014.
To remain debt free

Formula to fortune NagaCorp - BUY
26 January 2012 [email protected] 24
Figure 57
Net cash/(debt) to equity
Source: CLSA Asia-Pacific Markets
Strong cashflow from casino operationsWe forecast capex to gradually decline from US$25m in 2011 to US$12m in 2013-14. The gradual decline in capex spend is because the expansion projects at the Nagaworld property will be largely completed by 1H12. The US$12m of capex in 2013-14 will mainly be dedicated to the maintenance of the existing facilities.
Nagacorp has historically maintained a high dividend payout ratio of 45-70% over the past four years. With strong free cashflow, we have assumed Nagacorp to maintain a high dividend payout ratio of 70% in 2012-14, which represents US$74-96m of cash dividend payments.
Figure58
Cashflow forecast
(US$m) 2007A 2008A 2009A 2010A 2011CL 2012CL 2013CL 2014CLProfit before tax 51.9 42.0 27.6 47.9 93.5 115.8 133.9 150.0 Adjustments for:-Depreciation 1.4 3.7 6.8 10.4 11.6 12.9 12.8 12.8 -Amortization of casino licence premium 3.5 3.5 3.5 3.5 3.5 3.5 3.5 3.5
Operating profit before changes in working capital 52.4 49.9 39.1 65.5 108.9 132.2 150.3 166.3 Decrease/(increase) in consumables -0.0 -0.1 -0.1 -0.3 -0.1 -0.2 -0.1 -0.1 Decrease/(increase) in trade and other receivables -21.5 -34.6 13.0 15.6 1.3 5.0 5.0 5.0 Increase/(decrease) in trade and other payables 9.6 2.2 -6.0 1.2 1.8 3.8 1.7 1.9 Cash generated from operations 40.6 17.4 46.0 81.9 112.5 140.8 156.9 173.1 Tax paid -1.7 -2.0 -1.9 -4.1 -3.6 -4.5 -5.0 -5.6 Others - - - - 0.3 - - -Net cash from operating activities 38.8 15.4 44.1 77.8 108.9 136.4 151.9 167.5
Payment for the purchase of PP&E -39.4 -30.3 -33.8 -23.5 -24.8 -15.0 -12.0 -12.0 Addition of fixed deposit at bank - - -4.0 -17.1 -19.4 - - -Net cash from investing activities -36.9 -29.7 -37.7 -39.9 -44.2 -15.0 -12.0 -12.0
Dividend paid -24.0 -31.3 -2.7 -30.0 -30.5 -73.6 -82.9 -95.8 Others -0.0 -1.0 1.7 -0.0 16.0 - - -Net cash from financing activities -24.0 -32.3 -1.0 -30.0 -14.5 -73.6 -82.9 -95.8 Net change in cash -22.1 -46.6 5.4 7.9 50.2 47.8 57.0 59.7
Source: CLSA Asia-Pacific Markets
21%
4% 5%7%
21%
31%
42%
51%
0%
10%
20%
30%
40%
50%
60%
2007 2008 2009 2010 2011CL 2012CL 2013CL 2014CL
Forecast capex to decline from US$25m to US$12m
Net cash as % of equity to increase from 21% in
2011 to 51% in 2014
Formula to fortune NagaCorp - BUY
26 January 2012 [email protected] 25
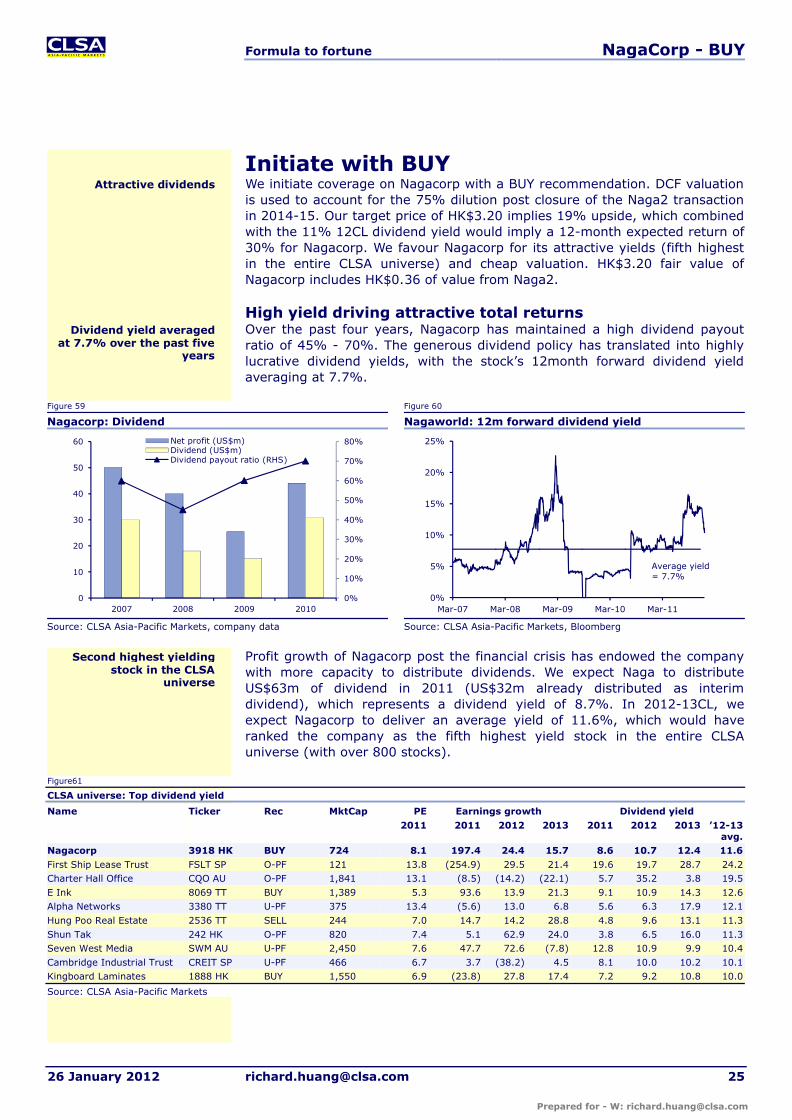
Initiate with BUYWe initiate coverage on Nagacorp with a BUY recommendation. DCF valuation is used to account for the 75% dilution post closure of the Naga2 transaction in 2014-15. Our target price of HK$3.20 implies 19% upside, which combined with the 11% 12CL dividend yield would imply a 12-month expected return of 30% for Nagacorp. We favour Nagacorp for its attractive yields (fifth highest in the entire CLSA universe) and cheap valuation. HK$3.20 fair value of Nagacorp includes HK$0.36 of value from Naga2.
High yield driving attractive total returnsOver the past four years, Nagacorp has maintained a high dividend payout ratio of 45% - 70%. The generous dividend policy has translated into highly lucrative dividend yields, with the stock’s 12month forward dividend yield averaging at 7.7%.
Figure 59 Figure 60
Nagacorp: Dividend Nagaworld: 12m forward dividend yield
Source: CLSA Asia-Pacific Markets, company data Source: CLSA Asia-Pacific Markets, Bloomberg
Profit growth of Nagacorp post the financial crisis has endowed the company with more capacity to distribute dividends. We expect Naga to distribute US$63m of dividend in 2011 (US$32m already distributed as interim dividend), which represents a dividend yield of 8.7%. In 2012-13CL, we expect Nagacorp to deliver an average yield of 11.6%, which would have ranked the company as the fifth highest yield stock in the entire CLSA universe (with over 800 stocks).
Figure61
CLSA universe: Top dividend yield
Name Ticker Rec MktCap PE Earnings growth Dividend yield2011 2011 2012 2013 2011 2012 2013 ’12-13
avg.Nagacorp 3918 HK BUY 724 8.1 197.4 24.4 15.7 8.6 10.7 12.4 11.6First Ship Lease Trust FSLT SP O-PF 121 13.8 (254.9) 29.5 21.4 19.6 19.7 28.7 24.2Charter Hall Office CQO AU O-PF 1,841 13.1 (8.5) (14.2) (22.1) 5.7 35.2 3.8 19.5E Ink 8069 TT BUY 1,389 5.3 93.6 13.9 21.3 9.1 10.9 14.3 12.6Alpha Networks 3380 TT U-PF 375 13.4 (5.6) 13.0 6.8 5.6 6.3 17.9 12.1Hung Poo Real Estate 2536 TT SELL 244 7.0 14.7 14.2 28.8 4.8 9.6 13.1 11.3Shun Tak 242 HK O-PF 820 7.4 5.1 62.9 24.0 3.8 6.5 16.0 11.3Seven West Media SWM AU U-PF 2,450 7.6 47.7 72.6 (7.8) 12.8 10.9 9.9 10.4Cambridge Industrial Trust CREIT SP U-PF 466 6.7 3.7 (38.2) 4.5 8.1 10.0 10.2 10.1Kingboard Laminates 1888 HK BUY 1,550 6.9 (23.8) 27.8 17.4 7.2 9.2 10.8 10.0
Source: CLSA Asia-Pacific Markets
0%
10%
20%
30%
40%
50%
60%
70%
80%
0
10
20
30
40
50
60
2007 2008 2009 2010
Net profit (US$m)Dividend (US$m)Dividend payout ratio (RHS)
0%
5%
10%
15%
20%
25%
Mar-07 Mar-08 Mar-09 Mar-10 Mar-11
Average yield = 7.7%
Attractive dividends
Dividend yield averaged at 7.7% over the past five
years
Second highest yielding stock in the CLSA
universe
Formula to fortune NagaCorp - BUY
26 January 2012 [email protected] 26
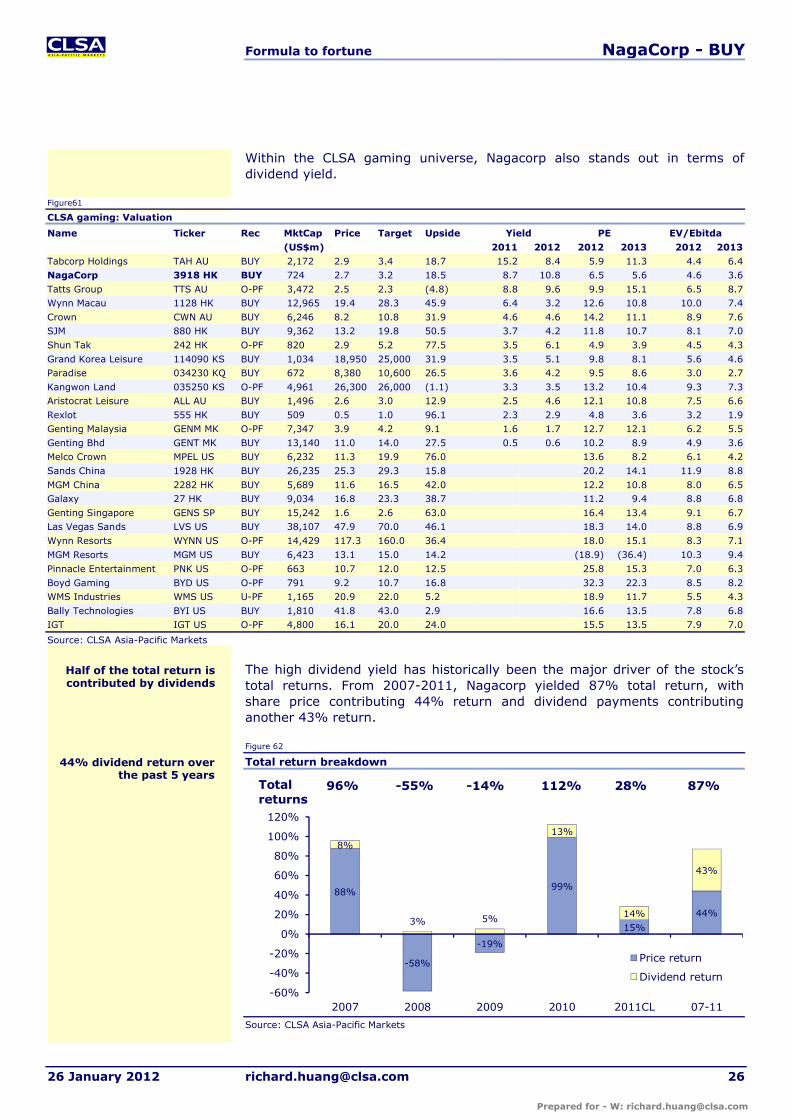
Within the CLSA gaming universe, Nagacorp also stands out in terms of dividend yield.
Figure61
CLSA gaming: Valuation
Name Ticker Rec MktCap Price Target Upside Yield PE EV/Ebitda(US$m) 2011 2012 2012 2013 2012 2013
Tabcorp Holdings TAH AU BUY 2,172 2.9 3.4 18.7 15.2 8.4 5.9 11.3 4.4 6.4NagaCorp 3918 HK BUY 724 2.7 3.2 18.5 8.7 10.8 6.5 5.6 4.6 3.6Tatts Group TTS AU O-PF 3,472 2.5 2.3 (4.8) 8.8 9.6 9.9 15.1 6.5 8.7Wynn Macau 1128 HK BUY 12,965 19.4 28.3 45.9 6.4 3.2 12.6 10.8 10.0 7.4Crown CWN AU BUY 6,246 8.2 10.8 31.9 4.6 4.6 14.2 11.1 8.9 7.6SJM 880 HK BUY 9,362 13.2 19.8 50.5 3.7 4.2 11.8 10.7 8.1 7.0Shun Tak 242 HK O-PF 820 2.9 5.2 77.5 3.5 6.1 4.9 3.9 4.5 4.3Grand Korea Leisure 114090 KS BUY 1,034 18,950 25,000 31.9 3.5 5.1 9.8 8.1 5.6 4.6Paradise 034230 KQ BUY 672 8,380 10,600 26.5 3.6 4.2 9.5 8.6 3.0 2.7Kangwon Land 035250 KS O-PF 4,961 26,300 26,000 (1.1) 3.3 3.5 13.2 10.4 9.3 7.3Aristocrat Leisure ALL AU BUY 1,496 2.6 3.0 12.9 2.5 4.6 12.1 10.8 7.5 6.6Rexlot 555 HK BUY 509 0.5 1.0 96.1 2.3 2.9 4.8 3.6 3.2 1.9Genting Malaysia GENM MK O-PF 7,347 3.9 4.2 9.1 1.6 1.7 12.7 12.1 6.2 5.5Genting Bhd GENT MK BUY 13,140 11.0 14.0 27.5 0.5 0.6 10.2 8.9 4.9 3.6Melco Crown MPEL US BUY 6,232 11.3 19.9 76.0 13.6 8.2 6.1 4.2Sands China 1928 HK BUY 26,235 25.3 29.3 15.8 20.2 14.1 11.9 8.8MGM China 2282 HK BUY 5,689 11.6 16.5 42.0 12.2 10.8 8.0 6.5Galaxy 27 HK BUY 9,034 16.8 23.3 38.7 11.2 9.4 8.8 6.8Genting Singapore GENS SP BUY 15,242 1.6 2.6 63.0 16.4 13.4 9.1 6.7Las Vegas Sands LVS US BUY 38,107 47.9 70.0 46.1 18.3 14.0 8.8 6.9Wynn Resorts WYNN US O-PF 14,429 117.3 160.0 36.4 18.0 15.1 8.3 7.1MGM Resorts MGM US BUY 6,423 13.1 15.0 14.2 (18.9) (36.4) 10.3 9.4Pinnacle Entertainment PNK US O-PF 663 10.7 12.0 12.5 25.8 15.3 7.0 6.3Boyd Gaming BYD US O-PF 791 9.2 10.7 16.8 32.3 22.3 8.5 8.2WMS Industries WMS US U-PF 1,165 20.9 22.0 5.2 18.9 11.7 5.5 4.3Bally Technologies BYI US BUY 1,810 41.8 43.0 2.9 16.6 13.5 7.8 6.8IGT IGT US O-PF 4,800 16.1 20.0 24.0 15.5 13.5 7.9 7.0
Source: CLSA Asia-Pacific Markets
The high dividend yield has historically been the major driver of the stock’s total returns. From 2007-2011, Nagacorp yielded 87% total return, with share price contributing 44% return and dividend payments contributing another 43% return.
Figure 62
Total return breakdown
Source: CLSA Asia-Pacific Markets
88%
-58%
-19%
99%
15%
44%
8%
3% 5%
13%
14%
43%
-60%
-40%
-20%
0%
20%
40%
60%
80%
100%
120%
2007 2008 2009 2010 2011CL 07-11
Price return
Dividend return
Totalreturns
96% -55% -14% 112% 28% 87%
Half of the total return is contributed by dividends
44% dividend return over the past 5 years

Formula to fortune NagaCorp - BUY
26 January 2012 [email protected] 27
Target price of HK$3.20 by DCF valuationWe initiate coverage on Nagacorp with a BUY recommendation. Discounted Cashflow (DCF) valuation is used to factor in the 75% dilution post closure of the Naga2 in 2014-15. Our target price of HK$3.20 implies 19% upside, which combined with the 11% 12CL dividend yield would imply a 12-month expected return of 30% for Nagacorp. HK$3.20 fair value of Nagacorp includes HK$0.36 of value from the Naga2.
Figure63
Target price calculation
(HK$) As % of totalExisting operations 2.84 89%Naga2 0.36 11%
Nagacorp Target Price 3.20
Source: CLSA Asia-Pacific Markets
Our two stage DCF model assumes the Naga2 to complete in 2015 and have its full year operations in 2016. With the project completing in 2015, we expect the project acquisition to also conclude in the same year, which will increase the number of shares outstanding from 2082m to 3644m shares, as the company pay off the project cost with newly issued equity.
We believe we are conservative in our growth forecast and see potential upside surprise to our Naga2 fair value of HK$0.36 per share. We have assumed more rapid growth of 10% from the new project in its first three years of operations (Stage 1), followed by moderating growth of 3% afterwards (Stage 2).
Figure64
Nagacorp: Two stage DCF model
(US$m) 2012 2013 2014 2015 2016 2017 2018 2019 2020 2021Cashflow from existing operations 132.2 150.3 166.3 171.3 176.4 181.7 187.2 192.8 198.6 204.5 Investment cost -369.0 Cashflow from Naga2 91.6 100.8 110.9 121.9 125.6 129.4 Total Cashflow 132.2 150.3 166.3 171.3 -100.9 282.5 298.0 314.7 324.2 333.9 Discount factor 1.00 0.84 0.70 0.58 0.49 0.41 0.34 0.28 0.24 0.20 Discounted Cashflow 132.2 125.5 116.0 99.8 -49.1 114.8 101.2 89.2 76.8 66.0 Shares outstanding 2082.1 2082.1 2082.1 3643.6 3643.6 3643.6 3643.6 3643.6 3643.6 3643.6 DCF per share 0.064 0.060 0.056 0.027 -0.013 0.032 0.028 0.024 0.021 0.018
Nagacorp fair value Discounted CFs (10Y) - US$ 0.316Terminal Value – US$ 0.098Total (US$) 0.414Total (HK$) 3.20
AssumptionsEbitda growth (Stage 2) 3%Ebitda growth (Stage 1) 10%
Terminal growth rate 1%WACC 20%Outstanding share (pre-acquisition) 2082.1Outstanding share (post-acquisition)
3643.6
Source: CLSA Asia-Pacific Markets
We recognize that country risk of Cambodia is higher than other Asian countries and have factored that into our WACC computation. We apply the
Initiate with BUY, target price HK$3.20
HK$2.84 contributed by existing operations
Apply 20% WACC to factor in specific country
risk
Assume shares dilution to take effect in 2015, as the
project completes
See potential upside surprise to our project
fair value

Formula to fortune NagaCorp - BUY
26 January 2012 [email protected] 28
average fundamental beta of Asian gaming companies of 1.07 to 10% estimated market return and 4% risk free rate to derive the WACC of an average Asian gaming operator. An additional equity risk premium is added to account for the specific country risk of Cambodia. We used the yield gap between Cambodia and Malaysia 10 year government bond to formulate the required equity risk premium for Cambodia. As Cambodia government bond yield is not readily available, Vietnam government bond yield is used instead.The difference, however, should not be material given that the credit ratings(by S&P) of the two countries are very similar, with Vietnam at BB- and Cambodia at B.
Figure65
WACC calculation
CommentCambodia 10 years government bond yield 12.4% Used Vietnam government bond yield as a proxyMalaysia 10 years government bond yield 3.7%Equity risk premium for Cambodia 8.7% Take the difference of the Cambodia and
Malaysia bond yield to estimate the equity risk premium for Cambodia
Risk free rate 4.0%Market return 10.0%Beta 1.07 Average fundamental beta (from evalu@tor) of
Asian gaming companies WACC 19.7%
Source: CLSA Asia-Pacific Markets
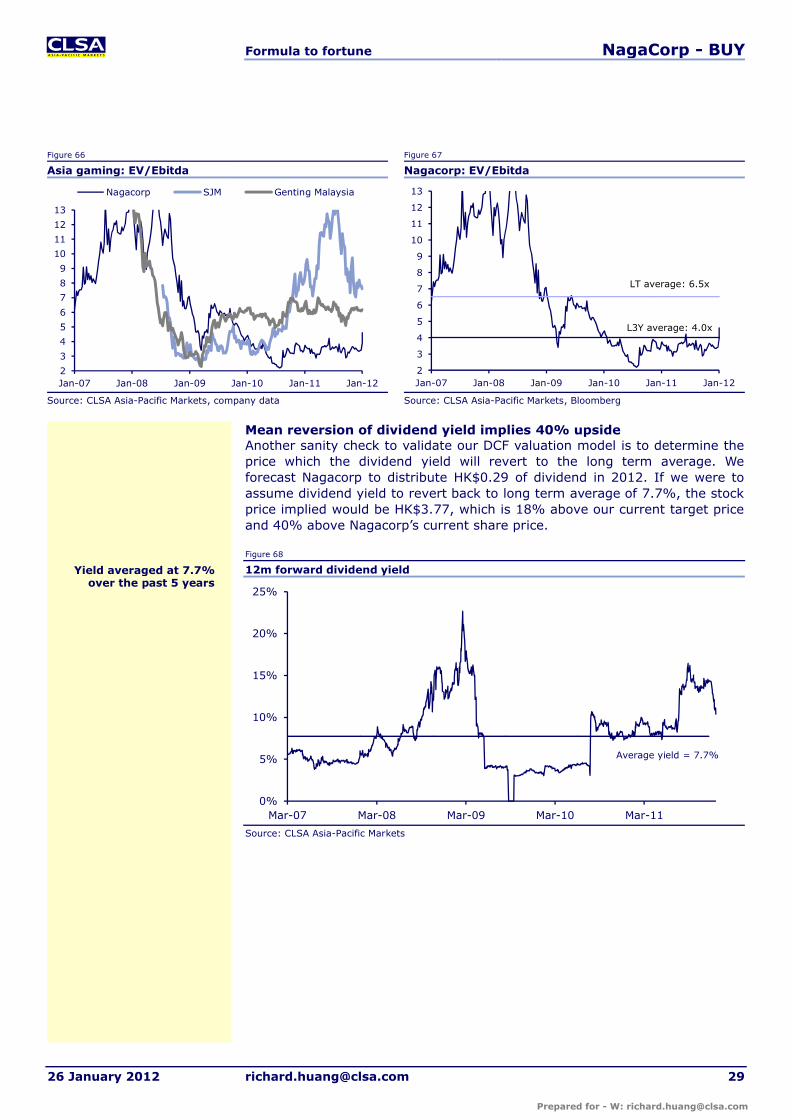
Room for share price re-ratingDuring the global financial crisis, Nagacorp, and other gaming companies like SJM and Genting Malaysia, has suffered from significant share price de-rating which brought the EV/Ebitda multiple of the company to decline from 13x to 2x.
The business was severely impacted during the financial crisis, with revenue and net profit declining 40% yoy in 2009, which is likely the root cause to the significant share price decline. We believe that the business model of Nagacorp has improved, as the company reduced reliance on VIP segment,and the likelihood of having another substantial profit decline has reduced significantly. In 2011, VIP revenue as % of total has declined to 32% from92% in 2008.
In 2010-11, despite significant improvement in business fundamentals, Nagacorp has been left behind in the share price boom of the Asian gaming companies. Ebitda has increased by 63% in 2010 and is expected to increase by another 75% in 2011. Share price has jumped from HK$0.4 in the midst of the financial crisis to HK$2.69, as of the latest. Despite that, EV/Ebitda of the company remained attractive at 4.6x, which is at significant discount to its long term average of 6.5x.
Our DCF target price of HK$3.20 implies 2012CL EV/Ebitda of 5.5x, which is at discount to the long term historic average. We believe 5.5x 2012CL EV/Ebidta is reasonable, given that the 2012CL Ebitda does not include potential earnings from the new project, which is expected to drive significant earnings growth.
Cambodia requires additional 8.7% equity
risk premium
Profit slump drag share price down during the
financial crisis
Room for share price re-rating
DCF target price implies 5.5x 2012CL EV/Ebitda
Formula to fortune NagaCorp - BUY
26 January 2012 [email protected] 29
Figure 66 Figure 67
Asia gaming: EV/Ebitda Nagacorp: EV/Ebitda
Source: CLSA Asia-Pacific Markets, company data Source: CLSA Asia-Pacific Markets, Bloomberg
Mean reversion of dividend yield implies 40% upsideAnother sanity check to validate our DCF valuation model is to determine the price which the dividend yield will revert to the long term average. We forecast Nagacorp to distribute HK$0.29 of dividend in 2012. If we were to assume dividend yield to revert back to long term average of 7.7%, the stock price implied would be HK$3.77, which is 18% above our current target price and 40% above Nagacorp’s current share price.
Figure 68
12m forward dividend yield
Source: CLSA Asia-Pacific Markets
2
3
4
5
6
7
8
9
10
11
12
13
Jan-07 Jan-08 Jan-09 Jan-10 Jan-11 Jan-12
Nagacorp SJM Genting Malaysia
2
3
4
5
6
7
8
9
10
11
12
13
Jan-07 Jan-08 Jan-09 Jan-10 Jan-11 Jan-12
LT average: 6.5x
L3Y average: 4.0x
0%
5%
10%
15%
20%
25%
Mar-07 Mar-08 Mar-09 Mar-10 Mar-11
Average yield = 7.7%
Yield averaged at 7.7% over the past 5 years

Formula to fortune NagaCorp - BUY
26 January 2012 [email protected] 30
Appendix 1: RisksThe strong dividend yield makes Nagacorp a highly attractive investment, but there are also numerous risks related to the company, which investor should not overlook.
Potential dilution. The company has recently disclosed the intended acquisition of the NagaCity Walk project, Tourist Garden project and TSCLK Complex project from Tan Sri Dr Chen (CEO and controlling shareholder) with a consideration of US$369m. The transaction is to be funded by equity which will increase the number of outstanding share by 75% and will also bring Dr Chen’s ownership of Naga to 75%. The purchase consideration will not be paid until the projects are completed three to four years later. But the new projects act as a potential overhang, as the future share price movement hinges on profitability of the new project, which we currently have limited visibility on.
Potential sell down. Tan Sr Dr Chen currently owns 60% of the company. With limited freefloat in the market, a sell down from the controlling shareholder could be significantly negative to the share price. Dr Chen has pledged 11.4% to OSK Investment Bank in September 2010. Deterioration of Dr Chen’s personal financial position could trigger a potential sell down of Naga’s shares by OSK, which could negatively impact the company’s share price.
Reduction in dividend payout ratio. Supported by the high dividend payout ratio (70% in 1H11), Nagacorp has been able to deliver attractive dividend yields over the past few years. A reduction in dividend payout ratio due to business slowdown or management’s intention to retain cash will have a significant negative impact to share price.
Change in regulatory environment. Profitability of Nagacorp depends largely on the low tax rate and exclusivity enjoyed by the company. Potential change in the regulatory environment could materially impact the company’s earnings. Under the terms of the casino licence, exclusivity of casino operations will not expire until 2035, and tax arrangements will also be effective until 2018.
Potential competition from Vietnam. Vietnam is the biggest market for Nagacorp. The potential opening up on the Vietnamese gaming market would negatively impact Nagacorp. The negative impact would however be smaller than one would expect as so far the casinos planned in the Ho Tram Strip are for foreigners only. Nagaworld will still be the go-to place for local Vietnamese. The opening up of a casino in Ho Chi Minh, which allows entry by locals, will have a bigger impact to Nagaworld, though the relevant government approvals have not been received yet.
Sovereign risk. Political instability and change in Cambodia government may have an adverse impact on the company. Cambodia also relies on foreign funding. Exchange control restrictions may also be imposed. S&P and Moody’s recognize the risk related to the Cambodian economy and have given the country a B and B2 credit rating.
Money laundering risk. Money laundering is perceived as a high risk at NagaCorp given that it is a casino operating in a developing country with weak infrastructure and poor law enforcement. We, however, believe that the
Existing shareholders will be significantly diluted
post the conclusion of the transaction
Sell down from major shareholders is a
potential share price overhang
There is risk to reduction in dividend payout ratio
Changes in regulatory environment would
materially impact company earnings
There could be potential competition from Vietnam
The Cambodian economy is still premature
There could also be money laundering risk
Formula to fortune NagaCorp - BUY
26 January 2012 [email protected] 31
company has taken appropriate steps to mitigate AML issues. Six internal audits and independent reviews on by Hill & Associates on the effectiveness of its AML controls were conducted before the company’s listing in 2006.
The company also ensure that all mass-market gaming must deal in cash with no cheques issued. On VIP gaming, the company only work with junket operators whose backgrounds and personal details are on record and ensure strict adherence to rules on transferring check-in money to bank accounts from which money was originally received. The maximum bet size of US$24,000 for VIP and mass-market tables are also set in place to make money laundering at NagaCorp a time-consuming and inefficient practise.

Formula to fortune NagaCorp - BUY
26 January 2012 [email protected] 32
Appendix 2: ManagementMr. Timothy Patrick McNally joined the Company in February 2005 as Chairman of the Board. From April 1999 until October 2005, Mr. McNally was the Executive Director of Security and Corporate Legal Services for the Hong Kong Jockey Club, and was a member of the executive Board of Management responsible for corporate governance issues. Prior to his move to Hong Kong, Mr. McNally was a Special Agent of the Federal Bureau of Investigation (“FBI”) for over 20 years. Mr. McNally’s career focused on the investigation and prosecution of serious crimes, including organized crimes, drug trafficking, corruption and fraud.
Tan Sri Datuk Dr Chen Lip Keong is the Chief Executive Officer, founder and controlling shareholder of the Company. Tan Sri Dr Chen has over 30 years of entrepreneurial and business experience. Tan Sri Datuk Dr Chen is a director of all the subsidiaries of the Company. Dr Chen is also the controlling shareholder and president of Karambunai Corp Bhd (tourism in Sabah, East Malaysia), FACB Industries Incorporated Berhad (for stainless steel pipes and fittings manufacturing) and Petaling Tin Berhad (for property development) the companies of which are listed on the Bursa Malaysia Securities Berhad.
Mr. Chen Yepern was appointed an Executive Director on 14 February 2011. Mr. Chen graduated with a Bachelor of Science degree in Finance from The California State University Northridge in 2009 and subsequently worked at Caesar’s Palace in 2010. Mr. Chen is currently a director of NagaCorp (HK) Limited, a wholly owned subsidiary of the Company, and NagaWorld Limited, an indirect wholly owned subsidiary of the Company. He is the son of Tan SriDr. Chen Lip Keong, Chief Executive Officer, founder and controllingshareholder of the Company.
Mr. Philip Lee Wai Tuck is the Chief Financial Officer of the Company and Senior Vice President, Finance & Treasury in NagaWorld Limited, an indirect wholly owned subsidiary of the Company. Mr. Lee is a qualified Certified Public Accountant and has experience in various industries before joining the Group in 2009. Mr. Lee has previously worked in or held directorships in various companies listed on the Bursa Malaysia. Mr. Lee took on senior management positions in financial and management functions with wide experience in accounting, finance, treasury and corporate finance. Mr. Lee is a member of the Malaysian Institute of Certified Public Accountants (MICPA), Malaysian Institute of Accountants (MIA) and CPA Australia.
Mr. Michael Lai Kai Jin was a Non-executive Director from 31 May 2010 to 5 April 2011 and was re-designated as Independent Non-executive Director on 6 April 2011. Mr. Lai graduated from the National University of Singapore with a L.L.B (Hons) Degree in 1994 and was called to the Singapore Bar thefollowing year. He was formerly a partner of Messrs. Khattar Wong, one of the largest law firm in Singapore with offices in Shanghai, Hanoi and Ho Chi Minh. Mr. Lai’s practice focused on marine and admiralty law and has handled numerous legal disputes in the area of international trade and transport.
Mr. Tan Sri Datuk Seri Panglima Abdul Kadir Bin Haji Sheikh Fadzirhas been an Independent Non-executive Director since 17 September 2007. He is a Barrister-At-Law of Lincoln Inn, London. Tan Sri Kadir previously served the Federal Government of Malaysia as Political Secretary, Parliamentary Secretary, Deputy Minister and Minister of Information, Minister of Culture, Art and Tourism and Chairman of Tourism Promotion Board. Tan
Chairman of the Board, focusing on corporate
governance issues
CEO, founder and controlling shareholder of
the company
Company CFO
Non-executive director
Son of Tan Sri Dr Chen
Non-executive director

Formula to fortune NagaCorp - BUY
26 January 2012 [email protected] 33
Sri Kadir also practiced as lawyer at Hisham, Sobri & Kadir and Kadir, Khoo & Aminah. Tan Sri Kadir is currently Chairman and an independent non-executive director of Karambunai Corp Berhad, a company controlled by Tan Sri Dr Chen, the controlling shareholder of the Company
Mr. Lim Mun Kee has been an Independent Non-executive Director since 17 September 2007. He is a qualified Accountant registered with the Malaysian Institute of Accountants and a member of the Malaysian Institute of Certified Public Accountants. Mr. Lim started his career with KPMG Peat Marwick,Malaysia and has over 18 years of professional experience in the field ofauditing, finance at a management level. Mr. Lim is currently Director of several non-listed companies in Malaysia. He is also a Licensed CommissionDealer registered with the Stock Exchange of Malaysia. Mr. Lim is anindependent non-executive director of Petaling Tin Berhad, FACB IndustriesIncorporated Berhad and Karambunai Corp Berhad, all of which are listed inMalaysia and controlled by Tan Sri Dr Chen, the controlling shareholder of the Company.
Non-executive director

Formula to fortune NagaCorp - BUY
26 January 2012 [email protected] 34
Summary financialsYear to 31 December 2009A 2010A 2011CL 2012CL 2013CLSummary P&L forecast (US$m)Revenue 118 151 222 261 291Op Ebitda 38 48 109 132 150Op Ebit 28 34 93 116 134Interest income - - - - -Interest expense 0 0 0 0 0Other items 0 0 0 0 0Profit before tax 28 34 93 116 134Taxation (2) (4) (4) (4) (5)Minorities/Pref divs - - - - -Net profit 25 30 89 111 129
Summary cashflow forecast (US$m)Operating profit 28 34 93 116 134Operating adjustments - - - - -Depreciation/amortisation 10 14 15 16 16Working capital changes - - - - -Net interest/taxes/other 6 30 0 4 2Net operating cashflow 44 78 109 136 152Capital expenditure (34) (24) (25) (15) (12)Free cashflow 10 54 84 121 140Acq/inv/disposals (4) (16) (19) - -Int, invt & associate div - - - - -Net investing cashflow (38) (40) (44) (15) (12)Increase in loans - - - - -Dividends (8) (38) (31) (74) (83)Net equity raised/other 7 8 16 0 0Net financing cashflow (1) (30) (14) (74) (83)Incr/(decr) in net cash 5 8 50 48 57Exch rate movements - - - - -Opening cash 10 15 23 73 121Closing cash 15 23 73 121 178
Summary balance sheet forecast (US$m)Cash & equivalents 15 23 73 121 178Debtors 47 25 24 19 14Inventories 2 6 6 6 6Other current assets 4 21 41 41 41Fixed assets 149 156 168 170 169Intangible assets 91 87 84 80 77Other term assets 5 4 5 5 5Total assets 313 323 400 441 489Short-term debt - - - - -Creditors 16 14 16 19 21Other current liabs 9 0 32 37 44Long-term debt/CBs - - - - -Provisions/other LT liabs 0 0 0 0 0Minorities/other equity 0 0 0 0 0Shareholder funds 288 309 352 385 424Total liabs & equity 313 323 400 441 489
Ratio analysisRevenue growth (% YoY) (39.1) 27.8 47.4 17.5 11.7Ebitda growth (% YoY) (23.1) 26.5 126.6 21.7 13.7Ebitda margin (%) 32.2 31.8 49.0 50.7 51.6Net profit margin (%) 21.6 20.0 40.3 42.7 44.3Dividend payout (%) 60.1 102.5 70.0 70.0 70.0Effective tax rate (%) 7.7 11.4 4.2 3.9 3.7Ebitda/net int exp (x) - - - - -Net debt/equity (%) (5.2) (7.4) (20.8) (31.4) (42.0)ROE (%) 9.1 10.1 27.1 30.2 31.9ROIC (%) 9.6 10.8 31.7 41.0 50.5EVA®/IC (%) (3.6) (2.3) 18.6 27.9 37.4Source: CLSA Asia-Pacific Markets
Expect margin expansion drive by improvement in
gaming mix
Cash balance to increase to US$178m in 2013
Strong free cashflow of over US$100m in 2012-13
Expecting 15% EbitdaCagr in 2012-14

Formula to fortune NagaCorp - BUY
26 January 2012 [email protected] 35
Key to CLSA investment rankings: BUY = Expected to outperform the local market by >10%; O-PF = Expected to outperform the local market by 0-10%; U-PF = Expected to underperform the local market by 0-10%; SELL = Expected to underperform the local market by >10%. Performance is defined as 12-month total return (including dividends).
©2011 CLSA Asia-Pacific Markets (“CLSA”). Note: In the interests of timeliness, this document has not been edited.
The analyst/s who compiled this publication/communication hereby state/s and confirm/s that the contents hereof truly reflect his/her/their views and opinions on the subject matter and that the analyst/s has/have not been placed under any undue influence, intervention or pressure by any person/s in compiling such publication/ communication.
The CLSA Group, CLSA's analysts and/or their associates do and from time to time seek to establish business or financial relationships with companies covered in their research reports. As a result, investors should be aware that CLSA and/or such individuals may have one or more conflicts of interests that could affect the objectivity of this report. The Hong Kong Securities and Futures Commission requires disclosure of certain relationships and interests with respect to companies covered in CLSA's research reports and the securities of which are listed on The Stock Exchange of Hong Kong Limited and such details are available at www.clsa.com/member/research_disclosures/. Disclosures therein include the position of the CLSA Group only and do not reflect those of Credit Agricole Corporate & Investment Bank and/or its affiliates. If investors have any difficulty accessing this website, please contact [email protected] or (852) 2600 8111. If you require disclosure information on previous dates, please contact [email protected]
IMPORTANT: The content of this report is subject to and should be read in conjunction with the disclaimer and CLSA's Legal and Regulatory Notices as set out at www.clsa.com/disclaimer.html, a hard copy of which may be obtained on request from CLSA Publications or CLSA Compliance Group, 18/F, One Pacific Place, 88 Queensway, Hong Kong, telephone (852) 2600 8888. 01/01/2011