
Formatting Blackline Masters - Tangipahoa Parish · Web viewName:_____Date:_____ Line of Best...
206
Blackline Masters, Math Essentials Page 1 Louisiana Comprehensive Curriculum, Revised 2008 Math Essentials
Transcript of Formatting Blackline Masters - Tangipahoa Parish · Web viewName:_____Date:_____ Line of Best...

Blackline Masters, Math Essentials Page 1Louisiana Comprehensive Curriculum, Revised 2008
Math Essentials

Most of the math symbols in this document were made with Math Type® software. Specific fonts must be installed on the user’s computer for the symbols to be read. It is best to use the pdf format of a document if a printed copy is needed.
To copy and paste from the Word document, download and install the Math Type®
for Windows Font from http://www.dessci.com/en/dl/fonts/default.asp on each computer on which the document will be used.

Unit 1, Activity 4, Shopping
Name:_________________________________________Date:_______________
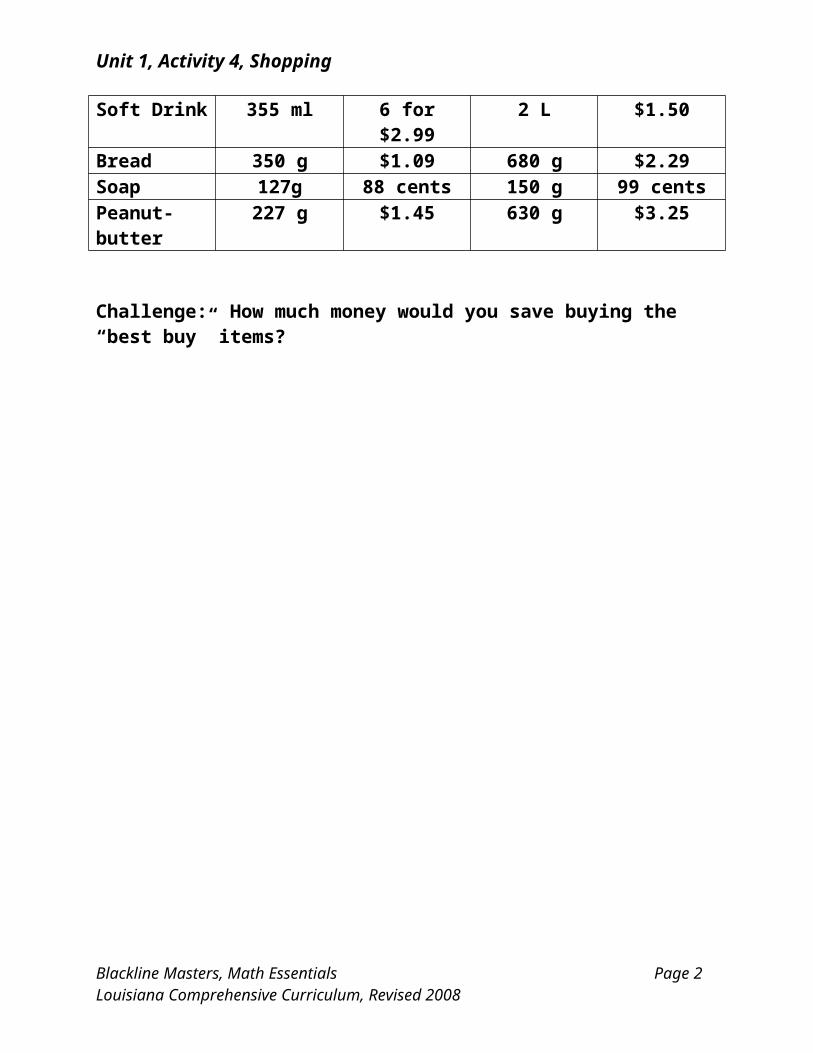
It is Saturday morning and your turn to do the grocery shopping. Below is the list of items you need to purchase along with two brands of each item available for purchase at your local store.
First, circle which items, Brand A or Brand B, you think will provide the best buy.
Next, use proportional reasoning to determine the best buy for each item. Put a checkmark next to the item, either Brand A or Brand B.
Compare your first choices to those determined by proportional reasoning. How many of your first choices were accurate?
All work should be neatly completed on separate loose-leaf paper and attached to this page.
Item Brand A Brand BSize Cost Size Cost
Chips 382 g $3.49 450 g $5.00Salsa 280 g $1.80 439 g $2.50Pickles 750 ml $1.50 800 ml $2.00Hamburger 1.5 kg $3.50 2.25 kg $5.00Cheese 340 g 2 for $3.00 1 kg $5.00Apples 10 $2.00 per dz. 10 2 for 39 centsJelly 340 g $1.25 510 g $1.50Soft Drink 355 ml 6 for $2.99 2 L $1.50Bread 350 g $1.09 680 g $2.29Soap 127g 88 cents 150 g 99 centsPeanut-butter 227 g $1.45 630 g $3.25
Challenge: How much money would you save buying the “best buy” items?
Blackline Masters, Math Essentials Page 1Louisiana Comprehensive Curriculum, Revised 2008
Unit 1, Activity 4, Shopping with Answers
Name:_________________________________________Date:_______________
It is Saturday morning and your turn to do the grocery shopping. Below is the list of items you need to purchase along with two brands of each item available for purchase at your local store.
First, circle which items, Brand A or Brand B, you think will provide the best buy.
Next, use proportional reasoning to determine the best buy for each item. Put a checkmark next to the item, either Brand A or Brand B.
Compare your first choices to those determined by proportional reasoning. How many of your first choices were accurate?
All work should be neatly completed on separate loose-leaf paper and attached to this page.
Item Brand A Brand BSize Cost Size Cost
Chips 382 g $3.49 450 g $5.00Salsa 280 g $1.80 439 g $2.50Pickles 750 mL $1.50 800 mL $2.00Hamburger 1.5 kg $3.50 2.25 kg $5.00Cheese 340 g 2 for $3.00 1 kg $5.00Apples 10 $2.00 per dz. 10 2 for 39 centsJelly 340 g $1.25 510 g $1.50Soft Drink 355 ml 6 for $2.99 2 L $1.50Bread 350 g $1.09 680 g $2.29Soap 127g 88 cents 150 g 99 centsPeanut-butter 227 g $1.45 500 g $3.25
Challenge: How much money would you save buying the “best buy” items?
Blackline Masters, Math Essentials Page 2Louisiana Comprehensive Curriculum, Revised 2008

Unit 1, Activity 5, Blueprints
Name:___________________________________________Date:___________
Using a standard ruler and the scale factor of 1 inch = 8 feet, determine the dimensions of each of the rooms and the dimensions of the house, including porch. Determine the area and perimeter of each room as well.
Room Actual Dimensions
Actual Area Actual Perimeter
PorchLiving RoomKitchenGarageHallBedroom #2Master BedroomBathUtility RoomHouse
Blackline Masters, Math Essentials Page 3Louisiana Comprehensive Curriculum, Revised 2008
Porch
Bedroom #2Hall Master
Bedroom
KitchenLiving room
Garage
Bath Utility room

Unit 1, Activity 5, Blueprints with Answers
Name:___________________________________________Date:___________
Using a standard ruler and the scale factor of 1 inch = 8 feet, determine the dimensions of each of the rooms and the dimensions of the house (including porch). Determine the area and perimeter of each room as well.
Room Actual Dimensions
Actual Area Actual Perimeter
Porch 6 feet x 24 feet 144 square feet 60 feetLiving Room 12 feet x 14 feet 168 square feet 52 feetKitchen 12 feet x 10 feet 120 square feet 44 feetGarage 12 feet x 20 feet 240 square feet 64 feetHall 8 feet x 4 feet 32 square feet 24 feetBedroom #2 16 feet x 16 feet 256 square feet 64 feetMaster Bedroom 16 feet x 20 feet 320 square feet 72 feetBath 6 feet x 12 feet 72 square feet 36 feetUtility Room 6 feet x 8 feet 48 square feet 28 feetHouse 34 feet x 44 feet 1496 square feet 156 feet
Blackline Masters, Math Essentials Page 4Louisiana Comprehensive Curriculum, Revised 2008
Porch
Bedroom #2Hall Master
Bedroom
KitchenLiving room
Garage
Bath Utility room

Unit 1, Activity 6, Get in Gear!
Name:____________________________________________Date:____________
Answer all questions in your notebook. You must show all work.
Gear ratios are directly proportional to the speeds of the crankshaft (the gear turned by the motor) and the drive axle shaft in an automobile. In layman’s terms, how fast the motor is going is proportional to how fast the wheels on the car are turning. The equation can be written as:
1) If the gear ratio on a car is 3.5:1 and the crankshaft rpm is 1500, what is the drive axle rpm?
2) If the crankshaft’s revolutions per minute are 2800 and the drive axle’s revolutions per minute are 540. What is the gear ratio of the car?
This proportion holds true for all machinery. Let’s relate this to other types of machinery that use gears.
3) A larger gear with 40 teeth turning 1600 rpm is in mesh with a smaller gear of 10 teeth. Find the rpm of the smaller gear.
4) A gear of 15 teeth turning 180 rpm is driving a gear of 60 teeth. Find the rpm of the driven gear.
5) Two gears have a gear ratio of 2.4:1. If the larger gear has 72 teeth, how many teeth will the smaller gear have?
6) In a series of three gears A, B, and C, gears A and B are proportional to gears B and C. If gear A has 18 teeth and gear C has 8 teeth, how many teeth does gear B have?
Belts connected by pulleys are also used in automobiles. One area is the fan belt which turns the fan that cools the radiator, which is connected to a pulley turned by the motor.
7) If the motor pulley has a 5 inch diameter and the fan pulley has a 4 inch diameter, is the motor or the fan turning faster? Explain.
8) The motor pulley in problem 7 also turns the compressor for the air conditioner. How fast is the compressor pulley turning if it is 3.5 inches in diameter, if the motor pulley speed is 2000 rpm?
9) If the motor pulley in problem 7 is turning the compressor pulley at 1400 rpm, how big is the compressor pulley if the motor pulley speed is 2800 rpm?
Blackline Masters, Math Essentials Page 5Louisiana Comprehensive Curriculum, Revised 2008

Unit 1, Activity 8, Determining Salaries
Name:____________________________________________Date:____________
Answer all questions in your notebook. You must show all work.
Gear ratios are directly proportional to the speeds of the crankshaft (the gear turned by the motor) and the drive axle shaft in an automobile. In layman’s terms how fast the motor is going is proportional to how fast the wheels on the car are turning. The equation can be written as:
1) If the gear ratio on a car is 3.5:1 and the crankshaft rpm is1500, what is the drive axle rpm? (Approximately 429 rpm)
2) If the crankshaft’s revolutions per minute are 2800 and the drive axle’s revolutions per minute are 540. What is the gear ratio of the car? (Approximately 5.2:1)
This proportion holds true for all machinery. Let’s relate this to other types of machinery that use gears.
3) A larger gear with 40 teeth turning 1600 rpm is in mesh with a smaller gear of 10 teeth. Find the rpm of the smaller gear. (6400 rpm)
4) A gear of 15 teeth turning 180 rpm is driving a gear of 60 teeth. Find the rpm of the driven gear. (45 rpm)
5) Two gears have a gear ratio of 2.4:1. If the larger gear has 72 teeth, how many teeth will the smaller gear have? (30 teeth)
6) In a series of three gears A, B, and C, gears A and B are proportional to gears B and C. If gear A has 18 teeth and gear C has 8 teeth, how many teeth does gear B have? (12 teeth)
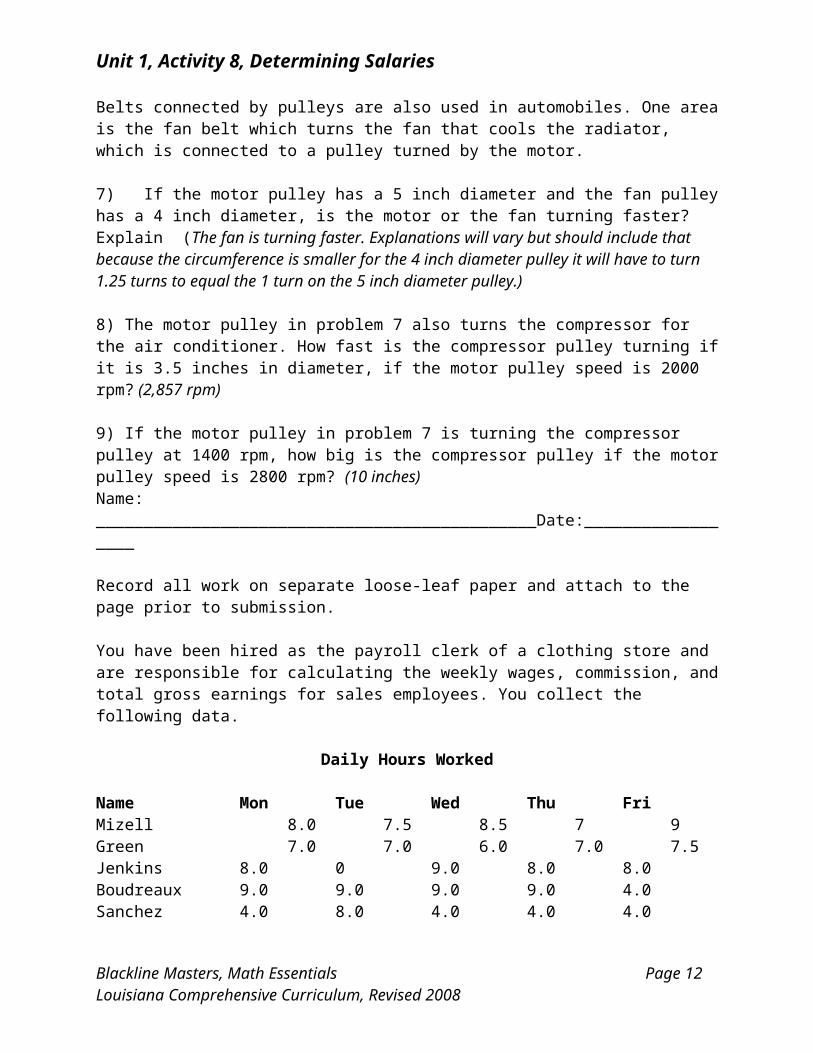
Belts connected by pulleys are also used in automobiles. One area is the fan belt which turns the fan that cools the radiator, which is connected to a pulley turned by the motor.
7) If the motor pulley has a 5 inch diameter and the fan pulley has a 4 inch diameter, is the motor or the fan turning faster? Explain (The fan is turning faster. Explanations will vary but should include that because the circumference is smaller for the 4 inch diameter pulley it will have to turn 1.25 turns to equal the 1 turn on the 5 inch diameter pulley.)
8) The motor pulley in problem 7 also turns the compressor for the air conditioner. How fast is the compressor pulley turning if it is 3.5 inches in diameter, if the motor pulley speed is 2000 rpm? (2,857 rpm)
9) If the motor pulley in problem 7 is turning the compressor pulley at 1400 rpm, how big is the compressor pulley if the motor pulley speed is 2800 rpm? (10 inches)
Blackline Masters, Math Essentials Page 6Louisiana Comprehensive Curriculum, Revised 2008

Unit 1, Activity 8, Determining Salaries
Name: ______________________________________________Date:__________________
Record all work on separate loose-leaf paper and attach to the page prior to submission.
You have been hired as the payroll clerk of a clothing store and are responsible for calculating the weekly wages, commission, and total gross earnings for sales employees. You collect the following data.
Daily Hours Worked
Name Mon Tue Wed Thu FriMizell 8.0 7.5 8.5 7 9Green 7.0 7.0 6.0 7.0 7.5Jenkins 8.0 0 9.0 8.0 8.0Boudreaux 9.0 9.0 9.0 9.0 4.0Sanchez 4.0 8.0 4.0 4.0 4.0
Daily Sales
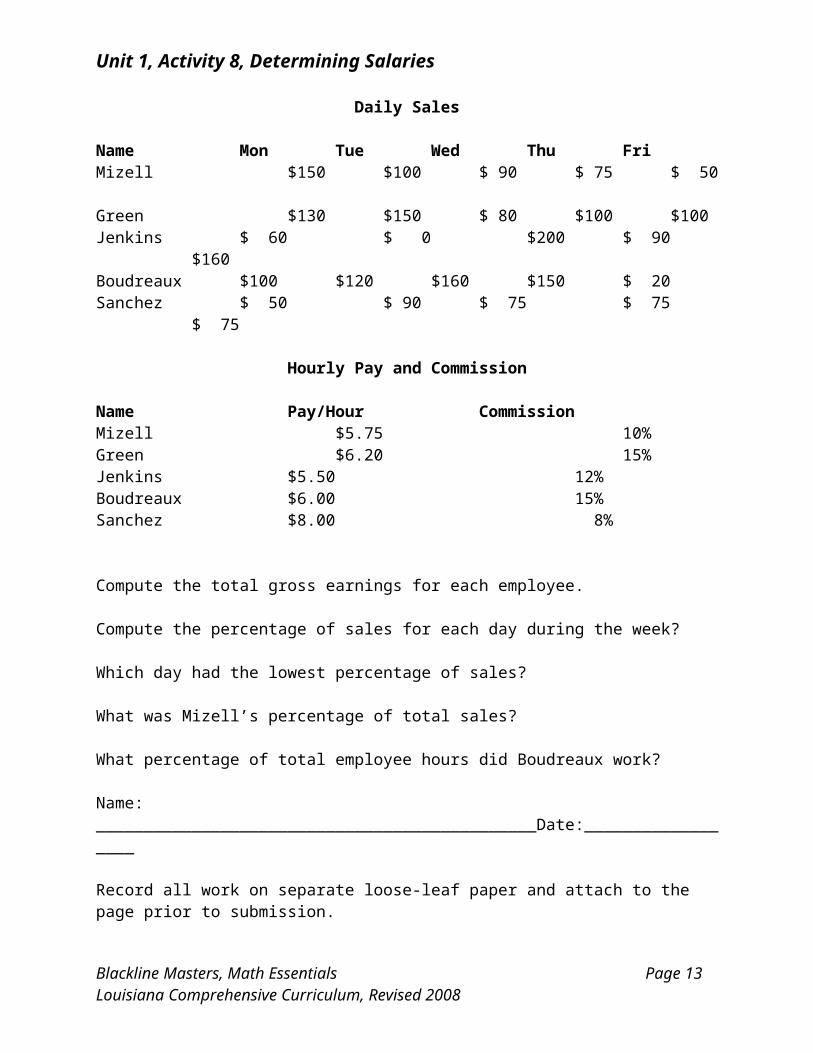
Name Mon Tue Wed Thu FriMizell $150 $100 $ 90 $ 75 $ 50Green $130 $150 $ 80 $100 $100Jenkins $ 60 $ 0 $200 $ 90 $160Boudreaux $100 $120 $160 $150 $ 20 Sanchez $ 50 $ 90 $ 75 $ 75 $ 75
Hourly Pay and Commission
Name Pay/Hour CommissionMizell $5.75 10%Green $6.20 15%Jenkins $5.50 12%Boudreaux $6.00 15%Sanchez $8.00 8%
Compute the total gross earnings for each employee.
Compute the percentage of sales for each day during the week?
Which day had the lowest percentage of sales?
What was Mizell’s percentage of total sales?
What percentage of total employee hours did Boudreaux work?
Blackline Masters, Math Essentials Page 7Louisiana Comprehensive Curriculum, Revised 2008

Unit 1, Activity 8, Determining Salaries
Name: ______________________________________________Date:__________________
Record all work on separate loose-leaf paper and attach to the page prior to submission.
You have been hired as the payroll clerk of a clothing store and are responsible for calculating the weekly wages, commission, and total gross earnings for sales employees. You collect the following data.
Daily Hours Worked
Name Mon Tue Wed Thu FriMizell 8.0 7.5 8.5 7 9Green 7.0 7.0 6.0 7.0 7.5Jenkins 8.0 0 9.0 8.0 8.0Boudreaux 9.0 9.0 9.0 9.0 4.0Sanchez 4.0 8.0 4.0 4.0 4.0
Daily Sales
Name Mon Tue Wed Thu FriMizell $150 $100 $ 90 $ 75 $ 50Green $130 $150 $ 80 $100 $100Jenkins $ 60 $ 0 $200 $ 90 $160Boudreaux $100 $120 $160 $150 $ 20 Sanchez $ 50 $ 90 $ 75 $ 75 $ 75
Hourly Pay and Commission
Name Pay/Hour CommissionMizell $5.75 10%Green $6.20 15%Jenkins $5.50 12%Boudreaux $6.00 15%Sanchez $8.00 8%
Compute the total gross earnings for each employee. (Mizell $276.50, Green 297.90,Jenkins $242.70, Boudreaux $322.50, Sanchez $221.20)
Compute the percentage of sales for each day during the week? (Monday 20%, Tuesday 18%, Wednesday 25%, Thursday 20%, Friday 17%)
Which day had the lowest percentage of sales? (Friday 17%)
What was Mizell’s percentage of total sales? (465/2450 or 19%) What percentage of total employee hours did Boudreaux work? (40/171.5 or 23%)
Blackline Masters, Math Essentials Page 8Louisiana Comprehensive Curriculum, Revised 2008

Unit 1, Activity 9, Estimating Populations
Name:___________________________________________________Date:________________
Deer hunting is very popular in Louisiana but is limited to only a few months each year. It is important for wildlife rangers to determine the deer population each year in order to ensure the deer population remains stable.
In this activity, you will be simulating a method that wildlife rangers use to estimate the population. The rangers scout out a number of deer in various areas of Louisiana and count the number of deer that have been previously tagged. They then compare that number with the total number of deer observed. They repeat this activity numerous times throughout the year. Using ratio and proportion, the rangers then calculate an estimate of the number of deer in a given area of Louisiana.
You will record your data in the table below:
1) Take out one small scoop of beans and mark each Initial # marked _____________bean with an x. Record the number of beans marked.
2) Return marked beans to the bag and then shakelightly.
3) Take out one small scoop of beans and count both themarked and unmarked beans separately. Record these numbers in the table to the right.
4) Repeat steps 2 and 3 until you have completed at least 10 scoops.
Set up the proportion
Fill in the proportion equation and then solve for the unknown estimated number in population.
Estimated number of total beans _______________. Now count out all beans in the bag and compare the estimated number of total beans with the actual number of total beans.
Do you think this is a good way to estimate populations? Why or why not?
Scoop Marked Unmarked12345678910

Unit 2, Activity 4, Out of Order
Name:____________________________________________________Date:_______________
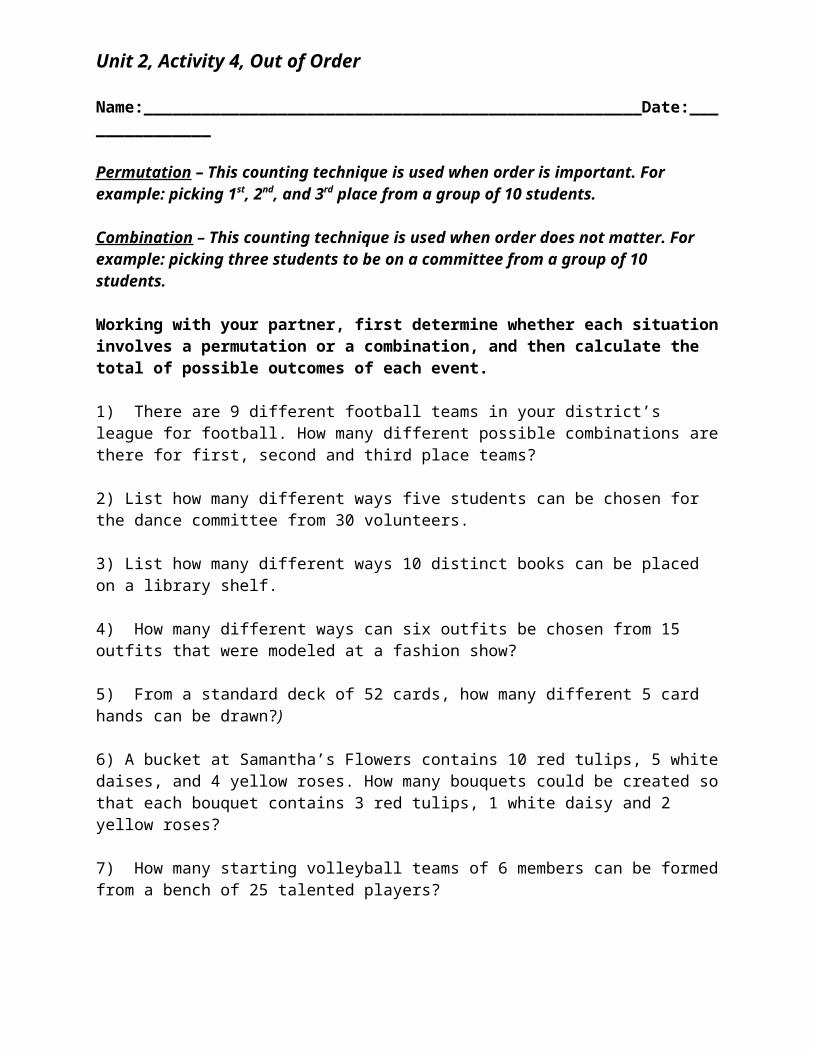
Permutation – This counting technique is used when order is important. For example: picking 1st, 2nd, and 3rd place from a group of 10 students.
Combination – This counting technique is used when order does not matter. For example: picking three students to be on a committee from a group of 10 students.
Working with your partner, first determine whether each situation involves a permutation or a combination, and then calculate the total of possible outcomes of each event.
1) There are 9 different football teams in your district’s league for football. How many different possible combinations are there for first, second and third place teams?
2) List how many different ways five students can be chosen for the dance committee from 30 volunteers.
3) List how many different ways 10 distinct books can be placed on a library shelf.
4) How many different ways can six outfits be chosen from 15 outfits that were modeled at a fashion show?
5) From a standard deck of 52 cards, how many different 5 card hands can be drawn?)
6) A bucket at Samantha’s Flowers contains 10 red tulips, 5 white daises, and 4 yellow roses. How many bouquets could be created so that each bouquet contains 3 red tulips, 1 white daisy and 2 yellow roses?
7) How many starting volleyball teams of 6 members can be formed from a bench of 25 talented players?
8) How many different ways can the field of 10 contestants be narrowed down to first, second, and third place?
9) Pick 3 is a popular scratch off game. How many different ways can three numbers be chosen from 0 to 9?
10) How many ways can two algebra books, 4 geometry books, 5 calculus books and 3 physics books be arranged on a shelf by subject?
Challenge: How many ways can a committee of 10 men and 10 women be chosen from a group of 25 men and 20 women

Unit 2, Activity 4, Out of Order
Name:____________________________________________________Date:_______________
Permutation – This counting technique is used when order is important. For example: picking 1st, 2nd, and 3rd place from a group of 10 students.
Combination – This counting technique is used when order does not matter. For example: picking three students to be on a committee from a group of 10 students.
Working with your partner, first determine whether each situation involves a permutation or a combination and then calculate the total of possible outcomes of each event.
1) There are 9 different football teams in your district’s league for football. How many different possible combinations are there for first, second and third place teams? (permutation, 84)
2) List how many different ways five students can be chosen for the dance committee from 30 volunteers? (combination, 142, 506)
3) List how many different ways 10 distinct books can be placed on a library shelf. (permutation 3, 628, 800)
4) How many different ways can six outfits be chosen from 15 outfits that were modeled at a fashion show? (combination, 5005)
5) From a standard deck of 52 cards, how many different 5 card hands can be drawn? (combination, 2,598,960)
6) A bucket at Samantha’s Flowers contains 10 red tulips, 5 white daises, and 4 yellow roses. How many bouquets could be created so that each bouquet contains 3 red tulips, 1 white daisy and 2 yellow roses? (combination, 3600)
7) How many starting volleyball teams of 6 members can be formed from a bench of 25 talented players? (combination, 177,100)
8) How many different ways can the field of 10 contestants be narrowed down to first, second, and third place? (permutation, 720)
9) Pick 3 is a popular scratch off game. How many different ways can three numbers be chosen from 0 to 9? (permutation, 1000)
10) How many ways can two algebra books, 4 geometry books, 5 calculus books and 3 physics books be arranged on a shelf by subject? (combination, 829,440)
Challenge: How many ways can a committee of 10 men and 10 women be chosen from a group of 25 men and 20 women? (combination, 603,923,022,600)
Unit 2, Activity 4, Out of Order
Name:_______________________________________________________Date:_____________
Fill in all the possible outcomes of rolling two dice in the chart below and then answer the questions below the chart. For example, under 7 you could record (3,4) and (4,3) as these are two possible ways to toss a 7.
2 3 4 5 6 7 8 9 10 11 12
1. How many total possible outcomes are there?
2. Which number(s) has the greatest number of possible outcomes?
3. Which number(s) has the lowest number of possible outcomes?
4. Did you notice a pattern in the number of ways each different outcome occurs? If not, look for one. What is the pattern?
5. Determine the probability of tossing each of the sums and record it in the line below the chart.
6. Add up the probabilities for all the sums. What is the total?
Answer the next set of questions based upon tossing a penny and a nickel at the same time.
7. What are the possible outcomes for tossing the two coins?
8. What is the probability of each of these outcomes?
9. How is the probability of tossing two coins related to the tossing of one coin?
10. If we added another coin to the toss how many possible outcomes would exist?
11. How would the probability of each of the three coin tosses compare to a toss of one coin?
Unit 2, Activity 6, How Probable Is It? with Answers
Name:_______________________________________________________Date:_____________
Fill in all the possible outcomes of rolling two dice in the chart below and then answer the questions below the chart. For example, under 7 you could record (3,4) and (4,3) as these are two possible ways to toss a 7.
2 3 4 5 6 7 8 9 10 11 12(1,1) (2,1)
(1,2)(2,2)(3,1)(1,3)
(2,3)(3,2)(4,1)(1,4)
(3,3)(4,2)(2,4)(5,1)(1,5)
(3,4)(4,3)(5,2)(2,5)(1,6)(6,1)
(4,4)(5,3)(3,5)(6,2)(2,6)
(5,4)(4,5)(6,3)(3,6)
(5,5)(6,4)(4,6)
(6,5)(5,6)
(6,6)
1/36 1/18 1/12 1/9 5/36 1/6 5/36 1/9 1/12 1/18 1/36
1. How many total possible outcomes are there? (36)
2. Which number(s) has the greatest number of possible outcomes? (7)
3. Which number(s) has the lowest number of possible outcomes? (2 and 12)
4. Did you notice a pattern in the number of ways each different outcome occurs? If not, look for one. What is the pattern? (Yes, the outcomes are symmetrical with 6 outcomes for 7 and then reducing by one as the outcomes move away from the center.)
5. Determine the probability of tossing each of the sums and record it in the line below the chart. (see above)
6. Add up the probabilities for all the sums. What is the total? (1)
Answer the next set of questions based upon tossing a penny and a nickel at the same time.
7. What are the possible outcomes for tossing the two coins? (HH, HT, TH, TT)
8. What is the probability of each of these outcomes? ( ¼ for each outcome)
9. How is the probability of tossing two coins related to the tossing of one coin? (The probability of tossing two coins is half the probability of tossing one coin)
10. If we added another coin to the toss how many possible outcomes would exist? (8)
11. How would the probability of each of the three coin tosses compare to a toss of one coin? (Each outcome probability would be ¼ as much of a singular coin toss)

Unit 2, Activity 6, How Probable Is It? with Answers
Name:_______________________________________________Date:_______________
Pair up with another student to complete this activity. Person A will roll the dice. Person B will mark the outcome in the chart below left. Stop after 36 tosses and record how many times each possible outcome occurred in the chart below right. Then answer the questions below the chart.
Roll Outcome12345
6
2 3 4 5 6 7 8 9 10 11 12
1. Calculate the experimental probability of each outcome above.
2. Do the probability calculations match those determined in the previous activity How Probable Is It? BLM. If not, why do you think this occurred?
3. Record the total of each of your outcomes on the chart on the board.
4. Why do you think 36 tosses were required?

Unit 2, Activity 6, How Probable Is It? with Answers
789101112131415161718192021222324252627282930313233343536
Name:_____________________________________________Date:________________
Using your knowledge of mutually exclusive probabilities, determine the probabilities of the following events.
1. A student only takes calculus._________
2. A student only takes physics__________
3. A student takes both physics and calculus __________
Calculus 15
Physics110
20
155

Unit 2, Activity 6, How Probable Is It? with Answers
4. A student does not take physics or calculus __________
Interpret the above graph and summarize the probability of the data presented. (Hint: Use the information obtained by answering questions 1 – 4).
5. The spinner will land on blue __________
6. The spinner will land on red _________
7. The spinner will land on green ________
8. The spinner will land on yellow ________
9. The spinner will land on blue or red ________
10. The spinner will not land on white _________
Summarize the probability of the data presented. (Hint: Use the information obtained by answering questions 5-10).
Name:_____________________________________________Date:________________
Using your knowledge of mutually exclusive probabilities, determine the probabilities of the following events.
1. A student only takes calculus.
2. A student only takes physics.
3. A student takes both
physics and calculus.
Red Blue
Green Red
Calculus 15
Physics110
20
155

Unit 2, Activity 6, How Probable Is It? with Answers
4. A student does not take
physics or calculus.
Interpret the above graph and summarize the probability of the data presented. (Hint: Use the information obtained by answering questions 1 – 4).
5. The spinner will land on blue.
6. The spinner will land on red.
7. The spinner will land on green.
8. The spinner will land on yellow. (0)
9. The spinner will land on blue
or red.
10. The spinner will not land on White. (1)
Summarize the probability of the data presented. (Hint: Use the information obtained by answering questions 5-10).
Red Blue
Green Red
300 students were interviewed. 1 out of every 20 students only took calculus. 11 out of every 30 students only took physics. 1 out of every 15 students took both calculus and physics. 31 out of every 60 students did not take physics or calculus.
Each time the spinner is spun the probability of it landing on red is 50%. Blue and green are equally likely (25%). It can never land on white or yellow.
Unit 2, Activity 10, You Can Bet on It
Name:____________________________________________________Date:______________
1) The local meteorologist states that there is a 40% chance of rain today. What are the odds that rain will occur?
2) The odds of your failing science class are 3:2. What is the probability of your passing the class?
3) Given the odds of your earning an A on the final exam in mathematics are 1:4. What is the probability you will earn an A?
4) If there is a 20% probability of Susie becoming president of the chess club and a 40% probability of Bobby becoming president, what are the odds that neither Susie nor Bobby will become president of the chess club?
5) Odds are 2:1 that you will win the next tennis match. What is the probability of your winning the tennis match? Do these odds seem reasonable? Why or why not?
6) The probability of your stock rising over the next year is . Your broker tells you this means
the odds of your stock rising is 50:50. Is he correct? Explain your reasoning.
7) Your co-worker is trying to sell you a raffle ticket. The tickets are $1.00 a piece or 6 for $5.00. If 100 tickets are sold, how does getting the extra ticket for $5.00 affect your odds and probability of winning?
8) The odds that your home will be flooded over the next 25 years are 2:10. What is the probability of your home flooding?
9) The odds of a hurricane in the Gulf of Mexico hitting the Louisiana coastline are 1:15. What does this mean?
10) A friend states that probability and odds are the same thing. Would you agree or disagree with this statement? Explain

Name:____________________________________________________Date:______________
1) The local meteorologist states that there is a 40% chance of rain today. What are the odds that rain will occur? (40:60)
2) The odds of your failing science class are 3:2. What is the probability of your passing the class? (3/5 or 60%)
3) Given the odds of your earning an A on the final exam in mathematics are 1:4. What is the probability you will earn an A? (1/5 or 20%)
4) If there is a 20% probability of Susie becoming president of the chess club and a 40% probability of Bobby becoming president, what are the odds that neither Susie nor Bobby will become president of the chess club. (2:3)
5) Odds are 2:1 that you will win the next tennis match. What is the probability of your winning the tennis match? Do these odds seem reasonable? Why or why not? (2/3 or approximately 66%. Yes this is reasonable because the odds are that out of 3 matches you will win 2 of them)
6) The probability of your stock rising over the next year is . Your broker tells you this means
the odds of your stock rising is 50:50. Is he correct? Explain your reasoning. (Yes, because a probability of ½ indicates that you have one favorable outcome for each unfavorable one, therefore a 50:50 chance is correct)
7) Your co-worker is trying to sell you a raffle ticket. The tickets are $1.00 a piece or 6 for $5.00. If 100 tickets are sold, how does getting the extra ticket for $5.00 affect your odds and probability of winning? (The odds increase from 5:95 to 6:94, increasing your probability 1%)
8) The odds that your home will be flooded over the next 25 years are 2:10. What is the probability of your home flooding? (1/6 or approximately 16%)
9) The odds of a hurricane in the Gulf of Mexico hitting the Louisiana coastline are 1:15. What does this mean? (This indicates that for every 16 storms that are in the Gulf of Mexico, only one will hit the coastline of Louisiana.)
10) A friend states that probability and odds are the same thing. Would you agree or disagree with this statement? Explain. (They are not the same. Probability is the ratio of favorable outcomes to total possible outcomes, while odds are the ratio of favorable outcomes to unfavorable outcomes.)
Unit 3, Activity 3, Displaying Quantitative Data
Name:___________________________________________________Date:________________
Use the following data to create a histogram of grade distributions for 1st period and 5th period mathematics class. (Use an x-scale of 8 points). Check your results using the TI-83/84 graphing calculator. Then answer the questions at the bottom of the page. (Hint: Be certain your Xmin and Xmax includes all data values).
1st period scores: 92, 58, 79, 85, 65, 95, 81, 69, 85, 88, 72, 83, 75, 95, 89, 78, 84, 78, 85, 88
5th period scores: 75, 78, 79, 81, 84, 93, 70, 97, 96, 77, 94, 95, 99, 100, 56, 65, 79, 97, 71, 98
1st Period Scores 5th Period Scores
On a separate sheet of paper answer the following questions:
1) Briefly describe each of the histograms, noting which period had the highest and lowest score.
2) Compare the scores of each of the periods. Are they similar or different and why?
3) How would changing the x-scale to a scale of 15 points affect the histograms? Use the graphing calculator to view the change in scale.
4) How would changing the x-scale to a scale of 3 points affect the histograms? Use the graphing calculator to view the change in scale.
5) Would you state the scores of the 1st period are better or worse than 5th period? Explain.
6) What scale would you recommend be used for the histograms and why?

Unit 3, Activity 3, Displaying Quantitative Data with Answers
Name:___________________________________________________Date:________________
Use the following data to create a histogram of grade distributions for 1st period and 5th period mathematics class. (Use an x-scale of 8 points). Check your results using the TI-83/84 graphing calculator. Then answer the questions at the bottom of the page. (Hint: Be certain your Xmin and Xmax includes all data values).
1st period scores: 92, 58, 79, 85, 65, 95, 81, 69, 85, 88, 72, 83, 75, 95, 89, 78, 84, 78, 85, 88
5th period scores: 75, 78, 79, 81, 84, 93, 70, 97, 96, 77, 94, 95, 99, 100, 56, 65, 79, 97, 71, 98
1st Period Scores
10 9 8 7 6 5 4 3 2 1
55.5 63.5 71.5 79.5 87.5 95.5 103.5
5th Period Scores
10 9 8 7 6 5 4 3 2 1
55.5 63.5 71.5 79.5 87.5 95.5 103.5
On a separate sheet of paper answer the following questions:
1) Briefly describe each of the histograms, noting which period had the highest and lowest score. The lowest score was in the 55.5 to 63.5 interval. The highest score in 1st period was in the 87.5 to 95.5 interval, while in 5th period the high score was in 95.5 to 103.5 interval. 1st period scores indicate a few people scored below 71.5 but for the most part scores were distributed evenly between 71.5 and 95.5. 5th period scores had a lot more fluctuation, with most of the scores in the 71.5 to 79.5 range and in the 95.5 to 103.5 range.
2) Compare the scores of each of the periods. Are they similar or different and why?The scores are different. 1st period scores indicate the scores are evenly distributed. 5th period scores fluctuate.
3) How would changing the x-scale to a scale of 15 points affect the histograms? Use the graphing calculator to view the change in scale.

Unit 3, Activity 3, Displaying Quantitative Data with Answers
You would only have three intervals with data, and it would be difficult to determine how the scores were distributed. 4) How would changing the x-scale to a scale of 3 points affect the histograms? Use the graphing calculator to view the change in scale. It gives a more detailed view of the data.
5) Would you state the scores of the 1st period are better or worse than 5th period? Explain.The scores of 5th period appear to be better as there are a greater number of students scoring at the upper end of the grade scale.
6) What scale would you recommend be used for the histograms and why?Answers will vary. Examples might be:: I like the 8 point scale because that is how the grades are distributed for A, B, C, D. I like a 5 point scale because it gives you a clearer picture of how the grades are distributed. Note: The x-scale should be between 5 and 10, anything larger gives less detail and anything smaller gives too much detail.

Unit 3, Activity 5, Creating Box-and-Whisker Plots
Name:__________________________________________________Date:____________
Record this list of data in L1. 125, 132, 134, 138, 140, 140, 147, 167, 200
Determine the following statistics using the statistical capabilities of the TI 83/84.
Mean __________ Mode ___________ Standard deviation _________
Minimum value ___________ Maximum value__________ Range___________
Lower quartile_____________ Median ____________ Upper quartile___________
Interquartile range _________________ # of data items _______________
Next we will create a new type of graph called a Box-and-Whisker Plot
Press 2nd and then STAT PLOT, choose Plot 1. Turn plot ON. Under Type there are two possible box and whisker plots (the 4th 5th option). We will use the 4th option which includes outliers. An outlier is a data item that is significantly distant from all other data items
To find an outlier you simply multiply IQR by 1.5, then add this amount to Q3 to determine the upper boundary of acceptable data.. Subtract the same value from Q1 to determine the lower boundary of acceptable data. If there are any points beyond these boundaries then the point is considered an outlier.
Determine if 200 is an outlier. _____________________________________________________
Next hit GRAPH and a box-and-whisker plot should appear on the screen. If not, press ZOOM and then Statistics (9). You cannot determine minimum and maximum values as well as quartile 1, median, and quartile 3 using the TRACE button. Sketch the graph over an appropriate number line on the back of this page.
How does the outlier appear on the graph?___________________________________________
Create a second box and whisker plot using the following data:
109, 128, 138, 139, 150,154, 155,159, 160
Sketch this graph on the back of this page, below the same number line as the first, enabling you to compare the two.
Compare the two box-and-whisker plots by graphing both in the same window on the calculator and by observing your sketches.
Describe the similarities and the differences in the box-and-whisker plots. Be sure to specify which statistical information is the same or different and describe the spread of the data.

Unit 3, Activity 5, Creating Box-and-Whisker Plots
Name:__________________________________________________Date:____________
Record this list of data in L1. 125, 132, 134, 138, 140, 140, 147, 167, 200
Determine the following statistics using the statistical capabilities of the TI 83/84.
Mean __147 _____ Mode ___140____ Standard deviation__21.7_____
Minimum value____ 125 ___ Maximum value___200 _______ Range__75_______
Lower quartile___133_______ Median ____140_____ Upper quartile__157_____
Interquartile range_____24__________ # of data items ___9____
Next we will create a new type of graph called a Box-and-Whisker Plot:
Press 2nd and then STAT PLOT, choose Plot 1. Turn plot ON. Under Type there are two possible box and whisker plots (the 4th 5th option). We will use the 4th option which includes outliers. An outlier is a data item that is significantly distant from all other data items.
To find an outlier you simply multiply IQR by 1.5, then add this amount to Q3 to determine the upper boundary of acceptable data. Subtract the same value from Q1 to determine the lower boundary of acceptable data. If there are any points beyond these boundaries then the point is considered an outlier.
Determine if 200 is an outlier. ___Yes, it is an outlier___________________
Next hit GRAPH and a box-and-whisker plot should appear on the screen. If not, press ZOOM and then Statistics (9). You cannot determine minimum and maximum values as well as quartile 1, median, and quartile 3 using the TRACE button. Sketch the graph over an appropriate number line on the back of this page.
How does the outlier appear on the graph?___It appears as a dot _____________________
Create a second box and whisker plot using the following data:
109, 128, 138, 139, 150,154, 155,159, 160
Sketch this graph on the back of this page, below the same number line as the first, enabling you to compare the two.

Unit 3, Activity 5, Creating Box-and-Whisker Plots
Possible sketches:
110 120 130 140 150 160 170 180 190 200
Compare the two box-and-whisker plots by graphing both in the same window on the calculator and by observing your sketches.
TI 83/84 Window View:
Describe the similarities and the differences in the box-and-whisker plots. Be sure to specify which statistical information is the same or different and describe the spread of the data.
Answers will vary but should contain the following observations.
The 1st and 3rd quartiles are the same, 133 and 157 respectively. The minimum and maximum values are much lower in the second group of data but the median value is higher. It is 140 in the first group of data but 150 in the second group of data. The second group of data does not have an outlier. The data is further spread out in the upper 50% for the first group of data, while it is more spread out in the lower 50% for the second group of data.

Unit 3, Activity 6, Am I Biased
Name:____________________________________________________Date:____________
Given the survey results and methods of survey answer the questions using complete sentences.
1) Survey result: Drinking and driving is not considered a serious problem in Mandeville.
Method of survey: Researchers waited outside various randomly selected bars. They asked each 3rd patron that exited if he or she felt drinking and driving was a serious problem.
Biased, misleading or neither?
Why or why not?
If biased or misleading, how can it be modified to more accurately reflect the population?
2) Survey result: Franklin High students earn a C in mathematics.
Method of survey: Found the mean grade (average) in mathematics of all students at Franklin High.
Biased, misleading or neither?
Why or why not?
If biased or misleading, how can it be modified to more accurately reflect the population?

Unit 3, Activity 6, Am I Biased
3) Survey result: 90% of U.S. adults rarely use a cell phone.
Method of survey: Researchers called randomly selected homes and inquired as to how often they used a cell phone.
Biased, misleading or neither?
Why or why not?
If biased or misleading, how can it be modified to more accurately reflect the population?
4) Survey result: Local community school children favor strawberry ice cream.
Method of survey: Each teacher at the various local community schools asked students which flavor ice cream was their favorite and tallied the result.
Biased, misleading or neither?
Why or why not?
If biased or misleading, how can it be modified to more accurately reflect the population?
5) Survey result: Two out of three dentists recommend Sure Brite toothpaste.
Method of survey: Researchers polled 15 local dentists and asked them which toothpaste they would recommend to their patients.
Biased, misleading or neither?
Why or why not?
If biased or misleading, how can it be modified to more accurately reflect the population?

Unit 3, Activity 6, Am I Biased with Answers
Name:____________________________________________________Date:____________
Given the survey results and methods of survey, answer the questions using complete sentences.
1) Survey result: Drinking and driving is not considered a serious problem in Mandeville.
Method of survey: Researchers waited outside various randomly selected bars. They asked each 3rd patron that exited if he or she felt drinking and driving was a serious problem.
Biased, misleading or neither? (Biased)
Why or why not? (Since the person is leaving a bar it would be more likely that they did not see drinking and driving as a serious problem.)
If biased or misleading, how can it be modified to more accurately reflect the population?(Researchers should survey randomly selected people at a variety of locations.)
2) Survey result: Franklin High students earn a C in mathematics.
Method of survey: Found the mean grade (average) in mathematics of all students at Franklin High.
Biased, misleading or neither? (Misleading)
Why or why not? (The mean score represents the average of all students and not the score that occurred the most often. Outliers could significantly affect the mean grade of all students. It also generalizes the result to the entire population.)
If biased or misleading how can it be modified to more accurately reflect the population?(Reword the result: 50% of the students at Franklin high earned a C in mathematics.)
3) Survey result: 90% of U.S. adults rarely use a cell phone.
Method of survey: Researchers called randomly selected homes and inquired as to how often they used a cell phone.
Biased, misleading or neither? (Biased)
Why or why not? (The researchers only called home phones and many people use their cell phones as their main phone numbers.)
If biased or misleading, how can it be modified to more accurately reflect the population?(Researchers should survey randomly selected people at a variety of locations)

Unit 3, Activity 6, Am I Biased with Answers
4) Survey result: Local community school children favor strawberry ice cream.
Method of survey: Each teacher at the various local community schools asked students which flavor ice cream was their favorites and tallied the result.
Biased, misleading or neither? (Neither)
Why or why not? (The survey is a result of a tally at all local community schools)
If biased or misleading, how can it be modified to more accurately reflect the population?No answer is required as it is not biased or misleading.
5) Survey result: Two out of three dentists recommend Sure Brite toothpaste.
Method of survey: Researchers polled 15 local dentists and asked them which toothpaste they would recommend to their patients.
Biased, misleading or neither? (Misleading)
Why or why not? (Researchers only used a very small sample of a population and generalized the result to all dentists.)
If biased or misleading, how can it be modified to more accurately reflect the population?(Interview a larger number of dentists from a variety of places. A second option would be to specify how many dentists were surveyed)

Unit 3, Activity 7, Creating Scatter Plots
Name___________________________________________________Date:___________
We will be creating a scatter plot using the TI-84/84 graphing capabilities.
Data group A: Record the following data in L1 and L2.
Time Kenny spent studying for his mathematics tests (minutes)
Score on Kenny’s mathematics test (%)
25 7510 6845 8340 850 6235 8060 9540 9020 7150 85
Press 2nd Stat Plot and turn on Plot 1. Choose the 1st option under TYPE, this is the scatter plot graph icon. Choose Xlist L1 and Ylist L2. Press GRAPH and the graph should be in the viewing screen. (Remember, if the graph is not in the viewing screen, press ZOOM and choose Statistics.)
Does the relationship between these items appear linear (positive or negative)? __________
Is there a predictive value with regards to the data items? Explain using the criteria for predictive value.

Unit 3, Activity 7, Creating Scatter Plots
Data group B: Record the following data in L3 and L4.
Time Kenny spent talking on his cell phone Friday afternoon (minutes)
Points Kenny scored in his a basketball game on Friday evening
10 220 2420 1525 1010 2030 1220 1825 1335 840 2
Now create a scatter plot using this data. Remember to change the STAT PLOT Xlist and Ylist to L3 and L4 respectively.
Does the relationship between these items appear linear (positive or negative) ? __________
Is there a predictive value with regards to the data items? Explain using the criteria for predictive value.
With your partner create and label two sets of data items that have a positive linear relationship and predictive value.
With your partner create and label two sets of data items that have a positive linear relationship but do not have a predictive value.

Unit 3, Activity 7, Creating Scatter Plots

Unit 3, Activity 7, Creating Scatter Plots with Answers
Name___________________________________________________Date:___________
We will be creating a scatter plot using the TI-84/84 graphing capabilities.
Data group A: Record the following data in L1 and L2.
Time Kenny spent studying for his mathematics tests (minutes)
Score on Kenny’s mathematics test (%)
25 7510 6845 8340 850 6235 8060 9540 9020 7150 85
Press 2nd Stat Plot and turn on Plot 1. Choose the 1st option under TYPE, this is the scatter plot graph icon. Choose Xlist L1 and Ylist L2. Press GRAPH and the graph should be in the viewing screen. (Remember, if the graph is not in the viewing screen, press ZOOM and choose Statistics.)
Does the relationship between these items appear linear (positive or negative? _Yes, positive__
Is there a predictive value with regards to the data items? Explain using the criteria for predictive value.
Yes, it meets the three criteria. The first data item occurs prior to the second data item. There is a positive linear relationship between the two sets of data items. There is no likely plausible alternative explanation for his increase in test scores.

Unit 3, Activity 7, Creating Scatter Plots with Answers
Data group B: Record the following data in L3 and L4.
Time Kenny spent talking on his cell phone Friday afternoon (minutes)
Points Kenny scored in his a basketball game on Friday evening
10 220 2420 1525 1010 2030 1220 1825 1335 840 2
Now create a scatter plot using this data. Remember to change the STAT PLOT Xlist and Ylist to L3 and L4 respectively.
Does the relationship between these items appear linear (positive or negative) Yes, negative
Is there a predictive value with regards to the data items? Explain using the criteria for predictive value.
No, the data items do not meet the criteria. Tthere is no likely plausible alternative explanation. Kenny’s scored basketball points are probably a result of his amount of practice time shooting goals.
With your partner create and label two sets of data items that have a positive linear relationship and predictive value.
Possible examples: The number of hours of soccer practice and the number of goals scored in a soccer game for a given team. The age and height of a child.
With your partner create and label two sets of data items that have a positive linear relationship but do not have a predictive value.
Possible examples: The number of cars on campus and the number of students enrolled in college. The number of students at a football game and the number of wins.

Unit 3, Activity 9, Survey
CONDUCTING A SURVEY
Group members should pick a topic of interest to survey. The data may be categorical or quantitative. Turn in the form on the 2nd page to your teacher for approval prior to conducting the survey.
Survey topic: This is the topic you want to know more about. Survey Question: Remember to choose your words carefully so that bias in the question
is not given. For example, the following survey question would demonstrate bias: Is your favorite school lunch the awesome chicken fingers, the pizza, or the pork loin?
Survey Population: Faculty, 9th graders, all boys at the school, 12th grade math students (Remember your survey sample must have at least 30 data items, so you want to survey a population that is large.)
Sampling method: Describe fully how you intend to sample the survey population.. How will you choose the respondents for the survey? Will you conduct your survey during school hours or after school? Explain your sampling method in detail.
Graphical Representation: Will you present your data in a bar graph, histogram, pie chart, line graph, box-and-whisker plot? Be sure that what you are surveying and the graphical representation match. For example: If you were measuring the height and weight of 9th grade boys, a pie chart may not be the best choice for graphically representing the data collected. The graphical representation must be done on half of a poster board.
Final Report: A one page report that includes the survey topic, survey question, survey population, and sampling method, along with the complete survey findings.
Use the rubric below to aid in development of this activity:4 3 2 0
Survey Topic Given, clearly stated, specific.
Given and specific, but not clearly stated.
Given. Not given.
Survey Question Clearly worded, not biased.
Not biased, but not clearly worded.
Given, but biased.
Not given.
Survey Population
Given, accurate and specific.
Given, accurate but not specific.
Given, but not accurate or specific.
Not given.
Sampling Method
Detailed, accurate sampling methodgiven.
Detailed, but not accurate sampling method given.
Given. Not given.
Graphical Representation:
Detailed, accurate graph of data given.
Detailed, but not accurate graph of date given.
Given. Not given.
Final Report: All aspects of the survey given and explained. Findings are accurately summarized.
Missing one aspect of the survey OR aspects not explained. Findings are accurately summarized.
Given. Not given.
Unit 3, Activity 9, Survey
Total points possible: 24 Total points earned:____________SURVEY PROPOSAL
Names of group members:
_________________________________________________________________________
_________________________________________________________________________
_________________________________________________________________________
Survey topic: _____________________________________________________________
Survey question: __________________________________________________________
_________________________________________________________________________
Survey population: _________________________________________________________
Sampling method: __________________________________________________________
_________________________________________________________________________
_________________________________________________________________________
__________________________________________________________________________
__________________________________________________________________________
__________________________________________________________________________
__________________________________________________________________________
__________________________________________________________________________
__________________________________________________________________________
__________________________________________________________________________
__________________________________________________________________________
__________________________________________________________________________
__________________________________________________________________________
Graphical Representation: _____________________________________________________

Unit 4, Activity 5, Right Triangle Trigonometry
Name: _______________________________________________Date:___________________
Right Triangle Trigonometry
Use the trigonometric ratios listed above to solve the following construction related problems. (Give answers to the nearest ½ inch.)
1.
2. Stairs sloped at an angle of 300 must reach
10 feet 6 inches to the next floor. What is the
total run of the stairs? Give the answer in feet
and inches to the nearest 1/16 of an inch.
3.
r
24
h
Determine the length of the roof (r) and the height (h) of the roof from the 24 foot long ceiling beam.
?30o
A regular trapezoidal concrete block, used as a temporary guardrail during construction on the overpass, has a slope length of 5 feet. The base and the side form a 60° angle. Determine the height and base length of the concrete block to the nearest ½ inch.
1/2 ft

Unit 4, Activity 5, Right Triangle Trigonometry

Unit 4, Activity 5, Right Triangle Trigonometry with Answers
Name: _______________________________________________Date:___________________
Right Triangle Trigonometry
Use the trigonometric ratios listed above to solve the following construction related problems. (Give answers to the nearest ½ inch.)
1.
2. Stairs sloped at an angle of 300 must reach
10 feet 6 inches to the next floor. What is the
total run of the stairs? Give the answer in feet
and inches to the nearest 1/16 of an inch.
3.
r
24
h
Determine the length of the roof (r) and the height (h) of the roof from the 24 foot long ceiling beam.
?30o
A regular trapezoidal concrete block, used as a temporary guardrail during construction on the overpass, has a slope length of 5 feet. The base and the side form a 60° angle. Determine the height and base length of the concrete block to the nearest ½ inch.
Solution: 13 feet 10.5 inches= r 6 feet 11 inches = h
300
Solution: 6 feet 11/16 inch
300
Solution: height = 4 feet 4 inches Base = 3 feet 6 inches
1/2 ft

Unit 4, Activity 5, Right Triangle Trigonometry with Answers

Unit 4, Activity 5, Right Triangle Trigonometry with Answers
Name:___________________________________________________Date:_______________
EXPLORING TRANSFORMATIONS USING TECHNOLOGY
Access the website http://www.shodor.org/interactivate/activities/Transmographer/
ACTIVITY 1: TRANSLATION
Start with a new triangle and record the original vertices below.Translate the triangle five units on the x-axis and three units on the y-axis.Record the vertices of the translated triangle below.
Vertex Color Original Vertices Translated VerticesRedBlue
Green
Describe how the translation affects the vertices.
Create a rule you could use to describe how to find the new vertices whenever you translate a polygon.
Does the rule you created above hold true for the translation of parallelograms and squares? Investigate using the transmographer.
ACTIVITY 2: REFLECTIONS
Start with a new triangle and record the original vertices below. Reflect the triangle across the y-axis. Record the vertices of the reflected triangle below. Describe how the reflection affects the vertices of the triangle.
Vertex Color Original Vertices Reflected Verticesy-axis
Reflected Verticesx = 1
RedBlue
Green
Choose RESET. This time reflect the triangle across the line x = 1. Record the vertices in the table above. Describe how the reflection affects the vertices of the triangle.

Unit 4, Activity 5, Right Triangle Trigonometry with Answers
Create a rule to describe how to find the new vertices when a polygon is reflected over a given vertical line or axis.
How is the rule you created different if this polygon is reflected across the x-axis or any horizontal line? Investigate this using the transmographer.
Investigate using the transmographer, if the rule holds true for the translation of other polygons such as parallelograms and squares?
ACTIVITY 3: ROTATIONS
Starting with a new triangle, record the original vertices. Rotate the triangle and record the new vertices in the chart below. Repeat using and . Remember to RESET your triangle each time. Record your results
VertexColors
Original Vertices
Vertices: rotation
Vertices: rotation
Vertices: rotation
RedBlue
Green
Create a rule that would help you determine the vertices of a triangle that is rotated 90, 180, or 270 degrees.
rotation:
rotation:
rotation:
What happens if you rotate the triangle 360 degrees?
Do the rules you created above hold true for the rotation of parallelograms and squares? Investigate using the transmographer.

Unit 4, Activity 6, Transformations Using Technology with Answers
Name:____________________________________________________Date:_______________
EXPLORING TRANSFORMATIONS USING TECHNOLOGY
Access the website http://www.shodor.org/interactivate/activities/Transmographer/
ACTIVITY 1: TRANSLATION
Start with a new triangle and record the original vertices below.Translate the triangle five units on the x-axis and three units on the y-axis.Record the vertices of the translated triangle below.
Vertex Color Original Vertices Translated VerticesRed Answers will vary Answers will varyBlue Answers will vary Answers will vary
Green Answers will vary Answers will vary
Describe how the translation affects the vertices.Each coordinate x-value increases by 5 units and each y-value increases by 3 units.
Create a rule you could use to describe how to find the new vertices whenever you translate a polygon. For each translation (m) on the x-axis and (n) on the y-axis, the new vertices of the polygon will be (x + m) and (y + n).
Does the rule you created above hold true for the translation of parallelograms and squares? Investigate using the transmographer. Yes, it holds true.
ACTIVITY 2: REFLECTIONS
Start with a new triangle and record the original vertices below. Reflect the triangle across the y-axis. Record the vertices of the reflected triangle below. Describe how the reflection affects the vertices of the triangle. The new vertices are located on the other side of the axis in the same position related to the axis of reflection.
Vertex Color Original Vertices Reflected Verticesy-axis
Reflected Verticesx = 1
Red Answers will vary Answers will vary Answers will varyBlue Answers will vary Answers will vary Answers will vary.
Green Answers will vary Answers will vary Answers will vary.
Choose RESET. This time reflect the triangle across the line x = 1. Record the vertices in the table above. Describe how the reflection affects the vertices of the triangle.The new vertices are located on the other side of the x = 1 line in the same position related to the x = 1 line.

Unit 4, Activity 6, Transformations Using Technology with Answers
Create a rule to describe how to find the new vertices when a polygon is reflected over a given vertical line or axis. If the polygon is reflected across the line x = m and the original x-coordinates of the vertices are represented by a +m, b+m, c+ m…, then the new vertices are m –a, m-b, m-c, m – d… The y-coordinate remains the same.
How is the rule you created different if this polygon is reflected across the x-axis or any horizontal line? Investigate this using the transmographer. If the polygon is reflected across the y = n axis and the original y-coordinates of the vertices are represented by a+n, b+n, c+n,…, then the new vertices are n-a, n-b, n-c, n-d…. The x-coordinate remains the same.
Investigate using the transmographer, if the rule holds true for the translation of other polygons such as parallelograms and squares? Yes
ACTIVITY 3: ROTATIONS
Starting with a new triangle, record the original vertices. Rotate the triangle and record the new vertices in the chart below. Repeat using and . Remember to RESET your triangle each time. Record your results
VertexColors
Original Vertices
Vertices: rotation
Vertices: rotation
Vertices: rotation
Red Answers will vary Answers will vary Answers will vary Answers will varyBlue Answers will vary Answers will vary Answers will vary Answers will vary
Green Answers will vary Answers will vary Answers will vary Answers will vary
Create a rule that would help you determine the vertices of a triangle that is rotated 90, 180, or 270 degrees.
rotation: Switch the x- and y-coordinates of the original vertices and change the sign of the new x-coordinates.
rotation: Change the sign of the original coordinates of the vertices.
rotation: Switch the x-and y-coordinates of the original vertices and change the sign of the new y-coordinates.

Unit 4, Activity 6, Transformations
Do the rules you created above hold true for the rotation of parallelograms and squares? Investigate using the transmographer. YesName:_______________________________________________________Period:_____
TRANSFORMATIONS
Put the transparency on top of the graph paper so that the edges align and then draw and label the x- and y-axes on the transparency. You must realign the transparency and the graph paper every time you complete a new transformation.
ACTIVITY 1: TRANSLATION
Draw a scalene triangle on your transparency and label ABC. Record vertices of the original
triangle. Translate the triangle five units on x-axis and three units on y-axis. Record vertices of the translated ABC.
Describe how the translation affects the vertices.
Create a rule to find the new vertices when you translate a polygon.
Clean your transparency and investigate if the rule holds true for the translation of parallelograms and triangles?
ACTIVITY 2: REFLECTIONS
To create a reflection, flip the transparency over and align the origin and axes (x to x and y to y). A reflection creates a mirror image.
Start with a new triangle, label the vertices, and record the vertices of the original triangle.Reflect the triangle across the y-axis. Record vertices of the reflected triangle.
Return the triangle to its original position. This time reflect the triangle across the line x = 1.Record vertices of the reflected triangle.
Describe how the reflection affects the vertices of the triangle.
Create a rule to describe how to find the new vertices if you reflect a polygon over a given line or axis.

Unit 4, Activity 6, Transformations
How is the rule different if you reflect a polygon across the x-axis? Investigate this using your transparency of a triangle.
Clean your transparency and investigate if the rule holds true for the translation of parallelograms and squares?
ACTIVITY 3: ROTATIONS
Clean your transparency. Draw and label a new triangle. Rotate the triangle 90° clockwise about the origin. You may use a protractor or simply turn your transparency one-quarter of a turn clockwise, since is one-quarter of a circle which is . After the rotation is completed, record the coordinates of the vertices in the table below. Repeat this procedure for androtations. Record your results
Original vertices Vertices: 90°rotation Vertices: 180°rotation Vertices: 270° rotation
Create a rule that would help you determine the vertices of a triangle that is rotated 90, 180, or 270 degrees.
90° rotation:
180° rotation:
270° rotation:
What happens if you rotate the triangle 360 degrees?
Clean your transparency and investigate if the rule holds true for the translation of parallelograms and squares.
Name: __________________________________________________Period:_________

Unit 4, Activity 6, Transformations
TRANSFORMATIONS
Put the transparency on top of the graph paper so that the edges align and then draw and label the x- and y-axes on the transparency. You must realign the transparency and the graph paper every time you complete a new transformation.
ACTIVITY 1: TRANSLATION
Draw a scalene triangle on your transparency and label ABC. Record vertices of the original
triangle. Translate the triangle five units on x-axis and three units on y-axis. Record vertices of the translated ABC.
Describe how the translation affects the vertices. Each coordinate x-value increases by 5 units and each y-value increases by 3 units.
Create a rule you could use to describe how to find the new vertices whenever you translate a polygon.For each translation (m) on the x-axis and (n) on the y-axis, the new vertices of the polygon will be (x + m) and (y + n).
Clean your transparency and investigate if the rule holds true for the translation of parallelograms and triangles? Yes, it holds true.
ACTIVITY 2: REFLECTIONS
To create a reflection, flip the transparency over and align the origin and axes (x to x and y to y). A reflection creates a mirror image.
Start with a new triangle, label the vertices, and record the vertices of the original triangle.Reflect the triangle across the y-axis. Record vertices of the reflected triangle. Answers vary
Return the triangle to its original position. This time reflect the triangle across the line x = 1.Record vertices of the reflected triangle. Answers vary
Describe how the reflection affects the vertices of the triangle.The new vertices are located on the other side of the axis in the same position related to the axis of reflection.
Create a rule to find the new vertices if you reflect a polygon over a given line or axis. If the polygon is reflected across the line x = m and the original x-coordinates of the vertices are represented by a + m, b + m, c + m…..then the new vertices are m - a, m - b, m - c…. The y-coordinate remains the same.

Unit 4, Activity 6, Transformations
How is the rule different if you reflect a polygon across the y-axis? Investigate this using your transparency of a triangle.If the polygon is reflected across the y = n axis and the original y-coordinates of the vertices are represented by a+n, b+n, c+n,… then the new vertices are n – a, n – b, n – c,….. The x-coordinate remains the same.
Clean your transparency and investigate if the rule holds true for the translation of parallelograms and squares? Yes, it holds true.
ACTIVITY 3: ROTATIONS
Clean your transparency. Draw and label a new triangle. Rotate the triangle of 90° clockwise about the origin. You may use a protractor or simply turn your transparency one-quarter of a turn clockwise since is one-quarter of a circle which is . After the rotation is completed, record the coordinates of the vertices in the table below. Repeat this procedure for androtations. Record your results
Original vertices Vertices: 90°rotation Vertices: 180°rotation Vertices: 270° rotation
Create a rule that would help you determine the vertices of a triangle that is rotated 90, 180, or 270 degrees.
90° rotation: Switch the x and y coordinates of the original vertex and change the sign of the new x-coordinate.
180° rotation: Change the sign of the original coordinates of the vertices.
270° rotation: Switch the x- and y-coordinates of the original vertex and change the sign of the new y-coordinate.
What happens if you rotate the triangle 360 degrees? It returns to its original position.
Clean your transparency and investigate if the rule holds true for the translation of parallelograms and squares? Yes, it holds true.

Unit 4, Activity 7, Exploring Area and Perimeter of Rectangles
Exploring Area and Perimeter of Rectangles
As the perimeter of a rectangle increases, what do you think happens to the area of a rectangle?
Can two rectangles have the same perimeter but different areas?
Can two rectangles have the same area but different perimeters?
Using one of the attached Geoboard Papers, construct 10 different rectangles. Record each rectangle’s perimeter, area, boundary points, and interior points in the chart below.
Perimeter Area
Do any of your or your neighbor’s rectangles have the same perimeters but different areas? If not, attempt to create them. Describe how the rectangles are different.
Do any of your or your neighbor’s rectangles have the same area but different perimeters? If not, attempt to create them. Describe how the rectangles are different
After completing the chart, does the information you tabulated verify your answers to the above questions? Explain.
Unit 4, Activity 7, Exploring Area and Perimeter of Rectangles
Exploring Area of Polygons
Use the attached Geoboard that contains various types of polygons (closed plane figures).
Calculate the area of each of these polygons using estimation. Record the area, boundary points and interior points of each polygon in the table below.
Polygon Area Boundary Interior Points Points
A B C D E F G H I J K L M N O P Q R S T U V W X Y Z
Attempt to determine how the boundary and interior points can be used to determine the area of the polygon. What patterns do you notice?
Describe your method for determining area of polygons that were not right triangles or rectangles.

Unit 4, Activity 7, Exploring Area and Perimeter of Rectangles
Q K
A
B C D E
FG H I
J
L
M
N
OP
K
R
ST
U V
WX
YZ

Unit 4, Activity 7, Exploring Area and Perimeter of Rectangles
Exploring Area of Polygons
Use the attached geoboard paper that contains various types of polygons (closed plane figures).
Calculate the area of each of these polygons using estimation. Record the area, boundary points and interior points of each polygon in the table below.
Polygon Area Boundary Interior Points Points
A 1 4 0 B 1.5 5 0 C 3 6 1 D 2.5 7 0 E 2 6 0 F 3 8 0 G 4.5 9 1 H 2.5 5 1 I 1.5 3 1 J 4 8 1 K 2 6 0 L 2.5 7 0 M 4 6 2 N 5.5 7 3 O 3.5 9 0 P 5 8 2 Q 5.5 7 3 R 5.5 5 4 S 3.5 7 1 T 3 8 0 U 4 6 2 V 2 6 0 W 2.5 5 1 X 7 14 1 Y 5 12 0 Z 6 10 2
Attempt to determine how the boundary and interior points can be used to determine the area of the polygon. What patterns do you notice?
Describe your method for determining area of polygons that were not right triangles or rectangles.
Add up the rectangles and then combine parts to make rectangles. Count them up.
Make a larger object and then subtract off pieces.
There are many ways. The two above are just
exam
ples of possible methods.

Unit 4, Activity 8, How Many Blocks?

Unit 4, Activity 8, How Many Blocks?
Name:________________________________________________________Period:_______
How Many Blocks?
Determine the number of cubes that make up each solid.
A. __________ B. __________
C. __________ D. __________
E. __________ F. __________
G. __________ H. __________
I. __________ J. __________

Unit 4, Activity 8, How Many Blocks?
Name:________________________________________________________Period:_______
How Many Blocks?
Determine the number of cubes that make up each solid.
A. ___7_______ B. ____5______
C. ___6_______ D. ____5______
E. ____6______ F. ____6______
G. ____7______ H. _____7_____
I. ____7______ J. _____8_____

Unit 4, Activity 8, Orthographic Drawing
Name:________________________________________________________Period:_____
Orthographic Drawing
For each three-dimensional drawing, create both a foundational drawing and orthographic drawing of the three primary views.
1. F S Front Side Top Foundation
2. F S Front Side Top Foundation
3. F S Front Side Top Foundation
4. F S Front Side Top Foundation
5. F S Front Side Top Foundation
6. F S Front Side Top Foundation

Unit 4, Activity 8, Orthographic Drawing
Name:_____________________________________________________Period:_____
Orthographic Drawing
For each three-dimensional drawing, create both a foundational drawing and orthographic drawing of the three primary views.
1. F S Front Side Top Foundation
2. F S Front Side Top Foundation
3. F S Front Side Top Foundation
4. F S Front Side Top Foundation
5. F S Front Side Top Foundation
6. F S Front Side Top Foundation
1 1 11 1 1
2
2
2
2
22
3
2
1
2
1
3 1 1
2 2
1

Unit 4, Activity 9, Isometric Drawing
Name:_________________________________________________________Period:_______
Isometric Drawing – Create an isometric drawing for each foundation plan.
Given the top, front, and right side views respectively, create an isometric drawing of the following:

Unit 4, Activity 9, Isometric Drawings with Answers
Given the top, front, and right side views respectively, create an isometric drawing of the following:
2 2
2 1
4 3
2
3 2 1
1
3 1
1
3 3
3 2
2 3 2
1

Unit 4, Activity 9, Isometric Drawings with Answers
Name:_________________________________________________________Period:_______
Isometric Drawing – Create an isometric drawing for each foundation plan.

Unit 4, Activity 10, Exploring Surface Area and Volume of Rectangular Prisms
Given the top, front, and right side views respectively, create an isometric drawing of the following:
2 2
2 1
4 3
2
3 2 1
1
3 1
1
3 3
3 2
2 3 2
1

Unit 4, Activity 10, Exploring Surface Area and Volume of Rectangular Prisms
Name:___________________________________________________Date:______________
Exploring Surface Area and Volume of Rectangular Prisms
Create different-sized rectangular prisms listed below with 12 cubes and create a chart to record the following information
a) the dimensions of each prism (length, width, and height), b) the surface area of each prism, andc) volume of each prism.
Length (in) Width (in) Height (in) Volume (in3) Surface Area (in2)
Since you are using 1 cm. or 1 inch cubes, an easy way to gather your measurement data is to simply count the faces showing for the surface area and the cubes for the volume. Faces showing refer to the faces on the outer surface of the rectangular prism. After you have recorded the data for each of the prisms above, write your answers to the following questions:
1) Create a large cube (square prism) using 9 of the cubes. Add a layer to one side of the cube. How does this change your volume and surface area?
2) How would it change if you added a second layer to the same side? Three layers? Is there a pattern? If so, describe it.
3) Starting with the 9 cube prism, add a layer to two sides of the prism. How are the surface area and volume changed?
4) Add a layer to the third side. How are the surface area and volume changed?
5) What would happen to your measurements if each cube was 1.5 square centimeters or 1.5 square inches? What would happen if each cube doubled in size?
6) Can you create a formula that works for finding the volume of any rectangular prism? Record your formula.
7) Can you create a formula that works for finding the surface area of any rectangular prism? Record your formula.

Unit 4, Activity 10, Exploring Surface Area and Volume of Rectangular Prisms
Name:____________________________________________________Date:____________
Exploring Surface Area and Volume of Rectangular Prisms
Create different-sized rectangular prisms listed below with 12 cubes and create a chart to record the following information
a) the dimensions of each prism (length, width, and height), b) the surface area of each prism, andc) volume of each prism.
Length (in) Width (in) Height (in) Volume (in3) Surface Area (in2)
Since you are using 1 cm. or 1 inch cubes, an easy way to gather your measurement data is to simply count the faces showing for the surface area and the cubes for the volume. Faces showing refer to the faces on the outer surface of the rectangular prism. After you have recorded the data for each of the prisms above, write your answers to the following questions:
1) Create a large cube (square prism) using 9 of the cubes. Add a layer to one side of the cube. How does this change your volume and surface area?The original volume was 27. Adding one layer increases the volume 9 cubes to 36.The original surface area was 54. Adding one layer increases 12 faces to 66.
2) How would it change if you added a second layer to the same side? Three layers? Is there a pattern? If so, describe it.Each time you add a layer to the same side, the volume will increase by 9.The surface area would increase by 12 units for each layer added.
3) Starting with the 9 cube prism, add a layer to two sides of the prism. How are the surface area and volume changed? The volume would increase by 21 cube units for total volume of 48 cube units (4X4X3). The surface area increases by 26 units for a total surface area of 80 units.
4) Add a layer to a third side (top) forming a 4 X 4 X 4 cube. How are the surface area and volume changed? When you add three sides to the prism, your volume increases by 16 cube units because the 3rd layer would also be a 4 X 4 for a total volume of 64 cube units. The surface area would increase by 16 units for a total surface area of 96 units.

Unit 4, Activity 10, Exploring Surface Area and Volume of Rectangular Prisms
5) What would happen to your measurements if each cube was 1.5 square centimeters or 1.5 square inches? What would happen if each cube doubled in size? How much greater is the volume of the new cubes?(4.5)3 =91.125 cubic inches. (6)3 = 216 cubic inches
Volume increase from 27 to approximately 91 cubic inches.Surface area is 8 (or 23) times larger.
6) Can you create a formula that works for finding the volume of any rectangular prism? Record your formula. Length × width height.

Unit 4, Activity 10, Exploring Surface Area and Volume of Rectangular Prisms
7) Can you create a formula that works for finding the surface area of any rectangular prism? Record your formula. 2(length × width + width × height + length × height)

Unit 4, Activity 11, Exploring Volume of Cylinders
Name:___________________________________________________Date:______________
Exploring Volume of Cylinders
Instructions:
1. Take a sheet of paper, cardstock, or transparency. Roll it into a cylinder such that the 11 inch edges meet without any overlap or gap. Tape the cylinder together.
2. Take a second sheet of paper, cardstock, or transparency. Roll it into a cylinder such that the 8½ inch edges meet without any overlap or gap. Tape it together.
You should now have two cylinders without bases, one that is tall and narrow and the other is shorter and wider.
3. Do you think these two cylinders will hold the same or different amounts? If you think they will hold different amounts, will the tall cylinder or the short cylinder hold more? Record your prediction.
4. Place the short cylinder in a large flat box and place the tall cylinder inside it. Fill the tall cylinder. When it is full, gently lift it out of the short cylinder. What happened? Did they both hold the same amount or did one hold more? Record your results.
5. Now examine the cylinders carefully. They were made with two sheets of paper that were exactly the same size. Find the surface area of each cylinder
Cylinder 1: _____________ Cylinder 2:_____________
Cylinder 3: ____________ Cylinder 4:_____________
The height is the length of the side you taped – either 11 inches or 8½ inches. The circumference is the length of the other side of the sheet of paper. Create and complete a table like the one on the next page for use in the rest of the activity. What is true of the surface area of each cylinder? Would this still hold true if the cylinder had a top and bottom?

Unit 4, Activity 11, Exploring Volume of Cylinders
Height of cylinder (h)
(inches)
Circumference(C)
(inches)
Radius(r)
(inches)
Volume (V)
(inches³)
Surface Area(SA)
(inches2)
11 8.58.5 11
6. Make at least two more cylinders from the same 8½ x 11 inch size paper. For the first one, fold a new sheet of paper in half lengthwise and cut along the fold. You should now have two 4.25 x 11 inch pieces. Tape them together along the long side to get a 4.25 x 22 inch rectangle. Create a cylinder with this rectangle (Cylinder 3). Fill in the dimensions for this rectangle on your chart.
7. Take another sheet of the same 8½ x 11 inch paper and repeat the same process to create another 4.25 x 22 inch rectangle. Tape them together along the short side to create a cylinder 4.25 inches high (Cylinder 4). Add the dimensions for this cylinder to your chart.
8. Now predict which of the four cylinders would hold the most. Write down your prediction and then test by filling.
The formula for finding the circumference (C) is or , where r is the radius and d is the diameter of the cylinder.
9. Use your calculator and algebra to find the size of the radius for each of your cylinders. Fill in the chart. Compare your algebraic answers to actual answers by measuring the diameter of the cylinders and dividing by 2. If they do not match, recalculate.
10. The formula for the volume (V) of a cylinder is . Use your calculator to compute the volume for each cylinder. Do your results match what you learned by filling the physical models? If not, recheck your calculations.

Unit 4, Activity 11, Exploring Volume of Cylinders with Answers
Name:___________________________________________________Date:______________
Exploring Volume of Cylinders
Instructions:
1. Take a sheet of paper, cardstock, or transparency. Roll it into a cylinder such that the 11 inch edges meet without any overlap or gap. Tape the cylinder together.
2. Take a second sheet of paper, cardstock, or transparency. Roll it into a cylinder such that the 8½ inch edges meet without any overlap or gap. Tape it together.
You should now have two cylinders without bases, one that is tall and narrow and the other is shorter and wider.
3. Do you think these two cylinders will hold the same or different amounts? If you think they will hold different amounts, will the tall cylinder or the short cylinder hold more? Record your prediction.
Answers will vary.Tthe correct solution is that the short cylinder will hold more.
4. Place the short cylinder in a large flat box and place the tall cylinder inside it. Fill the tall cylinder. When it is full, gently lift it out of the short cylinder. What happened? Did they both hold the same amount or did one hold more? Record your results.
The beans will fall into the short cylinder, but will not fill it up. They do not hold the same amount as the short cylinder holds more.
5. Now examine the cylinders carefully. They were made with two sheets of paper that were exactly the same size. Find the surface area of each cylinder
Cylinder 1: ___ 93.5_in 2 ____ Cylinder 2: ___ 93.5 in 2 _____
Cylinder 3: ___ 93.5 _ in 2 ____ Cylinder 4: ___93.5 in 2 _____
The height is the length of the side you taped – either 11 inches or 8½ inches. The circumference is the length of the other side of the sheet of paper. Create and complete a table like the one on the next page for use in the rest of the activity. What is true of the surface area of each cylinder? Would this still hold true if the cylinder had a top and bottom?
The surface area of each cylinder is the same. No, because you would have to add the area of the top and bottom base to the total surface area.

Unit 4, Activity 11, Exploring Volume of Cylinders with Answers
Height of
cylinder (h) (inches)
Circumference(C)
(inches)
Radius(r)
(inches)
Volume (V)
(inches³)
Surface Area(SA)
(inches2)
11 8.5 1.35 62.98 93.58.5 11 1.75 81.78 93.522 4.25 .68 31.96 93.54.25 22 3.501 163.65 93.5
6. Make at least two more cylinders from the same 8½ x 11 inch size paper. For the first one, fold a new sheet of paper in half lengthwise and cut along the fold. You should now have two 4.25 x 11 inch pieces. Tape them together along the long side to get a 4.25 x 22 inch rectangle. Create a cylinder with this rectangle (Cylinder 3). Fill in the dimensions for this rectangle on your chart.
7. Take another sheet of the same 8½ x 11 inch paper and repeat the same process to create another 4.25 x 22 inch rectangle. Tape them together along the short side to create a cylinder 4.25 inches high (Cylinder 4). Add the dimensions for this cylinder to your chart.
8. Now predict which of the four cylinders would hold the most. Write down your prediction and then test by filling.
Answers will vary.
The formula for finding the circumference (C) is or , where r is the radius and d is the diameter of the cylinder.
9. Use your calculator and algebra to find the size of the radius for each of your cylinders. Fill in the chart. Compare your algebraic answers to actual answers by measuring the diameter of the cylinders and dividing by 2. If they do not match, recalculate.
Answers are in the chart above.
10. The formula for the volume (V) of a cylinder is . Use your calculator to compute the volume for each cylinder. Do your results match what you learned by filling the physical models? If not, recheck your calculations.
Yes, they should.

x y-8 2-5 23 34 54 6
x y3 -14 -14 -15 -16 -1
x y4 -14 -24 -34 -44 -5
357
357
357
Unit 5, Activity 2, Function or No Function
Name:____________________________________________________Date:____________
Listed below are relations in various formats. Some are functions, some are not. It is your task to determine if each relation is a function.
________________ ______________ ________________ _______________
______________ ________________ _______________ ________________
______________ _________________ _______________ ________________
_________________ ________________ _________________ ________________
x y-1 40 43 77 89 10
357
246
3x + 2y = 12 3x2 + 2y2 = 12 3x2 + 2y = 12 3x + 2y2 =12
FUNCTION NO FUNCTION FUNCTION NO FUNCTION
246
246
246

x y-8 2-5 23 34 54 6
x y3 -14 -14 -15 -16 -1
x y4 -14 -24 -34 -44 -5
357
357
357
Unit 5, Activity 2, Function or No Function
Name:____________________________________________________Date:____________
Listed below are relations in various formats. Some are functions, some are not. It is your task to determine if each relation is a function
FUNCTION NO FUNCTION NO FUNCTION FUNCTION
NO FUNCTION FUNCTION FUNCTION NO FUNCTION
x y-1 40 43 77 89 10
357
246
NO FUNCTION FUNCTION NO FUNCTION FUNCTION
3x + 2y = 12 3x2 + 2y2 = 12 3x2 + 2y = 12 3x + 2y2 =12
FUNCTION NO FUNCTION FUNCTION NO FUNCTION
246
246
246

# of rocks
Level of water
0
Unit 5, Activity 4, Water Displacement
Name:____________________________________________________Date:__________
Investigating Water Displacement
Materials: One bag of rocks (similar size), 500 ml graduated cylinder filled to 250 ml mark with water, poster graph paper, markers, ruler
In this activity we will be charting the changes in the water level (water displacement) as pebbles are added to the graduated cylinder. Fill in the chart below as you perform this activity.
Determine whether the number of rocks or the level of water is the independent variable. Justify your response.
The number of rocks used is the ________________variable.
The level of the water is the ___________________variable.
Record your original level of water and mark in the chart above. Remember, initial water height exists when no rocks are added to the cylinders.
Drop a rock into the cylinder and record the new height of the water. Continue this process until all the rocks are dropped into the cylinder or until the water overflows the cylinder.
On your poster graph record each ordered pair from the table. Remember to label the vertical and horizontal axes and title your graph.
Write a brief summary of this activity. Include details related to the change in the water level as each rock was dropped into the graduated cylinder.

# of rocks
Level of water
0
Unit 5, Activity 4, Water Displacement with Answers
Name:____________________________________________________Date:__________
Investigating Water Displacement
Materials: One bag of rocks (similar size), 500 ml graduated cylinder filled to 250 ml mark with water, poster graph paper, markers, ruler
In this activity we will be charting the changes in the water level (water displacement) as pebbles are added to the graduated cylinder. Fill in the chart below as you perform this activity.
Determine whether the number of rocks or the level of water is the independent variable. Justify your response.
The number of rocks used is the __independent_________variable.
The level of the water is the ___dependent____________variable.
You choose the number of rocks to put in the cylinder; therefore, it is the indpendent variable. The level of the water depends upon how many rocks you put in the cylinder.
Record your original level of water and mark in the chart above. Remember. initial water height exists when no rocks are added to the cylinders.
Drop a rock into the cylinder and record the new height of the water. Continue this process until all the rocks are dropped into the cylinder or until the water overflows the cylinder.
On your poster graph record each ordered pair from the table. Remember to label the vertical and horizontal axes and title your graph.
Write a brief summary of this activity. Include details related to the change in the water level as each rock was dropped into the graduated cylinder.
Varies but should include the concept that as rocks were placed in the cylinder the water level rose. For each rock that was added the water rose approximately _______ml. We recorded the ordered pairs in the chart and on the graph. Both the x and y values increased.

Unit 5, Activity 5, Families of Linear Equations
Name:_____________________________________________________Date:____________Families of Linear Equations
A family of graphs includes equations of graphs that have at least one characteristic in common. The parent graph is the simplest of the graphs in the family.
Graph the following equations on a graphing calculator and fill in the columns as you go.
Family A- Changing the constant Equation Slope Y-intercept Notes: What happened?1. y = x Parent Graph2. y = x + 33. y = x + 84. y = x – 45. y = x - 6
How did changing the y-intercept affect the graph?
What remained the same in this family of linear equations?
Family B – Changing the coefficient of xEquation Slope Increasing or
DecreasingSteeper/Flatter than parent graph
y-intercept
1. y = x2. y = 2x 3. y = 5x
4. y = x
5. y = x
6. y = 07. y = -x
8. y =
9, y = -3x
How did changing the coefficient of x affect the graph?
What remained the same in this family of linear equations?

Unit 5, Activity 5, Families of Linear Equations with Answers
Name:_____________________________________________________Date:____________Families of Linear Equations
A family of graphs includes equations of graphs that have at least one characteristic in common. The parent graph is the simplest of the graphs in the family.
Graph the following equations on a graphing calculator and fill in the columns as you go.
Family A- Changing the constant Equation Slope Y-intercept Notes: What happened?1. y = x 1 0 Parent Graph2. y = x + 3 1 3 Shifted up one unit3. y = x + 8 1 8 Shifted up eight units4. y = x – 4 1 -4 Shifted down four units5. y = x - 6 1 -6 Shifted down six units
How did changing the y-intercept affect the graph?The graph of the line shifted up or down when the constant was changed.
What remained the same in this family of linear equations? The slope.
Family B – Changing the coefficient of xEquation Slope Increasing or
DecreasingSteeper/Flatter than parent graph
y-intercept
1. y = x 1 increasing parent graph 02. y = 2x 2 increasing steeper 03. y = 5x 5 increasing steeper 0
4. y = x34
increasing flatter 0
5. y = x12
increasing flatter 0
6. y = 0 0 horizontal flatter 07. y = -x -1 decreasing steeper 0
8. y = -23
decreasing flatter 0
9, y = -3x - 3 decreasing steeper 0
How did changing the coefficient of x affect the graph?When the coefficient changed, the steepness or flatness of the slope changed. If the absolute value of the number was greater than one, it became steeper. Between 0 and 1, it was flatter than the parent graph.
What remained the same in this family of linear equations? The y-intercept.

Unit 5, Activity 6, Comparing Lines
Name:_________________________________________________Date:_______________Comparing Lines
For this activity you will use a TI-Graphing Calculator. After entering the equations and graphing, it is important that you hit ZOOM Square in order to present a more accurate visual of the graph.
Graph the given sets of equations and then answer the questions related to the graph and the equations.
Do the lines appear parallel, perpendicular, the same, or oblique?
Do the lines appear parallel, perpendicular, the same, or oblique?
Do the lines appear parallel, perpendicular, the same, or oblique?
Do the lines appear parallel, perpendicular, the same, or oblique?
Using the equations above and their graphical representation answer the questions below.
1) Compare the slopes of parallel lines.
2) Can the y-intercepts of parallel lines be the same? Can they be different? Explain
3) Compare the slopes of same lines.
4) Can the y-intercepts of same lines be the same? Can they be different? Explain.
5) Compare the slopes of perpendicular lines.
6) Can the y-intercepts of perpendicular lines be the same? Can they be different?
7) Compare the slopes of oblique lines.

Unit 5, Activity 6, Comparing Lines
8) Can the y-intercepts of oblique lines be the same? Can they be different?
Below record a brief summary of the observations and findings from this activity.

Unit 5, Activity 6, Comparing Lines with Answers
Name:________ __________________________Date:________Period:___Comparing Lines
For this activity you will use a TI-Graphing Calculator. After entering the equations and graphing, it is important that you hit ZOOM Square in order to present a more accurate visual of the graph.
Graph the given sets of equations and then answer the questions related to the graph and the equations.
Do the lines appear parallel, perpendicular, the same, or oblique? (perpendicular)
Do the lines appear parallel, perpendicular, the same, or oblique?
(oblique)
Do the lines appear parallel, perpendicular, the same, or oblique?
(same)
Do the lines appear parallel, perpendicular, the same, or oblique? (parallel)
Using the equations above and their graphical representation answer the questions below.
1) Compare the slopes of parallel lines. (The slopes are the same)
2) Can the y-intercepts of parallel lines be the same? Can they be different? Explain (They may not be the same. They must be different in order to stay parallel. The lines have to be the same distance away from each other at all points.)
3) Compare the slopes of same lines. (The slopes are the same)
4) Can the y-intercepts of same lines be the same? Can they be different? Explain. (They must be the same. If the y-intercept was different,t then they could not be the same line because the y-intercept would be in two different places.) 5) Compare the slopes of perpendicular lines. (The slopes are negative reciprocals of each other.)
6) Can the y-intercepts of perpendicular lines be the same? Can they be different?(They can be the same or different. Itt does not matter)
7) Compare the slopes of oblique lines. (They are different)

Unit 5, Activity 6, Comparing Lines with Answers
8) Can the y-intercepts of oblique lines be the same? Can they be different?(They can be the same or different, it does not matter)
Below record a brief summary of the observations and findings from this activity.
Parallel lines must have the same slope and their y-intercepts must be different. Parallel lines have to always be the same distance apart and thus never intersect with each other.
Perpendicular lines intersect and must have negative reciprocal slopes. They may or may not have the same y-intercept.
Same lines must have the same slope and the same y-intercepts.
Oblique lines intersect but their slopes are not negative reciprocals. They may or may not have the same y-intercept.

Unit 5, Activity 7, Writing Linear Equations
Name:______________________________________________Date:__________Writing Linear Equations for Real-World Applications
Determine a linear equation for each real-world application and answer the questions related to each application.
1. Height/Weight Table for ideal weightHeight (in) Weight (lbs)
61 13462 13763 13964 14265 14566 14867 15168 15469 15770 16071 16472 167
73 17174 17575 179
Linear equation:_____________________
1) How much should a 51 inch tall male weigh?
2) How much should a 79 inch tall male weigh?
3) What is the y-intercept?
4) Does the y-intercept have a real world meaning? Explain.
25
20
15
10
5
1 2 3 4 5 HOURS
Determine an equation for the line that represents Gail’s fee for babysitting as graphed above.
1) How much would she charge for 4 hours of babysitting?
2) If she was paid $23, how many hours did she spend babysitting?
3) Does the y-intercept have a real-world meaning? Explain.
Gail’s babysitting fees
DOLLARS

Unit 5, Activity 7, Writing Linear Equations with Answers
Name:______________________________________________Date:__________Writing Linear Equations for Real-World Applications NOTE: Linear equations and answers related will vary, but should approximate the solutions below.Determine a linear equation for each real-world application and answer the questions related to each application. Show all work on separate paper.
1. Height/Weight Table for ideal weightHeight (in) Weight (lbs)
61 13462 13763 13964 14265 14566 14867 15168 15469 15770 16071 16472 167
73 17174 17575 179
Linear equation: y = 3x - 50
1) How much should a 51 inch tall male weigh? 103 lbs.
2) How much should an 79 inch tall male weigh? 187 lbs.
3) What is the y-intercept? -50
4) Does the y-intercept have a real world meaning? Explain. No, because it would mean a person 0 inches tall weighed negative 50 pounds. This is impossible.
25
20
15
10
5
1 2 3 4 5 HOURS
Determine an equation for the line that represents Gail’s fee for babysitting as graphed above. y = 3x + 5
1) How much would she charge for 4 hours of babysitting? $17
2) If she was paid $23, how many hours did she spend babysitting? 6 hours
3) Does the y-intercept have a real-world meaning? Explain. Yes, she charges $5 just for babysitting even if she does not work a full hour.
DOLLARS
Gail’s babysitting fees

Unit 5, Activity 8, Line of Best Fit
Name:__________________________________Date:_________________Line of Best Fit Hamburgers and Fat Grams
The table below indicates how many fat grams are in some popular fast-food hamburgers. How can you find an equation to fit this data so that you can better define the relationship?
Burger Saturated fat (g)
Total fat (g)
Wendy's single© 7 20Burger King Whopper Jr. © 8 24
McDonald's Big Mac © 10 28
Wendy's Big Bacon Classic © 12 30
McDonald's Bacon Deluxe © 12 34
Burger King © Double Bacon Cheeseburger
18 39
Burger King Whopper ©
1440
Burger King Big King © 18 43
Burger King Whopper © with Cheese
16 46
On the graph above, plot the ordered pairs from the table. Be sure to label your axes and intervals accurately. From the table and the graph, you can see that the data is not perfectly linear; however, the points should show a linear pattern.

Unit 5, Activity 8, Line of Best Fit
Using a graphing calculator, plot the points from the table above.
We are now going to use the linear regression capabilities of the graphing calculator to determine a “line of best fit.”
Instructions for Creating a Scatterplot and Linear Regression Line on the TI – 83/84 Calculator
1. Let¹s begin solving the hamburger fat problem given above. Enter the data points into 2 lists in the calculator. The lists are found under the STAT key.
2. To enter or edit data points, use the EDIT menu.
3. Hit STAT, then the EDIT menu, then EDIT again. Enter the values for the saturated fats into the first list, which the calculator calls L1. Enter the total fat into the second list, L2.
4. To plot these data points on a graph, create a stat plot. This key is located above the Y= key, just below the screen on the far left. Hit the STAT PLOT key.
5. Now, choose Plot 1 by moving the cursor on top of it (use the arrow keys). Hit ENTER. You are inside the Plot 1 area. Turn it on by selecting ON, then hit ENTER.
6. Select the first graph to draw (scatterplot). Let the Xlist be L1 and the Ylist be L2. You can choose the mark you want to use for each point on your graph: dots, little plus signs, or little squares. Select the one you like best.
7. To see points in the graphing window, set the window up accordingly. Hit the WINDOW key. Our lowest X value (smallest amount of saturated fat) in L1 is 7. Let Xmin = 2 (a little lower than needed). Our largest X value is 18 , so let Xmax = 20. Since the difference between Xmax and Xmin is 18 , let the Xscl = 2. That way, our x-axis will show 9 marks ,each 2 units apart. Similarly, let Ymin = 15, Ymax = 50, and Yscl = 5
8. Now graph the scatterplot by hitting GRAPH.
***If the scatterplot is not visible, here are some possible reasons:
If your calculator says, ERR: DIM Mismatch, check your 2 lists to see if you have the same number of elements in each list (you may not). Do this using STAT , EDIT.
If nothing appears on your graph, you may not have turned Plot 1 on. Do STAT PLOT, turn Plot 1 on. Now, hit GRAPH again.
Your Window is not set up as you thought it was. Hit WINDOW and check it.

Unit 5, Activity 8, Line of Best Fit
9. It¹s time to get the linear regression line to go through the scatter plot. Hit STAT, go to the CALC menu, then choice #4, LinReg(ax + b). This will take you to the home screen, showing you LinReg (ax+b). Hit ENTER, and values for a and b will be given.
You can write these values down and then go into the Y= menu and manually type in the equation, using rounded values for a and b in the equation of the line.
Or, you can import these values, letting the calculator copy them in for you. To do this, hit the y= key. (Clear out any equations that remain from previous usage.) Put the cursor to the right of Y1 = . Let¹s find the linear regression equation and put it here.
Hit the VARS key located just below the down arrow key. Go to #5, statistics, and hit enter.The regression equation is under the EQ menu, so select EQ using the right arrow key. Choice #1 is RegEQ. Select this one, then hit ENTER. Your regression equation should have been copied into the Y1 = section of the calculator, and it should be in the form y = ax + b. Now, hit GRAPH, and you should see the line of regression cut through the scatterplot.
Now use the graph of the line to answer the following questions? (Hint: Use the trace button)
1) A hamburger contains 15 grams of saturated fat, how many grams of total fat would it contain?
2) A hamburger contains 35 grams of total fat, how many grams of saturated fat would it contain?
If you are asked to get values that are not listed in the window, you will need to use the TABLE function. So that everyone is on the same page, start your table at 1 and your (change in table) = 1. Now answer the following questions.
3) A cheeseburger contains 60 grams of total fat, how many grams of saturated fat would it contain?
4) A hamburger contains 4 grams of saturated fat, how many grams of total fat would it contain?

Unit 5, Activity 8, Line of Best Fit

Unit 5, Activity 10, Forensic Investigations
Name:___________________________________Date:__________________Forensic Science and Mathematics
When a piece of a skeleton is found forensic scientists are called in to analyze the bone to help aid in discerning information regarding the sex and height of the person to whom it once belonged. This assists police in determining the identity of the deceased.
The lengths of certain bones can be used to calculate the height of the deceased.The bones that can be used for this purpose are the femur (thigh) (F), the tibia (calf) (T), the humerus (bicep) (H), and the radius (forearm) ( R). When the length of one of these bones is known, one of the following formulas is used to determine the height. All measurements are in centimeters.
Female: Male:h = 61.412 + 2.317 F h = 69.089 + 2.238 Fh = 72.572 + 2.533T h = 81.688 + 2.392 Th = 64.977+ 3.144 H h = 73.570 + 2.970 Hh = 73.502 + 3.876 R h = 80.405 + 3.650 R
Note: If you are looking for a person of a specific age and are trying to tell if the skeletal remains are a match, you must take into consideration that the height of a person begins to decrease at the rate of approximately 0.06 cm per year. This shrinkage must be considered when the age of the victim is known.
1. The above equations are algebraic models. Sketch the graph of the four equations for males or females on one coordinate system. (Girls graph females, boys graph males) All measurements are in centimeters. Consider each of the following when sketching your graph.
When a forensic scientist determines the height of a person, the height depends on the length of the bone.
What is a reasonable domain for the four functions? Based on the domain what is a reasonable range for the four functions?
2. How can you tell from the graph which is the shortest of the four bones? 3. Working with your partner determine the following information:
How tall are you in centimeters? Find your height on the vertical axis and draw a horizontal line across the graph at this point. What is the equation of the horizontal line?
Read from the graph along the horizontal line the length in centimeters of your radius, humerus, tibia and femur. Record each result.
4. Have your partner measure the approximate lengths of these four bones with a tape measure and then answer the following questions;
Do these numbers seem to agree with the actual length of your bones? What assumption does the model make about all women or all men who are the same
height? Do you think this assumption is correct?

Unit 5, Activity 10, Forensic Investigations
5. Where do you think the numbers in each of the equations came from?
6. Find the point on the vertical axis that corresponds to 10 centimeters less than your present height and draw another horizontal line across the graph.
What is the equation of this line? Determine from the graph which of the four bones grew the most while your height
increased 10 centimeters. Which one grew the least? Which ones are about the same amount? Explain how you determined this.
7. What, if anything, is the significance of the y-intercepts in this model? (Do the values of y where the lines cross the y-axis mean anything in the real contexts of bones and height?) Explain.
8. If a forensic scientist only knows the length of a skeleton’s femur: How could he/she use your graph to determine the length of the humerus of the same
skeleton? How could he/she use the algebraic equation instead of the graph to determine the length
of the humerus? In your opinion which method would yield a more accurate length?

Unit 5, Activity 10, Forensic Investigations with Answers
Name:___________________________________Date:__________________Forensic Science and Mathematics
When a piece of a skeleton is found, forensic scientists are called in to analyze the bone to help aid in discerning information regarding the sex and height of the person to whom it once belonged. This assists police in determining the identity of the deceased.
The lengths of certain bones can be used to calculate the height of the deceased.The bones that can be used for this purpose are the femur (thigh) (F), the tibia (calf) (T), the humerus (bicep) (H) and the radius (forearm) ( R). When the length of one of these bones is known, one of the following formulas is used to determine the height. All measurements are in centimeters.
Female: Male:h = 61.412 + 2.317 F h = 69.089 + 2.238 Fh = 72.572 + 2.533T h = 81.688 + 2.392 Th = 64.977+ 3.144 H h = 73.570 + 2.970 Hh = 73.502 + 3.876 R h = 80.405 + 3.650 R
Note: If you are looking for a person of a specific age and are trying to tell if the skeletal remains are a match, you must take into consideration that the height of a person begins to decrease at the rate of approximately 0.06 cm per year. This shrinkage must be considered when the age of the victim is known.
1. The above equations are algebraic models. Sketch the graph of the four equations for males or females on one coordinate system. (Girls graph females, boys graph males) All measurements are in centimeters. Consider each of the following when sketching your graph.
When a forensic scientist determines the height of a person, the height depends on the length of the bone.
What is a reasonable domain for the four functions? (5 cm to 75 cm) Based on the domain what is a reasonable range for the four functions? (25 cm to 210 cm)
Females Males
From the lowest line upwards is the graph of the femur, tibia, humerus, and radius respectively.
2. How can you tell from the graph which is the shortest of the four bones? (Radius, because it has the greatest slope) 3. Working with your partner determine the following information:

Unit 5, Activity 10, Forensic Investigations with Answers
How tall are you in centimeters? (Varies) Find your height on the vertical axis and draw a horizontal line across the graph at this
point. What is the equation of the horizontal line ? (Varies) Read from the graph along the horizontal line the length in centimeters of your radius,
humerus, tibia and femur. Record each result.
4. Have your partner measure the approximate lengths of these four bones with a tape measure and then answer the following questions;
Do these numbers seem to agree with the actual length of your bones? (Yes) What assumption does the model make about all women or all men who are the same
height? (They have the same length bones) Do you think this assumption is correct? (Answers will vary)
5. Where do you think the numbers in each of the equations came from? (Answers will vary but some possible solutions would be from measuring the bones of living people or from the measurements taken during autopsies.)
6. Find the point on the vertical axis that corresponds to 10 centimeters less than your present height and draw another horizontal line across the graph.
What is the equation of this line? Determine from the graph which of the four bones grew the most while your height
increased 10 centimeters. (radius) Which one grew the least? (femur) Which ones are about the same amount? (femur and tibia) Explain how you determined this. (The one with the steeper slope grew the fastest, and if the slopes are nearly the same, then they grew the same amount.)
7. What, if anything, is the significance of the y-intercepts in this model? (Do the values of y where the lines cross the y-axis mean anything in the real contexts of bones and height?) Explain. (Not really as the x value could not be zero because even a baby’s bones have length)
8. If a forensic scientist only knows the length of a skeleton’s femur: How could he/she use your graph to determine the length of the humerus of the same
skeleton? (He/she could use the length as the y value and draw a line across the graph where it intersected with the humerus line. That would be the length of the humerus.)
How could he/she use the algebraic equation instead of the graph to determine the length of the humerus? (You could use the femur equation to determine the skeleton’s height. Then substitute that value for h in the humerus equation and solve for H.)
In your opinion which method would yield a more accurate length? (Varies, although without graphing technology the equation should yield the more accurate result.)

Unit 6, Activity 2, Composite Functions
Name:_________________________________________________Date:______________
Composite Functions
Complete the following charts and then determine an equation for each function and composite function.
x = f(x) = g(x)= f(g(x))= g(f(x)) =1 2 42 4 53 6 84 5 95 6 126 7 13
f(x) = g(x) =
f(g(x)) = g(f(x))=
x = f(x) = g(x)= f(g(x))= g(f(x)) =3 -3 9 34 68 2 24 18-2 -6 -24-5 -33-10 -16 -48
f(x) = g(x) =
f(g(x)) = g(f(x))=
x = f(x) = g(x)= f(g(x))= g(f(x)) =-3 9 -8 4-2 4 491 1 -40 0 -5 251 1 -42 4 -3 9
f(x) = g(x) =
f(g(x)) = g(f(x))=
Unit 6, Activity 2, Composite Functions
Name:_________________________________________________Date:______________
Composite Functions
Complete the following charts and then determine an equation for each function and composite function.
x = f(x) = g(x)= f(g(x))= g(f(x)) =1 2 2 4 32 4 3 6 53 6 4 8 74 8 5 10 95 10 6 12 116 12 7 14 13
f(x) = 2x g(x) = x+1
f(g(x)) =2(x+1) g(f(x))=2x + 1
x = f(x) = g(x)= f(g(x))= g(f(x)) =3 -3 9 3 -94 -2 12 6 -68 2 24 18 6-2 -8 -6 -12 -24-5 -11 -15 -21 -33-10 -16 -30 -36 -48
f(x) = x - 6 g(x) = 3x
f(g(x)) = 3x - 6 g(f(x))= 3(x-6)
x = f(x) = g(x)= f(g(x))= g(f(x)) =-3 9 -8 64 4-2 4 -7 49 0-1 1 -6 36 -40 0 -5 25 -51 1 -4 16 -42 4 -3 9 -1
f(x) = x2 g(x) = x - 5
f(g(x)) = (x-5)2 g(f(x))= x2 - 5Name:_______________________________________________Date:__________________

Unit 6, Activity 2, Composite Functions
Exploration of Inverse Functions
1) Graph the function f(x) = 2x, retrace the function three or four times so that the graph is very dark. Fold the paper across the dotted line and then firmly rub the back of the paper with your eraser so that the function trace is transferred to the other side of the dotted line.
2) Unfold the paper. The resulting graph is the inverse of the function. Retrace the resulting function and label it
3) Fill in the following two tables with at least five ordered pairs each.
x f(x) x
4) What do you notice in the tables above in terms of the domain and range of f(x) and

Unit 6, Activity 2, Composite Functions
? What pattern can be found?
5) Evaluate f(x) at x = 2. ________________ Evaluate at x = 4. _______________
6) How does this help explain the algebraic process for determining the inverse of the function as learned previously in Activity 3?
7) Given that f(x) = 2x, determine the equation for .______________________________
8) Can you determine that is also a function? Explain.
9) Repeat this procedure on graph paper with the functions g(x)=x2.
10) Do the table values have the same pattern? Explain.
11) Evaluate g(x) at x = 3.________________ Evaluate at x = 9. ________________
12) Do your findings verify the algebraic process for determining the inverse of a function?
13) Given that g(x)= x2, determine the equation for .___________________________
14) Can you determine that is also a function? Explain.Name:_______________________________________________Date:__________________

Unit 6, Activity 2, Composite Functions
Exploration of Inverse Functions

Unit 6, Activity 2, Composite Functions
1) Graph the function f(x)=2x, retrace the function three or four times so that the graph is very dark. Fold the paper across the dotted line and then firmly rub the back of the paper with your eraser so that the function trace is transferred to the other side of the dotted line.
2) Unfold the paper and the resulting graph is the inverse of the function, retrace the resulting function and label it .
3) Fill in the following two tables with at least five ordered pairs each.
x f(x) x 0 0 0 0
1 2 2 1 -1 -2 -2 -1 2 4 4 2 -2 -4 -4 -2
4) What do you notice in the tables above in terms of the domain and range of f(x) and ? What pattern can be found?
I noticed that the domain and range values were reversed.
5) Evaluate f(x) at x = 2. _____4 __________ Evaluate f -1(x) at x = 4. ____ 2 __________
6) How does this help explain the algebraic process for determining the inverse of the function as learned previously in Activity 3?
It explains why we exchange the x and y values when finding the inverse of a function.
7) Given that f(x) = 2x, determine the equation for .
8) Can you determine that f -1(x) is also a function? Explain.
Yes, the original function passes the horizontal line test. OR Yes. the new function passes the vertical line test.
9) Repeat this procedure on graph paper with the functions g(x)= x2.
10) Do the table values have the same pattern? Explain

Unit 6, Activity 2, Composite Functions
Yes, the domain and range values are reversed.
11) Evaluate g(x) at x = 3___9____________ Evaluate g -1(x) at x = 9 ___3____________
12) Do your findings verify the algebraic process for determining the inverse of a function?
Yes, to find the inverse of a function we would reverse the x and y values.
13) Given that g(x) = x2, determine the equation for g -1(x). g -1 (x) =
14) Can you determine that g-1(x) is also a function? Explain.g -1(x) is not an inverse function as the original function does not pass the horizontal line test. OR g -1(x) is not an inverse function as the new function does not pass the vertical line test.
Unit 6, Activity 6, Senior Trip
SENIOR TRIP
The Senior class of 300 students is planning a trip to Disney World© to celebrate finishing high school. You are in charge of organizing information regarding transportation including costs. You call three transportation companies and are given the following rates.
Travel-R-Us Bus holds 30 students and costs $100 per bus.
Brownhound Bus holds 45 students and costs $175 per bus
Get-It-Done Bus holds 90 students and costs $200 per bus
1. Create a graph of each of these functions on graph paper. Remember to label your x- and y-axes and title your graph. You should include enough buses to bring the entire senior class.
2. Complete the following table if the given number of students sign up for Senior trip.
# of students
Travel-R-Us Bus
Brownhound Bus
Get-It-Done Bus
MostExpensive
LeastExpensive
# of Buses
Cost # of Buses
Cost # of Buses
Cost
20
45
90
150
3. Determine the cost per student for the following number of students and the given bus line.(Note: The cost per student can be found by taking the total cost of the bus and dividing it by the number of students.)
113 students on Brownhound Bus? ______________________________
200 students on Get-It-Done Bus? ______________________________
280 students on Travel-R-Us Bus? ______________________________
4. How many students could each of the bus lines transport if $500 was allocated for transportation? Explain how you determined your answer.

Unit 6, Activity 6, Senior Trip with Answers
SENIOR TRIP
The senior class of 300 students is planning a trip to Disney World© to celebrate finishing high school. You are in charge of organizing information regarding transportation including costs. You call three transportation companies and are given the following rates.
Travel-R-Us Bus holds 30 students and costs $100 per bus.
Brownhound Bus holds 45 students and costs $175 per bus
Get-It-Done Bus holds 90 students and costs $200 per bus
1. Create a graph of each of these functions on graph paper. Remember to label your x- and y-axes and title your graph. You should include enough buses to bring the entire senior class.
Examples of graphs:

Unit 6, Activity 6, Senior Trip with Answers

Unit 6, Activity 6, Senior Trip with Answers
2. Complete the following table if the given number of students sign up for Senior trip.
# of students
Travel-R-Us Bus
Brownhound Bus
Get-It-Done Bus
MostExpensive
LeastExpensive
# of Buses
Cost # of Buses
Cost # of Buses
Cost
20 1 $100 1 $175 1 $200 Get-It-Done Travel-R-Us
45 2 $200 1 $175 1 $200 Get-It-DoneTravel-R-Us
Brownhound
90 3 $300 2 $350 1 $200 Brownhound Get-It-Done
150 5 $500 4 $700 2 $400 Brownhound Get-It-Done
3. Determine the cost per student for the following number of students and the given bus line.(Note: The cost per student can be found by taking the total cost of the bus and dividing it by the number of students.)
113 students on Brownhound Bus? _525/113 = 4.65 or $4.65 per student
200 students on Get-It-Done Bus? 600/201= 3.98 or $3.00 per student
280 students on Travel-R-Us Bus? _$1000 /280 = 3.21 or $3.57 per student
4. How many students could each of the bus lines transport if $500 was allocated for transportation? Explain how you determined your answer.
Travel-R-Us would provide transportation for 150 students.
Brownhound would provide transportation for 90 students.
Get-It-Done would provide transportation for 180 students.
You look on the graph for the y-value of $500 and then follow it across until you reach a step. The x-value of this step is the number of students that can be provided transportation.

Unit 6, Activity 8, Absolute Value
Name:__________________________________________________Date:________________
Exploring Absolute Value Equations and Inequalities.
Each pair of students should have a set of index cards numbered from -7 to 7. Place the cards face up in numerical order, side by side, to form a number line.
For each of the problems listed below, one partner should turn over the cards whose numbers are solutions. The other partner should agree or disagree with the answer. If the partners disagree, they should discuss the process for determining the solution. Once in agreement, both students should graph the solutions on the number line provided and then record the result algebraically below the number line. Take turns turning over the cards and checking the answers of your partner..
1. |x + 3| = 4 2. |3x| < 6
-6 -4 -2 0 2 4 6 -6 -4 -2 0 2 4 6
3. |x – 3| = 2 4. |2x| =10
-6 -4 -2 0 2 4 6 -6 -4 -2 0 2 4 6
5. |x – 4| = -5 6. |x+1| < 5
-6 -4 -2 0 2 4 6 -6 -4 -2 0 2 4 6
7. |2x - 3| > 1 8. |2x| 8
-6 -4 -2 0 2 4 6 -6 -4 -2 0 2 4 6

Unit 6, Activity 8, Absolute Value
Name:__________________________________________________Date:________________
Exploring Absolute Value Equations and Inequalities.
Each pair of students should have a set of index cards numbered from -7 to 7. Place the cards face up in numerical order, side by side, to form a number line.
For each of the problems listed below, one partner should turn over the cards whose numbers are solutions. The other partner should agree or disagree with the answer. If the partners disagree they should discuss the process for determining the solution. Once in agreement, both students should graph the solutions on the number line provided and then record the result algebraically below the number line. Take turns turning over the cards and checking the answers of your partner..
1. |x + 3| = 4 2. |3x| < 6
-6 -4 -2 0 2 4 6 -6 -4 -2 0 2 4 6
x = -7 or x = 1 -2 < x < 2
3. |x – 3| = 2 4. |2x| =10
-6 -4 -2 0 2 4 6 -6 -4 -2 0 2 4 6 x = -1 or x = 5 x = -5 or x = 5
5. |x – 4| = -5 6. |x+1| > 5
-6 -4 -2 0 2 4 6 -6 -4 -2 0 2 4 6 (not possible) x < -6 or x > 4
7. |2x - 3| > 1 8. |2x| < 8
-6 -4 -2 0 2 4 6 -6 -4 -2 0 2 4 6
x < -1 or x > 2

Unit 6, Activity 8, Absolute Value
Name:__________________________________________________Date:________________
Absolute Value Functions Translations
Graph the following equations on a graphing calculator and fill in the columns as you go.
Translation A - Adding/subtracting a constant to the variable inside the absolute value Equation Vertex What happened to the graph?1. y = |x|2. y = |x + 3|3. y = |x + 8|4. y = |x – 4|5. y = | x – 6|
When a constant (h) is added/subtracted to/from the variable inside of the absolute value how does it translate the graph?
Does the translation of the graph change the number of zeroes? Explain.
Translation B – Adding/Subtracting a value to/from the absolute valueEquation Vertex What happened to the graph?1. y = |x|2. y = |x| +2 3. y = |x| + 54. y = |x| - 45. y = |x| - 6
When a constant (k) is added/subtracted to/from the absolute value how does it translate the graph?
Does the translation of the graph change the number of zeroes? Explain

Unit 6, Activity 8, Absolute Value
Name:__________________________________________________Date:________________
Absolute Value Functions Translations
Graph the following equations on a graphing calculator and fill in the columns as you go.
Translation A- Adding/subtracting a constant to the variable inside the absolute value Equation Vertex What happened to the graph?1. y = |x| (0, 0) Original function2. y =|x + 3| (-3, 0) Shifted the graph three units left3. y = |x + 8| (-8, 0) Shifted the graph eight units left4. y = |x – 4| (4, 0) Shifted the graph four units right5. y = | x – 6| (6, 0) Shifted the graph six units right
When a constant (h) is added/subtracted to/from the variable inside of the absolute value how does it translate the graph?
The graph of the absolute value function shifted left when a constant was subtracted, and right when a constant was added to the variable inside the absolute value. Therefore, the vertex shifted as well.
Does the translation of the graph change the number of zeroes? Explain. No, since the graph is only moving along the x-axis, there remains only one zero.
Translation B – Adding/Subtracting a value to/from the absolute valueEquation Vertex What happened to the graph?1. y = |x| (0, 0) Original function.2. y = |x| +2 (0,2) Shifted the graph two units up3. y = |x| +5 (0, 5) Shifted the graph five units up4. y = |x| - 4 (0,-4) Shifted the graph four units down5. y = |x| - 6 (0, -6) Shifted the graph six units down
When a constant (k) is added/subtracted to/from the absolute value, how does it translate the graph?
The graph of the absolute value function shifted up when a constant was added and shifted down when a constant was subtracted. Therefore, the vertex of the graph also shifted.
Does the translation of the graph change the number of zeroes? Explain
Yes, since the graph shifts up or down the number of zeroes increases to two because the vertex is no longer on the x axis.
Unit 7, Activity 5, Factoring Quadratic Expressions
Name:________________________________________________Date:________________
Factoring Trinomials
Factoring trinomials is not difficult. Below is a process you can use to turn any factorable trinomial into four terms which you can then factor by grouping.
Step 1: Given a factorable quadratic expression. 4x2 – 17x – 15
Step 2: Multiply the coefficient of the first term by the last term (the constant). (4)(-15) = -60
Step 3: Determine two factors that will multiply to the product (-60) whose sum is -17 (the middle term coefficient). (-20) and (3)
Step 4: Regroup -17x to -20x +3x. 4x2 -20x +3x -15
Step 5: Factor by grouping. 4x(x -5) + 3(x -5) (x -5) (4x +3)
-----------------------------------------------------------------------------------------------------------------
1) 5x2 + 22x + 8 2) 3x2 – 19x + 20
3) 12x2 + x - 63 4) 6x2 - 41x -7
5) 21x2 + 22x – 8 6) 48x2 -10x -3
7) 10x2 – 31x + 15 8) 8x2 +26x + 15

Unit 7, Activity 5, Factoring Quadratic Expressions
Name:________________________________________________Date:________________
Factoring Trinomials
Factoring trinomials is not difficult. Below is a process you can use to turn any factorable trinomial into four terms which you can then factor by grouping.
Step 1: Given a factorable quadratic expression. 4x2 – 17x – 15
Step 2: Multiply the coefficient of the first term by the last term (the constant). (4)(-15) = -60
Step 3: Determine two factors that will multiply to the product (-60) whose sum is -17 (the middle term coefficient). (-20) and (3)
Step 4: Regroup -17x to -20x +3x. 4x2 -20x +3x -15
Step 5: Factor by grouping. 4x(x -5) + 3(x -5) (x -5) (4x +3)
-----------------------------------------------------------------------------------------------------------------
1) 5x2 + 22x + 8 2) 3x2 – 19x + 20
5x2 + 20x + 2x + 8 3x2 – 15x – 4x + 20 5x(x +4) +2(x + 4) 3x(x – 5) – 4 (x – 5) (x + 4) (5x + 2) (x – 5) (3x – 4)
3) 12x2 + x - 63 4) 6x2 - 41x -7
12x2 + 28x – 27x – 63 6x2 -42x + x -7 4x(3x + 7) – 9(3x + 7) 6x(x – 7) + (x – 7) (3x + 7) (4x - 9) (x - 7) (6x + 1)
5) 21x2 + 22x – 8 6) 48x2 -10x -3
21x2 + 28x – 6x – 8 48x2 + 8x – 18x – 3 7x(3x + 4) – 2(3x + 4) 8x(6x + 1) – 3(6x +1) (3x+4) (7x - 2) (6x+1) (8x - 3)
7) 10x2 – 31x + 15 8) 8x2+26x + 15
10x2 – 25x – 6x + 15 8x2 +20x + 6x + 15 5x(2x – 5) – 3(2x – 5) 4x(2x + 5) + 3(2x + 5) (2x – 5) (5x – 3) (2x + 5) (4x + 3)
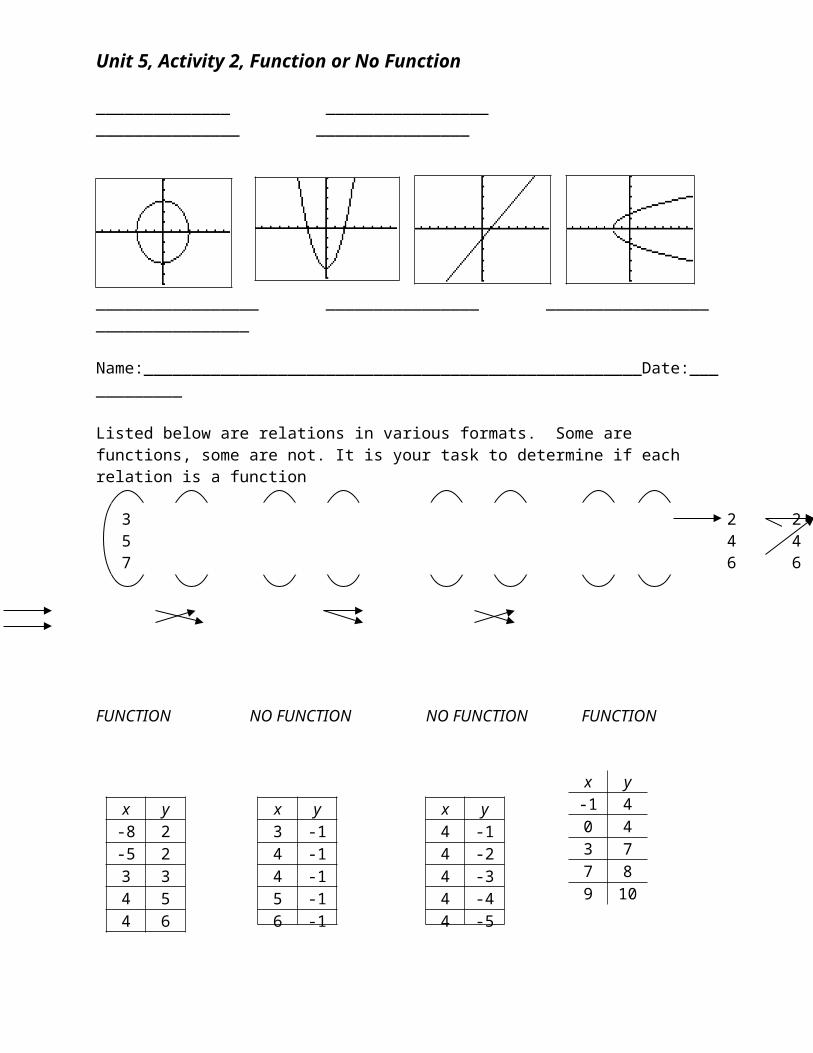
Unit 7, Activity 5, Factoring Quadratic Expressions
Name:________________________________________________Date:__________________
Geometric Applications
Create a diagram to represent the problem, label your variables, determine a quadratic equation to represent the problem and then solve.
1. The area of a rectangular room is 140 ft2. The width is four feet less than the length. What are the dimensions of the room? Explain how you determined the dimensions.
2. You are making a coffee table with a glass top surrounded by a cherry border. The glass is 3 feet by 3 feet. You want the cherry border to be a uniform width. You have 7 square feet of cherry to make the border. What should the width of the border be?
3. You are making a picture frame for a painting. The painting is 11 inches by 13 inches and you have 52 square inches of pine to make the frame. Determine the width of the specified frame?
4. You are having new sod placed in your yard and your yard fenced. You know the width of your yard is 3 feet wider than the length. The landscaper states you will need 12 square yards of sod and 48 feet of fencing. Are his calculations correct? Explain your reasoning.
5. Cantrell wants to create a pond in his yard that is 4 feet longer than it is wide. He wants to lay out weed block before putting in the pond. If the weed block covers 165 square feet, what should the dimensions of his pond be?
6. The length of Eduardo’s garden was 5 feet more than its width. This year, Eduardo decided to make the garden 4 feet longer and double its width. If his garden is now 380 square feet, what were the dimensions of his original garden? What are the dimensions of his garden now?
7. Madison has enough bricks to make a 30- foot long border around the rectangular vegetable garden she is planning. The booklet she received from the plant nursery when she bought the seeds states the plants will need space to grow, and advises that the seeds should be planted in an area of 54 square feet. What should the dimensions of her garden be? Explain your reasoning.
8. A high school wants to double the size of its parking lot by expanding the existing lot as shown in the plans to the right. By what distance x should the lot be expanded.
150 ft school
old parking lot
new parking lotx ft
75 ft
300 ft. 75 ft x ft

Unit 7, Activity 5, Factoring Quadratic Expressions
Name:________________________________________________Date:__________________
Geometric Applications
Create a diagram to represent the problem, label your variables, determine a quadratic equation to represent the problem and then solve.
1. The area of a rectangular room is 140 ft2. The width is four feet less than the length. What are the dimensions of the room? Explain how you determined the dimensions. (l-4)(l) = 140 14 ft. by 10 ft.
2. You are making a coffee table with a glass top surrounded by a cherry border. The glass is 3 feet by 3 feet. You want the cherry border to be a uniform width. You have 7 square feet of cherry to make the border. What should the width of the border be?(2x+3)(2x+3)= 16 x = ½ foot
3. You are making a picture frame for a painting. The painting is 11 inches by 13 inches and you have 52 square inches of pine to make the frame. Determine the width of the specified frame?(13 + 2x)(11+2x) = 195 x = 1 inch
4. You are having new sod placed in your yard and your yard fenced. You know the width of your yard is 3 feet wider than the length. The landscaper states you will need 12 square yards of sod and 48 feet of fencing. Are his calculations correct? Explain your reasoning. No they are not correct. 12 square yards equals 108 square feet so the dimensions of the yard are 12 ft by 9 feet and therefore the perimeter is 42 feet not 48 feet. (w+3)(w) = 108; w = 9 l = 12. The perimeter must be 42 feet.
5. Cantrell wants to create a pond in his yard that is 4 feet longer than it is wide. He wants to lay out weed block before putting in the pond. If the weed block covers 165 square feet, what should the dimensions of his pond be? (w)(w+4) = 165 15 feet by 11 feet
6. The length of Eduardo’s garden was 5 feet more than its width. This year, Eduardo decided to make the garden 4 feet longer and double its width. If his garden is now 380 square feet, what were the dimensions of his original garden? What are the dimensions of his garden now? (2w)(w+9)=380 Original dimensions were 10 feet by 15 feet. Current dimensions are 20 feet by 19 feet.
7. Madison has enough bricks to make a 30- foot long border around the rectangular vegetable garden she is planning. The booklet she received from the plant nursery when she bought the seeds states the plants will need space to grow, and advises that the seeds should be planted in an area of 54 square feet. What should the dimensions of her garden be? (15-w)(w)= 54; 9 feet by 6 feet
8. A high school wants to double the size of its parking lot by expanding the existing lot as shown in the plans to the right. By what distance x should the lot be expanded? See student worksheet for diagram. (240+x)(375+x)=130,500; x = 60 feet
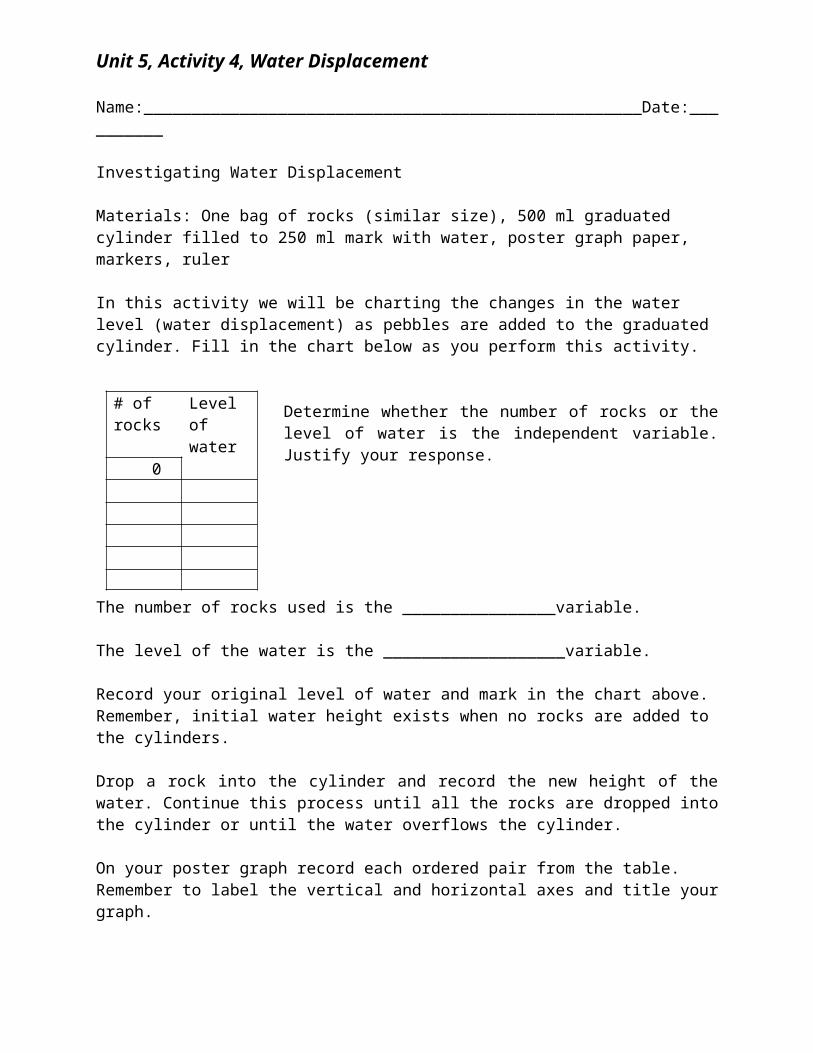
Unit 7, Activity 8, Translating Quadratic Functions
Name:___________________________________________________Date:_______________
Translating Quadratic Functions
Use your graphing calculator to complete the following investigation. Record your answers using complete sentences in your notebook.
is the equation of the parent graph for a quadratic function. Use your graphing calculator to graph this function in Y1. Note the changes in the graph of Y2 in each of the following situations.
1. Change the coefficient of x2 to a number greater than one. Record the change from the parent graph.
2. Change the coefficient of x2 to a number greater than zero but less than one. Record the
change from the parent graph.
3. Change the coefficient of x2 to a number less than zero but greater than negative one.What do you notice?
4. Change the coefficient to a number less than negative one. What do you notice?
5. Return to a leading coefficient of 1 and then add a positive number to x2. What do you notice?
6. Instead of adding a positive number to x2, subtract a positive number from x2. What do you notice?
7. This time add a positive number to the x before you square it. What do you notice?
8. Finally, subtract a positive number from x before you square it. What do you notice?
Determine the translation(s) of the parent graph y = x2 that occur for each of the equations below.

Unit 7, Activity 8, Translating Quadratic Functions with Answers
Name:___________________________________________________Date:_______________
Translating Quadratic Functions
Use your graphing calculator to complete the following investigation. Record your answers using complete sentences in your notebook.
is the equation of the parent graph for a quadratic function. Use your graphing calculator to graph this function in Y1. Note the changes in the graph of Y2 in each of the following situations.
1. Change the coefficient of x2 to a number greater than one. Record the change from the parent graph. (The graph of the parabola narrows.)
2. Change the coefficient of x2 to a number greater than zero but less than one. Record the
change from the parent graph. (The graph of the parabola widens.)
3. Change the coefficient of x2 to a number less than zero but greater than negative one.What do you notice? (The graph of the parabola is reflected across the x-axis and narrows.)
4. Change the coefficient to a number less than negative one. What do you notice? (The graph of the parabola is reflected across the x-axis and widens.)
5. Return to a leading coefficient of 1 and then add a positive number to x2. What do you notice? (The graph of the parabola shifts upward).
6. Instead of adding a positive number subtract a positive number from x2. What do you notice? (The graph of the parabola shifts downward.)
7. This time add a positive number to the x before you square it. What do you notice? (The graph of the parabola shifts to the left.)
8. Finally subtract a positive number from x before you square it. What do you notice? (The graph of the parabola shifts to the right.)
Determine the translation(s) of the parent graph y = x2 that occur for each of the equations below.
Solutions: a) The graph of the parabola shifts 3 units to the right. b) The graph of the parabola narrows and shifts 4 units to the right. c) The graph of the parabola widens and shifts up 2 units. d) The graph of the parabola reflects over the x-axis, narrows, and shifts down 5 units.

Unit 7, Activity 8, Translating Quadratic Functions with Answers
Name:_________________________________________________________Date:_______________
Exploring Quadratic Functions
Factor . __________________________________
Set the function = 0 and solve for x: __________________________________
Graph using your graphing calculator.
Use the trace button or table on your graphing calculator to determine the x- and y-intercepts.
x-intercepts: ___________________________ y-intercepts:_______________________
Use the trace button or table on your graphing calculator to determine the vertex of the parabola given by the function. _________.
Suggest possible relationships between the function equation, its algebraic solutions, and the geometric components of the function located, using the trace button or table.
.STOP HERE AND LET THE TEACHER KNOW YOU HAVE FINISHED THE FIRST HALF.
Record below if your hypothesis was confirmed or nullified. Were you able to confirm or nullify hypotheses presented by other students or the teacher? Explain.

Unit 7, Activity 9, Exploring Quadratic Functions with Answers
Name:_________________________________________________________Date:_______________
Exploring Quadratic Functions
Factor . _____ (x-4)(x-2) ______________________
Set the function = 0 and solve for x: ____x = 4 or x = 2____________________
Graph using your graphing calculator.
Use the trace button or table on your graphing calculator to determine the x and y intercepts.
x intercepts: ___(2,0) (4, 0)_____________ y intercepts:___(0,8)____________________
Use the trace button or table on your graphing calculator to determine the vertex of the parabola given by the function. _(3, -1)________.
Suggest possible relationships between the function equation, its algebraic solutions, and the geometric components of the function located using the trace button or table.
Possible relationships: The x intercepts are the same values you get when solving for the variable. (correct) The constant in the equation is always the y intercept.(correct) The x-value for the vertex is always half of the opposite of the middle term. (incorrect) The solutions for x are the values where it crosses the x axis on the graph. (correct) The axis of symmetry is halfway between the x intercepts. (correct)
STOP HERE AND LET THE TEACHER KNOW YOU HAVE FINISHED THE FIRST HALF.
Record below if your suggested relationships were correct? Explain.
See above for correct solutions.

Unit 7, Activity 10, Exploring Quadratic Regression
EXPLORING QUADRATIC REGRESSION
A rocket is launched from a platform. The height is recorded for each .3 seconds.Record the following data in your graphing calculator and determine a quadratic equation for the function. (See steps below)
Time (secs)____Height_(ft)__ 0 7
.3 16.06
.6 22.24
.9 25.54 1.2 25.96
1.5 23.51.8 18.162.1 9.942.4 -1.16
Enter this data into your calculator using the STAT key. Key in EDIT which will take you to the list columns. You should enter the time in L1 and height in L2.
We now want to plot these points on the graph, so key in STAT PLOT, choose Plot 1 and then turn it on, set the type of plot to scatter, put L1 as our X list and L2 as your Y list and then choose your mark.
Finally, key in GRAPH to see the scatter-plot graph. If the graph does not appear then choose ZOOM 9 (ZoomStat) and the graph should appear.
Does the graph appear to be quadratic?
You can find the quadratic equation for this function by again keying in STAT, then move your cursor to CALC, move down to QuadReg (this stands for quadratic regression), and ENTER will determine a quadratic equation for the given data.
After you have the quadratic equation, you can put it in your Y= by simply keying in Y= then VARS, then Statistics, move the cursor over to EQ and choose RegEQ. The equation will automatically appear in the Y = screen.
Now GRAPH the equation.

Unit 7, Activity 10, Exploring Quadratic Regression with Answers
EXPLORING QUADRATIC REGRESSION
A rocket is launched from a platform. The height is recorded for each .3 seconds.Record the following data in your graphing calculator and determine a quadratic equation for the function. (See steps below)
_Time (secs)___Height_(ft)__ 0 7
.3 16.06
.6 22.24
.9 25.54 1.2 25.96
1.5 23.51.8 18.162.1 9.942.4 -1.16
Enter this data into your calculator using the STAT key. Key in EDIT which will take you to the list columns. You should enter the time in L1 and height in L2. (see above)
We now want to plot these points on the graph, so key in STAT PLOT, choose Plot 1 and then turn it on, set the type of plot to scatter, put L1 as our X list and L2 as your Y list and then choose your mark.
Finally, key in GRAPH to see the scatter-plot graph. If the graph does not appear then choose ZOOM 9 (ZoomStat) and the graph should appear.
Does the graph appear to be quadratic? Yes
You can find the quadratic equation for this function by again keying in STAT, then move your cursor to CALC, move down to QuadReg (this stands for quadratic regression) and ENTER will determine a quadratic equation for the given data.
y = -16x2 + 35x + 7

Unit 7, Activity 10, Exploring Quadratic Regression with Answers
After you have the quadratic equation you can put it in your Y= by simply hitting Y= then VARS, then Statistics, move the cursor over to EQ and choose RegEQ. The equation will automatically appear in the Y = screen.
Now GRAPH the equation.
Explain to students that we can now use the trace button to determine information related to the given function.

Time (s) Height (in)0.000.250.500.751.001.251.501.752.002.252.502.753.003.253.503.754.00
01528394855606364636055483928150
Unit 7, Activity 10, Basketball
Name:______________________________________________________Date:_____________
1. Use your calculator to create a scatter plot and determine a quadratic function for the data table:
a. Import the quadratic equation into Y=. Does the graph match your scatter plots perfectly?
b. Use the equation or the graph to figure out when the ball reaches a height of about 58 inches. Explain how you determined the time. (Do not use the table listed)
c. Use the equation or the graph to find the height of the ball after 1.6 seconds (round to nearest tenth) Explain how you determined the height. (Do not use the table listed)
2. In the example above, the initial height of the ball is 0 inches. What does this indicate? A more realistic equation for the height of the ball after t seconds is b = -16t2 + 64t + 60. Why?
a. Make a table and a graph for this quadratic function.b. The 60 is called a constant term because it does not contain a variable. How does the
constant term affect the table and the graph from the original problem? What information does the constant term in this equation tell you?c. Compare the graphs of the equations in questions 1 and 2. Discuss the similarities and
differences in the following: i. the maximum height reached by the ballii. the x-interceptsiii. the pattern of change in the height of the ball over time.
Record your conclusions.
Name:______________________________________________________Date:_____________
A. Describe how the height of the ball changes over this 4-second time period?
B. Without making the graph, describe what the graph of these data would look like. Include as many important features as you can.

Time (s) Height (in)0.000.250.500.751.001.251.501.752.002.252.502.753.003.253.503.754.00
01528394855606364636055483928150
Unit 7, Activity 10, Basketball
1. Use your calculator to create a scatter plot and determine a quadratic function for the data table:
a. Import the quadratic equation into Y=. Does the graph match your scatter plots perfectly? Yes
b. Use the equation or the graph to figure out when the ball reaches a height of about 58 inches. Explain how you determined the time. (Do not use the table listed)
Possible solutions: 1.35 seconds Used the TRACE button on the calculator 1.38 secondsUsed the TBL SET and TABLE on the calculator
c. Use the equation or the graph to find the height of the ball after 1.6 seconds (round to nearest tent) Explain how you determined the height. (Do not use the table listed)
A. Describe how the height of the ball changes over this 4-second time period? It rises up to 60 inches of height and then returns to earth after 4 minutes.B. Without making the graph, describe what the graph of these data would look like. Include as many important features as you can. It would look like an upside down parabola.

Unit 7, Activity 10, Basketball
Possible solutions: 61.4 feet Used the TRACE button on the calculator 61.4 feet Used the TBL SET and TABLE on the calculator
2. In the example above, the initial height of the ball is 0 inches. What does this indicate?
That the ball began to rise up from the floor (0 inches).
A more realistic equation for the height of the ball after t seconds is b = -16t2 + 64t + 60. Why? Because the ball would be thrown from about 5 feet high. In order to shoot the basketball or throw the basketball up it is more likely the person was standing up and then throwing the ball upwards.
a. Make a table and a graph for this quadratic function.
b. The 60 is called a constant term because it does not contain a variable. How does the constant term affect the table and the graph from the original problem?
The ball starts at 60 inches high so the y-intercept is 60 instead of 0. All the values in the table are 60 units higher than before. The graph of the parabola is shifted upwards 60 units. That is why the graph window required changing.
What information does the constant term in this equation tell you? The height the ball was thrown from.
c. Compare the graphs of the equations in question 1 and 2. Discuss the similarities and differences in the following:
i. the maximum height reached by the ball 1: 64 inches 2: 124 inchesii. the x-intercepts 1: x = {0, 0} 2: x = {-.78, 4.8} The graph shifted up 60 units
causing new x intercepts.iii. the pattern of change in the height of the ball over time. The pattern does not
really change because the parabola is just shifted up.
Record your conclusions. The graphs are similar in that they are both parabolas that open downward (concave downward). The graphs are different because the second graph is shifted upwards causing the x- and y-intercepts to change.

Name:___________________________________________Date:___________________
Buying on Credit
Listed below are various types of credit cards, their interest rates, and minimum payments.
Credit Card Interest Rate Minimum paymentVixa 10% compounded daily $15MinorCard 12% compounded monthly $25Conquer 12% compounded monthly $50
Starting with a $2000 credit card balance, what is the balance of each of these credit cards afterone year, assuming you paid the minimum payment each month?
Vixa: _________________ MinorCard: ___________________ Conquer:_________________
What is the total interest amount paid for the year?
Vixa:___________________ MinorCard: __________________ Conquer:_________________
How important is the interest percentage rate in reducing debt? Explain using examples from above.
How important is the monthly payment in reducing debt? Explain using examples from above.
Which do you think is the most important in paying back debt: the interest rate or the monthly payment? Explain.
Some students take out an unsubsidized Stafford Loan to help pay for college. With this type of loan interest accrues on the loan although you do not have to make a payment while still in school.
If you took out a $8000 unsubsidized Stafford Loan in your freshman year of college at 6% interest compounded monthly, what will be the balance of the loan when you graduate 4 years later? How could you reduce this amount prior to your graduation?

Name:___________________________________________Date:___________________
Buying on Credit
Listed below are various types of credit cards, their interest rates, and minimum payments.
Credit Card Interest Rate Minimum paymentVixa 10% compounded daily $15MinorCard 12% compounded monthly $25Conquer 12% compounded monthly $50.Starting with a $2000 credit card balance, what is the balance of each of these credit cards afterone year, assuming you paid the minimum payment each month?
Vixa: ____$2,021.79 ___ MinorCard: ___$1,936.59______ Conquer:__$1,619.53_________
What is the total interest amount paid for the year?
Vixa:____$201.79_____ MinorCard: ____$236.59_______ Conquer:____$219.53_________
How important is the interest percentage rate in reducing debt? Explain using examples from above.The lower the interest rate the less interest you pay so if you have a credit card with a lower percentage you will pay less interest. The Vixa card has the lowest interest rate at 10% and also has the lowest amount of interest paid.
How important is the monthly payment in reducing debt? Explain using examples from above.The higher the monthly payment, the quicker your debt is reduced. Although Conquer charges a higher interest rate the balance after one year is much lower. The balance on Vixa has actually increased because the minimum payment was less than the interest charged each month.
Which do you think is the most important in paying back debt: the interest rate or the monthly payment? Explain.The monthly payment because the larger your monthly payment the quicker it is paid off. Since your balance reduces quicker the overall interest amount you will pay on the loan is also reduced.
Some students take out an unsubsidized Stafford Loan to help pay for college. With this type of loan interest accrues on the loan although you do not have to make a payment while still in school.
If you took out a $8000 unsubsidized Stafford Loan in your freshman year of college at 6% interest compounded monthly, what will be the balance of the loan when you graduate 4 years later? How could you reduce this amount prior to your graduation? $10,163.92 You could reduce the amount owed by making payments on the loan whenever possible throughout your school years. This would reduce the interest paid as well.

Name:______________________________________________Date:___________
Louisiana Swamps Growth and Decay
1) Alligator hunting was not allowed for a number of years in Louisiana due to the ever decreasing population. In recent years alligator hunting is permitted on a limited basis from September 1st to the 30th each year. This is done to help control the population of alligators without eliminating the population entirely. If the estimated initial population of alligators in a given Louisiana swamp area was 400 alligators, and the population grows annually at a rate of 0.243, how many alligators would exist in the same area 5, 10, 20 years from now if hunting was no longer permitted.
2) Preserving Louisiana wetlands, including swamps, is important for preserving our way of life in southeast Louisiana. In 1990, there were 543,860 acres of swamp in coastal Louisiana, and even with restoration efforts, the acres of swamp lost was approximately 9% per year.* How many acres of swamp land remain in 2015? (Round to nearest acre.)
3) The Nature Conservancy of Louisiana's goal is to restore 20,000-acres of natural cypress-tupelo swamp and bottomland hardwood forest. Approximately 9,500 acres of important cypress-tupelo swamp and bottomland hardwood forest habitat is protected at Cypress Island Preserve.** With restoration efforts this habitat will increase at a rate of 2% . Can the Nature Conservancy of Louisiana’s goal be reached in 50 years? (Assume continuous growth).
Sources: * http://www.lacoast.gov/Programs/2050/MainReport/report1.pdf **http://www.nature.org/wherewework/northamerica/states/louisiana/preserves/art6856.html

Unit 8, Activity 7, Louisiana Swamps Growth and Decay with Answers
Name:______________________________________________Date:___________
Louisiana Swamp Growth and Decay
1) Alligator hunting was not allowed for a number of years in Louisiana due to the ever decreasing population. In recent years alligator hunting is permitted on a limited basis from September 1st to the 30th each year. This is done to help control the population of alligators without eliminating the population entirely. If the estimated initial population of alligators in a given Louisiana swamp area was 400 alligators, and the population grows annually at a rate of 0.243, how many alligators would exist in the same area 5, 10, 20 years from now if hunting was no longer permitted.
2) Preserving Louisiana wetlands, including swamps, is important for preserving our way of life in southeast Louisiana. In 1990, there were 543,860 acres of swamp in coastal Louisiana, and even with restoration efforts, the acres of swamp lost was approximately 9% per year.* How many acres of swamp land remain in 2015? (Round to nearest acre.)
3) The Nature Conservancy of Louisiana's goal is to restore 20,000-acres of natural cypress-tupelo swamp and bottomland hardwood forest. Approximately 9,500 acres of important cypress-tupelo swamp and bottomland hardwood forest habitat is protected at Cypress Island Preserve.** With restoration efforts this habitat will increase at a rate of 2% . Can the Nature Conservancy of Louisiana’s goal be reached in 50 years? (Assume continuous growth). Yes
Sources: * http://www.lacoast.gov/Programs/2050/MainReport/report1.pdf**http://www.nature.org/wherewework/northamerica/states/louisiana/preserves/art6856.html

Unit 8, Activity 8, Interested? Research Project
Name Due Date
INTERESTED?
In this research project, you will choose a financial institution in town or on the Internet. Each pair of students in a class must choose a different bank, so claim your bank early. Contact the bank or go online to find out information about the interest rates available for two different types of accounts and how they are compounded. Fill in the following information and solve the following problems. When all projects are in, you will report to the class.
Information Sheet: Name of bank, name of person you spoke to, bank address and phone number or the URL if online, types of accounts, interest rates, and how funds are compounded.
Problem: Create a hypothetical situation in which you invest $1000.(1) Find the equation to model two different accounts for your bank.(2) Determine how much you will have at the end of high school, at the end of college,
and when you retire after 50 years for each account. (Assume you finish high school in one year and college four years later.)
(3) Determine how many years it will take you to double your money for each account. (4) Determine in which account you will put your money and discuss why.
Class Presentation: Display all information on a poster board and report to the class.
Grading Rubric for Data Research Project10 pts. Information sheet: Name of bank, name of person you spoke to, bank
address and phone number or the URL if online, types of accounts, interest rates, and how funds are compounded (source and date of data)
10 pts. Compound interest equation for each situation. Account value for both accounts at the end of high school, college, and when you retire in 50 years (show all your work).
10 pts. Solution showing your work of how long it will take you to double your money in each account.
10 pts. Discussion of where you will put your money and why10 pts. Poster - neatness, completeness, readability10 pts. Class presentation

Unit 8, Activity 9, Maps of Cinnabar and Kelvar
Name:______________________________________________________Period:________
MAP OF CINNABAR
MAP OF KELVAR

Unit 8, Activity 9, Maps of Cinnabar and KelvarName:______________________________________________Period:__________
MAP OF PEROUSE
Use the first map of Perouse to create a graph of the map to determine the minimum number of colors needed to color the map. ___________.
Color the map of Perouse below using the minimum number of colors.
Name:______________________________________________________Period:________

Unit 8, Activity 9, Maps of Cinnabar and Kelvar
MAP OF CINNABAR Possible solution (other correct colorings are also possible)R = Red and Y = Yellow
MAP OF KELVAR Possible solution (other correct colorings are also possible)R = Red and Y = Yellow B= Blue
Name:______________________________________________Period:__________
Y
Y
Y
YR
R R
RR
B
Y
Y
B
R
R
R

Unit 8, Activity 9, Maps of Cinnabar and Kelvar
MAP OF PEROUSE
Use the first map of Perouse to create a graph of the map to determine the minimum number of colors needed to color the map. ______ 4 _____.
Color the map of Perouse below using the minimum number of colors.Possible solution (other correct colorings are also possible)
R = Red and Y = Yellow B= Blue G = Green
Name:_____________________________________________________Period:_______
Color the maps below using the minimum number of colors.
R
R
Y
G
R
B
B
G

Unit 8, Activity 9, Maps of Cinnabar and Kelvar
Name:_____________________________________________________Period:_______
Color the maps below using the minimum number of colors. R= red Y= yellow B=blue G=green

Unit 8, Activity 9, Maps of Cinnabar and Kelvar
Name:________________________________________________Period:_________
Solution: 3 colors R
R
RY
YY
B
Y
G
YR
R
BB
B
Y
Solution: 4 colors
R
RY
YB
B
R
Solution: 3 colors

Unit 8, Activity 9, Maps of Cinnabar and KelvarThe town of Konigsberg, Prussia was divided into four sections by the branches of the Pregel River. In the 18th century seven bridges connected these regions. Point out the seven bridges on the overhead transparency. They wondered whether it was possible to start at some location in the town, travel across all the bridges without crossing any bridge twice, and then return to the starting point.
1) Create the graph modeling the Konigsberg bridge problem.
2) Choose a starting vertex and try to trace the graph without retracing any edge. Repeat the process with each vertex as a starting point.
3) In how many different ways did you start your tracing? Were you able to trace all the edges of the graph without retracing any edges?
4) What do you think was Euler’s solution to the Konigsberg bridge problem?
Name:________________________________________________Period:_________

Unit 8, Activity 9, Maps of Cinnabar and KelvarThe town of Konigsberg, Prussia was divided into four sections by the branches of the Pregel River. In the 18th century seven bridges connected these regions. Point out the seven bridges on the overhead transparency. They wondered whether it was possible to start at some location in the town, travel across all the bridges without crossing any bridge twice, and then return to the starting point.
1) Create the graph modeling the Konigsberg bridge problem. This is just one solution, others are possible.
2) Choose a starting vertex and try to trace the graph without retracing any edge. Repeat the process with each vertex as a starting point.
3) In how many different ways did you start your tracing? (14) Were you able to trace all the edges of the graph without retracing any edges? no
4) What do you think was Euler’s solution to the Konigsberg bridge problem? It’s impossible.
Name:_____________________________________________________Period:______

Unit 8, Activity 9, Maps of Cinnabar and KelvarDetermine if each of the following graphs have an Euler path or circuit. List the vertices that form the Euler path or circuit.
1) 2)
3) 4)
5) 6)
a b c
d
efg
hj
a ba
b
a c
d
a
c
d
a
b
c
a b c d
efg
h

Unit 8, Activity 9, Euler Paths and Circuits with Answers
Name:_____________________________________________________Period:______
Determine if each of the following graphs have an Euler path or circuit. List the vertices that form an Euler path or circuit.
1) 2)
Euler path; a-a-b-b is Euler path; c-a-b-c-d is one possible one possible solution solution
3) 4)
Euler circuit; a-b-h-j-b-c-d-f-j-d-e-h-g-a Euler path; b-a-b-c-a is one possibleis one possible solution solution
5) 6)
Euler circuit; a-b-g-b-c-f-c-d-e-f-g-h-a Euler path; a-b-c-a-d-c is one is one is one possible solution possible solution
a ba
b
a c
d
a
c
ac
d
b
a b c
d
efg
hj
a b c d
efg
h

Unit 8, Activity 9, Shortest Paths and Minimal Distances
Name:_____________________________________________________Period:______
Shortest Paths and Minimal Distances
Mason works for FPS (Fast Postal Service) and he wants to find the route to with the minimal distance without revisiting a street (edge). Each vertex indicates a package drop-off and the numbers indicate how many blocks between destinations. He figures the route with the least amount of turns would give him the minimal distance. Is he correct? He enters each area from point A but it does not matter where he exits.
1) D 3 E 2)
B 4
Shortest Path:__________________________ Shortest Path:______________________
Minimal Distance Path:__________________ Minimal Distance Path: ______________
Minimal Distance:_____________________ Minimal Distance: __________________
3) 4)
Shortest Path:__________________________ Shortest Path:______________________
Minimal Distance Path:__________________ Minimal Distance Path: ______________
Minimal Distance:______________________ Minimal Distance___________________
Z
C
42
17
6
4
11
9
A
B
C
DE
F
G
H
K
3 21
23
31
1
51
3
4 6
7
3
3
3
3
2
2
22
22
8
4
1
15
41
1
1
1
1
4
10A
A
B C
D
EF
GA
B
C
D
E

Unit 2, Activity 10, You Can Bet on It! with Answers
Name:_____________________________________________________Period:______
Shortest Paths and Minimal Distances
Mason works for FPS (Fast Postal Service) and he wants to find the route with the minimal distance without revisiting a street (edge). Each vertex indicates a package drop-off and the numbers indicate how many blocks between destinations He figures the route with the least amount of turns would give him the minimal distance. Is he correct? He enters each area from point A but it does not matter where he exits.
1) D 3 E 2)
B 4
Shortest Path:_A-D-E-Z-C-B____ Shortest Path:__A-B-C-D-E-F-G-K-H
Minimal Distance Path:_A-D-E-A-C-B-Z Minimal Distance Path: A-K-G-F-E-D-G-H-B
Minimal Distance: 24 blocks_________ Minimal Distance: 22 blocks _______
3) 4)
Shortest Path:_A-B-C-D-E-F-G Shortest Path:_A-B-C-D-E-F_________
Minimal Distance Path:_A-F-E-G-D-C-B___ Minimal Distance Path: A-F-B-C-D-E _
Minimal Distance:__9 blocks ____________ Minimal Distance:_ 12 blocks_______
Z
C
42
17
6
4
11
9
A
B
C
DE
F
G
H
K
3 21
23
31
1
51
3
4 6
7
3
3
3
3
2
2
22
22
8
4
1
15
41
1
1
1
1
4
10A
A
B C
D
EF
GA
BC
D
E
F