Foreword >>> · 21/04/2015 · Foreword >>> Science, technology and innovation (STI) are key...
52
Transcript of Foreword >>> · 21/04/2015 · Foreword >>> Science, technology and innovation (STI) are key...

Foreword>>>
Science, technology and innovation (STI) are key drivers of sustainable economic growth and social development. STI indicators are important tools to measure the progress and competitiveness of Thailand in various aspects. As a secretariat of the National Committee on STI indicators, the National Sci-ence Technology and Innovation Policy Office has published “Thailand Science Technology and Innovation Profile” annually to raise public awareness on the progress of STI development.
This book comprises of eight chapters of STI indicators including com-petitiveness, STI budget, research and development (R&D), STI manpower, technology balance of payments, patents, science and technology publications, and information and communication technology.

CONTENTS
CHAPTER 1 Competitiveness in Science, Technology and Innovation
CHAPTER 2 Science, Technology and Innovation Budget
CHAPTER 3 Research and Development
CHAPTER 4 Science and Technology Personnel
CHAPTER 5 Technology Balance of Payments
CHAPTER 6 Patents
CHAPTER 7 Scientific and Technological Publications
CHAPTER 8 Information and Communication Technology
Chapter 1Competitiveness in Science, Technology and Innovation
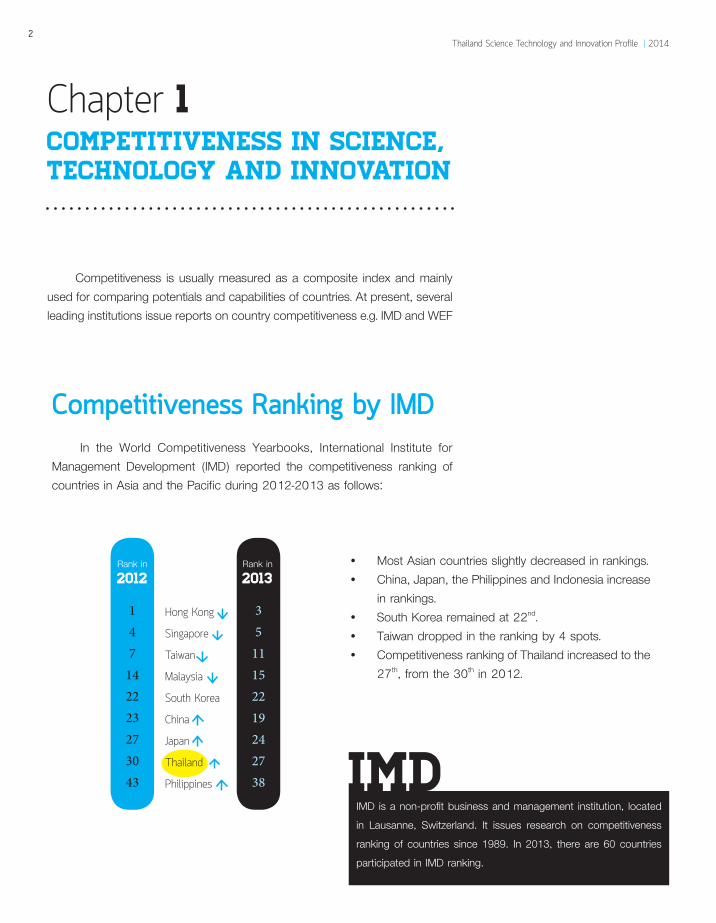
Competitiveness Ranking by IMDIn the World Competitiveness Yearbooks, International Institute for
Management Development (IMD) reported the competitiveness ranking of countries in Asia and the Pacific during 2012-2013 as follows:
IMD is a non-profit business and management institution, located in Lausanne, Switzerland. It issues research on competitiveness ranking of countries since 1989. In 2013, there are 60 countries participated in IMD ranking.
Hong Kong
Singapore
Taiwan
Malaysia
South Korea
China
Japan
Thailand
Philippines
Rank in 2012
Rank in 2013
147
142223273043
35
11152219242738
Competitiveness is usually measured as a composite index and mainly used for comparing potentials and capabilities of countries. At present, several leading institutions issue reports on country competitiveness e.g. IMD and WEF
• Most Asian countries slightly decreased in rankings.• China, Japan, the Philippines and Indonesia increase
in rankings.• South Korea remained at 22nd.• Taiwan dropped in the ranking by 4 spots.• Competitiveness ranking of Thailand increased to the
27th, from the 30th in 2012.
imd
2Thailand Science Technology and Innovation Profile | 2014
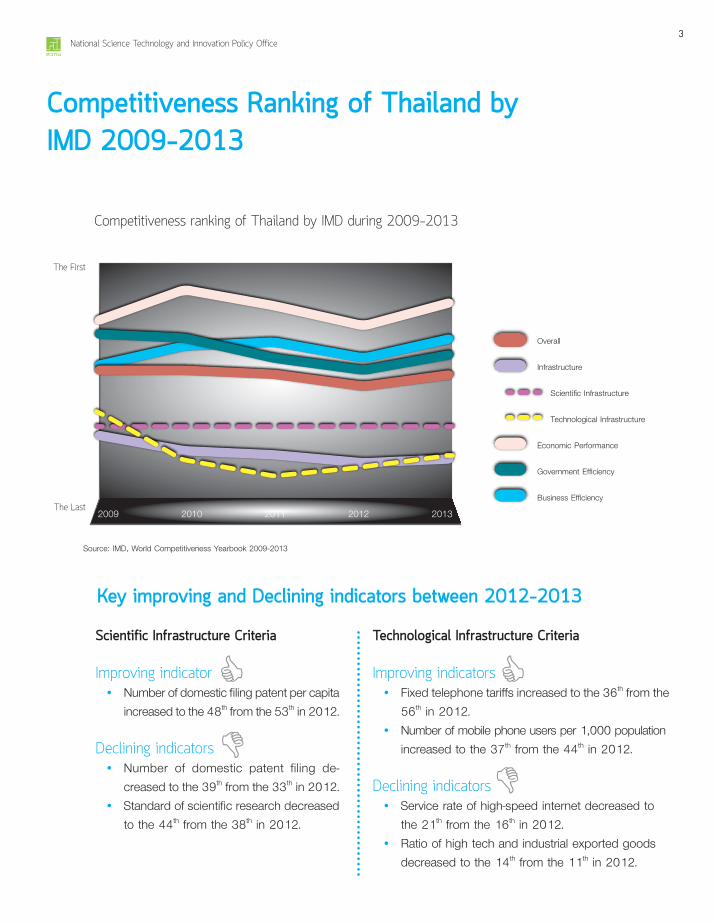
Competitiveness Ranking of Thailand by IMD 2009-2013
Economic Performance
Overall
2009 2010 2011 2012 2013
Government Efficiency
Business Efficiency
Infrastructure
Technological Infrastructure
Scientific Infrastructure
Source: IMD, World Competitiveness Yearbook 2009-2013
Competitiveness ranking of Thailand by IMD during 2009-2013
The First
The Last
Scientific Infrastructure Criteria
Improving indicator • Number of domestic filing patent per capita
increased to the 48th from the 53th in 2012.
Declining indicators • Number of domestic patent filing de-
creased to the 39th from the 33th in 2012. • Standard of scientific research decreased
to the 44th from the 38th in 2012.
Technological Infrastructure Criteria
Improving indicators • Fixed telephone tariffs increased to the 36th from the
56th in 2012. • Number of mobile phone users per 1,000 population
increased to the 37th from the 44th in 2012.
Declining indicators • Service rate of high-speed internet decreased to
the 21th from the 16th in 2012. • Ratio of high tech and industrial exported goods
decreased to the 14th from the 11th in 2012.
Key improving and Declining indicators between 2012-2013
3National Science Technology and Innovation Policy Office
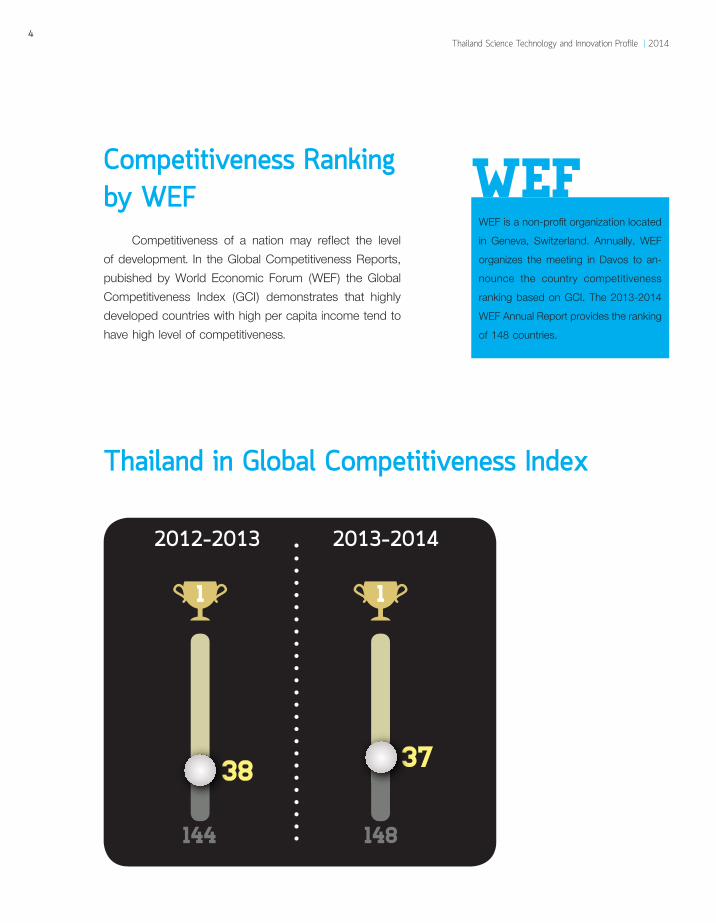
Competitiveness Ranking by WEF
Competitiveness of a nation may reflect the level of development. In the Global Competitiveness Reports, pubished by World Economic Forum (WEF) the Global Competitiveness Index (GCI) demonstrates that highly developed countries with high per capita income tend to have high level of competitiveness.
WEF is a non-profit organization located in Geneva, Switzerland. Annually, WEF organizes the meeting in Davos to an-nounce the country competitiveness ranking based on GCI. The 2013-2014 WEF Annual Report provides the ranking of 148 countries.
WEF
Thailand in Global Competitiveness Index
38
144 148
37
1 1
2012-2013 2013-2014
4Thailand Science Technology and Innovation Profile | 2014

RANKING
2012-2013 2013-2014
Basic Requirements sub-index: 45 49
Efficiency Enhancer sub-index: 47 40 Technological Readiness 84 78
Innovation and Sophistication Factors sub-index: 55 52 Innovation 68 66
The Innovation and Sophistication factors remained the weakness for Thailand although the overall ranking has risen 3 spots between 2012-2013 and 2013-2014.
For Thailand, certain factors are in low ranking among 148 countries.
• Share of internet user in the population
1st Icelandinternet user 96%
97th Thailandinternet user 26.5%
• Innovation performance
1st Switzerlandscore 8.54
81st Thailandscore 3.3681
1
GCI composes of 3 sub-indices, including Basic Requirements, Efficiency Enhancer and Innovation and Sophistication factors. These sub-indices are calculated using several factors. The key STI factors include Technological Readiness and Innovation.
5National Science Technology and Innovation Policy Office

The GII is calculated as the simple average of its Input and Output sub-indices:
1 Innovation Input sub-index captures 5 elements of the national economy that enable innovative activities including (1) institution, (2) human capital and research, (3) infrastructure, (4) market sophistication, and (5) busi-ness sophistication.
2 Innovation Output sub-index are the results of innovative activities within the economy comprising of (1) knowledge and technology outputs and (2) creative outputs. In addition, the Innovation Efficiency Ratio is calculated as the ratio of the Output over the Input sub-indices. The ratio demonstrates how much innovation inputs of a given country can generate its outputs.
2011 2012 2013
Global Innovation Index (GII) 48 57 57
Innovation Efficiency Ratio 56 61 76
Innovation Input sub-index 48 59 57
Innovation Output sub-index 46 56 61
Source: The Global Innovation Index 2011-2013
Innovativeness Ranking by Cornell University / INSEAD / WIPO
Cornell University, Institut Europeen d’ Administration des Affaires (INSEAD) and World Intellectual Property Organization (WIPO) have developed and published the Global Innovation Index (GII) since 2007. The 2013 report presents the ranking of 142 countries / economies. The following table shows the ranking of Thailand during 2011-2013.
6Thailand Science Technology and Innovation Profile | 2014
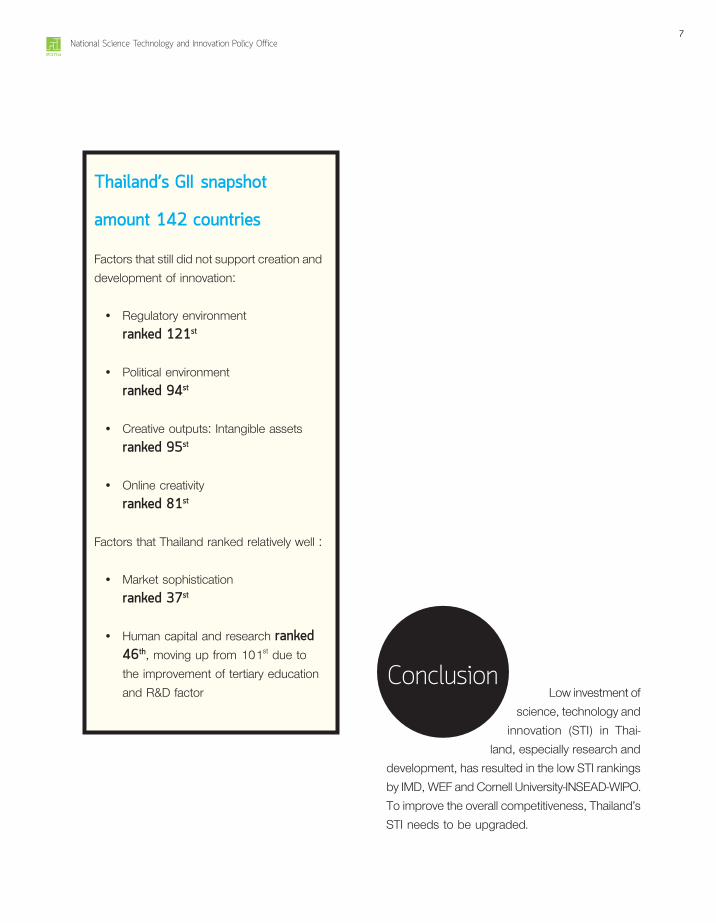
Low investment of science, technology and
innovation (STI) in Thai-land, especially research and
development, has resulted in the low STI rankings by IMD, WEF and Cornell University-INSEAD-WIPO. To improve the overall competitiveness, Thailand’s STI needs to be upgraded.
Conclusion
Thailand’s GII snapshot
amount 142 countries
Factors that still did not support creation and development of innovation:
• Regulatory environment ranked 121st
• Political environment ranked 94st
• Creative outputs: Intangible assets ranked 95st
• Online creativity ranked 81st
Factors that Thailand ranked relatively well : • Market sophistication
ranked 37st
• Human capital and research ranked 46th, moving up from 101st due to the improvement of tertiary education and R&D factor
7National Science Technology and Innovation Policy Office
Chapter 2Science, Technology and Innovation Budget
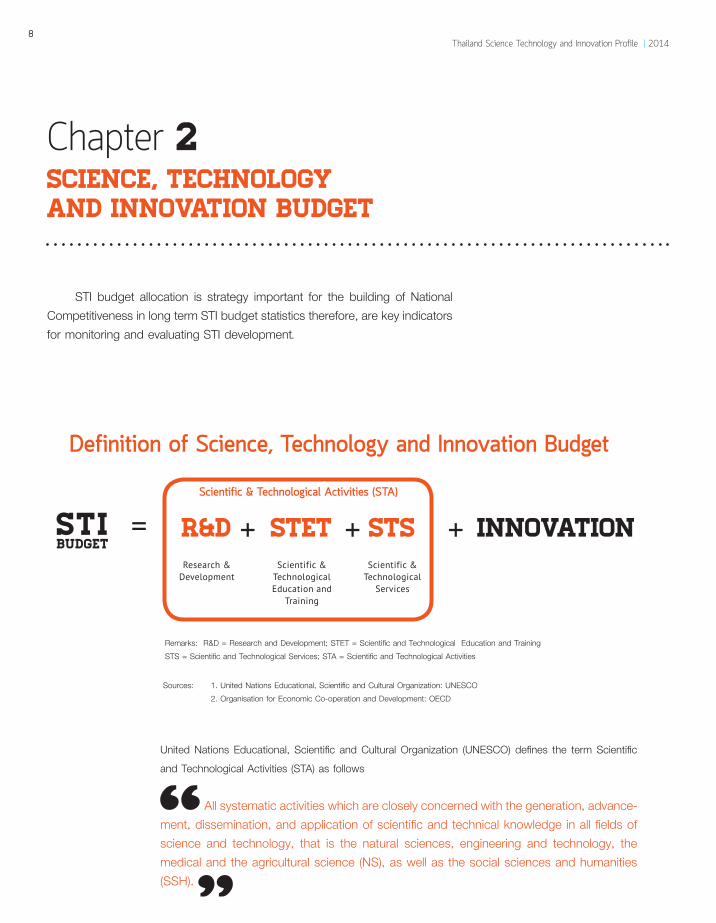
STI budget allocation is strategy important for the building of National Competitiveness in long term STI budget statistics therefore, are key indicators for monitoring and evaluating STI development.
Definition of Science, Technology and Innovation Budget
Sources: 1. United Nations Educational, Scientific and Cultural Organization: UNESCO 2. Organisation for Economic Co-operation and Development: OECD
Remarks: R&D = Research and Development; STET = Scientific and Technological Education and TrainingSTS = Scientific and Technological Services; STA = Scientific and Technological Activities
United Nations Educational, Scientific and Cultural Organization (UNESCO) defines the term Scientific and Technological Activities (STA) as follows
All systematic activities which are closely concerned with the generation, advance-ment, dissemination, and application of scientific and technical knowledge in all fields of science and technology, that is the natural sciences, engineering and technology, the medical and the agricultural science (NS), as well as the social sciences and humanities (SSH).
Research & Development
Scientific & Technological Education and
Training
Scientific & Technological Activities (STA)
Scientific & Technological
Services
InnovationR&D stet stsSTI Budget
8Thailand Science Technology and Innovation Profile | 2014
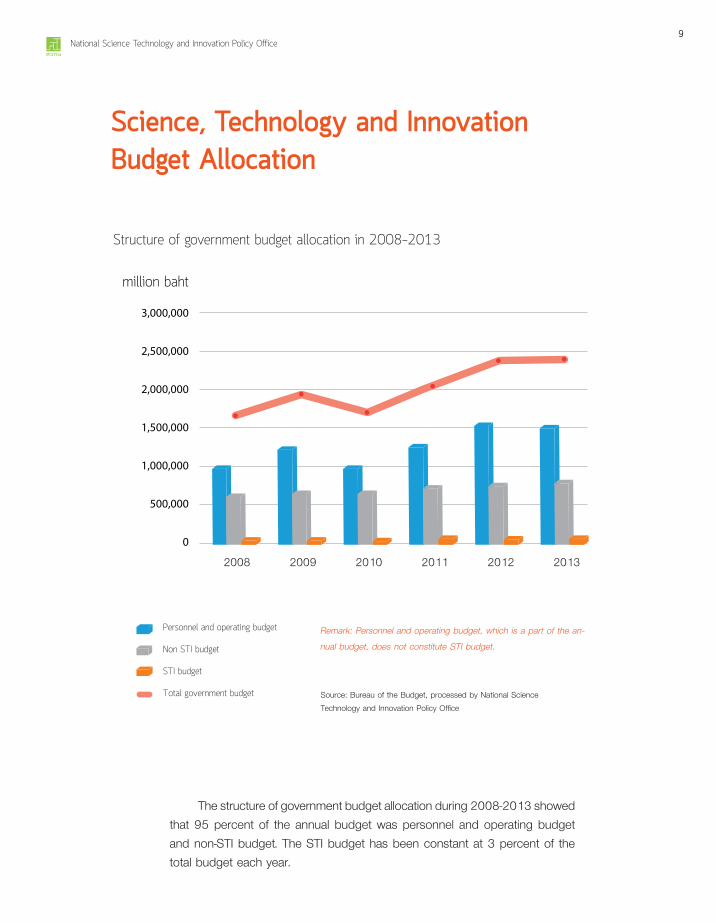
Structure of government budget allocation in 2008-2013
Science, Technology and Innovation Budget Allocation
2008 2009 2010 2011 2012 2013
500,000
1,000,000
1,500,000
2,000,000
2,500,000
3,000,000
0
million baht
Personnel and operating budget
STI budget
Total government budget
Non STI budget
Remark: Personnel and operating budget, which is a part of the an-
nual budget, does not constitute STI budget.
Source: Bureau of the Budget, processed by National Science Technology and Innovation Policy Office
The structure of government budget allocation during 2008-2013 showed that 95 percent of the annual budget was personnel and operating budget and non-STI budget. The STI budget has been constant at 3 percent of the total budget each year.
2008 2009 2010 2011 2012 2013
500,000
1,000,000
1,500,000
2,000,000
2,500,000
3,000,000
0
million baht
Personnel and operating budget
STI budget
Total government budget
Non STI budget
9National Science Technology and Innovation Policy Office

STI Budget Classified by Types of STI Activities in 2013
Based on UNESCO and OECD definitions, The highest share of STI budget is scientific and technological education and training (53 percent). The share of research and development bud-get and scientific and technological ser-vices (STS) budget are quite comparable around 23 and 22 percents respectively, while the share of innovation budget is rather small (2 percent).
Percentage of STI budget classified by types of activities (defined by UNESCO and OECD) in 2013
Scientific and Technological Education and Training (STET)
Research and Development (R&D)
R&D
EDUCATION& TRAINING
53%
23%
10Thailand Science Technology and Innovation Profile | 2014

This chapter shows that Thailand’s STI budget has been stagnated at 3% of total government budget. In order to trans-form Thailand towards knowledge-based economy, Thailand has to make stronger commitment by allocating more budget on important STI activities such as strengten-ing R&D commercialization program.
Conclusion
Source: Bureau of the Budget, processed by National Science, Technology and Innovation Policy office
Innovation
Scientific and Technological Services (STS)
INNOVAT I ON
SERVICES&T
22%
2%
11National Science Technology and Innovation Policy Office

Chapter 3Research and Development
International competition among countries have been inten-sified these days. For a country to be more resilient and able to adapt to impacts from globaliza-tion, it is crucial to transition into a knowledge-based economy and society. To achieve that target, STI has become the main drivers and R&D investment has to increase.
World R&D Investment Trends.Countries that have shown significant economic growth such as
China and South Korea have consistantly increased their investment in R&D. Thailand’s R&D expenditure as percentage of GDP had remained constant during 2002-2012, at around 0.20-0.25 percent . However, R&D expenditure in Thailand increased significantly to 0.37 percent of GDP in 2011.
Source: 1. International Institute for Management Development (IMD). World Competitiveness Yearbook 2013. 2. National Science Foundation. Science and Engineering Indicators 2012.
Gross domestic expenditure on R&D (GERD) to GDP (2002-2011)
GERD/GDP (%)
0.0
1.0
2.0
3.0
4.0
2002
2003
2004
2005
2006
2007
2008
2009
2010
2011
USA UK Japan EU
China South Korea Thailand
R&D IndexWidely used Ind icators for measuring the level of R&D resource allocation in countries include the followings. 1. Gross domestic expendi-ture on R&D (GERD) 2. The Ratio of GERD to GDP
12Thailand Science Technology and Innovation Profile | 2014
USA
Chin
a
Japa
n
Germ
any
Sout
h Ko
rea
Fran
ce UK
Russ
ia
Braz
il
Indi
a
401.
6
154.
3
137.
5
86.3
52.3 50
39.2
32.8
25.3
24.3
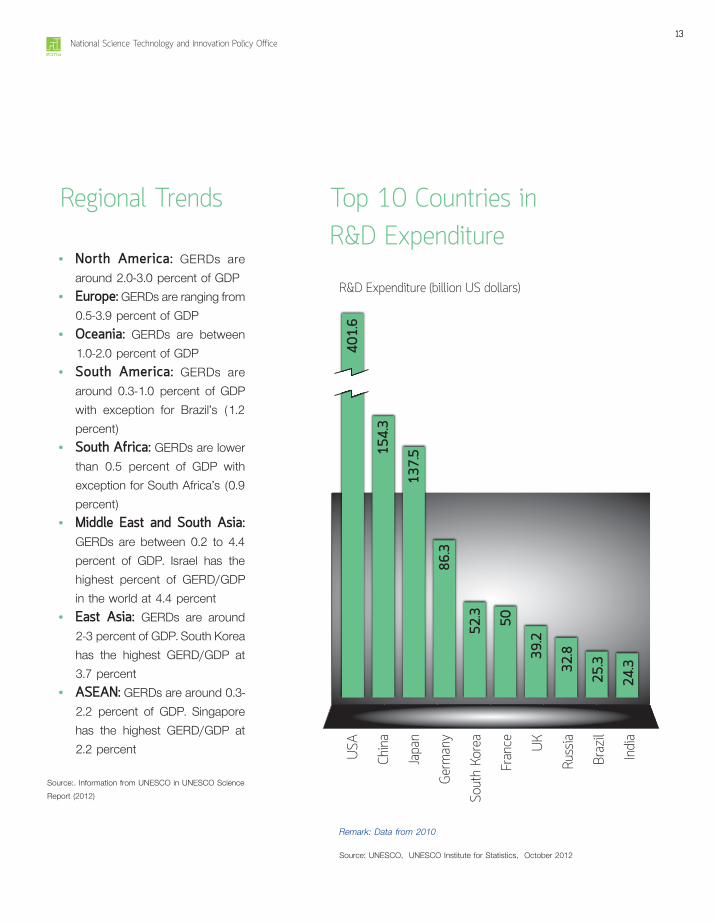
Top 10 Countries in R&D Expenditure
GERD/GDP (%)
0.0
1.0
2.0
3.0
4.0
2002
2003
2004
2005
2006
2007
2008
2009
2010
2011
USA UK Japan EU
China South Korea Thailand
• North America: GERDs are around 2.0-3.0 percent of GDP
• Europe: GERDs are ranging from 0.5-3.9 percent of GDP
• Oceania: GERDs are between 1.0-2.0 percent of GDP
• South America: GERDs are around 0.3-1.0 percent of GDP with exception for Brazil’s (1.2 percent)
• South Africa: GERDs are lower than 0.5 percent of GDP with exception for South Africa’s (0.9 percent)
• Middle East and South Asia: GERDs are between 0.2 to 4.4 percent of GDP. Israel has the highest percent of GERD/GDP in the world at 4.4 percent
• East Asia: GERDs are around 2-3 percent of GDP. South Korea has the highest GERD/GDP at 3.7 percent
• ASEAN: GERDs are around 0.3-2.2 percent of GDP. Singapore has the highest GERD/GDP at 2.2 percent
Source:. Information from UNESCO in UNESCO Science Report (2012)
R&D Expenditure (billion US dollars)
Remark: Data from 2010
Source: UNESCO, UNESCO Institute for Statistics, October 2012
Regional Trends
13National Science Technology and Innovation Policy Office

R&D in Asia and the Pacific
4357
38
0
0.5
1
1.5
2
2.5
3
3.5
(%)(%)
4
0
20
40
60
80
100
South Korea* Japan* ChinaSingapore Malaysia Thailand
R&D Expenditure of Private Sector R&D Expenditure of Other Sectors
GERD/GDP
0.37
1.84
1.07
2.23
3.25
3.74
49
24
23
25
51
767775
62
Shar
e of
Bus
ines
s ex
pend
iture
on
R&D
and
othe
rs s
ecto
rs
GERD/GDP
Remark: *Data from 2010
Source: International Institute for Management Development (IMD), World Competitiveness Yearbook 2013
GERD/GDP and share of business expenditure on R&D in 2011 (BERD)
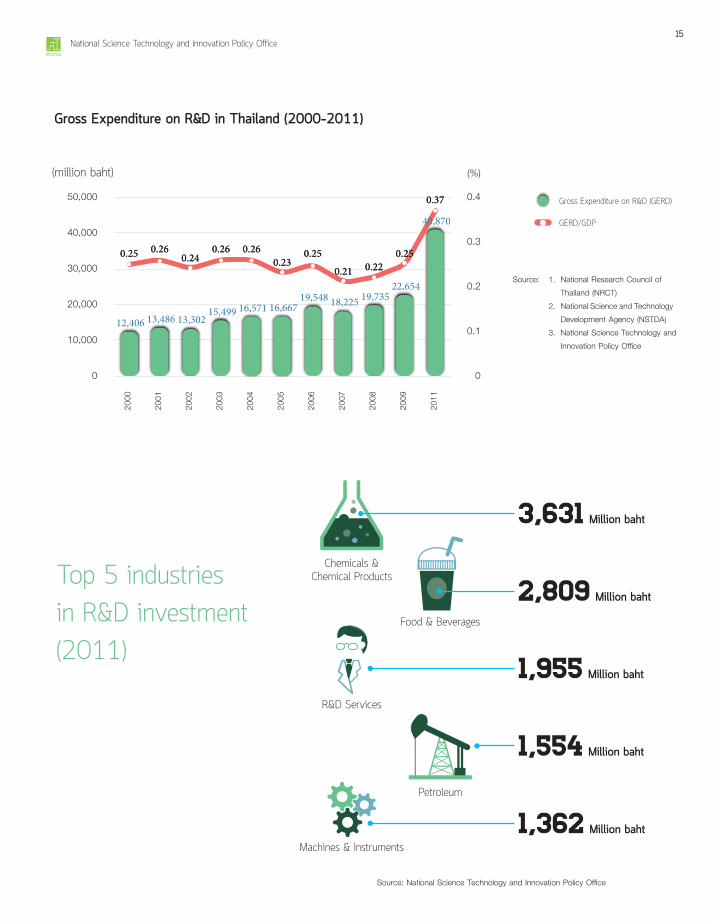
R&D Expenditure in ThailandDuring 2000-2011, R&D expenditure in Thailand increased on average
22.9 percent per year (from 12,406 million baht in 2000 to 40,870 million baht in 2011). However, during 2000-2009, business expenditure on R&D (BERD) accounted for less than 50 percent of Gross R&D investment. However, in 2011, share of BERD increased to 51 percent of gross R&D expenditure indicating that private sector has a greater awareness on the importance of R&D investment to sustain competitiveness.
14Thailand Science Technology and Innovation Profile | 2014
0
0.1
0.2
0.3
0.4
0
10,000
20,000
30,000
40,000
50,000
2000
2001
2002
2003
2004
2005
2006
2007
2008
2009
2011
Gross Expenditure on R&D (GERD)0.37
0.250.220.21
0.250.23
0.260.260.24
0.260.25
40,870
22,65419,73518,22519,548
16,66716,57115,49913,30213,48612,406
0.25 0.260.24
0.26 0.260.23
0.25
0.21 0.220.25
0.37
GERD/GDP
(%)(million baht)
Gross Expenditure on R&D in Thailand (2000-2011)
Top 5 industries in R&D investment (2011)
Source: 1. National Research Council of Thailand (NRCT) 2. National Science and Technology Development Agency (NSTDA) 3. National Science Technology and Innovation Policy Office
Source: National Science Technology and Innovation Policy Office
1,362 Million bahtMachines & Instruments
Chemicals & Chemical Products
2,809 Million baht
3,631 Million baht
Food & Beverages
Petroleum
1,554 Million baht
1,955 Million baht
R&D Services
15National Science Technology and Innovation Policy Office
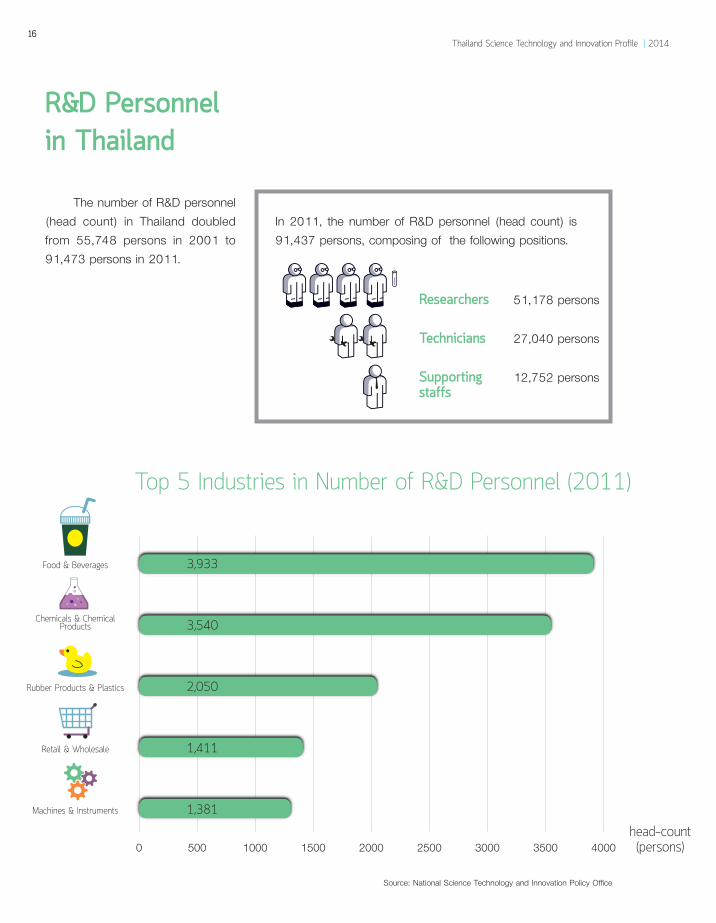
R&D Personnel in Thailand
The number of R&D personnel (head count) in Thailand doubled from 55,748 persons in 2001 to 91,473 persons in 2011.
Top 5 Industries in Number of R&D Personnel (2011)
0 500 1000 1500 2000 2500 3000 3500 4000 (persons)head-count
Source: National Science Technology and Innovation Policy Office
Food & Beverages 3,933
Chemicals & Chemical Products 3,540
Rubber Products & Plastics 2,050
Retail & Wholesale 1,411
Machines & Instruments 1,381
In 2011, the number of R&D personnel (head count) is 91,437 persons, composing of the following positions.
Researchers 51,178 persons
Technicians 27,040 persons
Supporting 12,752 personsstaffs
16Thailand Science Technology and Innovation Profile | 2014

From 2000 to 2011, Thailand still has low lewel of R&D expen-diture to GDP, despite a significant increase in investment between 2009 to 2011 by 48 percent. R&D worldwide has risen exponen-tially during 1996-2007 as a result of the global economic growth.
In Asian region, countries actively expand R&D activities are South Korea, Japan, Taiwan, and China. The majority of R&D expendi-
ture (more than 70 percent) in these countries comes from private sector. In 2011, it was the first time in Thailand that the share of business expenditure on R&D was greater than the share of R&D expenditure from government sector and other sectors.
The number of R&D personnel in Thailand (full time equivalent: FTE) was only 8 persons per 10,000 population (data in 2011). When compared with Taiwan, Japan, and South Korea, the ratio of R&D personnel per population in Thailand was 7 to 11 times lower. In addition, in countries with high number of R&D personnel, most of R&D personnel are in private sector. For example, in Taiwan, Japan, South Korea and Singapore, 60-75 percent of R&D personnel work for private sector. On the contrary, in Thailand most R&D personnel work for government and other sectors.
In 2011, the total number of researchers (head count) is 51,178 persons, but only less than 30 percent of researcher reside in private sector
Private sector: 14,256 personsPublic sector including other sectors: 36,922 persons
Conclusion
Researcher by sector
17National Science Technology and Innovation Policy Office
Chapter 4Science and Technology Personnel
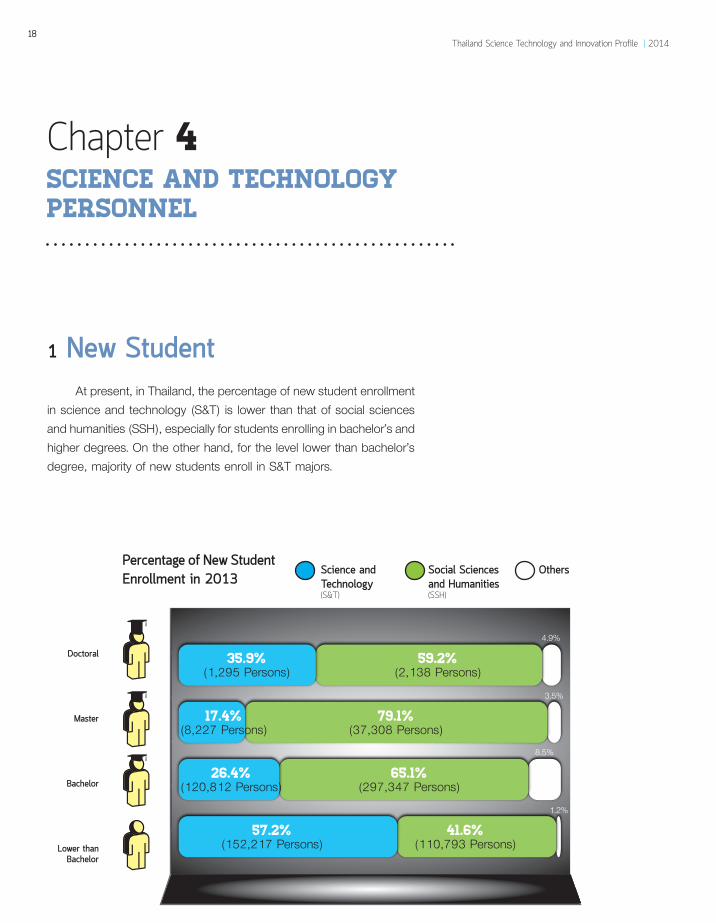
1 New Student At present, in Thailand, the percentage of new student enrollment
in science and technology (S&T) is lower than that of social sciences and humanities (SSH), especially for students enrolling in bachelor’s and higher degrees. On the other hand, for the level lower than bachelor’s degree, majority of new students enroll in S&T majors.
17.4%(8,227 Persons)
35.9%(1,295 Persons)
79.1%(37,308 Persons)
59.2%(2,138 Persons)
26.4%(120,812 Persons)
65.1%(297,347 Persons)
57.2%(152,217 Persons)
41.6%(110,793 Persons)
8.5%
1.2%
3.5%
4.9%
Percentage of New Student Enrollment in 2013
Science and Technology(S&T)
Lower than Bachelor
Bachelor
Master
Doctoral
Social Sciences and Humanities(SSH)
Others
18Thailand Science Technology and Innovation Profile | 2014
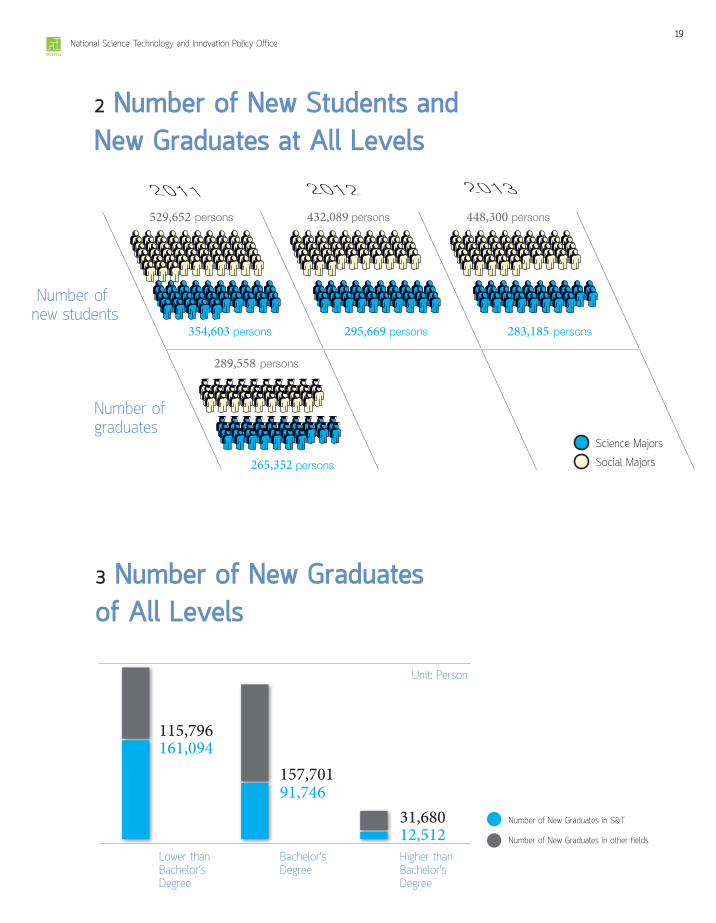
529,652
289,558
432,089 448,300
354,603
265,352
295,669 283,185
persons
persons
persons
persons
persons
persons
persons
persons
2 Number of New Students and New Graduates at All Levels
Science Majors
Social Majors
Number of new students
Number of graduates
3 Number of New Graduates of All Levels
Number of New Graduates in S&T
Number of New Graduates in other fields
Lower than Bachelor’s Degree
Bachelor’s Degree
Higher than Bachelor’s Degree
Unit: Person
161,094115,796
91,746157,701
12,51231,680
19National Science Technology and Innovation Policy Office
0
0.8
1.6
2.4
3.2
(million)persons
2010
2011
2012
S&T labor force in S&T fields
Total employed S&T labor forces
Total employed S&T labor force in S&T fields
S&T Graduates working in non-S&T fields
Unemployed S&T Graduates
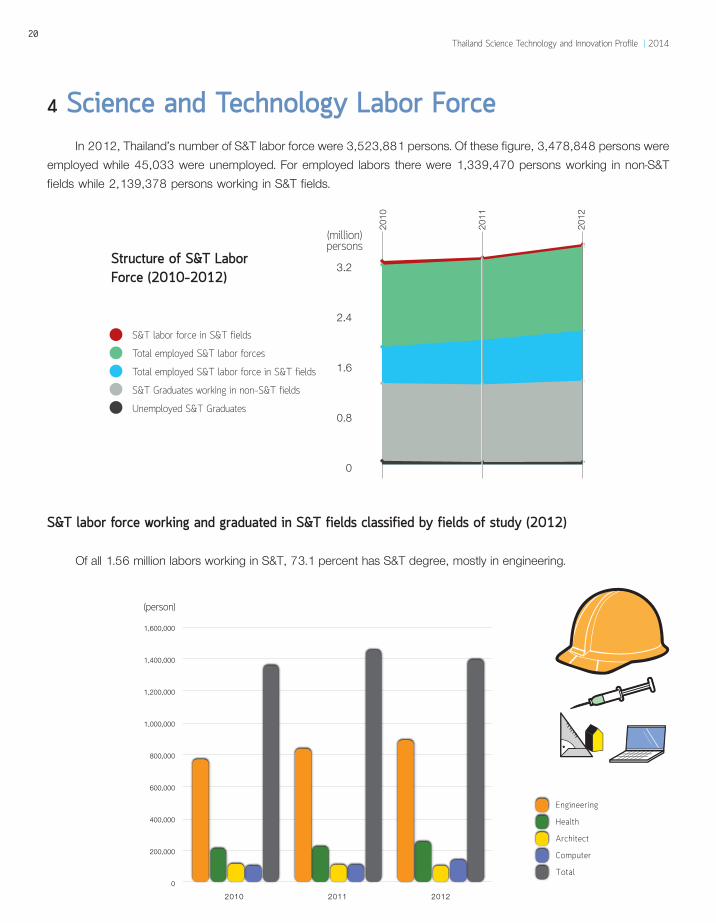
4 Science and Technology Labor Force In 2012, Thailand’s number of S&T labor force were 3,523,881 persons. Of these figure, 3,478,848 persons were
employed while 45,033 were unemployed. For employed labors there were 1,339,470 persons working in non-S&T fields while 2,139,378 persons working in S&T fields.
Of all 1.56 million labors working in S&T, 73.1 percent has S&T degree, mostly in engineering.
Structure of S&T Labor Force (2010-2012)
S&T labor force working and graduated in S&T fields classified by fields of study (2012)
0
200,000
400,000
600,000
800,000
1,000,000
1,200,000
1,400,000
1,600,000
(person)
2010 2011 2012
Engineering
Health
Architect
Computer
Total
0
0.8
1.6
2.4
3.2
(million)persons
2010
2011
2012
S&T labor force in S&T fields
Total employed S&T labor forces
Total employed S&T labor force in S&T fields
S&T Graduates working in non-S&T fields
Unemployed S&T Graduates
20Thailand Science Technology and Innovation Profile | 2014

S&T labor force classified by age in 2012
In 2012, the S&T labor force with age between of 20-29 years old was the largest group, accounting for 36.9 percent or 1,300,358 persons.The number of S&T labor force with age between 30-39 and 40-49 were the second and third respectively.
S&T labor force classified by level of education in 2012
60.8%
39.2%
Bachelor’s or higher1,573,568 persons
55.3%44.7%
Lower than bachelor’s 1,950,313 persons
Lower than bachelor’s 27,401 persons
Bachelor’s or higher17,632 persons
15-19 20-29 30-39 40-49 50-59 60+
0
10%
20%
30%
40%
1.1%
8.6%
18.5
%
34.2
%36.9
%
0.7%
1.1%
7.6%
18.3
%
34.6
%37.6
%
0.9%
1.0%
6.8%
18.0
%
33.1
%
39.9
%
1.2%
2010
2011
2012
J BS
Unemployed S&T Graduates45,033 persons
S&T Labor Force in S&T Unemployed S&T Labor Force
21National Science Technology and Innovation Policy Office
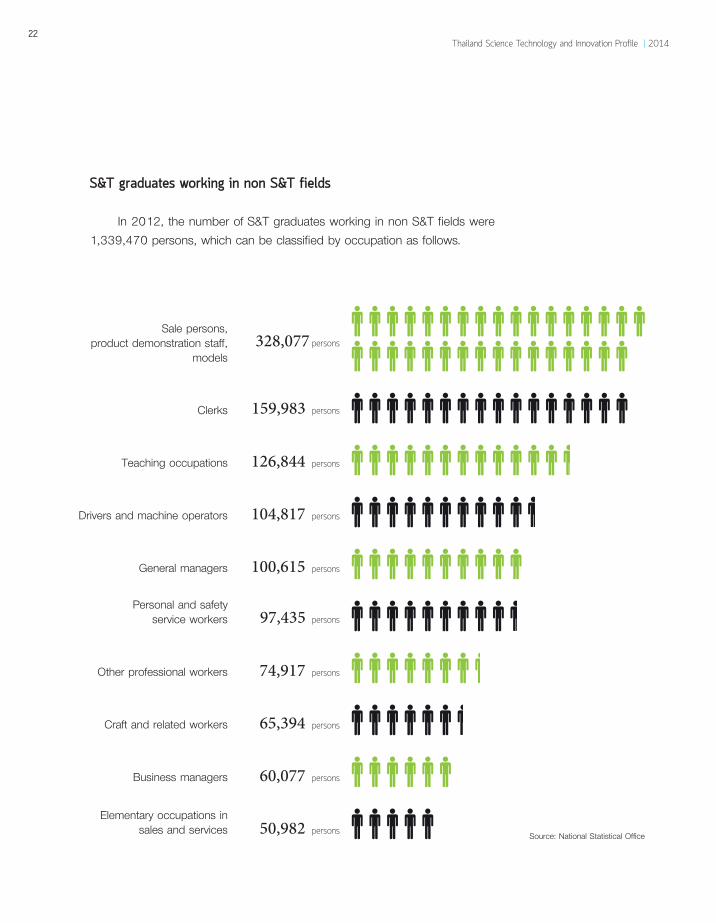
S&T graduates working in non S&T fields
In 2012, the number of S&T graduates working in non S&T fields were 1,339,470 persons, which can be classified by occupation as follows.
Sale persons, product demonstration staff,
models
Clerks
Teaching occupations
Drivers and machine operators
General managers
Personal and safety service workers
Other professional workers
Craft and related workers
Business managers
Elementary occupations in sales and services Source: National Statistical Office
328,077 persons
159,983 persons
126,844 persons
104,817 persons
100,615 persons
97,435 persons
74,917 persons
65,394 persons
60,077 persons
50,982 persons
22Thailand Science Technology and Innovation Profile | 2014
In 2013, new students enrolling in S&T were 283,185 persons (36.42 percent of the total new students enrollment in Thailand). For S&T new student enrollment, 53.75
percent were in lower than bachelor’s degree, 42.66 percent were in bachelor’s degree, and
3.59 percent were in higher than bachelor’s degree. In 2011, S&T graduates were 265,352 persons,accounting
for 46.51 percent of the total graduates in Thailand. Of these S&T graduates, 60.71 percent were in lower than bachelor’s degree, 34.57 percent were in bachelor’s degree, and 4.72 percent were in higher than bachelor’s degree.
In 2011, S&T graduates working in non S&T fields were 1,339,470 persons. Of these graduates, most of them work as salepersons, product demonstration workers, and models (24.49 percent).
Conclusion
23National Science Technology and Innovation Policy Office

Chapter 5Technology Balance of payments
Technology Balance of Payments (TBP) indicates whether a country is net technology recipient or supplier. TBP also shows the technological capability of a country, which is critical to a national competitiveness
Technology Balance of Payments TBP consists of money paid or received for the use of patents, license,
know-how, trademarks, patterns, designs, and technical services (including technical assistance) and for industrial R&D carried out abroad.
1. Spending on technological fees suggests a dependency on or demand of imported technology
2. Revenue from technological fee reflects the ability of a country to develop internationally competitive technology, which will generate income from exporting technology
What is technology transaction? The Bank of Thailand collects foreign exchange reported by domestic
commercial banks and classifies technology transactions into 2 types.
1 Royalty and License Fees refer to the fees for the permission to use of intangible properties including the original items such as trademark, copyright, technique and design, right of production and reproduction of the original copies of books or films.
2 Consulting and Technical Service Fees refer to the com-pensation of consulting experts and firm’s committee, technical service and technical assistance such as setting up machines and electrical system in the plants, service and management fee, and technical operation fee.
24Thailand Science Technology and Innovation Profile | 2014

Thailand’s Deficit in Technology Balance of Payments In 2012, Thailand’s total expenditure on technology was 264,156 million baht while total revenue was merely
86,571 million baht, resulting in the deficit of TBP 177,585 million baht. The TBP deficit tends to increase continu-ously from the previous years.
-180,000
-135,000
-90,000
-45,000
0
-300,000
-225,000
-150,000
-75,000
0
75,000
150,000
2006
2007
2008
2009
2010
2011
2012
Total Reciepts Total Payments Balance of Payment
-177,585
-161,778-159,188
-135,570
-148,095
-132,682
-109,761 -264,156-236,380-221,479
-198,539-208,898-178,494
-150,255
86,57174,602
62,29162,96960,80345,81240,494
-109,761
-132,682
-148,095
-135,570
-159,188 -161,778
-177,585
Reve
nue
from
and
Pay
men
t in
Tech
nolo
gy
(milli
on b
aht)
Technology Balance of Payment
(million baht)
Source: Bank of Thailand (computed by STI)
Revenue and Expenditure Growth of Technology in Thailand (2006-2012)
Top 3 countries that Thailand has the most deficit in TBP.
0
20,000
40,000
60,000
80,000
100,000
99,399
14,9677,786
1 Japan 99,399 million baht
2 USA 14,967 million baht
3 UK 7,786 million baht
25National Science Technology and Innovation Policy Office

Growth Rate of Revenue and Payment in Technology of Thailand during 2006-2012
-10
0
10
20
30
40
17.5
18.8
17.0
-5.0
11.6
6.7
11.8
35.6
13.1
32.7
3.6
-1.1
19.816.0
Total Reciepts Total Payments
2006
2007
2008
2009
2010
2011
2012
Source: Bank of Thailand (computed by STI)
Top 5 industries in Thailand that have the most deficit in TBP.
48,602 Million baht
22,156 Million baht
21,653 Million baht
13,683 Million baht
12,259 Million baht
Automotive and parts
Electronics
Architecture and engineering
Retail and wholesale
Oil and gas
Percent (%)
26Thailand Science Technology and Innovation Profile | 2014
Thailand has experienced the deficit of TBP continuously. However, the growth rate of revenue is higher than that of payment. This dynamic can be seen in other developing countries in which their
economy is quickly developed, such as China, Brazil, and Indonesia.
Thailand should consider developing its domestic capability through ef-ficient technology transfer from foreign contraction. In addition, Thailand has to make substantive efforts for raising the quality of S&T education and training at all levels.
Conclusion
27National Science Technology and Innovation Policy Office
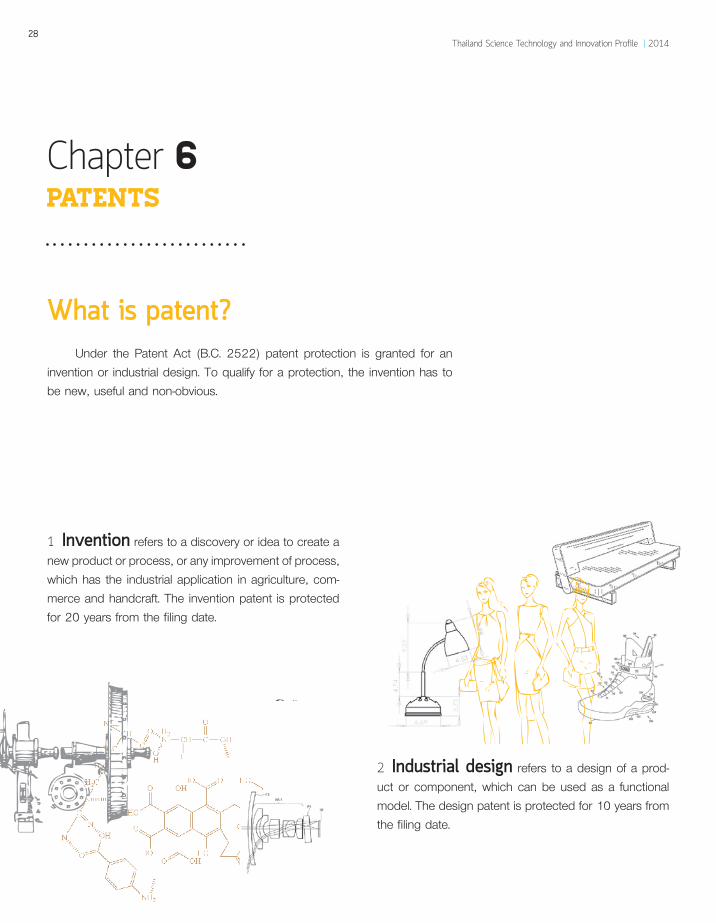
Chapter 6Patents
What is patent?Under the Patent Act (B.C. 2522) patent protection is granted for an
invention or industrial design. To qualify for a protection, the invention has to be new, useful and non-obvious.
1 Invention refers to a discovery or idea to create a new product or process, or any improvement of process, which has the industrial application in agriculture, com-merce and handcraft. The invention patent is protected for 20 years from the filing date.
2 Industrial design refers to a design of a prod-uct or component, which can be used as a functional model. The design patent is protected for 10 years from the filing date.
28Thailand Science Technology and Innovation Profile | 2014

Number of Patent Applications Filed10,227
Number of Patent Granted 3,115
Foreign Foreign
The number of patent applications by Thai was 3,360
65.96% 32.36%34.04%
67.64%Number of inventions 6,746
Number of inventions 1,008
Number of design patents
3,481
Number of design patents
2,107
The number of design patent applications by Thai was 2,292
The number of design patents granted to Thai
was 1,173
Japan filed the largest number of patent applications in Thailand
(3,028 patents).
Japan was granted the largest number of patents in Thailand, compared with other foreign countries.
(969 patents).
The number of inven-tion patents received by Thai was 1,068
The number of patents granted to Thai was 39
International Patent Classification
The World Intellectual Property Organization (WIPO) classified invention patents, using the International Patent Classification (IPC), into 8 classes.
1 Human Necessities such as agriculture, forestry, hunting, tobacco, and clothing.
2 Performing; Operations; Transporting such as physical or chemical processes, cleaning, cut-ting, printing, and vehicle decoration.
Patent Statistics in Thailand in 2012
29National Science Technology and Innovation Policy Office

3 Chemistry; Metallurgy such as organic and inor-ganic chemistry, water treatment, glass, cements, biochem-istry, petroleum, vegetable and animal oil, sugar
4 Textiles; Paper such as spinning, weaving, braiding, sewing, paper production
5 Fixed Construction such as construction of roads, railways, or bridges, hydraulic engineering, foundations, plumbing installation, sewerage, cesspool
6 Mechanical Engineering; Lighting; Heating, Weapons; Blasting such as machines or engines in general, gears, and storing gases or liquids
7 Physics such as measuring, testing, optical signaling, musical instruments, and information storage
8 Electricity such as generation, conversion, distribution, and electronic circuitry
In 2012, the total number of patents granted to Thais include
No. 1 Performing; Operations; Transporting
No. 2 Human Necessities
No. 3 Fixed Construction and Physics
In 2012, the total number of patent applications filed by Thais was 1,068.
No. 1 Human Necessities
No. 2 Chemistry and Metallurgy
No. 3 Performing; Operations; Transporting
27.71%
19.94%
15.26%
(9 patents)
(8 patents)
(6 patents)
30Thailand Science Technology and Innovation Profile | 2014
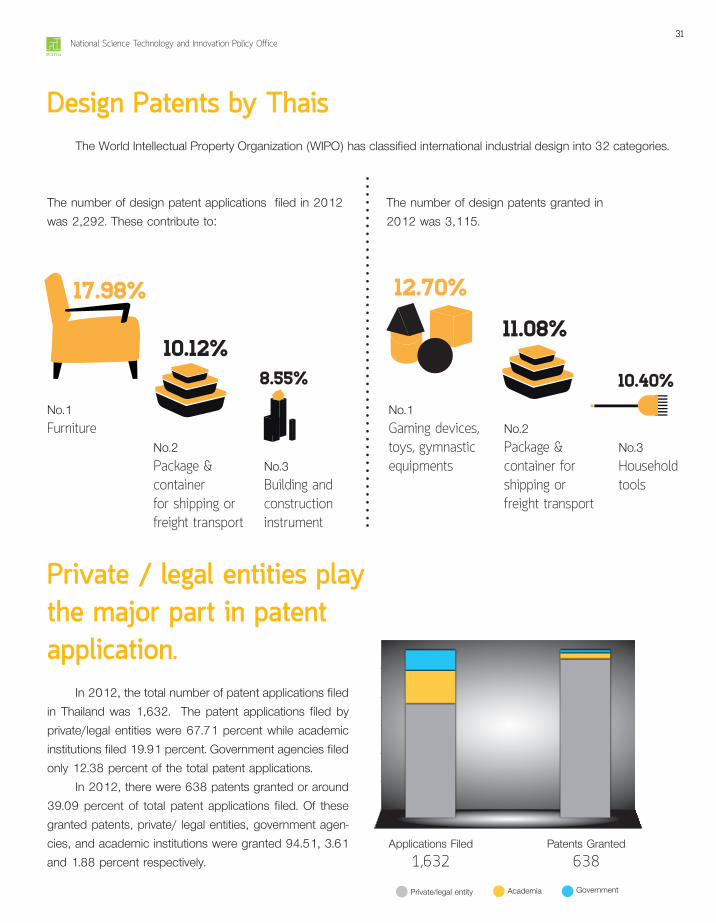
Design Patents by ThaisThe World Intellectual Property Organization (WIPO) has classified international industrial design into 32 categories.
The number of design patents granted in 2012 was 3,115.
17.98%
10.12%8.55%
12.70%
11.08%
10.40%No.1Furniture
No.2 Package & container for shipping or freight transport
No.3Building and construction instrument
No.2 Package & container for shipping or freight transport
No.1 Gaming devices, toys, gymnastic equipments
No.3 Household tools
The number of design patent applications filed in 2012 was 2,292. These contribute to:
Private / legal entities play the major part in patent application.
In 2012, the total number of patent applications filed in Thailand was 1,632. The patent applications filed by private/legal entities were 67.71 percent while academic institutions filed 19.91 percent. Government agencies filed only 12.38 percent of the total patent applications.
In 2012, there were 638 patents granted or around 39.09 percent of total patent applications filed. Of these granted patents, private/ legal entities, government agen-cies, and academic institutions were granted 94.51, 3.61 and 1.88 percent respectively.
Applications Filed1,632
Patents Granted638
Private/legal entity Government Academia
31National Science Technology and Innovation Policy Office
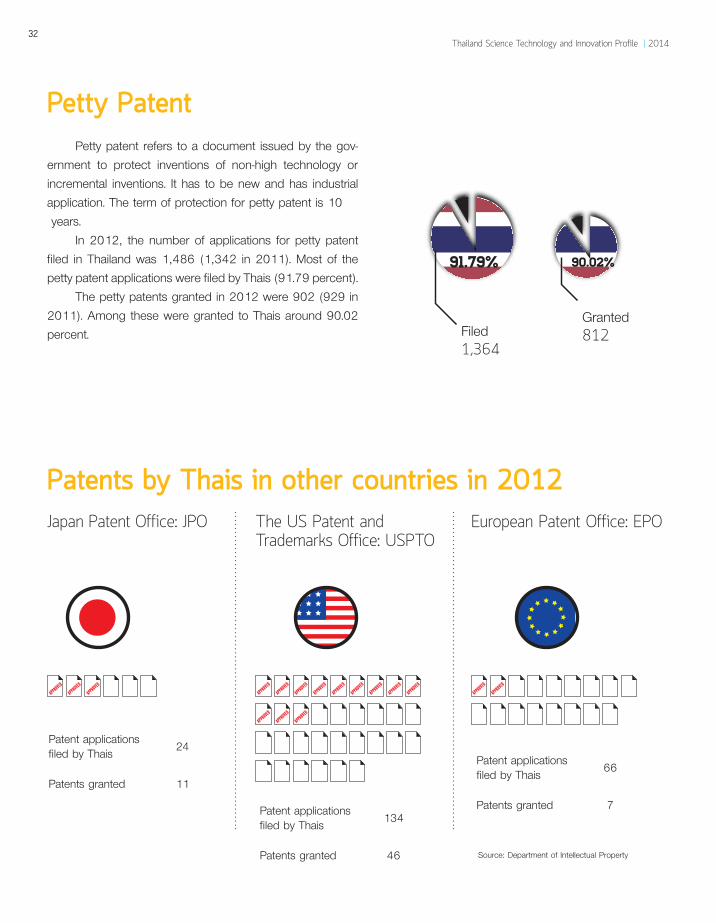
Petty PatentPetty patent refers to a document issued by the gov-
ernment to protect inventions of non-high technology or incremental inventions. It has to be new and has industrial application. The term of protection for petty patent is 10 years.
In 2012, the number of applications for petty patent filed in Thailand was 1,486 (1,342 in 2011). Most of the petty patent applications were filed by Thais (91.79 percent).
The petty patents granted in 2012 were 902 (929 in 2011). Among these were granted to Thais around 90.02 percent.
Japan Patent Office: JPO
Filed1,364
Granted812
91.79% 90.02%
The US Patent and Trademarks Office: USPTO
European Patent Office: EPO
Patents by Thais in other countries in 2012
Source: Department of Intellectual Property
Patent applications filed by Thais 24
Patents granted 11
Patent applications filed by Thais 134
Patents granted 46
Patent applications filed by Thais 66
Patents granted 7
32Thailand Science Technology and Innovation Profile | 2014

In Thailand, the number of patent applications being filed and granted is quite small. Most of the pat-ent applications are filed by foreigners. The number of patents by Thais is granted less than 10 percent
of all patents granted each year.The government should raise awareness of Thai
people about the significance in obtaining patents and pass necessary laws. The government should also reform the patent registration system since it faces a considerable delay in the examination of patent application. Moreover, the IP regime of publicly funded research has to be clear as to the ownership, mamagement and protection system.
Conclusion
33National Science Technology and Innovation Policy Office

Chapter 7Scientific and Technological Publications
Scientific and technological publication is an output from study, exploration, research and develop-ment, which is a source of knowledge that can be referenced and extended.
In addition, scientific and tech-nological publication is an indicator of R&D competency and collaborations among domestic and international institutions.
Publications in TCI databaseThe number of domestic academic journals in science and technology,
which is collected in the Thai Citation Index (TCI) database, is 251 in 2012.In Thailand, data during 2008-2012 has shown that the number of
publications in domestic academic journals increased by 9 percent each year.
TCIThai Journal Citation Index, (TCI) operated by Thailand Research Fund (TRF) in cooperation with King Mongkut’s University of Technology Thonburi (KMUTT), collects informa-tion on scientific and technological publications in domestic academic journals
Source: Thailand Research Fund (TRF)
2004 2008 2012
0.550.65
0.77
Frequency of citation per scientific and technological article in 2004, 2008 and 2012
The number of citations per article in scientific and technological journals has continued to increase.
(times/article)
34Thailand Science Technology and Innovation Profile | 2014
0%
6%
12%
18%
24%
0
1,500
3,000
4,500
6,000
2005
2006
2007
2008
2009
2010
2011
2012
Number of Articles Annual Growth Rate (percent)
9%
4%
9%
10%
17%19%
23%
56945245506546534217359730322464
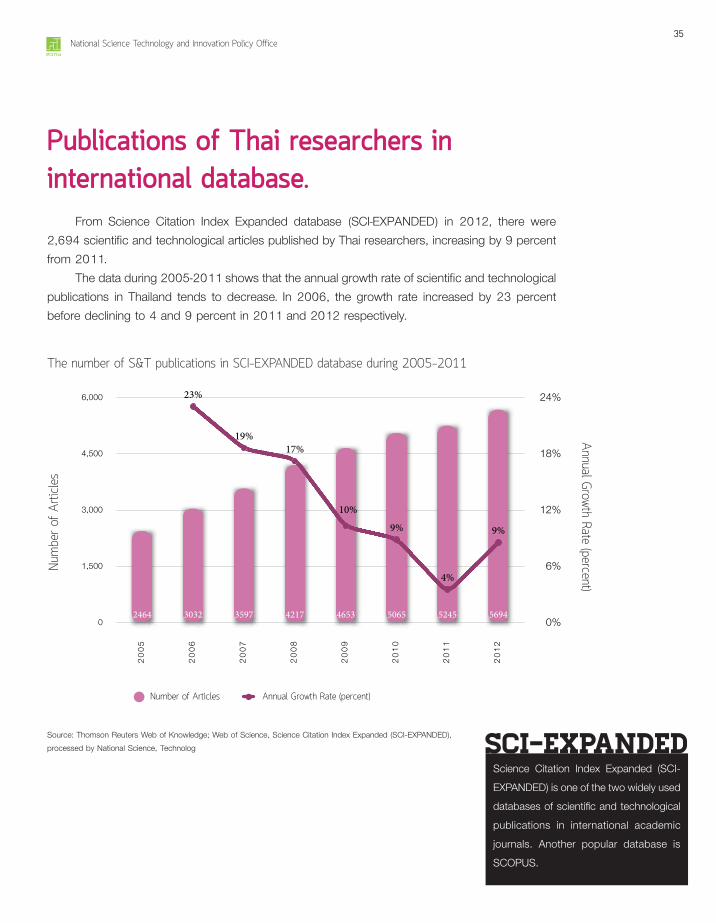
Publications of Thai researchers in international database.
From Science Citation Index Expanded database (SCI-EXPANDED) in 2012, there were 2,694 scientific and technological articles published by Thai researchers, increasing by 9 percent from 2011.
The data during 2005-2011 shows that the annual growth rate of scientific and technological publications in Thailand tends to decrease. In 2006, the growth rate increased by 23 percent before declining to 4 and 9 percent in 2011 and 2012 respectively.
SCI-EXPANDEDScience Citation Index Expanded (SCI-EXPANDED) is one of the two widely used databases of scientific and technological publications in international academic journals. Another popular database is SCOPUS.
The number of S&T publications in SCI-EXPANDED database during 2005-2011
Source: Thomson Reuters Web of Knowledge; Web of Science, Science Citation Index Expanded (SCI-EXPANDED), processed by National Science, Technolog
Num
ber o
f Arti
cles
Annual Growth Rate (percent)
35National Science Technology and Innovation Policy Office
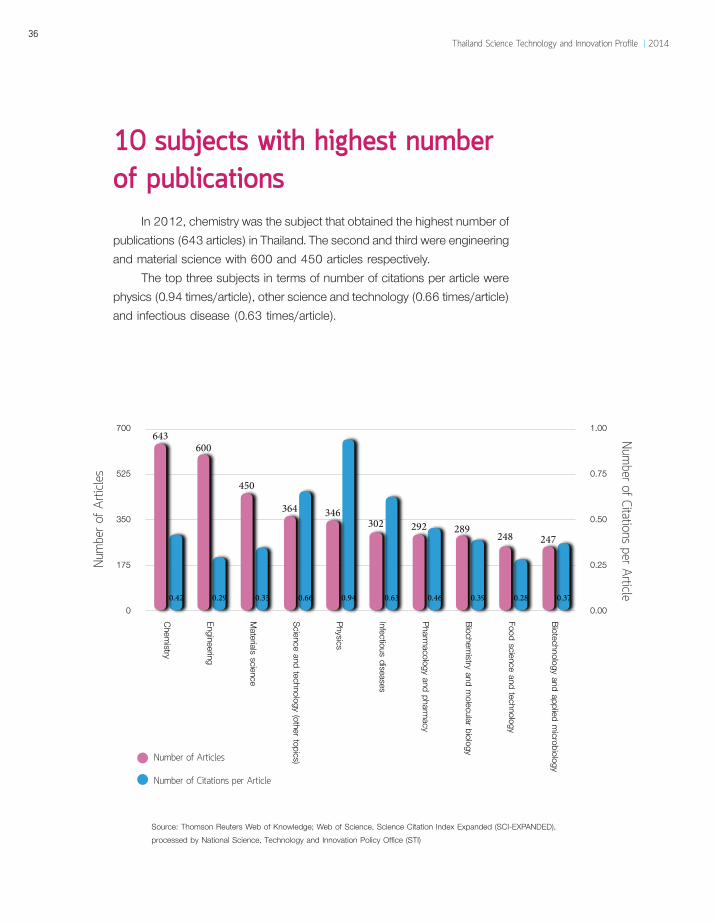
10 subjects with highest number of publications
In 2012, chemistry was the subject that obtained the highest number of publications (643 articles) in Thailand. The second and third were engineering and material science with 600 and 450 articles respectively.
The top three subjects in terms of number of citations per article were physics (0.94 times/article), other science and technology (0.66 times/article) and infectious disease (0.63 times/article).
0.00
0.25
0.50
0.75
1.00
0
175
350
525
700
0.370.280.390.460.630.940.660.350.290.42
247248289292302
346364
450
600643
Number of Articles
Number of Citations per Article
Chemistry
Engineering
Materials science
Science and technology (other topics)
Physics
Infectious diseases
Pharmacology and pharm
acy
Biochemistry and m
olecular biology
Food science and technology
Biotechnology and applied microbiology
Source: Thomson Reuters Web of Knowledge; Web of Science, Science Citation Index Expanded (SCI-EXPANDED), processed by National Science, Technology and Innovation Policy Office (STI)
Num
ber o
f Arti
cles
Number of Citations per Article
36Thailand Science Technology and Innovation Profile | 2014
Data from Thailand Journal Citation Index Center (TCI) has shown that in 2012 there were 7,386 scientific and technological articles publication in domestic academic journals. Moreover, the number of citations per article was 0.77, which increased from 0.65
times per article in 2008.From Science Citation Index Expanded (SCI-EXPANDED) database,
the number of academic publication by Thai researchers has increased. In 2012, there were 5,694 published articles, increased by 9 percent from the previous year.
Of all articles published in international academic journals by Thai researchers in 2012, the largest number of publications (643) was in chemistry whereas articles in physics have the highest number of citations per article on average(0.94 times per article).
Conclusion
37National Science Technology and Innovation Policy Office
Chapter 8Information & Communication Technology
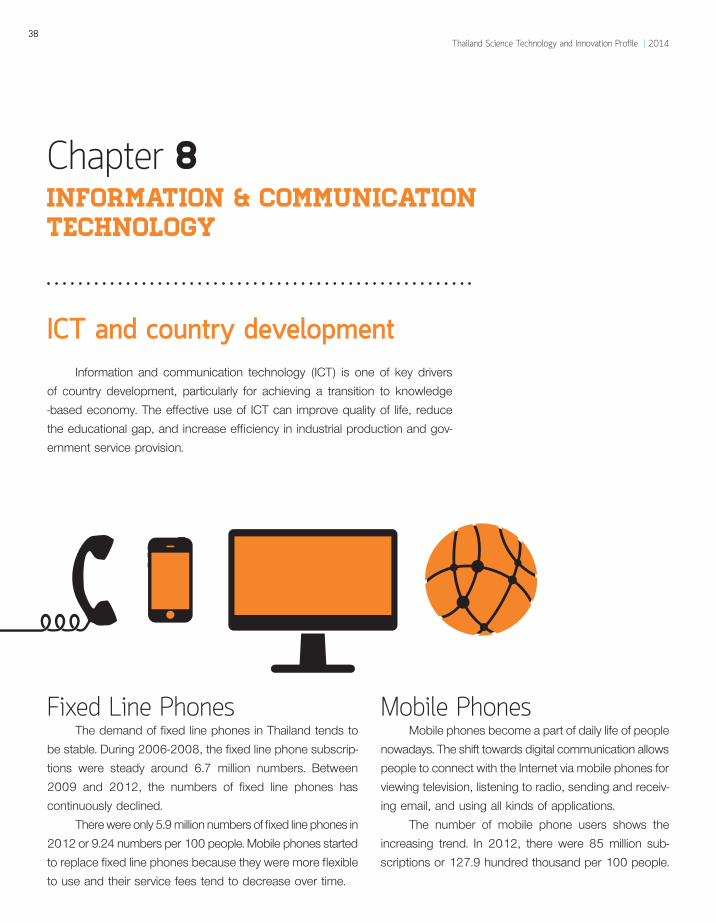
ICT and country developmentInformation and communication technology (ICT) is one of key drivers
of country development, particularly for achieving a transition to knowledge -based economy. The effective use of ICT can improve quality of life, reduce the educational gap, and increase efficiency in industrial production and gov-ernment service provision.
Fixed Line PhonesThe demand of fixed line phones in Thailand tends to
be stable. During 2006-2008, the fixed line phone subscrip-tions were steady around 6.7 million numbers. Between 2009 and 2012, the numbers of fixed line phones has continuously declined.
There were only 5.9 million numbers of fixed line phones in 2012 or 9.24 numbers per 100 people. Mobile phones started to replace fixed line phones because they were more flexible to use and their service fees tend to decrease over time.
Mobile PhonesMobile phones become a part of daily life of people
nowadays. The shift towards digital communication allows people to connect with the Internet via mobile phones for viewing television, listening to radio, sending and receiv-ing email, and using all kinds of applications.
The number of mobile phone users shows the increasing trend. In 2012, there were 85 million sub-scriptions or 127.9 hundred thousand per 100 people.
38Thailand Science Technology and Innovation Profile | 2014
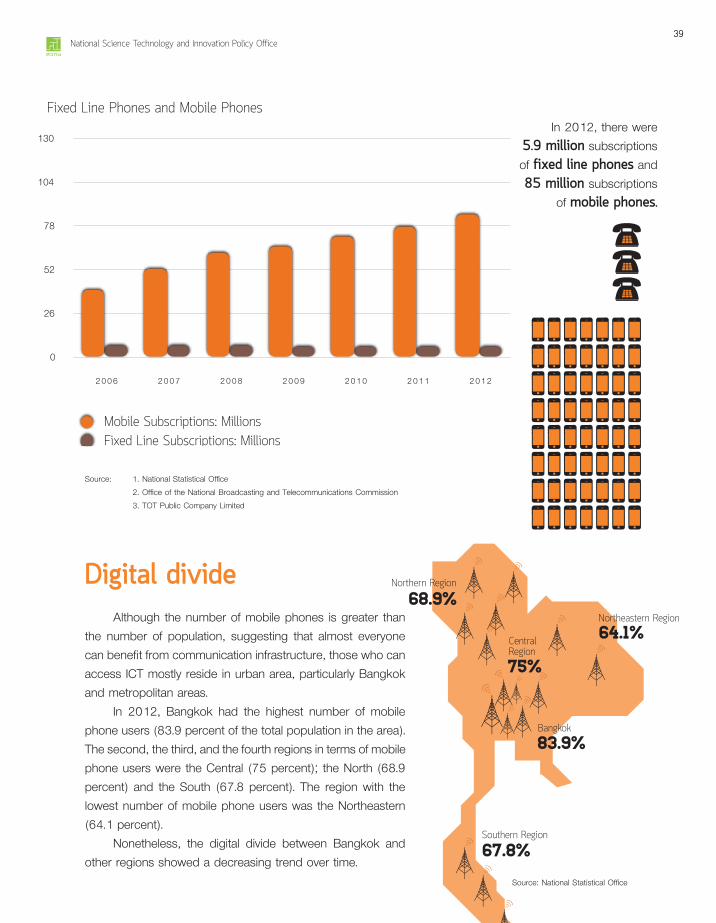
Fixed Line Phones and Mobile PhonesIn 2012, there were
5.9 million subscriptions of fixed line phones and 85 million subscriptions
of mobile phones.
0
26
52
78
104
130
2006 2007 2008 2009 2010 2011 2012
Mobile Subscriptions: MillionsFixed Line Subscriptions: Millions
Source: 1. National Statistical Office 2. Office of the National Broadcasting and Telecommunications Commission 3. TOT Public Company Limited
Digital divideAlthough the number of mobile phones is greater than
the number of population, suggesting that almost everyone can benefit from communication infrastructure, those who can access ICT mostly reside in urban area, particularly Bangkok and metropolitan areas.
In 2012, Bangkok had the highest number of mobile phone users (83.9 percent of the total population in the area). The second, the third, and the fourth regions in terms of mobile phone users were the Central (75 percent); the North (68.9 percent) and the South (67.8 percent). The region with the lowest number of mobile phone users was the Northeastern (64.1 percent).
Nonetheless, the digital divide between Bangkok and other regions showed a decreasing trend over time.
83.9%
64.1%
75%
68.9%
67.8%
Northern Region
Northeastern Region
Southern Region
CentralRegion
Bangkok
Source: National Statistical Office
39National Science Technology and Innovation Policy Office
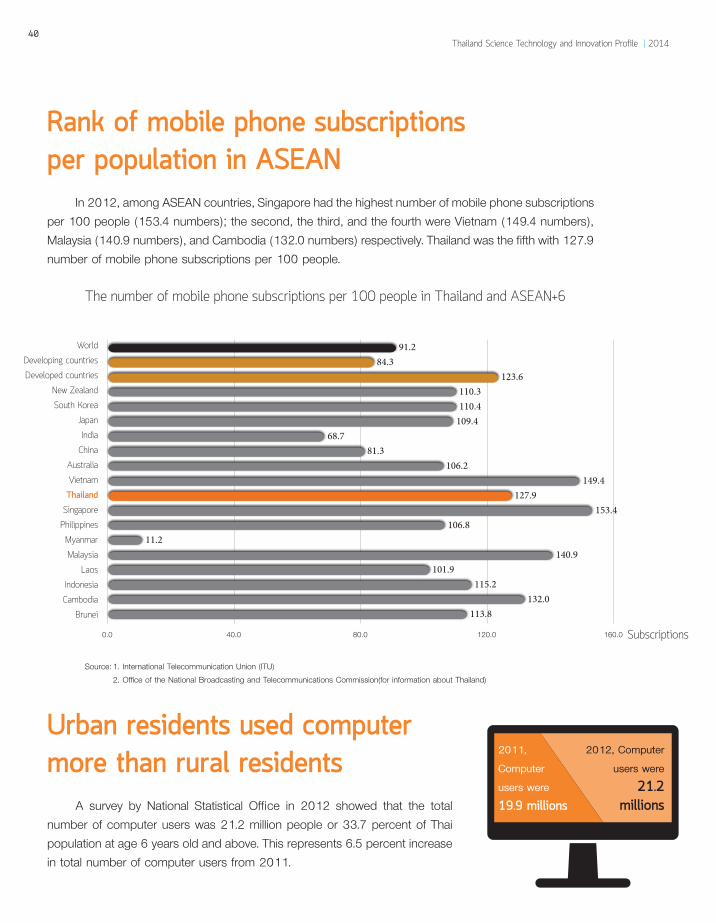
Rank of mobile phone subscriptions per population in ASEAN
In 2012, among ASEAN countries, Singapore had the highest number of mobile phone subscriptions per 100 people (153.4 numbers); the second, the third, and the fourth were Vietnam (149.4 numbers), Malaysia (140.9 numbers), and Cambodia (132.0 numbers) respectively. Thailand was the fifth with 127.9 number of mobile phone subscriptions per 100 people.
0.0 40.0 80.0 120.0 160.0
113.8132.0
115.2101.9
140.911.2
106.8153.4
127.9149.4
106.281.3
68.7109.4110.4110.3
123.684.3
91.2World
Developing countries
Developed countries
New Zealand
South Korea
Japan
India
China
Australia
Vietnam
ThailandSingapore
Philippines
Myanmar
Malaysia
Laos
Indonesia
Cambodia
Brunei
The number of mobile phone subscriptions per 100 people in Thailand and ASEAN+6
Subscriptions
Source: 1. International Telecommunication Union (ITU) 2. Office of the National Broadcasting and Telecommunications Commission(for information about Thailand)
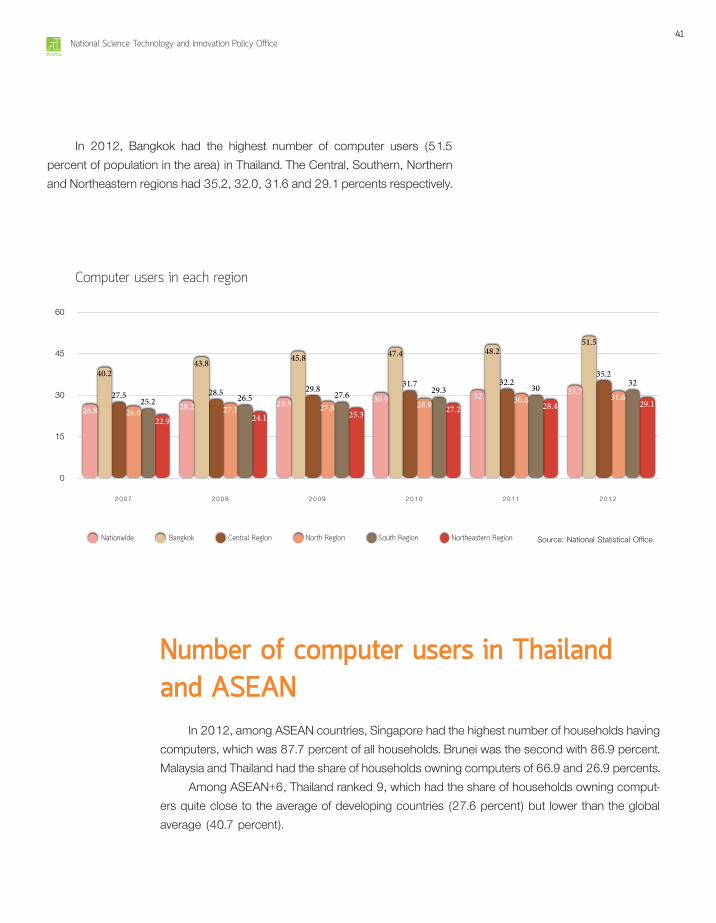
Urban residents used computer more than rural residents
A survey by National Statistical Office in 2012 showed that the total number of computer users was 21.2 million people or 33.7 percent of Thai population at age 6 years old and above. This represents 6.5 percent increase in total number of computer users from 2011.
2012, Computer
users were
21.2 millions
2011,
Computer
users were
19.9 millions
40Thailand Science Technology and Innovation Profile | 2014
0
15
30
45
60
29.128.427.225.324.122.9
323029.327.626.525.2 31.630.628.927.827.126.0
35.232.231.729.828.527.5
51.548.247.445.843.8
40.2
33.73230.929.328.226.8
2007 2008 2009 2010 2011 2012
Nationwide Bangkok Central Region North Region South Region Northeastern Region
In 2012, Bangkok had the highest number of computer users (51.5 percent of population in the area) in Thailand. The Central, Southern, Northern and Northeastern regions had 35.2, 32.0, 31.6 and 29.1 percents respectively.
Source: National Statistical Office
Computer users in each region
Number of computer users in Thailand and ASEAN
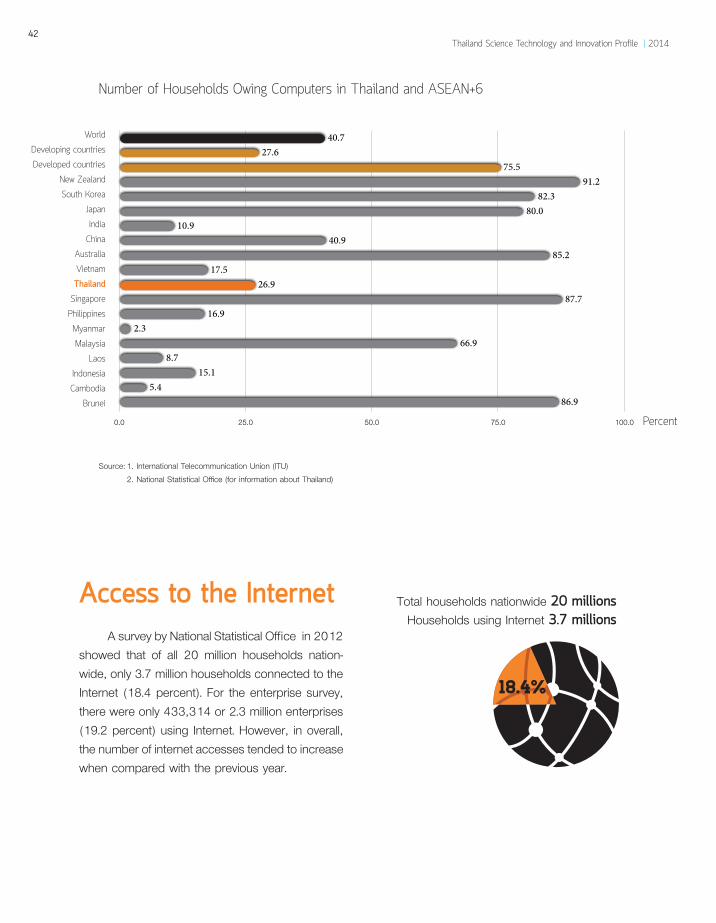
In 2012, among ASEAN countries, Singapore had the highest number of households having computers, which was 87.7 percent of all households. Brunei was the second with 86.9 percent. Malaysia and Thailand had the share of households owning computers of 66.9 and 26.9 percents.
Among ASEAN+6, Thailand ranked 9, which had the share of households owning comput-ers quite close to the average of developing countries (27.6 percent) but lower than the global average (40.7 percent).
41National Science Technology and Innovation Policy Office
0.0 25.0 50.0 75.0 100.0
86.95.4
15.18.7
66.92.3
16.987.7
26.917.5
85.240.9
10.980.0
82.391.2
75.527.6
40.7World
Developing countries
Developed countries
New Zealand
South Korea
Japan
India
China
Australia
Vietnam
ThailandSingapore
Philippines
Myanmar
Malaysia
Laos
Indonesia
Cambodia
Brunei
Number of Households Owing Computers in Thailand and ASEAN+6
Percent
Source: 1. International Telecommunication Union (ITU) 2. National Statistical Office (for information about Thailand)
Access to the InternetA survey by National Statistical Office in 2012
showed that of all 20 million households nation-wide, only 3.7 million households connected to the Internet (18.4 percent). For the enterprise survey, there were only 433,314 or 2.3 million enterprises (19.2 percent) using Internet. However, in overall, the number of internet accesses tended to increase when compared with the previous year.
Total households nationwide 20 millionsHouseholds using Internet 3.7 millions
18.4%
42Thailand Science Technology and Innovation Profile | 2014

0
12.5
25
37.5
50
21.620.318.916.7
13.911.9
25.5
2119.917.5
15.412.7
2523.1
21.219.5
17.815.6
27.5
23.122.319.318
15.7
44.440.639.6
3836
29.926.5
23.722.420.1
18.215.5
2007 2008 2009 2010 2011 2012
Nationwide Bangkok Central Region North Region South Region Northeastern Region
In 2012, population at age 6 years old and above using Internet, Bangkok remained the area with the highest number of residents using Internet, similar to the previous year (44.4 percent or 2.8 million people). The Central, Southern, Northern, and Northeastern regions had the percentage of population using Internet 27.5 (4.1 millions), 25.5 (2.2 millions), 25.0 (2.9 millions), and 21.5 (4.6 millions) percents respectively.
This information reflects the inequality in accessing the Internet because most of the Internet users still concentrated in the economically advanced areas.
Source: National Statistical Office
Percentage of Internet users in each region
Perc
ent (
%)
43National Science Technology and Innovation Policy Office
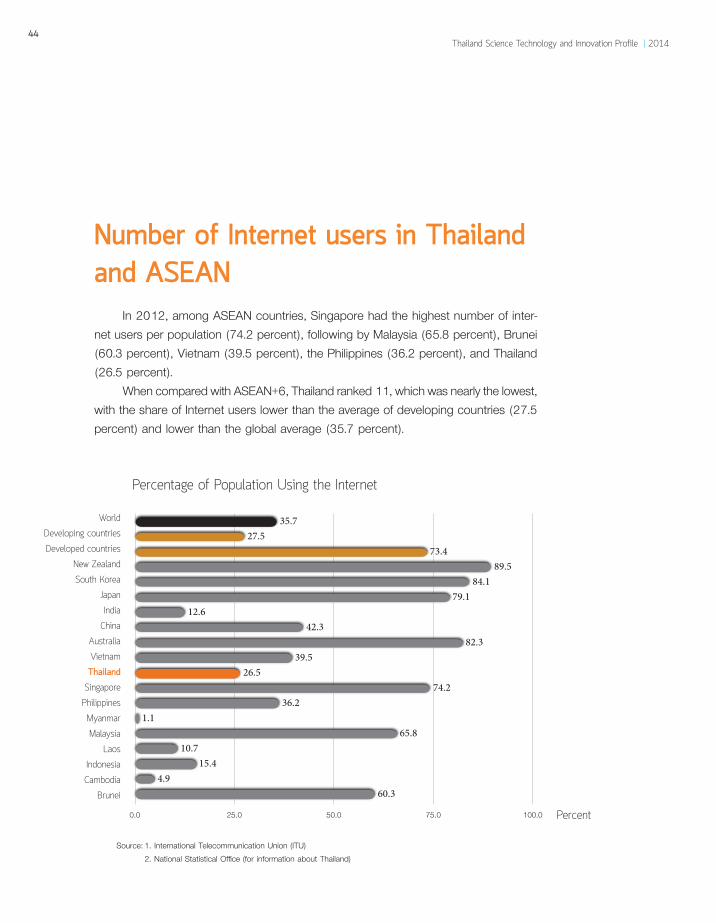
Percentage of Population Using the Internet
0.0 25.0 50.0 75.0 100.0
60.34.9
15.410.7
65.81.1
36.274.2
26.539.5
82.342.3
12.679.1
84.189.5
73.427.5
35.7World
Developing countries
Developed countries
New Zealand
South Korea
Japan
India
China
Australia
Vietnam
ThailandSingapore
Philippines
Myanmar
Malaysia
Laos
Indonesia
Cambodia
Brunei
Percent
Source: 1. International Telecommunication Union (ITU) 2. National Statistical Office (for information about Thailand)
Number of Internet users in Thailand and ASEAN
In 2012, among ASEAN countries, Singapore had the highest number of inter-net users per population (74.2 percent), following by Malaysia (65.8 percent), Brunei (60.3 percent), Vietnam (39.5 percent), the Philippines (36.2 percent), and Thailand (26.5 percent).
When compared with ASEAN+6, Thailand ranked 11, which was nearly the lowest, with the share of Internet users lower than the average of developing countries (27.5 percent) and lower than the global average (35.7 percent).
44Thailand Science Technology and Innovation Profile | 2014
Although the fast development of mobile phone technology can help reducing digital divide, Thai citizens still face the problem of accessing to ICT as clearly seen from the vast
difference in the number of Internet users in Bangkok versus other regions
as well as inside versus outside urban areas.Information and Communication Technology (ICT) is
a crucial infrastructure of science and technology, which drives the competitiveness of the country. Therefore, the government should adequately and timely invest in ICT.
Conclusion
45National Science Technology and Innovation Policy Office
Thailand Science Technology and Innovation Profile 2014
Advisory CommitteeDr.Pichet Durongkaveroj Minister of Science and Technology, Thailand
Dr.Yada Mukdapitak Deputy Secretary General
Dr.Somchai Chatratana Deputy Secretary General
Dr.Kitipong Promwong Deputy Secretary General
Ms.Oraphin Mattew Project Advisory
Organizer
Dr.Piengpen Butkatanyoo Director, Department of Infrastructure
Dr.Chinawut Chinaprayoon Senior Policy Researcher
Mr.Sonthi Narakhemanan Senior Policy Researcher
Mr.Nonthawat Magroodin Senior Policy Researcher
Miss Sudarat Maneekorn Policy Researcher
Mr.Ariyawat Saenakun Policy Researcher
Miss Panadda Tonjan Project Coordinator
Miss Panicha Veerapunyakulthavee Project Coordinator
National Science Technology and Innovation Policy Office
319 Chamchuri Square Building, 14th Fl., Phayathai Rd.,
Patumwan, Bangkok 10330
Tel 0 2160 5432 ext. 554
Fax 0 2160 5438
e-mail: [email protected]
website: http://stiic.sti.or.th

Thailand Science Technology and Innovation Profile 2014ISBN: 978-616-12-0374-0
First Edition: February 2015
Design & Production byPen Thai Publishing Co., Ltd.
Tel 0 2736 9918
Fax 0 2736 8891
e-mail: [email protected]
website: waymagazine.org