Foreign Direct Investment to Africa: The Role of Price ...
35
Foreign Direct Investment to Africa: i The Role of Price Stability and Currency Instability CARMEN M. REINHART AND KENNETH S ROGOFF Africa lags behind other regions in attracting foreign direct investment. In some cir- cumstances, there are obvious explanations for the absence of foreign direct invest- ment, such as a high incidence of war. Reinhart and Rogoff examine the role that monetary and exchange rate policy may have played in explaining this outcome. Specifically, they document the incidence of inflationary episodes and currency crash- es to compare countries within the region as well as to make comparisons with other regions. Furthermore, because monetary policy can range from very transparent to very opaque, the authors assess Africa's track record with dual and parallel markets. Reinhart and Rogoff use the parallel market premia as an indicator of the degree of distortion and extent of transparency. Their findings suggest that this is a promising line of inquiry because Africa does stand apart from other regions in this measure of transparency. The authors also discuss some of the fiscal underpinnings of Africa's bouts with high inflation. Introduction Strong, stable macroeconomic policies are not sufficient conditions for investment and growth. Among many other important factors are the transparency of macro- economic policies, robust institutions, low levels of corruption, absence of wars, openness to trade, and a favorable external environment. But macroeconomic policy stability-especially price stability-is almost certainly an essential ingredient. With- out it, the risks to doing business rise drastically, internal trade is significantly ham- pered, and external trade is impeded to an even greater extent. High and unpre- Carmen M Reinhart is depury director of the research department at the International Monetary Fund. Kenneth S Rogoff is director of the research department and economic counselor at the International Monetary Fund. The authors wish to thank Kenichiro Kashiwase, Daoude Sembene, and loannis Tokarlidis for superb research assistance, and Vin- cent Reinhart for helpful comments and suggestions. Annual World Bank Conference on Developmenit Economics 2003 ( 2003 The International Bank for Reconstruction and Development / The World Bank 247
Transcript of Foreign Direct Investment to Africa: The Role of Price ...

Foreign Direct Investment to Africa:i The Role of Price Stability and
Currency Instability
CARMEN M. REINHART AND KENNETH S ROGOFF
Africa lags behind other regions in attracting foreign direct investment. In some cir-cumstances, there are obvious explanations for the absence of foreign direct invest-ment, such as a high incidence of war. Reinhart and Rogoff examine the role thatmonetary and exchange rate policy may have played in explaining this outcome.Specifically, they document the incidence of inflationary episodes and currency crash-es to compare countries within the region as well as to make comparisons with otherregions. Furthermore, because monetary policy can range from very transparent tovery opaque, the authors assess Africa's track record with dual and parallel markets.Reinhart and Rogoff use the parallel market premia as an indicator of the degree ofdistortion and extent of transparency. Their findings suggest that this is a promisingline of inquiry because Africa does stand apart from other regions in this measure oftransparency. The authors also discuss some of the fiscal underpinnings of Africa'sbouts with high inflation.
Introduction
Strong, stable macroeconomic policies are not sufficient conditions for investmentand growth. Among many other important factors are the transparency of macro-economic policies, robust institutions, low levels of corruption, absence of wars,openness to trade, and a favorable external environment. But macroeconomic policystability-especially price stability-is almost certainly an essential ingredient. With-out it, the risks to doing business rise drastically, internal trade is significantly ham-pered, and external trade is impeded to an even greater extent. High and unpre-
Carmen M Reinhart is depury director of the research department at the International Monetary Fund. Kenneth SRogoff is director of the research department and economic counselor at the International Monetary Fund. The authorswish to thank Kenichiro Kashiwase, Daoude Sembene, and loannis Tokarlidis for superb research assistance, and Vin-cent Reinhart for helpful comments and suggestions.
Annual World Bank Conference on Developmenit Economics 2003( 2003 The International Bank for Reconstruction and Development / The World Bank
247

248 I CARMEN M REINHART AND KENNETH S ROGOFF
dictable inflation, especially, cripples business planning and checks the developmentof financial intermediation within the private sector. Because this is well known manycountries throughout the world have strived to achieve notable success in bringingdown inflation since the 1980s in the industrial countries and especially over the1990s, in emerging markets and developing countries. The key to achieving that suc-cess is well known and well proven: a strong, independent central bank that places ahigh value on maintaining low inflation.Whether this low inflation is attained byappointing skilled, highly competent central bankers who are known to be commit-ted to price stability-the most common approach-or through a more complexinstitutionalized system of checks and balances, or through a combination of both issecond-order compared with maintaining meaningful central bank independence.
Some people have argued that this prescription cannot be transferred to Sub-Saha-ran Africa because many countries in the region are in too early phases of politicaldevelopment. Those countries, according to that argument, lack the necessary insti-tutional structure to establish a meaningfully independent central bank. If the judici-ary and the parliament are unduly influenced by the chief executive or the rule of lawis in some other ways indistinct, the central bank has nowhere to hide. In such cir-cumstances, when the chief executive phones the head of the central bank and asksfor funds, the central bank can hardly refuse. Because of these internal pressures,many African countries have sought to import price stability by joining a regionalcurrency or a regional currency block anchored to a reserve currency, such as theeuro or the dollar.
Aside from currency arrangements, many developing countries must put a highpremium on attracting foreign direct investment (FDI). Yet, as figure 1 illustrates,FDI to Africa does not depend on whether the large economies, such as the UnitedStates, are in recession. Furthermore, Africa did not benefit much from the surge inFDI to emerging markets during the 1990s. How can African nations achieve the cli-mate of price stability needed to promote investment?
This is a difficult question that we will attempt to address by examining someessential features of Africa's historical experience with inflation and exchange ratearrangements, drawing on the extensive chronologies developed in Reinhart andRogoff (2002) that encompass all economies of the world. This historical perspectiveyields some useful insights. First, the typical inflation and exchange rate experiencein postcolonial, non-CFA (Communaute Fmanciere Africaine) franc Africa is weakcompared with that of Europe and Asia. But even excluding the more stable CFAfranc zone countries, it is not notably worse than the experiences of many countriesin Latin America, in the Middle East, or in post-1980s transition economies. Thisassessment may seem like faint praise because so many countries in those otherregions have such a checkered inflation history. But it is relevant if one wants to arguethat Africa needs a completely different set of arrangements than do economies else-where. Second, we find that the incidence of extremely high parallel exchange mar-ket premia (50 percent or more-exceeding 500 percent in some cases) is remarkablyhigh in Africa, and therein lies the real differences. Averaging across all countriesbetween 1979 and 1998, the parallel premia in non-CFA Sub-Saharan Africa exceed-

FOREIGN DIRECT INVESTMENT TO AFRICA I 249
FIGURE 1.U.S. Monetary Policy and Capital Flows to Emerging Market Economies:Net Real Private Direct Investment(billions of 1970 U S dollars)
WesternHemisphere -
. s *~~~~~~~~~ Easing
Middle East Ill Tighteningand Europe 3
Other Asianemerging
markets -
Asia, crisiscountries -
Africa
Total emergingmarket
economies
0 2 4 6 8 10
Source Reinhart and Reinhart 2001
ed 50 percent more than one-third of the time! We argue that parallel premia at thatlevel are highly problematic in that they breed significant corruption and governanceproblems. As such, they are often an excellent barometer of broader and deeper prob-lems in macroeconomic stabilization and governance. The case for advocating uni-fied exchange rate regimes rests as much on improving governance and reducing cor-ruption as on any macroeconomic benefit. A third conclusion we reach is that adopt-ing the currency of an industrial country has its own set of problems, not the leastastonishing of which is the incidence of frequent deflation.
This article is divided into six parts including this introduction. The second sec-tion briefly puts the postcolonial African exchange rate experience in perspectiverelative to Europe. The third section looks at the incidence of high inflation and thefrequency of currency crashes in Africa compared with other regions. In that dis-cussion our emphasis is in assessing the extent to which price and currency insta-bility are behind the low observed levels of FDI. In our analysis of behavior of theparallel market premia in the fourth section, we find that the high probability ofextremely large premia makes the African experience markedly different from that

250 I CARMEN M REINHART AND KENNETH S ROGOFF
of the rest of the world. We argue that the high parallel premia may be symptomaticof more general governance problems in many cases, including corruption andobstacles to trade-with deleterious consequences for FDI. The fifth section of thepaper offers some insights on the root cause of inflation from a broad theoreticalperspective. The perspective suggests that the funding needs of the fiscal authority-that is, fiscal dominance-is likely to be a significant problem for many of the high-ly indebted African countries. The concluding section speculates on options forAfrica in the light of its experience.
The African Experience in Perspective
Modern central banking is a relatively recent development. Only a couple hundredyears ago few countries in the world had the governmental checks and balances need-ed to maintain an independent central bank. As a case in point, the central bank ofSpain began in 1782 as the Bank of St. Charles, founded originally as a quasiprivatebank by King Charles III of Spain. The unabashed purpose was to help absorb gov-ernment debt. The name of the bank itself speaks volumes about how (not) inde-pendent it was from the chief executive. When King Ferdinand came to the throne,the Bank of St. Charles became the Bank of St. Ferdinand. Only much later did itbecome the Bank of Spain, which today stands as a funding member of the nascentEuro system. In the United States, efforts to sustain a national central bank founderedtwice during the 19th century. During that country's civil war of 1861-65, the Con-federate states abandoned the Yankee dollar and printed their own currency. Civilwars are not an unusual feature of a relatively young state, nor are their monetaryconsequences. The modern U.S. Federal Reserve System was founded in 1913. Dur-ing the first half of the 20th century, the internal governance structures that helpedto sustain its independence were less firmly established than they are today. In 1934,for example, the U.S. government invalidated gold contracts, and a few years laterPresident Franklin D. Roosevelt seriously entertained expanding the U.S. SupremeCourt from 9 members to 18 or 20 to stack the court with justices who would sup-port his programs. Eventually he abandoned this proposal, but the point is that evenin relatively modern-day experience, governance structures have continued to evolve.Similar examples can be given across the industrial world. In that regard, the prob-lems of Africa in establishing independent central banks are not unique to youngnations, but the benefits can be great and as modern central banking techniques con-tinue to improve, there is a strong case to be made that improved monetary policyhas been one factor in the greater stability of output and employment observed inmany industrial countries since the 1980s. This point is illustrated dramatically in fig-ure 2, which gives year-to-year changes in growth rates for the Group of Seven (G7)(Japan is an exception) and the world. As is evident from the figure and can be con-firmed by closer statistical analysis, output volatility has been dropping dramaticallysince the mid-1980s. Thus, although high inflation is often a symptom rather than acause of growth problems, it can also be a problem in its own right.

FOREIGN DIRECT INVESTMENT TO AFRICA I 251
FIGURE 2.GDP Growth: World and G7 Countries, 1970-2002
8
7
6
5Ece
4 WorlD
0~
70 72 74 76 78 80 82 84 86 88 90 92 94 96 98 00 02
Year
Source- IMF 2002
High Inflation, Currency Crashes, and FDI: Is Africa Different?
This section of the article is descriptive, as we neither offer nor test a formal modelof the determinants of FDI to Africa nor to any other region.' We begin by lookingat some of the possible "pull" factors that may influence FDI. As to "push" factors,Reinhart and Reinhart (2001) have shown that FDI to developing countries has animportant cyclical component, more so than other types of capital flows. As a gen-eral rule, FDI flows more heavily to emerging market economies when the UnitedStates economy is expanding than when it is in recession. This cyclical pattern hasimportant consequences for the volume of FDI that developing countries in Asia andthe Western Hemisphere receive, as illustrated in figure 1. But the cycle is not rele-vant for African economies, which generally receive very little FDI at any stage of theU.S. cycle. Indeed, looking at panel data on total capital flows to Africa, Calvo andReinhart (1998) concluded that, in contrast to other regions, the only external factorthat systematically influences capital flows to Africa is world commodity prices.

252 I CARMEN M REINHART AND KENNETH S ROGOFF
Flows increase during booms in commodity prices and, other things being equal,decline during busts. In what follows, we document what in principle could beexpected to be deterrents to investing in Africa.
Basics for Attracting FDI
An obvious and powerful deterrent to FDI is political instability. Edwards (1990)found that the political instability is always statistically significant, irrespective ofwhat other variables were included as regressors in his cross-country regressions. Ofcourse, wars are an extreme form of political instability-and Africa has had morethan its share. Using the dates of wars provided in Collier and Hoeffler (2001,2002),we constructed the probability of war for three regions-Africa, Asia, and the West-ern Hemisphere (excluding Canada and the United States)-from 1960 to 2001. Thisprobability is simply the number of months during which there was a war over thetotal number of months for a particular country. We then averaged across countriesto obtain the regional number. As shown in table 1, the probability for Africa, at 12.6percent, is almost twice as large as that of the developing Western Hemisphere butslightly below the probability for Asia. Column 3 of that figure, however, paints astrikingly different picture-40 percent of the countries in Africa have had at leastone war during 1960-2001, and 28 percent of the countries have had two or more.That is more than three times the incidence of war in the Western Hemisphere andalmost twice that of Asia. In the case of the latter, the higher probability shown incolumn 2 results from a smaller number of countries having had longer wars.
Whereas wars, per se, are a likely deterrent to FDI, wars also are often a source ofanother deterrent to FDI, inflation.
Incidence of High Inflation and Currency Crashes
As a rule of thumb, we can take a 40 percent inflation rate over a 12-month periodas the threshold over which price instability becomes seriously dysfunctional. InAfrica, there are five countries where the average annual inflation rate over the
TABLE 1.Incidence of War: January 1 960-December 2001
Probability of war: Percentage of countries Regional susceptibility topercentage of months in the region with at war index: averageduring which there is least one war during percentage of columns
Region (1) conflict (2) the sample (3) 2 and 3 (4)Africa 12 6 400 26 3Asia 13 9 23 9 19.4Western Hemisphere 6 4 13 3 9 9(excluding Canada andthe United States)Sources Collier and Hoeffler 2001, 2002, and authors' calculations

FOREIGN DIRECT INVESTMENT TO AFRICA I 253
TABLE 2.African Countries for Which the Average Inflation Rate during 1970-2001Is above 40 Percent
Average annual inflation, Percentage of months duringCountry 1970-2001 (percent) which there is conflictCongo, Dem Rep of 1,112 9 30 3
Angola 345 4 96 3
Uganda 67 2 185Ethiopia 430 65 2Zambia 41 1 0
Regional average excluding Congo 12 4 9 1
Sources Collier and Hoeffler 2001, 2002, iMF 2002, and authors' calculations
1970-2001 period exceeded 40 percent. These are shown in table 2, alongside theprobability of war as measured by the percent of months during which there wasconflict. For four of the five high-inflation cases, the probability of war was notablyhigher than for the rest of Africa.2 Furthermore, for those four cases, not only is infla-tion well above the average for the rest of the region; the probability of war is alsowell above the average for the remainder of the countries in the region.
Hence, it is an understatement to suggest that conflict, as well as the economic insta-bility that it brings, can be expected to have deleterious consequences for the invest-ment climate. For Africa, the cross-country correlation between the average inflationrate and the probability of war over the same period is 0.36 and is statistically signifi-cant. Apart from wars, however, inflation may also arise in peacetime when there is aproblem of fiscal dominance-an issue that we take up later in greater detail.
Over and beyond these more extreme cases, tables 3 to 6 document other coun-tries' experiences with high inflation (that is, above 40 percent). The tables provideinformation on the dates of high inflation episodes and their average duration inyears and months.3 The main results that emerge from the more detailed country-by-country analysis are summarized in table 7, which gives the regional averages for theprobability that the 12-month inflation rate is above 40 percent, as well as the aver-age duration of the inflation spells. Table 7 also provides information on currencycrashes, which we will discuss next. For North and CFA Africa, inflation is clearlynot the critical issue, as these countries score well relative to other regions. (For theCFA franc zone countries, which are pegged to the French franc, the more consider-able problem has been deflation, as Reinhart and Rogoff (2002) have documented.)The contrast that emerges from comparing non-CFA Africa to other regions is thatAfrica's inflation track record is far worse than Asia's track record. However, Africa'sinflation performance is not that different from the average for developing Europeand the Middle East. Most notably, Africa has a better historical record than that ofthe inflation-prone Western Hemisphere. This is an important finding as we alreadyalluded to in the introduction. Africa's inflation record may not be strong, but it isnot as exceptional as many have maintained. Therefore the extent to which specialsolutions are required should not be exaggerated.

254 I CARMEN M. REINHART AND KENNETH S ROGOFF
TABLE 3.High Irflation Spells: North Africa and Sub-Saharan CFA Franc Zone Countries,1965-2001
Episodes of inflation Total number of years and monthsCountry above 40 percent with inflation above 40 percentNorth Africa
Algeria 1994 1-1995 1 1 yr., 1 moMorocco - -TunisiaAverage for the region - 4 mos
Sub-Saharan Africa, CFA
Benin 1994 1-1994 12 1 yrBurkina FasoCameroon 1994 1-1994 12 1 yrCentral African Republic 1994 1-1995 1 1 yr, 1 moChad 19941-19951 1 yr, 1 moCongo, Rep of 1994 1-1995 1 1 yr, 1 moCote d'lvoire _ _Equatorial Guinea 1994 1-1994.12 1 yrGabon 1994 1-1994 12 1 yrGuinea-BissauMaliNiger 1994.1-1994 12 1 yrSenegal 1994 1-1994 11 11 mosTogo 1994 1-1994-12 1 yrAverage for the region - 9 mos
- Not applicable
Sources Collier and Hoeffler 2002, Fischer, Sahay, and Vegh 2001, IMF, International Financial Statistics(various issues), Mitchell 1982, and Reinhart and Rogoff 2002
Of course, it is worth noting that FDI to high-inflation regions of the WesternHemisphere was also only a trickle during the 1980s, and that FDI only surged fol-lowing the various efforts within many countries in the region to bring inflationunder control. What these recent trends imply is that, going forward, Africa shouldfocus on maintaining a climate of price stability.
Another manifestation of uncertainty that can be expected to affect the investmentclimate is the incidence of currency crashes-which is, of course, intimately related tothe inflation performance. Because the CFA franc zone has had a long history of a sta-ble exchange rate versus the French franc first and now versus the euro, we now turnout attention to documenting currency crashes mostly for the non-CFA countries. 4
As we discuss in the following section, it has been a common practice in manyAfrican countries to peg the official exchange rate to some anchor currency (often theU.S. dollar). Sometimes this was done in the context of dual markets and sometimesin the context of an inflation stabilization plan. Some currency crashes, however, didnot take place against the backdrop of a pegged official exchange rate but against thebackdrop of a loss of monetary control.
To compare Africa's performance in this dimension with that of other regions, weconstructed two measures of currency crashes that are very similar to those intro-

FOREIGN DIRECT INVESTMENT TO AFRICA I 255
TABLE 4.High Inflation Spells: Sub-Saharan Africa non-CFA Franc Zone Countries, 1965-2001
Episodes of inflation Total number of years and monthsCountry above 40 percent with inflation above 40 percentAngola 1991.3-2001 12 10 yrs, 9 mos
Burundi 1978 1-1979.7 2 yrs, 6 mos1996 5-1997 5
Congo, Dem. Rep of 1967 1-1968 9 21 yrs, 6 mos1975 1-1984 81987 2-1997.11
Ethiopia 19906-1991 7 1 yr, 1 mo
Gambia, The 1985 1-1987.2 2 yrs, 1 moGhana 1973 10-1984 5 15 yrs, 11 mos
1986 4-1987 91989 8-1990 91994 3-1996 8
1999 11-2001 4Guinea 1986 1-1986 12 1 yrKenya 1992 9-1994 3 2 yrs, 1 mo
Madagascar 1947 1-1948 12 2 yrs, 7 mos1994 1-1995 8
Malawi 1993 11-1996 6 2 yrs, 7 mosMozambique 19936-19957 2 yrs, 1 moNigeria 1983 4-1984 9 9 yrs
1987 2-1989 121991.6-1996 3
Rwanda - -
Somalia 1978 11-1981 6 9 yrs, 5 mos1982 7-1986 8
1987 2-1989 11South Africa
Sudan 1978 11-1980 2 14 yrs, 6 mos19808-1981 81983 9-1985 61986 10-1997 4
Swaziland - -
Tanzania 1983 4-1985.3 7 yrs, 8 mos1992.6-1995 3
Uganda 1981 1-1982 5 8yrs1983 8-1990.4
Zambia 1985 1-1996 9 11 yrs, 8 mos
Zimbabwe 1991 5-1993 2 3 yrs, 10 mos1997 12-1999 12
Non-CFA franc zone average - 6 yrs., 7 mos
- Not applicable
Notes Hyperinflation begins in the month when the rise in prices exceeds 50 percent and ends in the month whenthe monthly rise in prices drops and stays below that amount See Fischer, Sahay, and V6gh (2001) for a recent dis-cussion of hyperinflations
Sources Collier and Hoeffler 2002, Fischer, Sahay, and V6gh 2001, IMF, International Financial Statistics (vanousissues), Mitchell 1982, and Reinhart and Rogoff 2002

256 I CARMEN M REINHART AND KENNETH S ROGOFF
TABLE 5.High Inflation Spells: Asia, Europe, and the Middle East, 1965-2001
Episodes of inflation Total number of years and monthsCountry above 40 percent with inflation above 40 percentAsia
China, Hong Kong
China, mainland
India
Indonesia 1972 7-1974 6 2 yrs, 9 mos
1997 7-1999.3Korea
Lao People's Dem Rep 1988 6-1990 4 3 yrs, 11 mos
1997 4-2000 2Malaysia
Myanmar 1972.8-1976 2 9 yrs
1988.4-1989 51990 5-1991 5
1993 1-1994 1
1996 8-1999 1NepalPakistan
Philippines 1984 4-1985 2 10 mosSingapore
Sri Lanka
Thailand
Average for the region - 1 yr, 2 mos
Europe and Middle EastEgypt, Arab Rep of
Iceland 1973-5-1976 1 9 yrs, 8 mos
1977 5-1984 5
Iran, Islamic Rep of 1994 2-1996 2 2 yrsIraq-
Israel 1951 1-1951 12 14yrs,2mos
1973 10-1986 12Jordan
Lebanon 1984 3-1993 3 9 yrsLibya, Arab Republic of -
Poland 1988.1-1992 12 4 yrs, 11 mos
Romania 1990-10-2001 3 11 yrs., 5 mos.Saudi Arabia
Turkey 1976 9-1981.3 22 yrs 2 mos
1983.4-2001 12Average for the region - 6 yrs, 1 mo
- Not applicable
Sources Collier and Hoeffler 2002, Fischer, Sahay, and Vegh 2001, IMF, International Financial Statistics (vanousissues), Mitchell 1982, and Reinhart and Rogoff 2002

FOREIGN DIRECT INVESTMENT TO AFRICA I 257
TABLE 6.High Inflation Spells: Western Hemisphere, 1965-2001
Episodes of inflation Total number of years and monthsCountry above 40 percent with inflation above 40 percentArgentina 1970 8-1992 2 21 yrs, 6 mos
Bolivia 1972 9-1 974 12 10 yrs, 6 mos1978 12-1986 12
Brazil 1980 1-1995 5 16 yrs, 4 mos
Chile 1971 5-1978 6 7 yrs, 1 mo
Costa Rica 1980 9-1983 6 2 yrs, 9 mos
Dominican Republic 1984.1-1985 11 5 yrs, 9 mos1987 7-1989 61989 8-1991 8
Ecuador 1982 5-1984 4 9 yrs, 11 mos1987 4-1993 81997 10-2001 4
Guatemala 1985 3-19866 3 yrs, 1 mo19896-1991 4
Guyana 19881-1991 12 3yrs, 11 mos
Haiti 1993 5-1995 1 1 yr, 8 mos
Jamaica 1977 7-1979 4 4 yrs, 2 mos1990 7-1992 12
Mexico 1981 5-1988 12 8 yrs, 8mos1994 12-1996 1
Nicaragua 1978 6-1980 5 11 yrs, 5 mos1982 8-1992 2
Paraguay 1985 4-1986 4 2 yrs, 1 mo1989 5-1991 1
Peru 1975 9-1993 11 18 yrs, 2 mos
Suriname 1986 5-1987 12 6 yrs, 1 mo1991 5-1995 11
Uruguay 1962 12-1969 1 24 yrs, 6 mos1972.1-1981.11982 2-1995 9
Venezuela, R B. de 1988 2-1997 7 9 yrs, 5 mos.
Average for the region - 9 yrs, 6mos
- Not applicable
Notes Hyperinflation begins in the month when the rise in prices exceeds 50 percent and ends in the month whenthe monthly rise in prices drops and stays below that amount See Fischer, Sahay, and Vegh (2001) for a recent dis-cussion of hyperinflations
Sources Collier and Hoeffler 2002, Fischer, Sahay, and Vegh 2001, IMF, International Financial Statistics (variousissues), Mitchell 1982, and Reinhart and Rogoff 2002
258 I CARMEN M REINHART AND KENNETH S ROGOFF
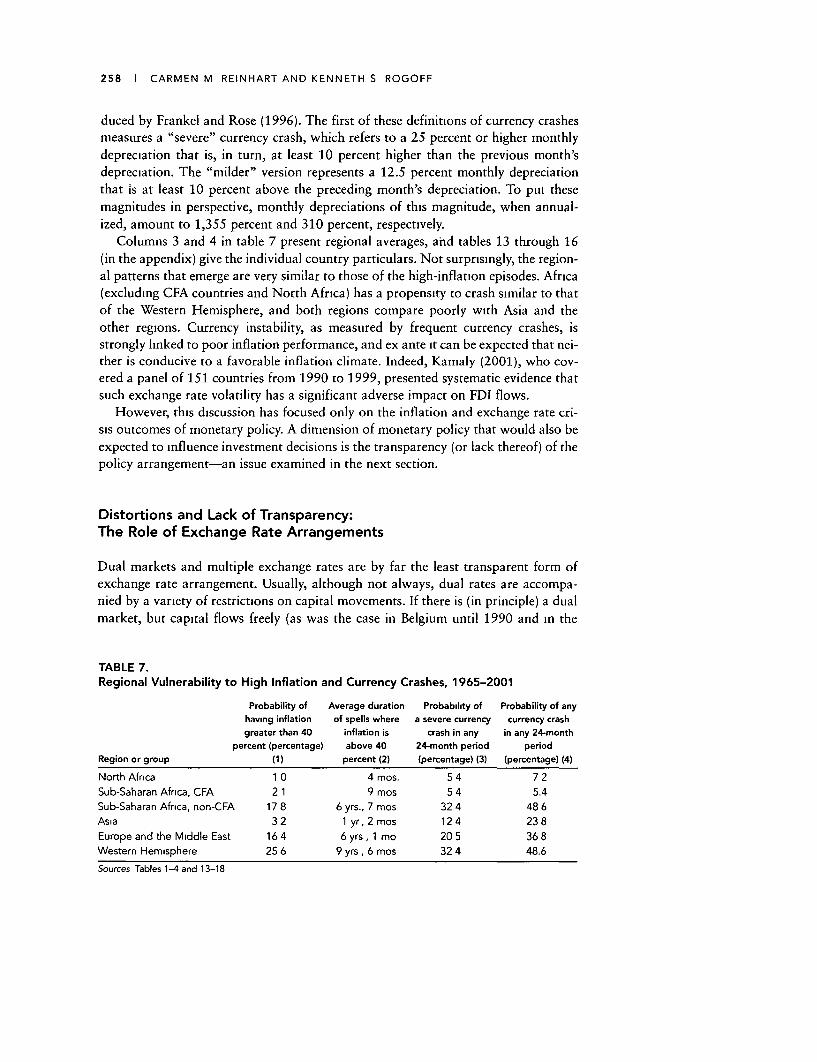
duced by Frankel and Rose (1996). The first of these definitions of currency crashesmeasures a "severe" currency crash, which refers to a 25 percent or higher monthlydepreciation that is, in turn, at least 10 percent higher than the previous month'sdepreciation. The "milder" version represents a 12.5 percent monthly depreciationthat is at least 10 percent above the preceding month's depreciation. To put thesemagnitudes in perspective, monthly depreciations of this magnitude, when annual-ized, amount to 1,355 percent and 310 percent, respectively.
Columns 3 and 4 in table 7 present regional averages, ahd tables 13 through 16(in the appendix) give the individual country particulars. Not surprisingly, the region-al patterns that emerge are very similar to those of the high-inflation episodes. Africa(excluding CFA countries and North Africa) has a propensity to crash similar to thatof the Western Hemisphere, and both regions compare poorly with Asia and theother regions. Currency instability, as measured by frequent currency crashes, isstrongly linked to poor inflation performance, and ex ante it can be expected that nei-ther is conducive to a favorable inflation climate. Indeed, Kamaly (2001), who cov-ered a panel of 151 countries from 1990 to 1999, presented systematic evidence thatsuch exchange rate volatility has a significant adverse impact on FDI flows.
However, this discussion has focused only on the inflation and exchange rate cri-sis outcomes of monetary policy. A dimension of monetary policy that would also beexpected to influence investment decisions is the transparency (or lack thereof) of thepolicy arrangement-an issue examined in the next section.
Distortions and Lack of Transparency:The Role of Exchange Rate Arrangements
Dual markets and multiple exchange rates are by far the least transparent form ofexchange rate arrangement. Usually, although not always, dual rates are accompa-nied by a variety of restrictions on capital movements. If there is (in principle) a dualmarket, but capital flows freely (as was the case in Belgium until 1990 and in the
TABLE 7.Regional Vulnerability to High Inflation and Currency Crashes, 1965-2001
Probability of Average duration Probability of Probability of anyhaving inflation of spells where a severe currency currency crashgreater than 40 inflation is crash in any in any 24-month
percent (percentage) above 40 24-month period periodRegion or group (1) percent (2) (percentage) (3) (percentage) (4)
North Africa 1 0 4 mos. 5 4 7 2Sub-Saharan Africa, CFA 2 1 9 mos 5 4 5.4Sub-Saharan Africa, non-CFA 17 8 6 yrs., 7 mos 32 4 48 6Asia 3 2 1 yr, 2 mos 12 4 23 8Europe and the Middle East 16 4 6 yrs, 1 mo 20 5 36 8Western Hemisphere 25 6 9 yrs, 6 mos 32 4 48.6
Sources Tables 1-4 and 13-18

FOREIGN DIRECT INVESTMENT TO AFRICA I 259
CFA zone until 1993), the free market premium tends to be trivial. However, whenthere are tight capital account restrictions, dual markets can really have teeth and thefree market premia can be astonishingly high. Under these conditions, and especial-ly if there are multiple exchange rates, monetary policy is at its most opaque. It is typ-ically also in this kind of arrangement that corruption can flourish with a vengeance.
Prevalence of Dual Exchange Rates
Reinhart and Rogoff's (2002) reclassification of historical exchange rate arrange-ments recognizes that the official exchange rate can be meaningless in this setting andthat dual or multiple exchange rate practices need to be treated as a separate catego-ry. To do so, we constructed detailed chronologies, such as the sample shown in table8 for Ghana. The episodes labeled "freely falling" are the instances when the 12-month inflation rate was above 40 percent-what we have called here "high-infla-tion" episodes.5 The chronology also notes when dual or multiple exchange rate prac-tices were in place.
The downside of this opaque type of arrangement has not been trivial for Africa.Easterly (2001) has stressed the negative contribution to growth of high parallel mar-ket premia. Reinhart and Rogoff (2002) also presented evidence that growth is lowerand inflation higher for dual or multiple exchange rate arrangements. But in Africadual or multiple exchange rate arrangements account for about 32 percent of allobservations (by country, by month) in the 1970-2001 period.
Parallel Premia, Distortions, and Corruption
Tables 17, 18, and 19 (in the appendix to this chapter) document the likelihood thatthe monthly parallel market premia exceed three high thresholds. Whereas a 50 per-cent premium would be considered already high, we also document the incidence ofthe probability (by country and region) that the premium exceeds 100 percent and500 percent. Figures 5 and 6 provide a cross-regional comparison. The main pointthat emerges from this exercise is that to the extent that the premium is a catch-allfor distortions, lack of transparency, and corruption, non-CFA Africa stands outfrom other regions in its the extremely elevated incidence of very high premia. Evenrelative to the chronic inflation crisis-prone Western Hemisphere, the comparison isstriking. The likelihood of premia above 50 percent is 35 percent and 23 percent forAfrica and the Western Hemisphere, respectively. Premia above the 100 percentthreshold prevailed in 25 percent of the months during 1970-98 in Africa-morethan twice that for the Western Hemisphere, and premia over 500 percent were pres-ent in 10 percent of those months.
An interesting exercise involves looking jointly at (a) the probability that the pre-mium is above 50 percent over the period 1970-98 for each of the countries in oursample, and (b) the corruption index published by Transparency International for2000, which assigns a value of 0 to the most corrupt countries and a value of 10 tothe most transparent. The simple pairwise correlation between the two is 0.55, which

260 I CARMEN M. REINHART AND KENNETH S ROGOFF
TABLE 8.Ghana: A Sample Chronology
ClassificationDate (primary/secondary/tertiary) Comments
1916-July 14,1958 Currency board/peg to pound sterling West African pound is introducedby the West Africa currency board
July 14, 1958-July 19, 1965 Peg to pound sterling/parallel market Ghana pound replaces the WestAfrican pound
July 19, 1965-Nov 4, 1971 Peg to pound sterling/parallel market The cedi replaced the Ghanapound. The new cedi wasintroduced in 1967
Nov 4, 1971-Sept 1973 Managed floating/parallel market The cedi is officially pegged to U Sdollar
Oct 1973-June 19, 1978 Freely falling/managed floating/ The cedi is officially pegged to U.Sparallel market dollar There are multiple exchange
rates
June 19, 1978-May 1984 Freely falling/managed floating/ The official peg to the U S dollar isparallel market abandoned There are multiple
exchange rates
June 1984-April 1986 Freely floating/parallel market There are multiple exchange rates
May 1986-Sept 19, 1986 Freely falling/freely floating/ There are multiple exchange ratesparallel market
Sept 19, 1986-Sept 1987 Freely falling/freely floating/dual There are multiple exchange ratesmarket
Oct 1987-July 1989 Freely floating/dual market There are multiple exchange rates
August 1989-April 27, 1990 Freely falling/managed floating/ There are multiple exchange ratesdual market
April 27, 1990-Sept 1990 Freely falling/managed floating There are multiple exchange rates
Oct 1990-February 1994 Managed floating There are multiple exchange ratesSince early 1993 the parallel marketpremium has been in single digits
March 1994-July 1996 Freely falling/managed floating
August 1996-Oct 1999 Managed floating
Nov. 1999-March 2001 Freely falling/managed floating
April 2001-December 2001 Managed floating
Notes Ghana was known formerly as Gold Coast Reference currencies are the U S dollar, the pound sterling, andthe South African rand
is statistically significant at standard confidence levels. Indeed, this simple exercisemay suggest that the ranking of countries by their transparency exhibits considerableinertia.6
What Does It All Mean for FDI?
We have suggested that the investment climate is adversely influenced by actualwars-or the odds of a war. Wars, in turn, apart from the destruction of life andinfrastructure, seem to bring additional deterrents to investment, such as frequentcurrency crashes and high inflation. Even when not accompanied by war, the

FOREIGN DIRECT INVESTMENT TO AFRICA I 261
FIGURE 5.Percentage of Months in Which the Parallel Market Premia Were Above 50 Percent,1979-98
40-
35-
30-
25-
20-
15
10
5
0North Non-CFA Asia Europe Middle WesternAfrica Africa East Hemisphere
Source IMF (various, annual), IMF, International Financial Statistics (various issues), World Currency Yearbook(various issues), authors' calculations
FIGURE 6.Percentage of Months in Which the Parallel Market Premia Were Above 500 Percent,1979-98
10,
9
8
7
6
0-
4
3
2
0North Non-CFA Asia Europe Middle WesternAfrica Africa East Hemisphere
Source IMF (various, annual), IMF, International Financial Statistics (various issues), World Currency Yearbook(vanous issues), authors' calculations

262 I CARMEN M REINHART AND KENNETH S ROGOFF
prospects of price and currency instability during peacetime are not conducive toFDI. Furthermore, high parallel market premia-which is a proxy for distortions,inconsistent policies, and corruption-affect investment adversely. Table 9 presents afamily of simple pairwise correlations to summarize these points, and tables 10 and11 present a synopsis of the literature on the empirical determinants of FDI. At firstglance, our findings seem to depart strikingly from those of Gastanaga and others(1998), who found no evidence that the parallel market premium influences FDI. Ofcourse, one interpretation of our contrasting results that merits further scrutiny isthat they have a separate variable controlling for corruption. As shown in table 9, thepremium is correlated with this type of index, which suggests that the results are notnecessarily inconsistent-all the more so if, as we contend, lack of transparencybreeds corruption.
Our emphasis, thus far, has been on the different ways monetary policy con-tributes to spur or deter investment. We have discussed one of the causes of inflationin Africa-namely, wars and civil conflict-but there are other causes for high andchronic inflation in the region that merit discussion. The next section focuses on theissue of fiscal dominance, which seems to be a promising explanation of why infla-tion has been difficult to tame in many of the countries in the region.
Fiscal Dominance and Inflation
In most of the world, and throughout most of history, episodes of very high infla-tion have almost invariably arisen out of situations of broader macroeconomic andpolitical instability. Governments desperate to finance large fiscal deficits will turnto the printing presses to finance expenditures. Large and uncontrolled fiscal deficitsoccur for many reasons but political instability of some form is surely the leadingcause. Inflation taxation is nothing new; even in Roman times it was a standardtechnique to shave precious metal coins and recycle them in smaller form. Govern-ments would also debase the currency by diluting the precious metal content ofcoins and by changing their metal content altogether. The advent of the modernprinting press, for better or for worse, only served to vastly improve the technologyfor generating inflation.
TABLE 9.FDI to Africa: Selected Correlations
FDI and conflict -0.31
FDI and inflation: CFA countries -0 23*
FDI and inflation: non-CFA countries -0 17**
FDI and the probability that the parallel market premia are above 50 percent -0 36*
Memorandum item-
Parallel market premia and corruption index -0 54*
Notes An asterisk (*) denotes significance at the 5 percent level, a double astensk (**) indicates significance at the 10percent level

FOREIGN DIRECT INVESTMENT TO AFRICA I 263
When the government is starved for resources and lacks sufficient taxation alter-natives, it is obvious that the need to finance fiscal deficits leads to monetary expan-sion and inflation. An absolutely critical question, however, in assessing a monetaryregime is under what conditions monetary expansion and inflation policy can beseparated from fiscal policy? Again, it is useful to frame the debate in the context ofmodern monetary policy among industrial countries. In academic circles there iscurrently a significant debate over whether "fiscal dominance" may be the rulerather than the exception, even in low-inflation industrial countries. The subtle dif-ference from the canonical case of a poor high-inflation country, however, is thatinflation is leveraged on a much higher base of nominal debt, including not onlycurrency but nominal government debt. Sargent and Wallace (1981), in their classicarticle, "Some Unpleasant Monetarist Arithmetic," first stressed how, even in coun-tries with apparently strong monetary institutions, rising and uncontrolled govern-ment budget deficits can arguably feed quickly into inflation if agents expect thatmonetary independence someday will snap under the burden of rising governmentdebt. In theory, expectations of future money growth can be so large as to lead tohigh inflation immediately, overwhelming the efforts of the central bank to attainmonetary tightness.
Recently, the Sargent-Wallace argument has been sharpened into the "fiscal theo-ry of the price level" (Leeper 1991; Sims 1994; and Woodford 1995). The basicargument is that one can always write the government's intertemporal budget con-straint as
(1) (Nominal government debt)/Price level =
Present value of real government taxes (including the inflation tax) -Present value of real government expenditures
Equation (1) simply states that the present value of the government's future sur-pluses, including the inflation tax, must equal the real value of its debt (nominal debtover the price level.) For simplicity, we have looked at a certainty equivalent formu-lation. In reality, of course, the right-hand side of equation (1) would correspond toa function of the expected value of future government surpluses, which are uncertain.Equation (1) has to hold if the government is solvent. If the real value of expectedfuture surpluses were less than the real value of the debt, the market value of the debtwould have to drop immediately, which could be effected by an increase in the pricelevel. (Things are a bit trickier in a sticky-price world where bonds would temporar-ily sell at discount, but in the long run prices would adjust and the story is the same.)If people expected that the government would never run surpluses, they would nevervoluntarily hold government debt except for money needed to finance transactions.Of course, in many developing countries domestic banks are sometimes forced tohold government debt, but in terms of equation (1), forced holding of such debtshould be thought of as a way of expanding the taxes that enter on the left-hand side.
Equation (1), of course, is nothing new-it is simply a budget constraint that haslong been well understood. However, in the traditional literature on industrial coun-tries, it was typically assumed that the path of the price level could be determined bymonetary policy, via a traditional relationship where

TABLE 10.Determinants of FDI: A Review of the Literature
VariablesStudy Sample Endogenous variable Explanatory variable Main results ,:Schneider and 54 developing FDI Economic determinants real per capita Two models were estimated One included bothFrey (1985) countries for three . GNP, GNP growth, inflation, balance economic and political determinants of FDI and the
mdifferent years of payments deficit, secondary education other included only economic determinants The z(1976, 1979, and enrollment, and bilateral aid from former model gave better results and the best1980) Western countries Political determinants forecasting errors
political instability and a dummy for mleft-wing regime. z
Edwards (1991) 58 developing Average ratio of OECD Real per capita income, size of Variables were averages for the period covered >countries covering FDI flows to country i government, openness, real exchange All variables were significant and with the expectedthe period 1971-81; to total OECD FDI flows rate, real GDP, domestic investment ratio, sign except per capita income, which was insignificant >annual data to LDCs and FDI to GDP structure of the economy, regional Both economic and political variables were important z
dummies, and political variables in determining the magnitude and the distribution(stability and polarization) of FDI, but political variables were not as crucial as the m
zeconomic ones zmSingh and Jun 31 developing FDI Sociopolitical instability, business Not all the control variables were found to be nn
(1995) countries for the operating conditions, international trade significant Sociopolitical instability, business operatingperiod 1970-93; variables, and other control variable conditions, and international trade variables wereannual data found to be important factors in driving flows,
0especially to high FDI countries ,:Gastanaga, 49 developing Gross FDI flows Lagged and future real GDP growth, BMP was found to have little effect on FDI. -nNugent and countries for the to GDP BMP, degree of openness to capital Economic growth had significant effect on FDI -nPashamova period 1970-95, flows and FDI, lagged dependent Corruption and corporate tax had negative and(1998) annual data variable, and other variables capturing significant effect on FDI The effect of tariff varied with
country reforms and the degree of the model specificationcorruption
Fernandez-Arias All countries where Total commercial flows Variables capturing institutional In general, capital flows were drawn to countries withand Haumann data were available to GDP, FDI to infrastructure, polttical stability, sound financial markets, capable institutions, and a(2000) for the period 1996-98, commercial flows, and and economic policies together stable political environment The high share of FDI as a
simple average was FDI to GDP with three control variables- income, percentage of capital flows was not necessary for andused size, and openness indicative of "good health." Higher share of FDI was
associated with riskier and financially underdevelopedcountries with weaker institutional structures

Wei (2001) 59 to 93 borrowing Bilateral FDI compiled For FDI regressions corruption, tax Mainly two exercises the first tested the effect ofcountries, depending by OECD, bank lending, rate, FDI incentives, FDI corruption on FDI and the second tested the effecton the endogenous log ratio of loans to FDI, restrictions, log GDP, log per of corruption on the composition of capital flowsvariable for the period log ratio of portfolio capita GDP, log distance, linguistic Fixed-effects and random-effects specifications were1994-96, simple investment to FDI, and tie, and exchange rate volatility used In case of the first exercise, the majority ofaverage was used FDI to total inflows For regressions involving portfolio variables were statistically significant and with the
investment and loans same expected signs Corruption had a very significantvariables but substituting a variable negative effect on FDI The second exerctse revealedcapturing the case in investing in that the higher the corruption, the more thesecurities and bond market instead composition of capital flows tilted toward bank loansof FDI restrictions and incentives and portfolio flows and less toward FDI Results werevariables and dropping the tax variable found to be robust tothe change in the sample period
to 1997-98
Wheeler and U S investment Actual and planned Foreign investment is regressed against The classical variables (labor cost and market size)Mody (1992) abroad by country expenditure abroad by labor cost, corporate taxation and were statistically significant as were the three n
U S companies agglomeration benefit indexes, such as agglomeration indexes The results for the other 0infrastructure quality, the level of FDI, and indexes were much more sensitive to the mdegree of industrialization, various specification chosen C)measures of risk and openness were Zalso used 0
BMP black market exchange rate premium, GNP gross national product, LDC developing country, OECD Organisation for Economic Co-operation and Development m
Sources Excerpts from Kamaly 2001 and the authorszm
mz
0
n
0'

TABLE 1 1. °^Determinants of FDI: Regional Studies °
VariablesStudy Sample Endogenous variable Explanatory variable Main resultsSchneider and 54 developing countries FDI Economic determinants real per capita Two models were estimated One includedFrey (1985) for three different years GNP, GNP growth, inflation, balance both economic and political determinants of m(1976, 1979, and 1980) of payments deficit, secondary education FDI and the other included only economic z
enrollment, and bilateral aid from Western determinants The former model gave bettercountries Political determinants political results and the best forecasting errorsinstability and a dummy for left-wing regime m
Torrisi (1985) Colombia for the period FDI and total U S FDI Real GDP, growth rate of GDP, lag trade GDP coefficient was found to be significant z1958-80; annual data balance, and a dummy capturing the together with trade balance but the latter took a >
establishment of a trade bloc negative sign. -Bathattachrya, 15 Sub-Saharan African Private flows, FDI, and Lag growth rate of GDP, lag gross fixed Panel analysis was used For private flows all >zMontiel, and countries for the period private loans--all as a capital formation to GDP, lag exports variables were significant with expected signsSharma (1997) 1980-95, annual data percentage of GDP plus imports to GDP, lag total external except real exchange rate variability For FDI, key
mdebt to GDP, coefficient of variation of variables were GDP growth, openness, and zmonthly real effective exchange rate index, variability of exchange rate For private loans, key Z
mlagged endogenous variable, and U S factors were domestic investment and external debt -
three-year government bond yield ratios U S interest was found not to be significantin any of the regressions IA
Claessens, 21 countries belong to Total flows, official flows, Six-month LIBOR and economic growth Panel analysis was used (fixed effects and common 0Djankov, and Central and Eastern all private flows, FDI, in OECD, GDP growth, inflation, fiscal intercept) Generally, movements in flows were GKlingebiel Europe and the former commercial debt flows, balance, private savings, lag change influenced more by fundamentals than by GF EU -on(2000) Soviet Union for the portfolio flows, and in reserves, dummy for countries likely to dummy was found to be significant in driving total -n
period 1992-96, annual short-term flows become EU members, nominal interest flows and FDI The interest rate variable was notdata rate minus rate of change of nominal significant in any of the seven definitions of
exchange rate, and domestic credit flows Reforms appeared to be the most importantgrowth force in driving flows
EU European Union, LIBOR London interbank offered rate.Source Excerpts from Kamaly 2001

FOREIGN DIRECT INVESTMENT TO AFRICA I 267
(2) Supply of real balances = Nominal money/Price level=Demand for real money balances
Given the price level and the future path of monetary policy (implied by the mon-etary authorities' prospective as well as current policies), the price level in equation(1) is given. Because today's value of nominal government debt is given by history,the implication is that to ensure that equation (1) holds, fiscal policy must adjust, ifnot today then in the future. Thus, the implicit assumption is that the monetaryauthorities never have to capitulate to the fiscal authorities, so that monetary policyis "dominant" in the determination of the price level.
The fiscal theory of the price level challenges this assumption that monetary poli-cy is dominant. Instead, advocates of the fiscal theory of the price level argue that,even in industrial countries, fiscal policy is dominant and it is monetary policy thatmust adjust. More precisely, monetary policy can adopt an interest rate policy, andthe path of prices will adjust. In a flexible price world, the initial price level musttherefore adjust to ensure that intertemporal budget balance is attained in a mannerconsistent with the path of primary surpluses (which is exogenous) and the path ofinterest rates (which is exogenous).
There is considerable debate in the academic literature over whether the fiscal the-ory of the price level really applies, or whether the traditional view that monetary pol-icy is dominant in setting the price level is the correct one. Very recent work has start-ed to focus on whether there is some threshold level debt and fiscal position that willtilt the balance from monetary to fiscal dominance. For the low-inflation industrial
FIGURE 7.Inflation and High Parallel Market Premia, Africa, 1979-1998
80
70 Uganda
60
' 50
o 40
c 30
20 .
10' 10 I* Mauritania
0 10 20 30 40 50 60 70 80Percentage of months premium is above 50 percent
Sources IMF (various, annual), IMF, International Financial Statistics (various issues), World Currency Yearbook(various issues), authors' calculations

268 I CARMEN M. REINHART AND KENNETH S ROGOFF
countries, the evidence appears to suggest that the traditional monetary dominanceparadigm is still the correct one. Canzoneri, Cumby, and Diba (2001), for example,showed empirically that a rise in (that is, an innovation in) the government surplustypically causes a rise in future surpluses and a fall in future government liabilities. Thetraditional monetary dominant regime offers a simple explanation-namely, thatshocks that lead to surpluses tend to be positively correlated over time. Thus, a rise inthe path of surpluses allows the government to pay down part of the government debtleading to a fall in future liabilities. The fiscal theory of the price level can explainthese results also, but the explanation is rather contorted. The rise in surplus todaymust eventually become negatively correlated with future surpluses, and this negativecorrelation must be great enough to make the present value of the future surpluses fall(rather than rise), thus leading to a fall in the value of liabilities. (Part of what makesthe fiscal theory of the price level so popular among young researchers is precisely thefact that it gives such counterintuitive results.) For industrial countries there also areother reasons to be skeptical about the fiscal theory of the price level. For example, itcan be shown that as long as the path of government real deficits has some self-cor-recting mechanism, so that deficits decline as debt grows, monetary policy dominancemust prevail. For example, the budget and deficit conditions of the Maastricht Treatyturn out to be sufficient to ensure monetary dominance-indeed, they are muchstronger than is necessary. Also, it turns out that in, say, a two-country world, it is notlogically possible to have the fiscal theory of the price level hold in both countries,provided they have open trade and capital markets (Loyo 1997).
Although the fiscal theory of the price level may not be empirically relevant forindustrial countries outside extreme circumstances, it may be more relevant for emerg-ing-market and developing countries. In particular, the conditions on self-correctingbudget deficits needed to ensure monetary dominance may not always hold, so fiscalnomination of the price level becomes theoretically feasible. This is almost certainlythe case in very high inflation countries where monetary institutions have little mean-ingful independence from the central government. Unfortunately, we do not have firmevidence yet on the factors that determine when fiscal dominance occurs, although thefactors almost surely include high debt levels. For example, government debt/grossdomestic product (GDP) levels above 200 percent are almost never observed (exceptin cases of concessional lending), presumably because fiscal dominance comes intoplay and the real debt level is restrained by inflation and by inflation expectations.Debt levels below 50 percent of GDP, however, may still be a problem in countries thathave very weak tax systems. In table 12 we present some suggestive evidence on thepossible link between debt levels and inflation for African countries during variousperiods. The simple correlations between overall government debt-to-GDP or debt-to-exports mostly go in the right direction. For the CFA franc zone group, these are strik-ingly high and always statistically significant, irrespective of what sample period orwhat measure of indebtedness is used. For the non-CFA franc African countries, theresults are somewhat more sensitive to the sample and debt measure that is used.There is a strongly significant correlation between debt-to-exports and inflation in theearlier part of the sample that breaks down in the 1990s-at the same time that the

FOREIGN DIRECT INVESTMENT TO AFRICA I 269
correlation between debt-to-GDP and inflation is increasing and becoming significantin the more recent period. Figures 8 and 9 show the scatter plots of the underlying datafor CFA and non-CFA countries, respectively.
Concluding Remarks
We have presented evidence that major events such as wars and civil unrest occurmore frequently in Africa than in other regions. We think that the probability of suchadverse outcomes has a critical influence on the investment climate. Such disastrousevents often bring other evils with them, including high inflation and a higher levelof other distortions, such as capital controls, that help parallel and illegal currencymarkets thrive. Although bouts of high inflation and all-too-frequent currency crash-es are not unique to Africa (witness the Western Hemisphere's track record in thisregard), the level of opaqueness and distortions, as revealed by the persistent preva-lence of extremely high parallel market premia, is a more unique (non-CFA) Africanphenomenon. In this regard we believe there are tremendous benefits to be reaped byadopting unified exchange rate regimes broadly throughout the region.
These challenges indeed are difficult to overcome, but not insurmountable. Notmany years ago, Uganda suffered from all of the ills discussed in this paper: war, highinflation, frequent collapses in its currency, and dual markets with a parallel market
TABLE 12.Inflation and Debt: Is There a Link? 1970-2001
Correlation of annual inflation and debt/GDP ratio
Period North Africa and CFA franc zone Non-CFA franc zoneSub-Saharan Africa countries countries
1970-2001 0 308* 0 950* 0 186
1990-2001 0 196* 0 898* 0 209*
1970-79, 1980-89,1990-2001 0.182* 0669* 0202*
1980-89, 1990-2001 0 192* 0 803* 0 216*
Correlation of annual inflation and debt/exports ratio
1970-2001 0548* 0961* 0518*
1980-89 0414* 0964* 0.311*
1990-2001 0 091 0.969* 0 096
1970-79, 1980-89,1990-2001 averages 0 115 0 860* 0.137
1980-89, 1990-2001 averages 0 100 0.931* 0 115
Note An asterisk (*) denotes significance at the 5 percent levelSource IMF 2002

270 I CARMEN M REINHART AND KENNETH S. ROGOFF
FIGURE 8.Ratio of Debt to GDP and Rate of Inflation, CFA Franc Zone, 1970-2001
300Guinea-Bissau
250
200a-
3 150t0
100
50*+
0 5 10 15 20 25 30 35 40Inflation rate
Source IMF 2002
FIGURE 8.Ratio of Debt to GDP and Rate of Inflation, Sub-Saharan Africa, 1970-2001
400
350 - Sao Tome and Principe
300
250 -0-3 200
0150 *
100 100 - t *+ - * Uganda
0 5 10 15 20 25 30 35 40Inflation rate
Note Scatter plot excludes the Democratic Republic of CongoSource IMF 2002

FOREIGN DIRECT INVESTMENT TO AFRICA I 271
premium that hit 567 percent in 1988. The end of the war was, of course, the mostcritical change. But macroeconomic stabilization has brought inflation down to lessthan 5 percent, growth has sharply rebounded, and FDI has risen from zero to morethan 4 percent of GDP. With stabilization came the end of dual markets and increas-ing transparency-at the time of this writing the Ugandan shilling is one of the moreconvertible currencies in Sub-Saharan Africa. Nor is the strong performance byUganda unique in the region. As discussed in the most recent World Economic Out-look, countries like Benin, Botswana, Burkina Faso, Cameroon, Mali, Mauritius,Mozambique, Senegal, and Tanzania have been consistently strong performers inrecent years, both in terms of their macroeconomic policies and their growth per-formance. Although some of those countries have experienced an increase in FDI inrecent years, unfortunately not all of them have-which highlights how much per-sistence and consistency it takes to build an attractive investment climate. Neverthe-less, a unified exchange rate regime (or at least a very low parallel premium) is a keyelement in a transparent macroeconomic framework and would help produce manybeneficial side effects in terms of improving governance and reducing corruption.
Appendix: The Costs of Inflation
Is inflation by itself such a problem? The answer is almost surely yes, but economists'theoretical and empirical evidence on the question is remarkably thin. Because highinflation so seldom occurs in isolation from other macroeconomic problems, time-series or cross-country regressions that show a cost of inflation on growth or outputare not always convincing because it is difficult to hold everything else constant. Forinflation rates over 40 percent per annum there does seem to be evidence that growthis retarded (see Easterly 2001 and Reinhart and Rogoff 2002). For lower inflationrates (below 40 percent) the evidence is more limited. This is not to say that a coun-try that has an inflation rate of 10 percent is not clearly better off than a country withan inflation rate of 20 percent, and that a country with an inflation rate of 2 percentis not better off than one with 10 percent. The general reduction in inflation ratesthat has taken place in much of the world over the last 10 to 20 years has almostsurely been a factor in raising global growth and increasing macroeconomic stabili-ty. Recall again figure 2 of the text, which gives annual growth rates both for theworld (using purchasing power parity weights) and for the G7 countries. Visually, thedecease in volatility of output growth since the mid-1980s is striking. Not all coun-tries have enjoyed the same improvement in macroeconomic stability over this peri-od. The United States has enjoyed a particularly large drop in output volatility sincethe mid-1980s (see Stock and Watson 2002), whereas output volatility for the Fed-eral Republic of Germany appears to have remained roughly constant (reflecting nodoubt German unification in 1989) and output volatility for Japan has actuallyincreased (an outgrowth of the bursting of the asset price bubble in the early 1990sand a reduction in trend productivity growth). But for most countries increasingmonetary stability has been accompanied by increased output stability. The causal

272 I CARMEN M REINHART AND KENNETH S ROGOFF
TABLE 13.Currency Crashes: North Africa and CFA Franc Zone Countries, 1965-2001
Total number ofDates of severe Number of crashes, including
Country currency crashes severe crashes severe crashesNorth Africa
Algeria 1991 1, 1991 9, 19944 3 4Morocco - 0 0
Tunisia 0 0Average for the region - 1 133
Sub-Saharan Africa CFA
Benin 1994 1 1 1
Burkina Faso 1994 1 1 1
Cameroon 1994 1 1 1
Central African Republic 1994.1 1 1Chad 1994 1 1 1
Congo, Rep of 1994 1 1 1
C6te d'lvoire 1994 1 1 1
Equatorial Guinea
Gabon
Guinea-Bissau 19941 1 1
Mali 19941 1 1
Niger 19941 1 1
Senegal 1994 1 1 1
Togo 1994 1 1 1Average for the region - 1 1
- Not applicableNotes Two definitions of currency crashes are used A severe currency crash refers to a 25 percent or higher month-ly depreciation that is at least 10 percent higher than the previous month's depreciation The "milder" version repre-sents a 12 5 percent monthly depreciation that is at least 10 percent above the preceding month's depreciation Toput this in perspective, the monthly depreciations annualized are 1,355 percent and 310 percent, respectively
evidence presented in figure 2 may or may not stand up to careful statistical testing(that is not our purpose here). But it is evidence of a broad trend that has helped per-suade many people that increasing monetary stability does pay off, even at lower lev-els of inflation.
At a theoretical level, it has taken even longer to assess why inflation matters,especially if it is stable and anticipated. Fischer and Modigliani's (1978) work was anearly attempt to catalog all of the various theoretical costs of inflation. Their basicconclusion was that the main costs of stable and perfectly anticipated inflation arethe "shoe-leather costs," that is, the costs to people of having to economize on theirholdings of (real) currency balances in order to minimize their share of the inflationtax. The costs of unanticipated inflation are much greater, particularly in a world ofimperfect information and imperfect indexing. Keynes (1936), of course, argued thatin the real world, indexing of wages and prices to inflation is very limited (at low tomoderate levels of inflation), so that monetary volatility translates directly into vari-ability in output and employment. Though economists have made little progress in

FOREIGN DIRECT INVESTMENT TO AFRICA I 273
understanding exactly why nominal rigidities are so important, Keynes' basic insightis very much alive today. There is a broader question of why, even in today's hyper-sophisticated (indeed hyperactive) financial markets, there is not greater capacity toindex to inflation. Absent such indexation, and given long-term nominal contracts,then uncertain inflation is quite harmful to economic activity, making investmentplanning difficult and making it difficult to continuously maintain full employment(or whatever the modern search-theory equivalent of full employment is). The gov-ernment is possibly the greatest source of nominal rigidities in the economy. Tax sys-tems, especially, have important non-neutralities. Some are well known; for example,if tax rates are increasing in income, then inflation will raise average tax levels. If ittakes significant amounts of time to collect taxes, then rises in the rate of inflationcan lower effective real tax rates if agents are able to pay the government with a lagin depreciated currency. Many governments tax nominal rather than real interestreceipts.
All of these are fairly primitive failures of indexation. Feldstein (1998) has empha-sized that the effective rate of capital taxation-which is enormously complicated tocalculate in practice-can be very sensitive to inflation rates even at low levels. Forexample, even starting from an inflation rate as low as 2 percent, a 1 percent reduc-tion in inflation might raise the capital stock as much as 3 percent, according to Feld-stein's calculations. In principle this problem could be solved via adequate indexationof the corporate income tax. In practice the accounting issues are so complicated thatit is much easier to deal with the problem by simply having a lower rate of inflation.That last example is particularly interesting because it highlights how, in the complexmodern world, the distinction between high inflation and variable inflation is not assharp as one might think. When one looks at corporate accounting and taxation, onesees that inflation can lead to problems, even if when it changes only very slowly,because it is so costly to adapt capital taxation and depreciation rules adequately tocompensate.
The more important distinction, for our purposes here, is between the effects ofinflation in isolation from other forms of macroeconomic instability (for example, ifa modern industrial-country central bank mistakenly and temporarily adapts an inef-ficient control technique) and the costs of inflation instability in a country where thegovernment has a short time horizon and where inflation is accompanied by numer-ous other macroeconomic problems. The latter is almost surely the typical case inmost countries where inflation is over 40 percent.

TABLE 14.Currency Crashes: Sub-Saharan Africa and Non-CFA Franc Zone Countries, 1965-2001
Total number ofNumber of crashes, including >
Country Dates of severe currency crashes severe crashes severe crashes KmAngola 1991 3, 1991.11, 1991 12, 1992-4, 1993 1, 1993 3, 1993 10, 1994 2, 22 25 z
1994 6, 1994.10, 1995.4, 1995-5, 1995 8, 1995 9, 1996 2, 1996 3,1996 5, 1997:7, 1999 5, 1999 7, 1999 9, 2000 5 MmBotswana - 0 4z
IBurundi 1983 11 1 7 DCongo, Dem 1967 6, 1976 3, 1978 11, 1979.1, 1979 7, 1980.2, 1981 6, 1983 9, 37 44 qRep of 1990 11, 1991 2, 1991 7, 1991 8, 1991 10, 1991 11, 1992 1, 19923, >
1992 5, 1992 6, 1992 9,1992 10,1993 1, 1993 6, 1993 8, 1993 11, 01993 12, 1994 2, 1994 7, 1995 8,1995 9, 1995 11, 1996 1, 1997 5, m
z1998 10,1999 4,20001, 2000 6,2000 10 ZzEthiopia 1992.10 1 1 mGambia, The 1986-1 1 4Ghana 1967-7, 1971.12, 19722, 19788, 8 10
1983 10, 1984 11, 1986 1, 1987 2 0Guinea 1986 1, 1986 12,1987 1 3 4 °Kenya - 0 5Lesotho 1985 8 1 6Liberia 1998 1 1 2Madagascar 1987 6, 1994 5 2 5Malawi 1987 2, 1994 2, 1994 10, 1998 8 4 13Mauritania 1992 10 1 2Mauritius 1979 10 1 3Mozambique 1981 1, 1987-7, 1988 7, 1991 4 4 6Nigeria 1986 10, 1989 1,1992 3, 1999.1 4 7

Rwanda 1966 4, 1990 11, 1994 3, 1994 8, 1995 3 5 7
Somalia 1982:7, 1984 9, 1985 1, 1986 1, 1987 6, 1987 9, 1988 6, 1989 5, 1989 12 9 11
South Africa 1985 8 1 6Sudan 19799, 1981 11, 1982.11 19852, 1987 10,1991 10, 19922, 19931, 12 13
19947, 19959, 199512, 1996.1
Swaziland - 0 6Tanzania 1983.6, 1984 6, 1986.6 3 6Uganda 1981 6, 1985 11, 1987 5, 1988.7, 1989 10 5 12Zambia 19767, 19831, 198510, 198610,19872, 19874, 19897, 19922, 199212, 19931, 14 22
1994 1, 1994 3, 1994 10, 1994 11
Zimbabwe 19919, 1997 12, 20008 3 6Average for the region - 6 9 On
0Average for the region, 4 7 mexcluding hyperinflation t^countries (that is, Angola Zand Congo, Dem Rep of)
-Not applicable nNotes Two definitions of currency crashes are used A severe currency crash refers to a 25 percent or htgher monthly depreciation that is at least 10 percent higher than the previousmonth's depreciation The "milder" version represents a 12 5 percent monthly depreciation that is at least 10 percent above the preceding month's depreciation To put this in perspec- ztive, the monthly depreciations annualized are 1, 355 percent and 310 percent, respectively m
-t
m
mz
0
-n
N)
>J

276 I CARMEN M REINHART AND KENNETH S ROGOFF
TABLE 15.Currency Crashes: Asia, Europe, and the Middle East, 1965-2001
Total number ofDates of severe Number of crashes, including
Economy currency crashes severe crashes severe crashesAsiaChina, Hong Kong 0 0
China, mainland 1989 12, 1994 1 2 3India 1966 6 1 3
Indonesia 1967 11, 1978.11, 19834, 8 121986 9, 1997 12, 1998 1,1998 5, 1998 10
Korea 1998 12 1 5
Lao People's Dem Rep 1972.4, 1975 3, 1976 6, 1978 5, 11 151979.12, 1981 6, 1985 10, 1987 9,199712, 19986, 19999
Malaysia - 0 0
Myanmar 1975 1 1 2
Nepal 1967 12 1 5
Pakistan 1972 5 1 2
Philippines 1970 2, 1983 10, 1984 6 3 5
Singapore - 0 0
Sri Lanka 1977 11, 1998 5, 1998 7 3 6
Thailand 0 3Average for the region - 2 3 4 4
Europe and Middle East
Egypt, Arab Rep of 1979:1, 1989 8, 1990 7, 1991 3 4 4
Iceland 1967 11, 1968 11, 1975 2, 1983 5 4 13
Iran, Islamic Rep of 1993 3, 2000 12 2 2Iraq - 0 0
Israel 1974 11, 1977 11, 1983 10 3 5Jordan _ 0 1
Lebanon 1985 1, 1986 1, 1986 5, 1986 11, 13 191987.3, 1987 7, 1987 8, 1987 10,1990.8, 1990'8, 1990 10, 1991 1,1992 7
Poland 1980 12, 1981 12, 1989 8,19899,198911,198912 6 15
Romania 1984 11, 19902,1990 11, 1991 4, 7 131991 11, 19926, 1997 1
Saudi Arabia 0 0
Syrian Arab Rep 1988 1 1 1
Turkey 1970 8, 1978 3, 1979 6,1980 1, 1994 4, 2001 2 6 9
Average for the region 3 8 6 8- Not applicableNotes Two definitions of currency crashes are used A severe currency crash refers to a 25 percent or higher month-ly depreciation that is at least 10 percent higher than the previous month's depreciation The "milder" version repre-sents a 12 5 percent monthly depreciation that is at least 10 percent above the preceding month's depreciation Toput this in perspective, the monthly depreciations annualized are 1, 355 percent and 310 percent, respectively

FOREIGN DIRECT INVESTMENT TO AFRICA I 277
TABLE 16.Currency Crashes: Western Hemisphere, 1965-2001
Total number ofDates of severe Number of crashes, including
Country currency crashes severe crashes severe crashesArgentina 1967 3, 1975 3, 1975 6 16 23
1975 11, 1976 3, 1976 11,1981.4, 1981 6, 1982 1, 1982 7,1987 10, 1989 4, 1989 7 1989 12,1990 2, 1991.1
Brazil 1979 12, 1983 2, 1987 5, 1989 6, 9 1519897, 1989 12, 19902, 1991 10,1999.1
Bolivia 197210,19822,198211,198311, 11 1219844, 19848, 1984 11, 19852,1985 5, 1985 9, 1985 11
Chile 1967 1, 1971 7, 1972 9, 1973 5, 1973 9 127, 1973 10, 1974 12, 1975 3, 1985 7
Colombia 1965 9 1 1Costa Rica 1974.4, 1981 1, 1981 10 3 4Dominican Republic 1985 1, 1990.8 2 4Ecuador 1970 8, 1982 5, 1983 3, 1985 12, 8 12
1986 8, 1988 8, 1999 2, 1999 10El Salvador 1986 1, 1990 5 2 2Guatemala 1986 6, 1990 8 2 3Guyana 1987 1, 1989 4, 1990 6, 1991 2,1999 3 5 9Haiti 1991 9, 2000 9 2 3Honduras 1990 3, 1990 4 2 2Jamaica 1978 5, 1983 11, 1991 9 3 10Mexico 1976 9, 1982 2, 1982 12, 1987 12, 5 7
1994 12Nicaragua 1979 4, 1985 2, 1986 1, 1988 2, 15 16
1988 6, 1988 8, 1988 10, 1988.11,19891, 1989 6, 1990 4, 1990 5,1990 8, 1990 12,1991 3
Panama - 0 0Paraguay 19843, 19846, 1985.3, 1986.12, 5 5
1989 3Peru 1967 9, 19766, 1977.10, 1987 10,
1987 12, 1988 9, 198811,19891,19903, 19908 10 15
Suriname 1994 7, 1994 10, 1999 1, 2000 10 4 6Uruguay 1965 3, 1965 10, 1967 11, 1968 4, 7 9
1972 3, 1982 11, 1982 12Venezuela 1984 2, 1986 12, 1989.3, 1994 5, 6 6
1995 12, 1996 4Average for the region - 6 9Average for the region, - 5 7excluding hyperinfla-tion countries (that is,Argentina, Brazil, andNicaragua)- Not applicableNotes Two definitions of currency crashes are used A severe currency crash refers to a 25 percent or higher month-ly depreciation that is at least 10 percent higher than the previous month's depreciation The "milder" version repre-sents a 12 5 percent monthly depreciation that is at least 10 percent above the preceding month's depreciation Toput this in perspective, the monthly depreciations annualized are 1, 355 percent and 310 percent, respectively

278 I CARMEN M. REINHART AND KENNETH S ROGOFF
TABLE 17.Incidence of High Parallel Market Premia: North Africa, CFA Countries, and Non-CFACountries, 1970-98
Probability that the parallel market premia exceeds
Country/Group 50 percent 100 percent 500 percentNorth Africa
Algeria 92 2 73 8 0Morocco 0 0 0
Tunisia 0 0 0
Average for the region 31.0 24 6 0
Sub-Saharan Africa CFA 0 0 0Sub-Saharan Africa Non-CFA
Botswana 0 0 0
Burundi 17 3 0 0
Congo, Dem Rep of - - -
Gambia, The 0 0 0
Ghana 46 6 36 1 17 0
Guinea 522 419 114Kenya 4 6 12 0
Lesotho 0 0 0
Liberia 89 1 89 1 29 7
Madagascar 1 2 0 0
Malawi 33 5 5 0
Mauritania 61 2 45 2 0
Mauritius 0 0 0Nigeria 683 34 3 0
South Africa 0 9 0 0
Swaziland 0 0 0
Tanzania 66 9 46 3 1 2
Uganda 61 3 50 4 23 5
Zambia 57 5 28 4 4 7
Zimbabwe 28 8 17 0 . 3 2
Average for the region 35 4 24 8 9.5Sources Reinhart and Rogoff 2002 and onginal sources cited therein

FOREIGN DIRECT INVESTMENT TO AFRICA I 279
TABLE 18.Incidence of High Parallel Market Premia: Asia, Europe, and the Middle East,1970-98
Probability that the parallel market premia exceeds
Economy 50 percent 100 percent 500 percent
China, Hong Kong 0 0 0China, mainland 21 9 11.2 0
India 8 6 0 0
Indonesia 0 0 0
Korea 0 0 0
Lao People's Dem. Rep. 42.1 35 2 15.9Malaysia 0 0 0
Myanmar 100 100 36 5
Nepal 14 4 0 0
Pakistan 8 9 8 1 0Philippines 0 9 0 0
Singapore 0 0 0Sri Lanka 271 12 7 0
Thailand 0 0 0
Average for the region 17 2 12 9 4 0
Europe and Middle EastBelgium 0 0 0Iceland 8 6 0 9 0
Israel 4.9 0 0Turkey 3 7 0 0Average for the region 8 2 0 2 0
Middle EastEgypt, Arab Rep of 59 4 31 7 0Iran, Islamic Rep of 65 1 59.4 29 7Jordan 0 0 0
Lebanon 0.9 03 0Saudi Arabia 0 0 0Syrian Arab Rep 58 1 50 7 5 3
Average for the region 26 2 20 3 5.0Sources Reinhart and Rogoff 2002 and original sources cited therein

280 I CARMEN M REINHART AND KENNETH S ROGOFF
TABLE 19.Incidence of High Parallel Market Premium, Western Hemisphere 1970-1998
Probability that the parallel market premia exceeds
Country 50 percent 100 percent 500 percent
Argentina 32 3 15 6 0Brazil 16 7 4.3 0Bolivia 20 5 10 7 2 0
Chile 18 2 14 4 5 8
Colombia 0 3 0 3 0
Costa Rica 8 9 0 3 0
Dominican Republic 13 3 4 0 0
Ecuador 17 0 3 7 0
El Salvador 36 3 16 1 0
Guatemala 13 8 9 6 0
Guyana 43 7 36 5 12 6Haiti 74 9 37 7 0
Honduras 29 3 2.4 0
Jamaica 16 7 5 4 - 0
Mexico 3 5 0 3 0Nicaragua 39 8 31 4 182
Panama 0 0 0
Paraguay 23 6 15 6 0
Peru 32 9 7 8 1 2
Suriname 44 7 39 4 27 4
Uruguay 6 9 2 3 0
Venezuela 22 2 15 3 0
Average for the region 23 4 12 4 30Sources Reinhart and Rogoff 2002 and onginal sources cited therein
Notes
1. See Kamaly (2001) for an interesting new study and for a comprehensive survey of theempirical literature on the determinants of FDI.
2. Indeed, as can be documented from the worldwide historical exchange rate chronologiesin Reinhart and Rogoff (2002), the Democratic Republic of the Congo has experiencedtwo hyperinflations since World War II. To date, no other country has had more than one.
3. For an excellent review of the experiences with high inflation, see Vegh (1992) and Fisch-er, Sahay, and Vegh (2001).
4. The one-time 100 percent devaluation for the franc zone countries on January 1994 is awell-known rare event that merits relatively little discussion in the context of exchange rateuncertainty. For the CFA franc zone, again, the high incidence of deflation we referred toearlier has been much more of an issue.
5. See Reinhart and Rogoff (2002) for a detailed description of the classification strategy.
6. The transparency index was not published prior to 2000 and our data on the parallel mar-ket rate end in 1998.

FOREIGN DIRECT INVESTMENT TO AFRICA I 281
References
The word "processed" describes informally produced works that may not be available com-monly through libraries.
Bhattacharya, Amar, Peter J. Montiel, and Sunil Sharma. 1997. "How Can Sub-Saharan AfricaAttract More Private Capital Inflows?" Finianice & Developmenit 34(2): 3-6.
Calvo, Guillermo, and Carmen M. Reinhart. 1998. "The Consequences and Management ofCapital Inflows: Lessons for Sub-Saharan Africa." Expert Group on Development IssuesSeries, 1998:2. Stockholm: Almqvist and Wiksell International.
Canzoneri, Matthew, Robert Cumby, and Behzad T. Diba. 2001. "Is the Price Level Deter-mined by the Needs of Fiscal Solvency?" Amer:caii Economic Review 91(5): 1221-28.
Claessens, Stiln, Simeon Djankov, and Daniela Klingebiel. 2000. "Stock Markets in TransitionEconomies." Financial Sector Discussion Paper 5. The World Bank, Washington, D.C.
Collier, Paul, and Anke Hoeffler. 2001. "Greed and Grievance in Civil War." Washington,D.C.: World Bank. Processed.
. 2002. 'Aid, Policy, and Growth in Post-Conflict Countries." Washington, D.C.:World Bank. Processed.
Easterly, William. 2001. The Elusive Quest for Growth. Cambridge, Mass.: MIT Press.
Edwards, Sebastian. 1991. "Capital Flows, Foreign Direct Investment, and Debt-Equity Swapsin Developing Countries." In H. Siebert, ed., Capital Flows in the World Econlomy. Tubin-gen, Germany: J.C.B. Mlohr.
Fernandez-Arias, E., and R. Hausmann. 2000. "What's Wrong with International FinancialMarkets?" Inter-American Development Bank Working Paper 429 (August). Washington,D.C.
Feldstein, Martin. 1998. "The Costs and Benefits of Going from Low Inflation to Price Sta-bility." In C. Romer and D. Romer, eds., Montetary Policy aiid Inflation. Chicago: Univer-sity of Chicago Press.
Fischer, Stanley, and Ando Modigliani. 1978. "Towards an Understanding of the Real Effectsand Costs of Inflation." Weltwirtschaftlhches Archiv 114: 810-33.
Fischer, Stanley, Ratna Sahay, and Carlos A. Vegh. 2001. "Modern Hyper- and High Infla-tions." Journal of Econiomic Literature.
Frankel, Jeffrey J., and Andrew K. Rose. 1996. "Currency Crashes in Emerging Markets:Empirical Indicators." Center for International and Development Economics Research(CIDER) Working Paper C96-062. Berkeley: University of California.
Gastanaga, Victor M., Jeffrey B. Nugent, and Bistra Pashamova. 1998. "Host CountryReforms and FDI Inflows: How Much Difference Do They Make?" World Development26(7): 1299-314.
IMF (International Monetary Fund). 2002. World Econiomic Outlook. Washington, D.C.
. Various (annual). Aninual Report onz Exchanige Arraligementts antd Exchanige Restric-tio,is. Washington, D.C.
-Various issues. International Financial Statistics [database]. Washington, D.C.
Kamaly, Ahmed. 2001. "Behind the Surge in FDI to Developing Countries in the 1990s: AnEmpirical Investigation" University of Maryland, College Park. Processed.
Keynes, John Maynard. 1936. The Genieral Theory of Employment, Interest, anid Money. Lon-don: Macmillan and Co.
Leeper, Eric M. 1991. "Equilibria Under 'Active' and 'Passive' Monetary and Fiscal Policies."Journzal of Monetary Economics 27(1): 129-47.