FDI: Source of Sustainable Growth Africa Foreign Investors Survey 2005 2007 Africa Day Symposium

Indian Foreign Direct Investment in Africa
Anusree Paul*
Abstract
The entry of Indian companies into Africa is largely market and resource
seeking which offers much more potential in terms of promoting forward and
backward linkages and in terms of impacting on competition in the domestic
market. The increasing competitiveness of Indian firms and their interest to
expand globally, particularly in IT-related services and pharmaceuticals, are
driving its outward foreign direct investment (FDI) growth. Indian FDI to
Africa is concentrated in oil, gas and mining in the primary commodities
market. In the manufacturing sector, a dominance of automobile and
pharmaceutical firms can be seen. Most of the Indian FDI in African countries
is through greenfield investments (GIs) and joint ventures (JVs) that are
desired by the host countries due to their contribution in creating new
production capacity and generating employment, transfer of technology, etc. A
number of factors have been identified that motivates Indian investors to invest
in Africa. The factors are socio-cultural factors, host country policies, regional
integration agreements, bilateral investment treaties (BITs), gross domestic
product (GDP) growth and political economy factors. There is no denying that
language, culture, presence of Diaspora does play a role in attracting FDI. The
relationship between India and Africa exists and functions at all these
multilateral levels as politics and commerce converge.
CUTS CCIER
Working Paper
No. 1/2012
* Senior Policy Analyst, CUTS International
2
1. Introduction
Context
Proliferation of bilateral trade agreements (BTAs) among developing and least developed countries
(LDCs), along with a rise in outward foreign direct investment (O-FDI) originating from developing
countries have further enhanced South-South trade and investment cooperation. Both these avenues
are private sector-led and hence the market-oriented initiatives have been taken to promote economic
efficiency. The recent interests of India and China in Africa have particularly bolstered such outward
FDI. This phenomenon would tend to bring about parity between the investments of developing Asia
and traditional investors from the developed world in the capital scarce least developed countries of
Africa.
India has undertaken a series of important initiatives to create an enabling trade and business
environment, to facilitate and enhance bilateral trade and investments with the African countries. The
main aim of such initiatives is to deepen the India-Africa strategic partnership to promote sustainable
development between the regions.
Keeping in perspective the growing commercial links between India and Africa and engagement of
India and South Africa in the policy discourse of developing nations as Brazil, Russia, India, China &
South Africa (BRICS), this paper attempts to look at the nature and pattern of O-FDI from India to
Africa. The paper also helps to identify the sectoral composition related to O-FDI and future
possibilities and the way to make inroads into Africa.
Background
The relations between India and Africa have been guided by a long history of solidarity including
shared values and ideals in the Non-Alignment movement days and synergy characterising the
freedom movements in the African and Indian sub-continent. This long history of solidarity can be
classified into several phases. The first phase coincided with imperialism in the 1900s during which
Indian capitalists who traded with the continent and Indian troops, who were part of the British
colonial ventures, got deeply involved in Africa.
Employment opportunities, which originated from the spread of Indian business interests and British
colonial ventures such as the building of the Uganda railway,1 led to migration by thousands of
Indians to east, central, and southern Africa. After the end of the railway construction, merchant
immigration from India continued until the 1920s, by when Indians had monopolised the entire retail
trade of East Africa. During this phase, apart from Mahatma Gandhi‟s long stay in Africa and
contributions by some other Indians to the political awakening of the region, Indian-African relations
were shaped by an economy and society, which was highly unequal and hierarchical.
The second period started with the politics of de-colonisation, followed by the newly independent
Indian and African nations, often giving importance to modernisation, technological cooperation and
scientific progress.
The third period spans the corporate globalisation era from the late 80s to the present day, with big
Indian companies and their investment in Africa becoming the prime engine driving India-Africa
relations. Both state-owned and private Indian companies such as Oil and Natural Gas Corporation
(ONGC), Bharti Airtel, Reliance, Mahindra, Tata to name a few have forged their presence in Africa.
At the same time, over the past four decades, India has provided more than US$2bn in technical

3
assistance to the countries of the South and most of it has gone to Africa. In the 1990s, a number of
projects were initiated with the support of India. For instance, an Entrepreneurial Training and
Demonstration Centre (ETDC) costing US$4.49mn has been constructed in Dakar (Senegal) by
Hindustan Machine Tools (HMT) and handed over in June 2000 (Beri, 2003). Further, Indian
companies are eying to invest in African continent – like TATA Chemicals has invested over
US$100bn across the continent.2
Against this backdrop, the aim of the paper is to review the roadmap of Indian FDI in Africa by
identifying the factors that have motivated Indian multi-national corporations (MNCs) to invest in
Africa.
The paper discusses the theoretical aspects related to the motives and types of O-FDI and identifies
the motivations of Indian O-FDI in Africa. It examines the patterns of Indian O-FDI in Africa on the
basis of „sectors and destinations‟ focusing on the Indian investment opportunity in Africa and finally
provides conclusion.
2. Motives and Types of O-FDI: Theoretical Background
Under the banner of globalisation, the policy liberalisation measures in trade, investment and
technology at multilateral, regional and individual country level has made the world economy more
interdependent. Removal of policy hurdles on a global scale opened larger opportunities for capable
Indian enterprises with trans-border expansion, lowering the transaction costs. In many cases, firms
used O-FDI as a means of establishing trade supporting infrastructure in overseas markets to increase
its non-price segment of competitiveness (Pradhan 2005).
The traditional FDI theory emphasised the ownership specific competitive advantages (technological,
managerial, reputational etc.) of the investing firms as a key to exploit in foreign locations. The
Internalisation Theory of FDI (Buckley et al 1976; Hennart, 1991) contended that firms extend their
activity to foreign locations, being efficiency seekers want to reduce the transaction costs of cross
border activities. This idea of transaction costs is further bridged by the OLI theory of John Dunning
(1981a, 1988). The OLI essentially holds that FDI is a result of firms possessing ownership-specific
advantages (O) that they want to exploit in foreign locations (L), which they do through
internalisation (I). Although these theories of FDI was largely developed based on the experiences of
developed countries but it can well explain the motivational factors behind the trans-border expansion
of developing countries‟ firms (Dunning 1981b; Lall 1983).
According to the literature, the developing world‟s MNCs, concerning ownership specific advantages
(O), will tend to possess advantages that are less advanced, typically related to products in the mature
phases of the product cycle, and mainly associated with low cost production, natural resources
extraction, and an ability to cater to low margin markets. Concerning location advantages (L), MNCs
will, as a consequence of their specific (O) advantages, tend to focus their activities in countries at the
same or lower stages of economic development (Dunning et al 1986). Concerning internalisation
factors (I), MNCs will tend to opt for joint ventures to access local market knowledge, technology and
capital, thus, compensating for their inherent resource limitations (Lecraw 1981).
Considering the types of O-FDI, four key types of investment are distinguished: horizontal FDI,
vertical FDI, strategic asset-seeking FDI, and resource seeking FDI (UNCTAD 2006). Horizontal or
market-seeking FDI is motivated by the desire to obtain market access and avoid trade frictions in the

4
host countries. It is guided by the proximity-concentration trade off in which proximity to the host
market avoids trade costs. FDI of this type occurs when firms decide to serve foreign market through
local production rather than through exports.
The motivation behind the vertical or efficiency driven FDI in developing countries is international
factor price differences. It takes place when a firm fragments its production process internationally,
locating each stage of production in the country where it can be done at the lowest cost.
The third most important motive for outward FDI from developing countries is the strategic asset-
seeking motive. Strategic asset-seeking FDI takes place when investors attempt to gain access to
internationally recognised brand names and local distribution networks in order to strengthen their
international competitive position. Strategic asset-seeking FDI also occurs in the form of technology-
sourcing FDI when firms attempt to gain access to foreign technology by either purchasing foreign
firms or establishing R&D facilities in „foreign centres of excellence‟.
Finally, the resource seeking FDI occurs when firms identify specific host country locations as an
attractive source of natural resources at the lowest cost. Such FDI is usually associated with exports of
resource-based products from the host country (Herzer 2011).
3. Factors Motivating India’s O-FDI Destination to Africa
Types and Objectives of O-FDI
As discussed in the previous section, according to Dunning, FDI emerges due to (i) Ownership
Advantages or Firm Specific Advantage where the core competencies of a firm, usually intangible in
nature which provides them with an edge to operate successfully in a foreign market. For example,
advantages in the form of brand names, patents, technology, reputation, benefits of economies of
scale, privileged access to inputs, etc. over the host country. Therefore, Indian MNCs might invest in
African countries because the firm specific advantages either generates higher revenues and/or lower
costs that can offset the costs of operating at a distant foreign location. For instance, Tata Motors has
set up plants in Africa to supply to the domestic industry there because of economies of scale and
brand name.
As regards to the location or country specific advantages of O-FDI, it is specific to foreign country
that can be distinguished into economic advantages (e.g. factors of production, size of market,
transport and other infrastructure costs), political advantages (e.g. political stability, policies on FDI)
and social-cultural advantages (e.g. cultural similarity, language, and attitude towards foreigners).
Finally, in case of internalisation advantages, the multinationals have various choices on entry modes
ranging from arm‟s length transactions in the market to establishing a wholly owned subsidiary. In
circumstances where markets function poorly with high transaction costs, internalisation is the
preferred choice to exploit both ownership-specific and location-specific advantages. In addition,
internalisation of production insures product quality and protects property rights. This is evidenced by
cross border acquisitions and the large number of Greenfield investments by Indian companies in
various African countries.
The increasing numbers of home-grown Indian firms (e.g. Tata Group, Infosys, Ranbaxy etc.) and
their improving ownership-specific advantages, including financial capability, are among the key
drivers for them to venture into Africa.

5
While the OLI paradigm outlined answers the questions of „why‟, „where‟ and „how‟ firms invest, the
different objectives of FDI are – to serve the local market, increase efficiency, and/or have access to
natural resources and cheap labour.
As we have discussed, horizontal or market seeking FDI is aimed at gaining access to new local and
regional markets or to maintain existing ones. This is usually found in sectors where domestic firm
productivity lags behind international levels. Presence of import restrictions by host governments also
drives this type of FDI. In addition, overseas firms may want to invest locally because of positive
environment or to save on operational costs such as transportation. For instance, investments by Tata
motors in South Africa are market seeking because the cars built in South Africa are sold in the
country.
The efficiency seeking FDI is commonly described as off shoring, or investing in foreign markets to
take advantage of a lower cost structure and is driven by low resource and input costs. The purpose of
this type of investment is to enhance the investing firm‟s global competitiveness and usually occurs in
capital and technology intensive sectors. For example, a credit card company opening a call centre in
India to serve US customers is a form of efficiency seeking FDI. Similarly, Ranbaxy undertaking
Greenfield investment with a local partner to supply medicines to the African continent is efficiency
seeking.
Resource seeking FDI is focused on extracting or refining natural resources such as petroleum, natural
gas, or timber. The objective of such investment is to attain access to existing resources, such as
ONGC Videsh, the overseas division of India‟s state-owned ONGC investing in Nigeria and Sudan to
ensure access to resources to meet its energy needs.3 Similar to China and other traditional investors
in Africa, resource seeking motive is a crucial one for India as well. This is exemplified by its
increasing presence in oil and other mineral rich countries such as Sudan, Nigeria, Libya, Ivory Coast
and others in its quest for energy security (Sharma et al 2007; Hate 2008).
Table 1: Objectives of FDI for Firms of Various Sectors
Impetus
Industry
Market
Seeking
Resource
Seeking
Efficiency
Seeking
Companies
Conglomerates Tata Group
Healthcare and
pharmaceuticals
Ranbaxy, Dr. Reddy‟s,
Biocon, Piramal
Healthcare
IT services NIIT, Infosys, Wipro
Manufacturing Mahindra, Raymonds
Oil, gas and energy Reliance Ltd., ONGC,
Suzlon Energy
Engineering and
Construction
Larsen & Toubro
Source: Indian School of Business-Vale Columbia Centre Ranking of Indian Multinationals

6
Table 1 shows the objectives that firms pursue when they invest abroad. While conglomerates like
Tata, aim to access markets, seek efficiency and at the same time ensure access to resources,
manufacturing firms are more interested in securing markets and gaining efficiency by lowering costs.
Socio-cultural Factors
Country specific advantages influence where a MNC will invest. Diaspora and language along with
cultural similarities also stimulate international entrepreneurships by creating cross border social
networks that serve an important role in helping entrepreneurs to circumvent the barriers to business
relations and trade arising from imperfect local institutions in the host country. For instance,
according to a survey, 48 percent of the surveyed firm owners who are of Indian ethnic origin are also
African by nationality compared to only four percent who are of Chinese ethnic origin but also of
African nationality (Harry 2007). Multinational enterprises (MNEs) prefer to invest in those countries
where they already have network of sale or purchase because they know the culture, taste, law,
business environment and above all the network with the business community. MNEs set up their
overseas projects in those countries that are nearby and where they have already attained knowledge
through trade.
Africa has approximately 2 million Indian descents Diaspora in the Anglophone countries in eastern
and southern Africa. Till the mid-1990s the Indian government ignored the Indian Diaspora and as a
consequence of which India barely reacted when Idi Amin expelled all people of Indian origin from
Uganda in 1971. Now the changed outlook of the Indian government in the recent past has
encouraged trade and investment linkages. African countries have proportionally higher number of
Indians. South Africa, Mauritius. Kenya and Seychelles have a substantially high number of Indians.
For instance, approximately 60 percent of Mauritius‟s population is made up of people of Indian
descent.4
Host Country Policies
FDI-related policies, changes in corporate tax rates and other fiscal incentives, privatisation policies
of the host country help in determining the inward flow of FDI. South Africa, for instance, has in
place political risk insurance cover for foreign investment which encourages companies to take the
risk of investing in South Africa. According to UNCTAD (2006) Indian FDI appears to be relatively
more influenced and driven by favourable host-country policies and incentives rather than home
government‟s FDI-related policies.
Regional Integration Agreements
Regional trade agreements (RTAs) increase market size and encourage inward FDI. Existing literature
suggests that free-trade areas (FTAs) usually tend to encourage FDI both among signatory countries
and, in areas that are closely integrated, also with respect to third-party countries. By enlarging the
overall size of the market, these agreements tend to increase the scope for reaping economies of scale
through FDI aimed at accessing local markets (so-called “horizontal” FDI) for both signatory and
non-signatory countries.5 However, this has not been the case in Africa with the aggregate FDI
inflows into Africa as a percentage of the global FDI has declined. And further these inflows are
skewed towards certain industries (mining for instance) and countries such as South Africa (Yang et
al 2005).

7
Bilateral Investment Treaties
BITs and Double Taxation Treaties (DTTs) encourage the flow of FDI. India has BITs with seven
countries and DTTs with nine countries.6 For instance, India signed a BIT with Sudan in 2003 and
post that invested US$1bn in the oil sector.7 India is now also the second largest exporter to Sudan.
Prior to 2003, India was not a major investor or trading partner of Sudan. India also has a Bilateral
Investment and a Double Taxation Avoidance Treaty with Mauritius which could have possibly
contributed in increasing the inflow of FDI into the country.
FDI and GDP Growth
Both, theory and empirical research have explained that there exists a positive relationship between
FDI and GDP growth. GDP growth is an indicator that market is progressing and has potential to
absorb FDI for rising demands. More growing markets provide relatively more opportunities for
generating profits as compared to those, which are growing slowly or not at all.8 But in Africa, a
mixed picture can be seen with Angola having an annual GDP growth rate of 12.4 percent in 2008-09
but with a falling FDI inflow. At the same time, Equatorial Guinea had high annual GDP growth rate
of 20.3 percent accompanied by an increase in FDI in the same period.9 So while GDP growth can be
a contributing factor, a number of other factors are responsible for increased FDI inflow.
Political Economy Factors
Moreover, there is a growing recognition of the fact that countries on the eastern coast of Africa
abutting the Indian Ocean – from South Africa to Somalia – fall under India‟s maritime strategic
neighbourhood. It has been acknowledged that insecurity in the Indian Ocean region is growing, given
the existence of fundamentalist, terrorist, and militant, separatist or extremist organisations and
criminal syndicates involved in trafficking of drugs, arms and humans, and piracy (Beri 2008).
The growth in incidents of piracy in Somali waters in particular threatens the security of the Sea
Lanes of Communications (SLOCs). The Indian Navy has been active in its diplomacy in the Indian
Ocean, providing maritime security cover during the African Union summit in 2003 and the World
Economic Forum in 2004 in Mozambique.
As mentioned earlier, Indian industry has realised the strategic importance of Africa, specifically in
commercial terms. This is supported by the Indian government‟s fresh look at Africa with the
initiatives of Focus Africa10
and Team 9.11
New economic initiatives launched by the African
governments like the New Partnership for African Development (NEPAD)12
have also attracted the
interest of Indian investors.
There is a growing realisation that African economies are at a stage of development where India could
offer the most appropriate technology and products at competitive prices. A recent study by the
Federation of Indian Chambers of Commerce & Industry (FICCI) points out that it is “high time India
took a pragmatic assessment of the business opportunities offered by Africa.” The success of the four
India-Africa project partnership conclaves held in New Delhi since 2005 – the last one attracted 606
African delegates from thirty-three countries, and around 152 projects worth US$10.5bn were
negotiated – is an indication of Indian industry‟s growing interest in Africa.
In April 2008, India announced duty free tariff preferential scheme for 49 LDCs, which has benefited
33 African countries. The Indian Technical and Economic Cooperation Scheme (ITEC) and Special
Commonwealth African Assistance Programme (SCAAP) have been used to create goodwill for India
by dispensing aid, technical assistance and training.

8
4. India’s Investment Opportunity in Africa: Pattern & Sectoral
Distribution
The overseas investment of domestic corporate sector through FDI has provided better footing to
access global markets and networks, skills and technologies. It also enables to share research and
development efforts and its outcomes. It also helps establish a brand image as a part of corporate
strategy and utilisation of raw materials of host countries. Indian companies made overseas
investment primarily motivated by either resource seeking or market seeking or technology seeking
interests. Indian investments in Africa are mainly resource and market seeking types (Sadik et al
2001).
The increasing competitiveness of Indian firms and their interest to expand globally, particularly IT-
related services and pharmaceuticals, are driving its outward FDI growth. India's membership in
various regional integration arrangements also provides Indian firms with a favourable platform to
strengthen their presence in these partner economies. India continues to pursue its strategy of signing
bilateral investment treaties and trade agreements to encourage both inward and outward flow of FDI.
Pattern of Indian O-FDI in Africa
The entry of Indian companies into Africa is largely market and resource seeking which offers much
more potential in terms of promoting forward and backward linkages and in terms of impacting on
competition in the domestic market. In the background of new trade policy and increasing economic
cooperation with African countries, Indian entrepreneurs are increasingly seeking to expand their
business activities and diversify their sources of natural resources, as well as their markets. Indian
companies are investing in oil exploration and mining projects (gold, phosphates, and copper ores), as
well as in manufacturing and services.
There has been a massive increase in O-FDI from India in last 15 years. According to the data
released by the Ministry of Finance, Government of India, O-FDI from India increased from
US$0.1bn in 1990-91 to US$16.8bn in 2010-11 (Table 2, Figure 1).
Table 2: Total Outward FDI from India and India’s share in Developing Economies’
Total Outflow
Year Outward FDI
from India
(US$bn)
Total O-FDI in
Developing Economies
(US$bn)
Share of India in Developing
Economies
(in Percentage)
1990-91 0.1 11.9 1.0
1995-96 0.5 55.2 0.9
2000-01 1.7 134.2 1.3
2001-02 2.5 82.5 3.1
2002-03 2.4 49.7 4.8
2004-05 2.2 121.4 1.8
2005-06 2.5 122.1 2.0
2006-07 9.7 226.7 4.3
2007-08 14.6 294.2 4.9
2008-09 19.4 308.9 6.3
2009-10 14.8 270.7 5.5
2010-11 16.8 327.6 5.1
Source: Various Issues of World Investment Reports (UNCTAD)

9
Figure 1: Total Outward FDI from India and India’s Share in Developing Economies Total
Outflow
Source: UNCTAD-WIRs
As evident from Figure 1 and also from Table 2, the total outflow of FDI from India is increasing at a
rate of 42.8 percent per annum which is statistically significant at 5 percent level of significance. The
figure also reflects the continuous increase in the share of the Indian FDI to the total outflow of
developing world.
Indian O-FDI shows major structural shifts during the past decade. India has become the world‟s 21st
largest outward investor.13
Since 2000, Indian firms have tended to use cross-border merger &
acquisition (M&A) to enter into developed countries and using the route of Greenfield investments
into developing ones as a part of their competitive strategy. FDI outflows from India have accelerated
only in the last decade post liberalisation. Government policies in India as well as strong domestic
growth are some of the key factors which have given confidence to Indian firms to pursue acquisitions
abroad through the FDI route.
Based on the OLI paradigm, Table 3 shows the pattern followed by Indian multinationals in making
investments abroad and looks at how reasons and strategies for entering foreign markets have evolved
over the decades.
Table 3: Evolution of Indian Enterprises
First phase: pre 1990s Second phase: 1990s Third phase: 2000 onwards
Ownership
Advantage
Adapted and scaled down
technologies
Cost effective processes Managerial expertise, low cost
production and engineering ability
Motivations Market- seeking Trade supporting Strategic assets and natural
resource seeking
Sectors Low technology: light
engineering, palm oil
refining, rayon, paper
IT services,
pharmaceuticals etc.
Metals, pharmaceuticals, Auto,
petroleum products etc.
Magnitudes Small Moderate Large
Entry Mode Greenfield Greenfield Acquisitions and Greenfield
Destinations Asian and African low
income countries
Similar to exports Resource rich and strategic
resource rich countries – south
Africa, Nigeria, Singapore, UK
Source: Nagesh Kumar (2008)
10
As evident from Table 3, in the pre-globalisation phase,14
the Indian companies were more market
seekers and hence targeted the Asian and African low income countries in small scale. The entry
mode was Greenfield targeting intermediate products sector. With liberalisation policies in place, in
the matured phase of globalisation, Indian MNCs with their managerial expertise and low cost
production techniques have started entering into the resource rich and strategic resource rich countries
where the magnitudes are large. The targeted sectors are IT services, pharmaceuticals, insurance, real
estate, manufacturing etc.
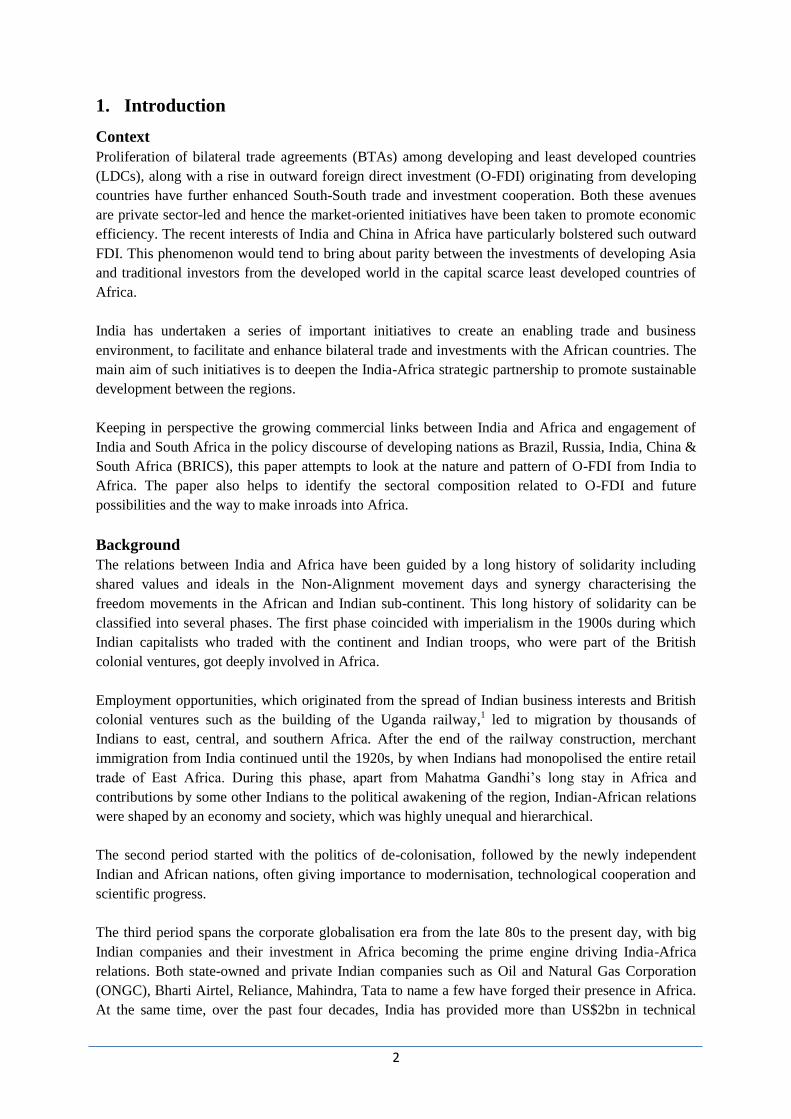
Looking into the picture of Indian O-FDI in Africa, it is found that Africa‟s share in Indian FDI has
increased in absolute terms from US$37.83mn to US$2.56bn during 1996- 2008. This signifies a 19.9
percent growth per annum which is significant at 10 percent level of significance. The trend although
shows fluctuations during 2003-04 and 2004-05 India‟s FDI flows to Africa have fluctuated over the
years as we can see from Figure 2. The figures of last five years, i.e. from 2004-05 onwards, reveal
that the Indian outflow to Africa has significantly increased by 58.7 percent per annum. Fluctuations
are highly evident during the early phase of the era. For instance, 2002-03 saw a surge in investment
while FDI flows in the subsequent two years were rather low.15
Such fluctuations are due to large
amounts of investments going to oil and infrastructure projects which require substantial initial fixed
costs.
The increasing share of African investment to total outflow from India indicates the growing interest
of Indian investors to African countries.
Figure 2: Indian FDI inflow to Africa and Share of O-FDI to Africa to India’s Outflow
(in US$bn)
Source: Ministry of Finance, India
Looking into the investment compositions of different African countries, it was found that Mauritius,
Liberia, Sudan, Libya and South Africa received the maximum FDI from India in an average during
last seven years (Table 4). The data of the table and the graph signifies that Mauritius is the top FDI
receiving nation followed by Sudan, Liberia, Nigeria, Libya, Kenya and South Africa. Mauritius alone
accounted for 86 percent on an average of total Indian FDI to Africa during last three years. Sudan has
shown a falling trend whereas Nigeria and South Africa has shown a mild upward trend of Indian
investments.16

11
Table 4: Indian FDI to African Countries (in US$mn)
Country 1996- 2002 2002-03 2003-04 2004-05 2005-06 2006-07 2007-08 2008-09
Botswana 3.46 --- 0.05 0.02 0.02 --- 2.30 8.11
Burkina
Faso
-- -- --- 0.05 --- --- --- ---
Cameroon -- 0.02 --- --- --- --- --- ---
Ethiopia 0.54 0.57 0.22 0.20 1.80 1.80 2.52 1.49
Ghana 0.03 0.33 0.01 --- 0.66 0.66 1.69 1.09
Ivory Coast 0.01 --- --- 7.24 6.85 0.39 0.27 0.50
Kenya 12.75 0.59 1.77 0.19 0.32 0.20 0.33 133.15
Libya 30.00 --- --- --- 25.28 75.00 0.02 12.67
Liberia 0.28 --- --- --- 154.94 --- 17.74 16.00
Mauritius 618.34 133.35 175.59 149.38 332.67 1162.79 1506.29 2086.97
Morocco 32.49 --- --- --- --- --- 0.44 2.65
Mozambique -- -- -- 2.55 7.52 --- 3.23 3.77
Niger --- --- --- --- 0.01 --- --- 0.50
Nigeria 6.69 4.08 2.16 7.53 4.30 11.64 27.20 237.00
Namibia 0.06 --- --- 0.00 --- --- --- ---
South Africa 21.56 0.07 0.79 2.88 10.42 23.29 46.19 12.37
Sierra Leone --- --- --- 0.01 --- --- --- ---
Senegal 22.24 --- --- --- 1.00 --- 0.03 ---
Sudan -- 750.00 162.03 51.55 63.05 118.15 8.30 38.06
Tanzania 4.02 0.01 0.08 0.34 --- --- 10.47 ---
Tunisia --- --- --- -- --- 5.24 --- ---
Uganda 2.44 --- 0.01 0.19 --- 0.00 --- 1.00
Zambia 2.35 -- --- 0.11 --- --- --- 0.05
Zimbabwe 1.11 --- --- 0.18 0.30 0.95 --- ---
AFRICA 758.37 889.02 342.71 222.42 609.14 1400.11 1627.00 2555.37
Source : http://finmin.nic.in/the_ministry/dept_eco_affairs/investment_div/invest_index.htm#Actual_Outflows
(accessed on February 28, 2012)
Factors that could be counted to understand the pattern of FDI to certain countries is the presence of
Diaspora or proximity to the coast. Most countries like South Africa, Mauritius, and Nigeria are
coastal countries and have either large markets, natural resources or purchasing power. Countries
receiving US$0.1 to US$1mn are mostly located in East and Southern Africa such as Kenya and
Tanzania. And in these countries a significant share of the population is of Indian origin with
historical and cultural ties.
Further, most of the African countries, which see an inflow of Indian investment, are English
speaking. Having a common language possibly makes it easier to set shop and become a part of the
community. India‟s interaction with Africa must also take into account the costs of investing in
politically risky countries. The security situation is further complicated by a general absence of
transparent procedures for business. African countries that provide political risk insurance score more
FDI from India. For instance, South Africa has a civil disturbance and terror cover provided by the
South African Special Risks Insurance Association. At the same time Nigeria has been increasingly
losing control of the oil rich Niger delta. There have been instances where Indian firms have shut shop
in Africa due to political instability leading to stagnant markets. For instance, Raymond Woolen Mills

12
(Kenya) Ltd also shut down due to inadvertent investment climate which was aggravated by political
instability in the country.
Sectoral Distribution of Indian FDI in Africa
Looking into the sectoral composition of FDI outflow from India (Table 5), the financial, insurance,
real estate and business services sector got highest attention (38.7 percent) followed by manufacturing
(29.8 percent) during 2010-11.
Table 5: Sector-wise FDI from India (Gross outflow)
(in US$bn)
Sectors 2010-11 2011-12
(April-Sept.)
Financial, Insurance, Real Estate & Business Services 6.5 2.2
Agricultural, Forestry and Fishing Manufacturing 1.2 2.0
Manufacturing 5.0 1.8
Transport, Storage and Communication Services 0.8 1.0
Wholesale, Retail Trade, Restaurants & Hotels 1.9 0.6
Construction 0.4 0.2
Electricity, Gas & Water 0.1 0.1
Community, Social & Personal Services 0.7 0.1
Miscellaneous 0.2 -
Source: Reserve Bank of India17
April 2011 to February 22, 2012
It has been argued that the O-FDI activity prior to 1991 was of market seeking type where Indian
enterprises established a presence in other developing countries (Lall 1986; Kumar 2008). The
liberalisation of O-FDI policy of India during the 1990s has provided an impetus for Indian firms to
use O-FDI as a means of competitive strength and survival in the globalising world.
The sectoral distribution of India‟s total O-FDI indicates a rise in investments going into IT and
related services especially towards the second half of 1990s. In addition, investments in the
pharmaceutical sector have also increased in recent years. Another interesting point is that India‟s O-
FDI in the extractive sector accounted for only 1.82 percent during the pre-1990s while this share has
increased to 20.86 percent during 2001-04.18
Table 6 gives us a sectoral composition and sector wise percentage distribution of Indian investment
in African region. As evident from the table there are 27 instances in total where Indian companies
have invested in different sectors in Africa.
Table 6: Sectoral Composition and Sector wise Percentage Distribution of Indian Foreign
Investments in Africa
Sector Instances in Africa Sector wise Percentage Distribution of
Foreign Investments
IT 1 3.7
Pharmaceuticals 5 18.5
Auto Component 0 0.0
Construction 3 11.1
Telecom 4 14.8
Petroleum Products 3 11.1

13
Oil & Gas Mining 3 11.1
Steel 2 7.4
Dyes 0 0.0
Paints 0 0.0
Machinery/Capital-Goods 0 0.0
Non Ferrous Metals 0 0.0
Auto 2 7.4
Cosmetics, Toiletries etc. 2 7.4
Tyres & Tubes 1 3.7
Diversified Products 0 0.0
Food Products 1 3.7
Source: Subramanian et. al (2010)
Figure 3 is the diagrammatic representation of table-5. It is evident that the leading sectors are the
pharmaceuticals and telecom sectors which accounted for 18.5 and 14.8 percent respectively. Other
important sectors that are operational in Africa are construction, oil and gas mining and petroleum
products which all accounted for 9 instances in total. Box 1 presents selected Indian MNCs who are
operating in Africa since early 2000.
Figure 3: Indian Investment in Africa by Subsectors
Source: Ibid
IT, 3.7
Pharmaceuticals,
18.5
Construction,
11.1
Telecom, 14.8
Petroleum
Products, 11.1
Oil & Gas
mining, 11.1
Steel, 7.4
Auto, 7.4
Cosmetics,
Toiletaries etc.,
7.4
Tyres & Tubes,
3.7
Food Products,
3.7

14
As evident, Indian FDI to Africa is concentrated in oil, gas and mining in the primary commodities
market. While in the manufacturing sector, we see a dominance of automobile and pharmaceutical
firms. In 2007, Dr. Reddy's Laboratories Ltd, the Hyderabad-based pharma major panded its presence
in Africa with the opening of its 40th overseas office in Lagos, Nigeria, in partnership with Phillips
Pharmaceuticals.19
Big pharmaceuticals companies such as Ranbaxy have signed joint ventures with
local African company, which gives them the advantage of investing and developing local
manufacturing capabilities (Barka et al 2011).20
The FDI in services sector is dominated by telecommunication firms. Telecom majors in India – Essar
Group, Tata Communications and Reliance Communications, all of which have licenses for telecom
services in African countries are looking for expanding their operations. Reliance communication is
present in Uganda, Tata telecommunications in South Africa, Essar in Uganda and Kenya while
Bharti Airtel is negotiating with MTN in Seychelles.
Box 1: Selected Indian MNCs in Africa
Year Type of
Investment
Value Indian Firm Country Industry
2002 GI US$12.5mn ONGC Videsh & Oil Ivory Coast Oil, mining
2002 GI US$766mn ONGC Videsh Sudan Petroleum
2003 JV 60 percent stake Dr. Reddy‟s South Africa Pharmaceuticals
2004 JV US$4mn Dabur India Nigeria Household goods
2004 GI US$600mn ONGC Videsh Angola Petroleum
2004 M&A US$48.2mn Vedanta Resources Zambia Copper mines
2004 GI N.A Mahindra & Mahindra South Africa and
Egypt
Automobiles
2005 GI US$6bn ONGC Mittal Energy Ltd. Nigeria Infrastructure
2005 JV 51 percent stake
at IOIB
State Bank of India Mauritius Banking
2005 M&A 500 million HPCL Kenya Petroleum Refinery
2006 GI US$80mn Tata Steel South Africa Ferro Chrome
2006 JV N.A Cipla South Africa Supply of
pharmaceuticals
2006 GI 6 billion ONGC Videsh Nigeria Coal, Oil and natural
gas
2007 JV US$70mn Ranbaxy Labs. South Africa Pharmaceuticals
2007 JV Undisclosed Tata Consultancy Services South Africa IT and Business
Services
2007 JV US$1.5bn Tata Steel Ivory Coast Iron Ore
2007 JV 88.2 million Tata Steel Mozambique Iron Ore
2007 GI 1 billion Reliance Industries Egypt Petrochemicals
2008 Line of credit 640 million Indian government Ethiopia Sugar
Source: Compiled by the Author
Note: JV: Joint Ventures; GI: Greenfield Investments; M& A: Mergers & Acquisitions
15
While, the most common way for MNCs to undertaken FDI is via M&As, greenfield investments
(GIs) have been the dominant entry mode for Indian MNCs during the 1990s. However, in recent
years, the overall trend is a rise in M&As rather than Greenfield investments.21
However, most of the Indian FDI in African countries are through GIs that are desired by the host
countries due to their contribution in creating new production capacity and generating employment,
transfer of technology, etc. Further, such investments can increase market competition as they are
associated with investments in new facilities or expansion of existing ones and also provide long term
benefits to the local economies.
Greater familiarity of a market and willingness to take risks are associated with firms willing to enter
through GIs, the fact that India has had historical trade and investment ties with the region and
increased market familiarity due to the large Diaspora could be a reason for Indian MNCs entering
through GIs.
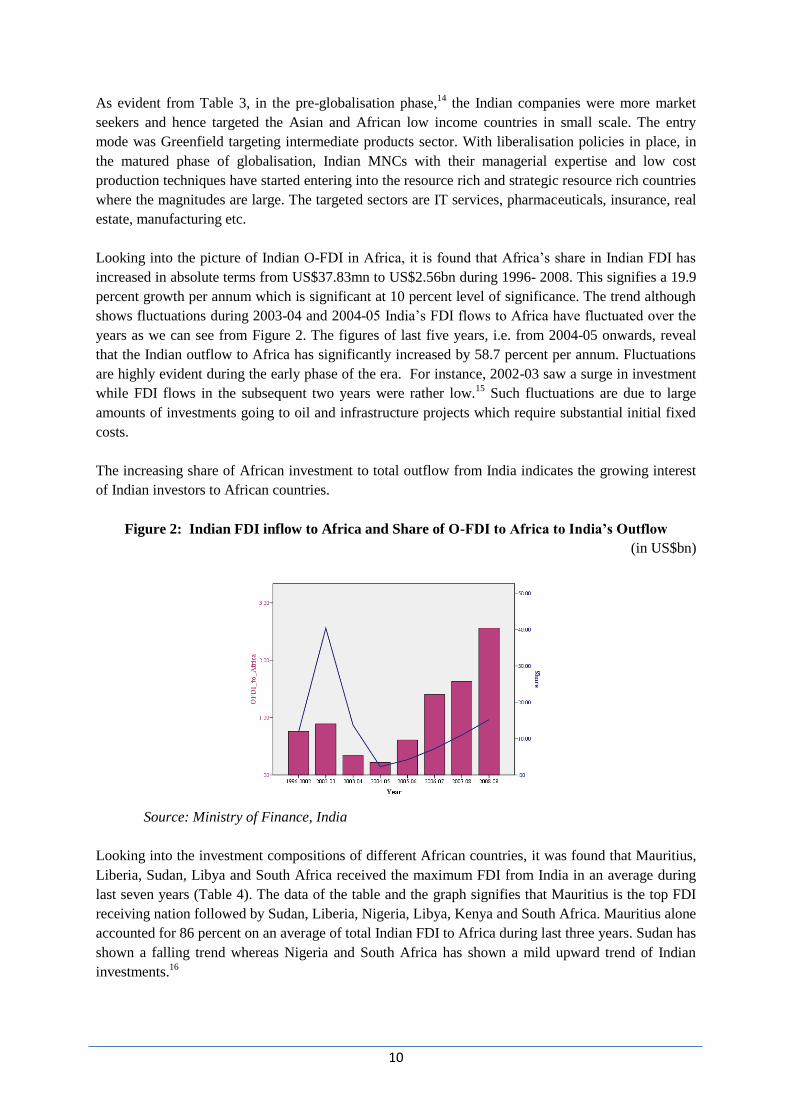
Greenfield FDI projects in Africa by Indian firms totalled 48 during 2002-05, while M&A during
1987-2005 totalled 15.68 percent of Indian investments are Greenfield investments, 23 percent are
M&A and 9 percent are joint ventures.
Table 6: Cross border M&A in Africa by India
(1987-2005, cumulative number of deals)
Host Economy India
Egypt 3
Mauritius 1
South Africa 3
Sudan 3
Zambia 3
Others 2
Total 15
Source: World Investment Report, 2006, UNCTAD
India is also aware of the competition it faces from China in Africa. Both China and India are trying
to woo Africa, not only through trade and FDI but also through aid. Both the countries follow very
similar aid strategy of monetary (grants and concessionary loans) and non-monetary (low cost
technical assistance, access to training programmes, gifts of equipment etc.) aid. China‟s investment
strategy is different from India‟s, as it follows a policy of neo-imperialist resource extraction. China
makes resource-based investment and it is largely government-to-government. On the other hand,
India‟s investment is largely private sector driven and more locally integrated. China‟s bilateral trade
with Africa is almost double that of India‟s, at US$60bn in 2008. China has followed an aggressive
approach targeting resource rich countries such as Sudan, Angola and Congo. In fact, the huge
Chinese presence has faced resentment in some African countries. For instance, Congo shut down
three Chinese companies.22
India‟s presence is smaller and it is not perceived to just grab and run.
5. Conclusion
This paper is a primary attempt to identify the factors that have motivated Indian MNCs to invest in
Africa and to fathom if they have followed a pattern. There is no denying that language, culture,
presence of Diaspora does plays an important role in attracting FDI. Similarly few countries being

16
rich in resources by default attract investments, irrespective of the political risks involved. Countries
also have strategic interests to protect. The relationship between India and Africa exists and functions
at all these multilateral levels as politics and commerce converge. While we could claim that based on
language and Diaspora, as well as proximity to the coast, Indian firms have followed a pattern, it
generally seems that they have gone in wherever they could secure resources and saw an opportunity
to capture the market. India has made investment in politically instable economies and also provided
aid to promote development. But this is just the beginning.
Rich in both resources and votes in the UN General Assembly, Africa is immensely important for
India. India is also aware of other giants such as the US, the EU and China that are also vying for the
same resources and markets. India has been concerned about its energy needs and hence the renewed
interest in Africa. However, it also needs to be cautious of the risks involved in investing in countries
that are not politically stable. India as we saw, has mostly taken the route of GIs and JVs to gain
market access and ensure that there are spillovers in terms of local development. Most of its
investments have been focused in the coastal countries, which are easier to access than landlocked
countries.
India has been present on the African continent for decades. In east and southern Africa, the large
Indian Diasporas have facilitated business and cultural ties between the two countries. Given that
India is flush with foreign reserves and the government has eased regulations and controls allowing
firms to go abroad and has removed the US$100mn cap on foreign investment by firms, India has
invested in an array of sectors, including financial sector as well as food processing and light
manufacturing. FDI invested in the light-manufacturing sector typically has much greater multiplier
effects than FDI invested in the extractive sector.
To conclude, India still has a long way to go in Africa in terms of both trade and investment as
compared to other countries. Also there still a lot of unexplored business opportunities in the
continent. A more extensive study to review the Indian policy towards Africa and detailed documents,
which report the patterns and trends of outward FDI of India to Africa, is required. However, from a
preliminary glance, it is evident, that India is there to stay. The investments will only get larger and
slowly penetrate the continent. It seems, India will continue to court Africa at all levels and is set to
give the other suitors a tough competition.
Endnotes
1 www.everyculture.com/Africa-Middle-East/Asians-of-Africa.html 2 The Economic Times, November 10, 2011. Available in: http://econ-industry/indl-goods-/-svs/chem-/-fertilisers/tata-
chemicals-eyes-more-africa-investments/articleshow/10682163.cms 3 A large share of Indian FDI is in infrastructure sector, but mostly in the extraction sector. 4 The Indian Diaspora in other countries of Africa, Report of the High Level Committee on the Indian Diaspora 5 http://www.oecd.org/dataoecd/24/31/2956472.pdf, Accessed in December 2010 6 Bilateral Investment Treaties- Mauritius, Sudan, Ghana, Zimbabwe, Djibouti, Ethiopia, Egypt
Double Taxation Treaties (DTT)- Mauritius, Libya, Ivory Coast, Kenya, Tanzania, Uganda, Zambia, Sierra Leone,
Namibia 7 Embassy of India, Khartoum, http://www.indembsdn.com/eng/india_sdn_partners.html (accessed on 15 June 2009) 8 http://gdex.dk/ofdi/16%20Anwar%20Amar%20Iqbal.pdf 9 African Economic Outlook,, http://www.africaneconomicoutlook.org/en/ ( accessed on 15 October 2009) 10
Focus Africa Programme was initially launched on 31.3.2002 with focus on seven countries of Sub-Saharan African
(SSA) Region, viz., South Africa, Nigeria, Mauritius, Tanzania, Kenya, Ghana and Ethiopia. With a view to further
widen and deepen India's trade with Africa, the scope of this Programme was further extended with effect from 1.4.2003

17
to include Angola, Botswana, Ivory-Coast, Madagascar, Mozambique, Senegal, Seychelles, Uganda, Zambia, Namibia
and Zimbabwe, along-with the six countries of North Africa, viz., Egypt, Libya, Tunisia, Sudan, Morocco and Algeria.
Under this Programme, Government extends assistance to exporters and Export Promotion Councils etc. to undertake
visits to countries in Africa to organize/participate in trade fairs and exhibitions hold B-2-B meetings etc. African trade
delegations are also sponsored to visit India. These export promotion activities are conducted by various Export
Promotion Councils and Apex Chambers with grant under Market Development Assistance (MDA) and Market Access
Initiative (MAI) Scheme. 11 The Government of India has set up the Techno-Economic Approach for Africa India Movement (TEAM-9 Initiative) to
enhance India‟s commercial relations with the nations of West African region such as Mali, Guinea, Ghana, Equatorial
Guinea, Chad and Burkina Faso. Under this, a cooperation mechanism was envisaged which would operate at
governmental, institutional and private sector levels, sharing various types of expertise, intellectual and physical resource
as well as economic opportunities for promoting welfare, growth and prosperity in these countries. 12 NEPAD is aimed at promoting cooperation and mutual interests between Africa and other countries. It was launched in
2001. 13 Authors‟ calculations, based on UNCTAD‟s FDI/TNC database, available at: http://stats.unctad.org/fdi. 14 Pre-globalisation phase: pre 1990s; globalisation phase: 1990 onwards which can be further subdivided into early phase
of globalisation (pre 2000) and matured phase of globalisation (2000 onwards). 15 This surge could be attributed to large investments made by ONGC in Sudan and Angola. 16 Although Mauritius is the top FDI receiving nation, a large share of the investments are simply re-routed through the
country due to its tax haven status facilitated by the double taxation avoidance agreement with India. Similarly Sudan has
seen a surge in FDI because of oil. This indicates the possibility that a large share of Indian FDI is flowing into countries
with oil and mineral resources. 17 http://rbidocs.rbi.org.in/rdocs/Speeches/PDFs/OV27022012.pdf 18 See table 4 in Kumar-2008- RIS Discussion Paper #140 19 Dr Reddy's already has presence in South Africa, Ghana, Sudan, Kenya, Uganda, Tanzania, Rwanda and the Democratic
Republic of Congo. 20 Business Standard (2007): Ranbaxy labs forms JV in South Africa to sell AIDS Drugs, Business Standard, February 07. 21 Internationalisation of Indian Enterprises: Patterns, Strategies, ownership advantages and implications - Kumar (2008) 22 Apparently the huge Chinese presence in the shape of small 'Chinatowns' has sparked local resentment and the local see
China as someone who wants to exploit the resources without promoting local development.
References
Barka, Habiba Ben and Mlambo Kupukile (2011): India‟s Economic Engagement with
Africa, Africa Economic Brief, Volume 2, Issue 6 11 May, 2011.
Beri, Ruchita, (2008): India & Africa Partnership: Opportunities and Challenges, IDSA
Strategic Comments, Institute for Defence Studies &Analyses, New Delhi.
Buckley, P. J., & Casson, M. C. (1976): The future of the multinational enterprise, London:
Holmes & Meier.
Dunning and Narula (1996): The Investment Development Path Revisited: Some Emerging
Issues, in Dunning and Narula (eds) Foreign Direct Investment and Governments: Catalysts
for Economic Restructuring, London: Routledge: 1-38.
Dunning, J. H. (1981a): The eclectic theory of the MNC, London: Allen & Unwin. And
Dunning, J. H. (1988): The eclectic paradigm of international production: A restatement and
some possible extensions. Journal of International Business Studies, 19(1): 1–31.
Dunning, J. H. (1988): The eclectic paradigm of international production: A restatement and
some possible extensions. Journal of International Business Studies, 19(1): 1–31.
Dunning, J.H (1981b), Explaining Outward Direct Investment of Developing countries: In
support of the Eclectic Theory of International Production, in Kumar and McLeod (1981)
(eds): Multinationals from developing countries, Lexington, Massachusetts: Lexinton Books.
Harry G. Broadman , 2007 Africa’s Silk Road: China and India’s New Economic Frontier,
The World Bank.
18
Hate, Vibhuti, (2008) India in Africa: Moving Beyond Oil, Number 119, South Asia Monitor,
Centre for Strategic and International Studies, USA.
Hennart,J-F. (1991): The transaction cost theory of the multinational enterprise, in Pitelis &
Sudgen (eds), The nature of the Transnational Firm, London: Routledge.
Herzer, D (2011): The Long-run Relationship between Outward Foreign Direct Investment
and Total Factor Productivity: Evidence for Developing Countries, Journal of Development
Studies, Vol. 47, No. 5, 767–785, May 2011.
Kumar, Nagesh (2008): Internationalisation of Indian Enterprises: Patterns, Strategies,
ownership advantages and implications, Asian Economic Policy Review, Vol. 3, Issue 2, pp.
242-261, December 2008
Lall (1983) (ed.): The New Multinationals: The Spread of Third World Enterprises, New
York: John Wiley & Sons or Wells, L. T. (1983), Third world multinationals: The rise of
foreign investment from developing countries, Cambridge, MA: The MIT Press.
Lall, R.B. (1986): Multinationals from the Third World: Indian Firms Investing Abroad, New
Delhi: Oxford University Press.
Lecraw (1981): Internationalization of firms from LDCs: Evidence from the ASEAN region,
in Kumar and McLeod (eds) Multinationals from developing countries, Lexington, MA:
Lexington Books.
Pradhan, Jaya Prakash (2005): Outward Foreign Direct Investment from India: Recent Trends
and Patterns, Gujarat Institute of Development Research, Working Paper No. 153, February.
Ruchita Beri (2003), India‟s Africa Policy in the Post-Cold War Era : An Assessment,
Strategic Analysis, Vol. 27, No. 2, Apr-Jun 2003,The Institute for Defence Studies and
Analyses. Available in: www.idsa.in/system/files/strategicanalysis_rberi_0603.pdf
Sadik, Ali T. and Ali A. Bolbol, 2001: Capital flows, FDI and Technology Spillovers:
Evidence from Arab Countries. ,World Development 29 (2): 2111-2125.
Sharma, Devika & Jaiswal, Pragya,(2007): The India- Africa energy partnership: prospects
and challenges, The Energy and Resource Institute, Energy Security Insights, Volume 2, Issue
3, New Delhi.
Subramanian, Ravi; Sachdeva, Charu and Morris, Sebastian (2010): FDI Outflows from
India: An Examination of the Underlying Economics, Policies and their Impacts, Working
Paper, Indian Institute of Management, Ahmedabad, No. 2010-03-01, March 2010.
UNCTAD (2006): World Investment Report 2006 – FDI from developing and transition
economies: implications for development. United Nations, New York.
Yang Yongzheng & Gupta, Santee (2005), Regional Trade Arrangements in Africa, Past
Performance and the Way Forward, African Development Review, Volume 9, Issue 3.