Forecasting the macroeconomic risk of industries and the ... · PDF fileFORECASTING THE...
28
Dr. Jakob Margolis First EViews User Meeting, Frankfurt October 22, 2014 FORECASTING THE MACROECONOMIC RISK OF INDUSTRIES AND THE PROBABILITY OF DEFAULT FOR COMPANIES IN EUROPE
Transcript of Forecasting the macroeconomic risk of industries and the ... · PDF fileFORECASTING THE...

Dr. Jakob Margolis
First EViews User Meeting, Frankfurt
October 22, 2014
FORECASTING THE MACROECONOMIC RISK
OF INDUSTRIES AND THE PROBABILITY OF
DEFAULT FOR COMPANIES IN EUROPE

11,80 15,73
AGENDA
06.11.2014 PRÄSENTATIONSNAME | REDNER2
Target: Connect a Generic Scorecard (SAS) with a Macroeconomic Model (EViews)1
Important terms: Scorecard, Risk of Industries (RI), Probability of Default (PD) and Rating2
Generic Scorecard for prediction of PD and Rating using SAS3
Macroeconomic Model for forecast of RI using EViews4
Connection between macroeconomic indicators and RI, PD, Rating 5
Simulation of Scenarios and Stresstest6

11,80 15,73
3
TARGET: CONNECT A GENERIC SCORECARD (SAS)
WITH A MACROECONOMIC MODEL (EVIEWS)
Final Raw Score for each company within a country
PD Rating
Macroeconomic model (MEM) for forecasting
the risk of industries using EViews
Risk of industries
Risk of industries = f (GDP, DAX, i ECB, Oil price, …)
Scorecard for prediction of probability of default (PD)
with risk of industries (RI) using SAS

11,80 15,73
IMPORTANT TERMS: WHAT IS RISK OF INDUSTRY (RI)
AND PROBABILITY OF DEFAULT (PD) FOR A COMPANY?
PROBABILITY OF DEFAULT FOR A COMPANY (USING SAS):
PD = F(DEM; FIN; TRD; NEG; MEM);
● DEM_variables: legal form, number of employees, age of company etc.;
● FIN_variables: revenue, profit, liabilities, etc.;
● TRD_variables: late payment, sum of invoices, paydex etc.;
● NEG_variables: audit remarks, blocked accounts etc.;
● MEM_variables: RI (Bad Rate of industry) RI = F( macroeconomic indicators )
FORECASTING THE RISK OF INDUSTRY PER QUARTER (USING EVIEWS):
RI_q = Bad_rate_q = bankruptcy in industry_q / active company_q =
F (GDP(t), Interest Rate of ECB(t), Inflation rate(t), DAX-30(t), Euro/USD(t); Oil price(t), ...)
4
Sco
rec
ard
for
pre
dic
tion o
f
PD
an
d r
atin
g (
SA
S)
ME
M f
or
risk o
f
industr
y(E
Vie
ws
)

11,80 15,73
5
TARGET: CONNECT A GENERIC SCORECARD (SAS)
WITH A MACROECONOMIC MODEL (EVIEWS)
Country-Database with all available information (microeconomic variables)
SAS: Risk-Model split (e.g. based on “number of employees”)
1: Small companies: 1-9 employees 2: Big companies: 10+ employees
Dem1 Score11
Fin1
Score12
Trade1 Score13
Neg1 Score14
Dem2 Score2
1
Fin2 Score2
2
Trade2 Score2
3
Neg2 Score2
4
Score_small: D1;F1;T1;N1 Score_big: D2;F2;T2;N2
We use Eviews for modelling Risk of industry (RI):
Macroeconomic modul: RI = f(GDP, DAX-30, i ECB, Oil price,… )
Raw Score_small Raw Score_big
Statistical based overrides
Final Raw Score for each company within a country PD Rating
Sco
rec
ard
for
pre
dic
tion o
f
PD
and
rating (
SA
S)
ME
M f
or
risk o
f
industr
y(E
Vie
ws
)

11,80 15,73
6
EXAMPLE-1: MICRO-ECONOMIC INDICATOR (E.G. AGE OF COMPANY)
IN GENERIC SCORECARD:
UNIVARIATE ANALYSIS FOR DEMOGRAPHIC INDICATOR - AGE OF COMPANY (YEARS)
Demographic Modul: age of company
6,32%
1,31%
4,10%
2,66%
2,59%
1,93%
2,43%
2,27%
1,00%
1,14%
1,94%
1,33%
0,34%
0,72%
1,34%
1,65%
0,91%
1,30%
1,64%
0,00% 1,00% 2,00% 3,00% 4,00% 5,00% 6,00% 7,00%
MISSING
0 -<2
2 -<3
3 -<4
4 -<5
5 -<6
6 -<7
7 -<8
8 -<9
9 -<10
10 -<11
11 -<12
12 -<13
13 -<14
14 -<16
16 -<17
17 -<19
19 -<20
20+
% Bad Rate in small groups
4,10%
2,19%
1,22%
0,00% 1,00% 2,00% 3,00% 4,00% 5,00%
MIS, 0 -<5
5 -<8
8 +
% Bad Rate after grouping adjustment
Failure risk decreases after 8 years in the market.

11,80 15,73
EXAMPLE 2 – GENERIC SCORECARD:
RISK OF INDUSTRIES IN COUNTRY (CENTRAL EUROPE)
Industry NACE Industry Description GOODS BADS PGOODS PBADS BAD RATE WOE POP% AVG_BR
A Agriculture 3235 91 0.95% 0.72% 2.74% 0.28 0.95% 3.60%
B Mining 335 4 0.10% 0.03% 1.18% 1.14 0.10%
C Manufacturing 46410 1379 13.70% 10.91% 2.89% 0.23 13.60%
D Energy 1679 39 0.50% 0.31% 2.27% 0.47 0.49%
E Water service 1087 43 0.32% 0.34% 3.81% -0.06 0.32%
F Construction 54695 3045 16.14% 24.09% 5.27% -0.40 16.43%
G Trade 68139 2322 20.11% 18.37% 3.30% 0.09 20.05%
H Transport & Logistic 23732 903 7.00% 7.14% 3.67% -0.02 7.01%
I Hotels & Gastronomie 20683 898 6.10% 7.10% 4.16% -0.15 6.14%
J Information and communication 15990 508 4.72% 4.02% 3.08% 0.16 4.69%
K Finance & Insurance 2972 163 0.88% 1.29% 5.20% -0.39 0.89%
L Estate 6763 174 2.00% 1.38% 2.51% 0.37 1.97%
M Freelance 59171 1801 17.46% 14.25% 2.95% 0.20 17.35%
N Business Service 11684 501 3.45% 3.96% 4.11% -0.14 3.47%
R Arts 5993 285 1.77% 2.25% 4.54% -0.24 1.79%
S Other Services 16234 486 4.79% 3.84% 2.91% 0.22 4.76%
TOTAL 338802 12642 1 1
7

11,80 15,73
8
MEM: COLLECTION OF MACROECONOMIC INDICATORS ON 5 LEVELS
1. INDUSTRY LEVEL (SIC OR NACE OR WZ): INDUSTRY RISK, PRODUCTION INDEX, TURNOVER PER
INDUSTRY, GROSS VALUE ADDED…
2. STATE LEVEL: BUNDESLAND IN GERMANY, WOJWODZTWO IN POLAND, KANTON IN SWITZERLAND,
MEGYE IN HUNGARY;… e.g. UNEMPLOYMENT PER STATE;
3. COUNTRY LEVEL: TIME SERIES ANALYSIS: TIME (t) = 42 QUARTERS (the more the merrier:)
• GDP(t);
• DAX-30(t);
• Inflation rate(t);
• Government deficit(t) <= -3% (Basel III)
• unemployment(t);
• etc.
4. EUROPA LEVEL: INTEREST RATE (t) OF EUROPE CENTRAL BANK (ECB)
5. GLOBAL LEVEL: EURO/USD (t), OIL PRICE (t), DOW JONES INDEX(t)…

11,80 15,73
EXAMPLE 3 – MEM: GDP FOR GERMANY IN BILLION € PER QUARTER
9
Financial crisis
Source: German Statistical Office

11,80 15,73
SIC-CODES
10-14: MINING
& ENERGY
(OIL,GAS);
10..14Mining
1011 Iron ores
1021 Copper ores
1031 Lead & zinc ores
1041 Gold ores
1044 Silver ores
1061 Ferroalloy ores exc. vanadium
1081 Metal mining services
1094 Uranium, radium & vanadium ores
1099 Miscellaneous metal ores N.E.C.
12 Coal Mining
1221 Bituminous coal & lignite surface mining
1222 Bituminous coal underground mining
1231 Anthracite mining
1241 Coal mining services
13 Oil and Gas Extraction
1311 Crude petroleum & natural gas
1321 Natural gas liquids
10
1381 Drilling oil & gas wells
1382 Oil & gas field exploration services
1389 Oil & gas field services N.E.C.
14
Mining & Quarrying of Non-metallic Minerals exc.
Fuels
1411 Dimension stone
1422 Crushed & broken limestone
1423 Crushed & broken granite
1429 Crushed & broken stone N.E.C.
1442 Construction sand & gravel
1446 Industrial sand
1455 Kaolin & ball clay
1459 Clay, ceramic & refractory minerals N.E.C
1474 Potash, soda & borate minerals
1475 Phosphate rock
1479 Chemical & fertilizer mineral N.E.C.
1481 Non-metallic mineral services exc. fuels
1499 Misc. non-metallic minerals exc. fuels
EXAMPLE 4 – RISK OF INDUSTRY:
FAILURE RATE (BR) PER YEAR FOR MINING & ENERGY IN GERMANY
Source: Bisnode Data

11,80 15,73
EXAMPLE 4 – RISK OF INDUSTRY:
FAILURE RATE (BR) PER YEAR FOR MINING & ENERGY IN GERMANY
11
0,00%
0,50%
1,00%
1,50%
2,00%
2,50%
3,00%
2000 2001 2002 2003 2004 2005 2006 2007 2008 2009
SIC=10_14 = Mining & Energy (Oil, Gas, without Electricity)
Failure rate (BR) per year
Risk of mining & energy industry has increased
Source: Bisnode Data

11,80 15,73
EXTRACTION
OF INDIVIDUAL
INDUSTRIES
POSSIBLE
10..14Mining
1011 Iron ores
1021 Copper ores
1031 Lead & zinc ores
1041 Gold ores
1044 Silver ores
1061 Ferroalloy ores exc. vanadium
1081 Metal mining services
1094 Uranium, radium & vanadium ores
1099 Miscellaneous metal ores N.E.C.
12 Coal Mining
1221 Bituminous coal & lignite surface mining
1222 Bituminous coal underground mining
1231 Anthracite mining
1241 Coal mining services
13 Oil and Gas Extraction
1311 Crude petroleum & natural gas
1321 Natural gas liquids
12
1381 Drilling oil & gas wells
1382 Oil & gas field exploration services
1389 Oil & gas field services N.E.C.
14
Mining & Quarrying of Non-metallic Minerals exc.
Fuels
1411 Dimension stone
1422 Crushed & broken limestone
1423 Crushed & broken granite
1429 Crushed & broken stone N.E.C.
1442 Construction sand & gravel
1446 Industrial sand
1455 Kaolin & ball clay
1459 Clay, ceramic & refractory minerals N.E.C
1474 Potash, soda & borate minerals
1475 Phosphate rock
1479 Chemical & fertilizer mineral N.E.C.
1481 Non-metallic mineral services exc. fuels
1499 Misc. non-metallic minerals exc. fuels
EXAMPLE 4 – RISK OF INDUSTRY:
FAILURE RATE (BR) PER YEAR FOR MINING & ENERGY IN GERMANY
Source: Bisnode Data
11,80 15,73
06.11.2014 STORM VERSORGER | JAKOB MARGOLIS
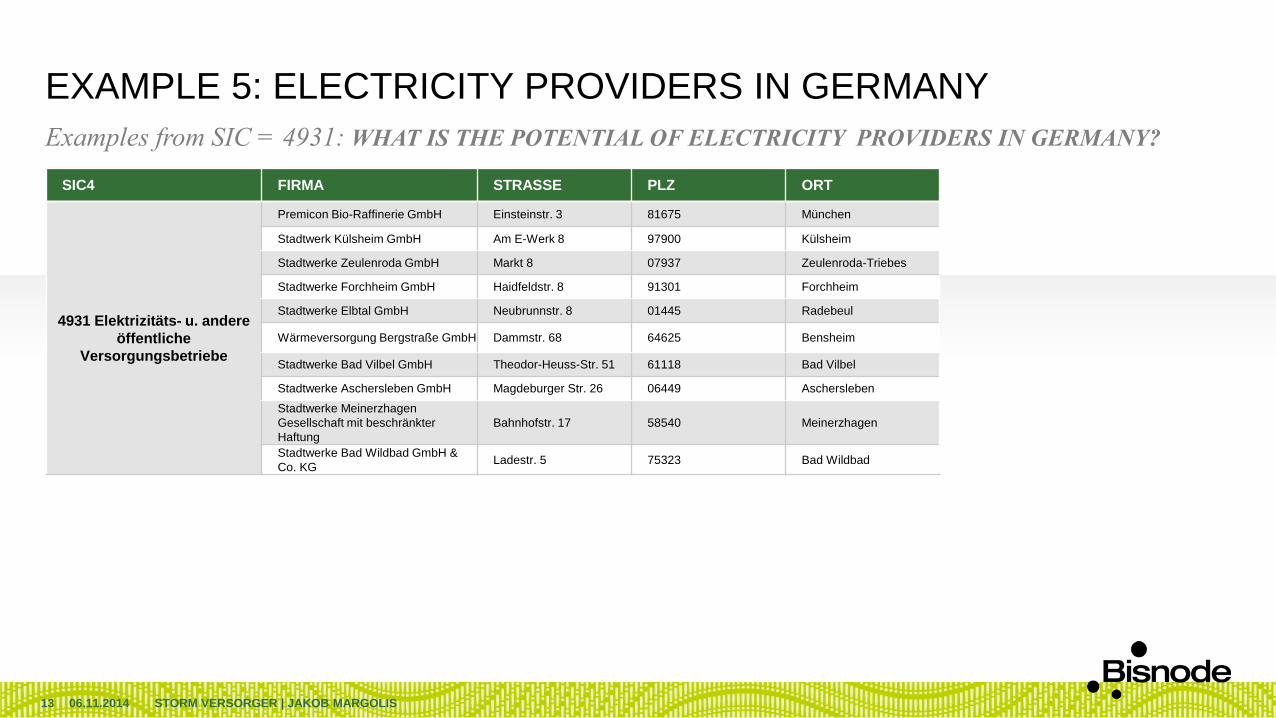
EXAMPLE 5: ELECTRICITY PROVIDERS IN GERMANY
Examples from SIC = 4931: WHAT IS THE POTENTIAL OF ELECTRICITY PROVIDERS IN GERMANY?
13
SIC4 FIRMA STRASSE PLZ ORT
4931 Elektrizitäts- u. andere
öffentliche
Versorgungsbetriebe
Premicon Bio-Raffinerie GmbH Einsteinstr. 3 81675 München
Stadtwerk Külsheim GmbH Am E-Werk 8 97900 Külsheim
Stadtwerke Zeulenroda GmbH Markt 8 07937 Zeulenroda-Triebes
Stadtwerke Forchheim GmbH Haidfeldstr. 8 91301 Forchheim
Stadtwerke Elbtal GmbH Neubrunnstr. 8 01445 Radebeul
Wärmeversorgung Bergstraße GmbH Dammstr. 68 64625 Bensheim
Stadtwerke Bad Vilbel GmbH Theodor-Heuss-Str. 51 61118 Bad Vilbel
Stadtwerke Aschersleben GmbH Magdeburger Str. 26 06449 Aschersleben
Stadtwerke Meinerzhagen
Gesellschaft mit beschränkter
Haftung
Bahnhofstr. 17 58540 Meinerzhagen
Stadtwerke Bad Wildbad GmbH &
Co. KGLadestr. 5 75323 Bad Wildbad

11,80 15,73
POTENTIAL FOR ELECTRIC & OTHER SERVICES COMBINED
Example 5: Potential of Electricity Providers in Germany = 690 companies
06.11.2014 STORM VERSORGER | JAKOB MARGOLIS14
SIC4 BEZEICHNUNG ANZAHL
4931Elektrizitäts- u. andere öffentliche
Versorgungsbetriebe688
4925Erzeugung u. Verteilung von
Misch-, Stadt- u. Flüssiggas1
4911Elektrizitätsgesellschaften u. -
Systeme1
3593 Zylinder, Stellantriebe 0
3341Zweitschmelzen u. Läutern von
Nichteisenmetallen0
6081Zweigstellen u. Vertretungen
ausländischer Banken0
2652 Zusammensetzbare Kartons 0
3281Zugeschnittene Steine u.
Steinprodukte, Kalkstein, Marmor0
0133 Zuckerpflanzen (-rohr, -rüben) 0
0174 Zitrusfrüchte 0
0%
10%
20%
30%
40%
50%
60%
70%
80%
90%
100%
4931 4925 4911 3593 3341 6081 2652 3281 0133 0174
99,7%
0,1% 0,1% 0,0% 0,0% 0,0% 0,0% 0,0% 0,0% 0,0%

11,80 15,73
DISTRIBUTION OF ELECTRIC COMPANIES PER EMPLOYEES
Example 5: Most Electricity providers in Germany have between 20 and 99 employees
06.11.2014 STORM VERSORGER | JAKOB MARGOLIS15
GRÖßE NACH
MITARBEITERNANZAHL ANTEIL
A) 1 - 4 123 18%
B) 5 - 9 33 5%
C) 10 - 19 59 9%
D) 20 - 49 141 20%
E) 50 - 99 157 23%
F) 100 - 199 81 12%
G) 200 - 499 43 6%
H) 500 - 999 15 2%
I) >= 1000 12 2%
J) k.A. 26 4%
2%
2%
6%
12%
23%
20%
9%
5%
18%
0% 5% 10% 15% 20% 25%
I) >= 1000
H) 500 - 999
G) 200 - 499
F) 100 - 199
E) 50 - 99
D) 20 - 49
C) 10 - 19
B) 5 - 9
A) 1 - 4
Anteil der Unternehmen
11,80 15,73
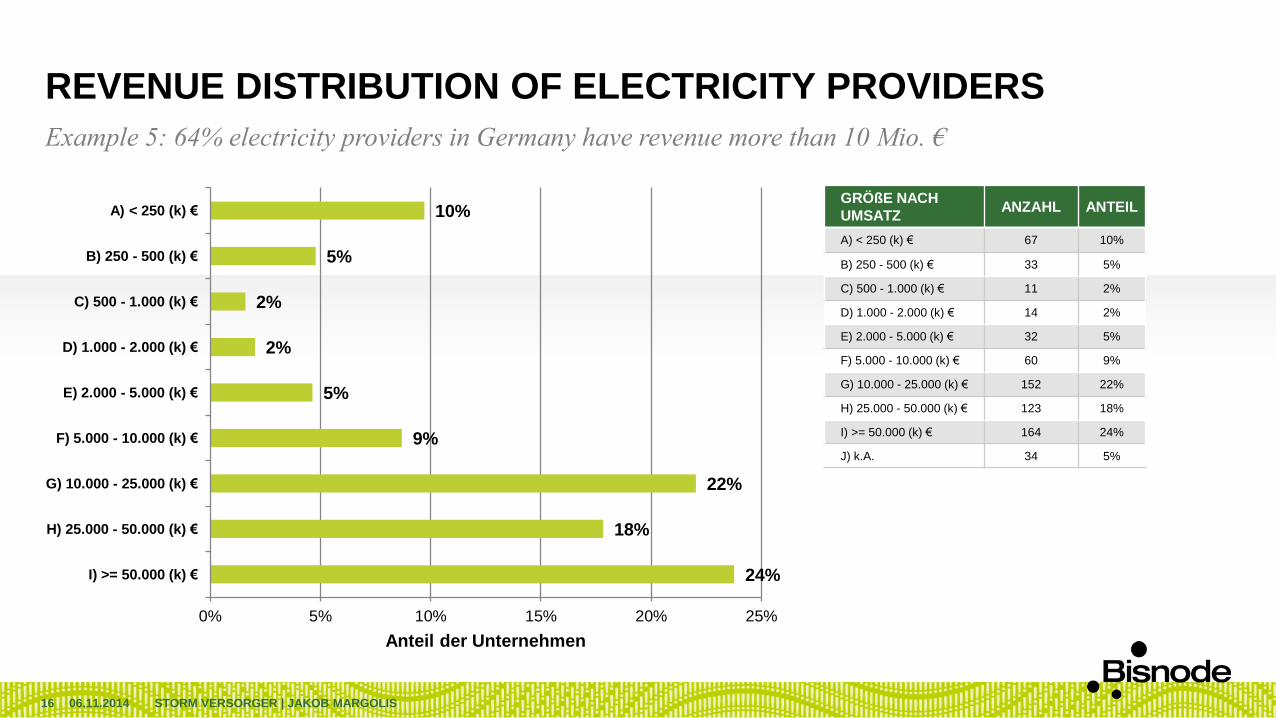
REVENUE DISTRIBUTION OF ELECTRICITY PROVIDERS
Example 5: 64% electricity providers in Germany have revenue more than 10 Mio. €
06.11.2014 STORM VERSORGER | JAKOB MARGOLIS16
GRÖßE NACH
UMSATZANZAHL ANTEIL
A) < 250 (k) € 67 10%
B) 250 - 500 (k) € 33 5%
C) 500 - 1.000 (k) € 11 2%
D) 1.000 - 2.000 (k) € 14 2%
E) 2.000 - 5.000 (k) € 32 5%
F) 5.000 - 10.000 (k) € 60 9%
G) 10.000 - 25.000 (k) € 152 22%
H) 25.000 - 50.000 (k) € 123 18%
I) >= 50.000 (k) € 164 24%
J) k.A. 34 5%
24%
18%
22%
9%
5%
2%
2%
5%
10%
0% 5% 10% 15% 20% 25%
I) >= 50.000 (k) €
H) 25.000 - 50.000 (k) €
G) 10.000 - 25.000 (k) €
F) 5.000 - 10.000 (k) €
E) 2.000 - 5.000 (k) €
D) 1.000 - 2.000 (k) €
C) 500 - 1.000 (k) €
B) 250 - 500 (k) €
A) < 250 (k) €
Anteil der Unternehmen

11,80 15,73
AGE OF COMPANIES (ELECTRICITY PROVIDERS)
Example 5: 52% electricity providers have age of comp. between 1 and 9 years (Libiralization law => 2005)
06.11.2014 STORM VERSORGER | JAKOB MARGOLIS17
UNTERNEHMENS-
ALTERANZAHL ANTEIL
A) 1 - 2 29 4%
B) 3 - 5 85 12%
C) 6 - 9 247 36%
D) 10 -14 54 8%
E) 15 - 19 68 10%
F) 20 - 29 88 13%
G) 30 - 49 27 4%
H) 50 - 99 40 6%
I) >= 100 26 4%
J) k.A. 26 4%
4%
6%
4%
13%
10%
8%
36%
12%
4%
0% 5% 10% 15% 20% 25% 30% 35% 40%
I) >= 100
H) 50 - 99
G) 30 - 49
F) 20 - 29
E) 15 - 19
D) 10 -14
C) 6 - 9
B) 3 - 5
A) 1 - 2
Anteil der Unternehmen
11,80 15,73
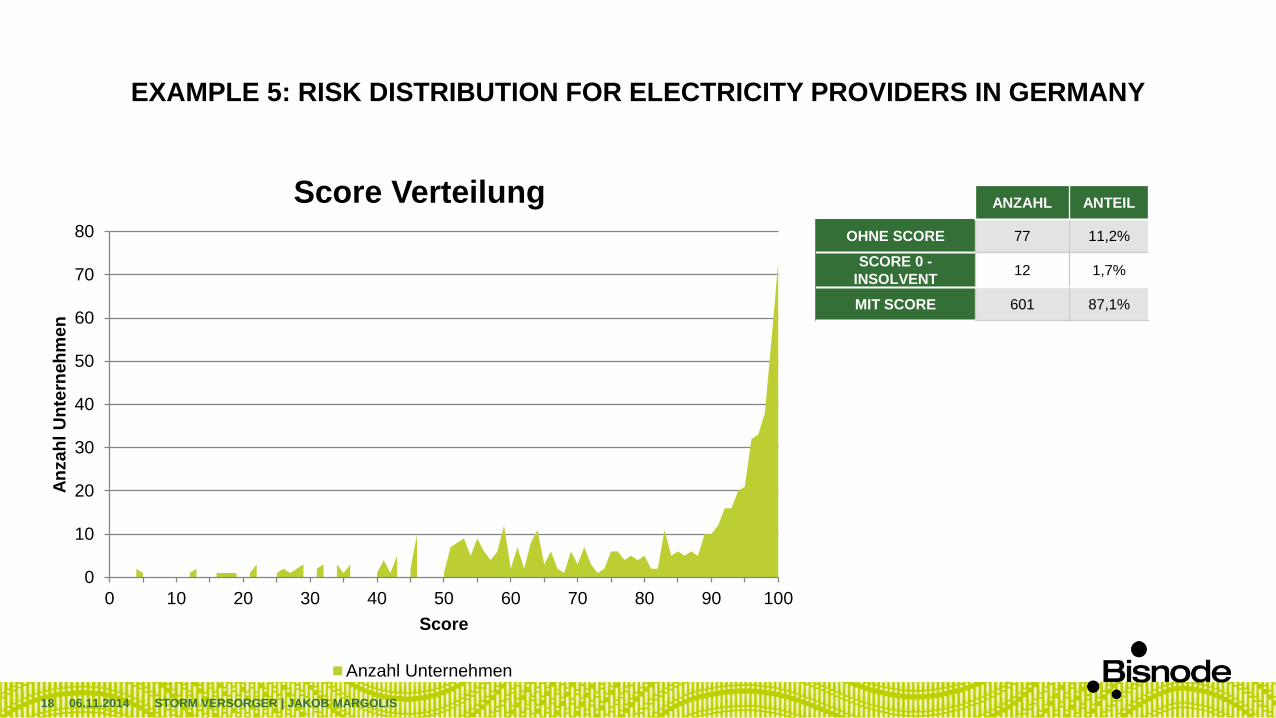
EXAMPLE 5: RISK DISTRIBUTION FOR ELECTRICITY PROVIDERS IN GERMANY
06.11.2014 STORM VERSORGER | JAKOB MARGOLIS18
0
10
20
30
40
50
60
70
80
0 10 20 30 40 50 60 70 80 90 100
An
za
hl
Un
tern
eh
me
n
Score
Score Verteilung
Anzahl Unternehmen
ANZAHL ANTEIL
OHNE SCORE 77 11,2%
SCORE 0 -
INSOLVENT12 1,7%
MIT SCORE 601 87,1%

11,80 15,73
EXAMPLE 6 - CONNECTION BETWEEN MACROECONOMIC INDICATOR
(DAX-30) AND INDUSTRY RISK (BAD RATE) OF CONSTRUCTION
19
0,0000%
20,0000%
40,0000%
60,0000%
80,0000%
100,0000%
120,0000%
140,0000%
DAX-30 Failure rate (BR)
Risk (BR) of construction industry in Germany and DAX-30:

11,80 15,73
EXAMPLE 7: GOVERNMENT DEFICIT (IN %) FROM INSOLV. RATE (AVG IN %)
FOR ALL COMPANIES IN GERMANY
Germany: Govern.deficit of insolv.rate
Year Government deficit% of GDP* Insolv_rate_of stat.office%**
2000 1.3 0.91
2001 - 2.8 1.04
2002 - 3.7 1.21
2003 - 4.0 1.27
2004 - 3.8 1.26
2005 - 3.3 1.19
2006 - 1.6 1.1
2007 0.3 0.94
2008 0.1 0.94
2009 - 3.0 1.05
2010 - 3.3 1.03
Table and Charts of BSG, Bisnode Holding Germany
*Europe Commission, Eurostat 8.07.2011
** Statistical office of Germany, 30.03.2011
Active companies =3,1 Mio.
Year
Insolvency companies of
st.office
IR=Insolv.comp./Active
comp. comments
2010 31998 1.03%
2009 32687 1.05% Fin.crisis 2
2008 29291 0.94%
2007 291600.94%
the best
year
2006 34137 1.10%
2005 36843 1.19%
2004 39213 1.26%
2003 39320 1.27% Fin.crisis 1
2002 37579 1.21%
2001 32278 1.04%
2000 28235 0.91%
0
0,2
0,4
0,6
0,8
1
1,2
1,4
- 05
- 04
- 03
- 02
- 01
00
01
02
20002001200220032004200520062007200820092010
Staatl.Defizitquote%
Insolvenzquote_StBA%
Insolv_rate (BR%)
of stat.office
Gernamy
Government
deficit%
20
11,80 15,73
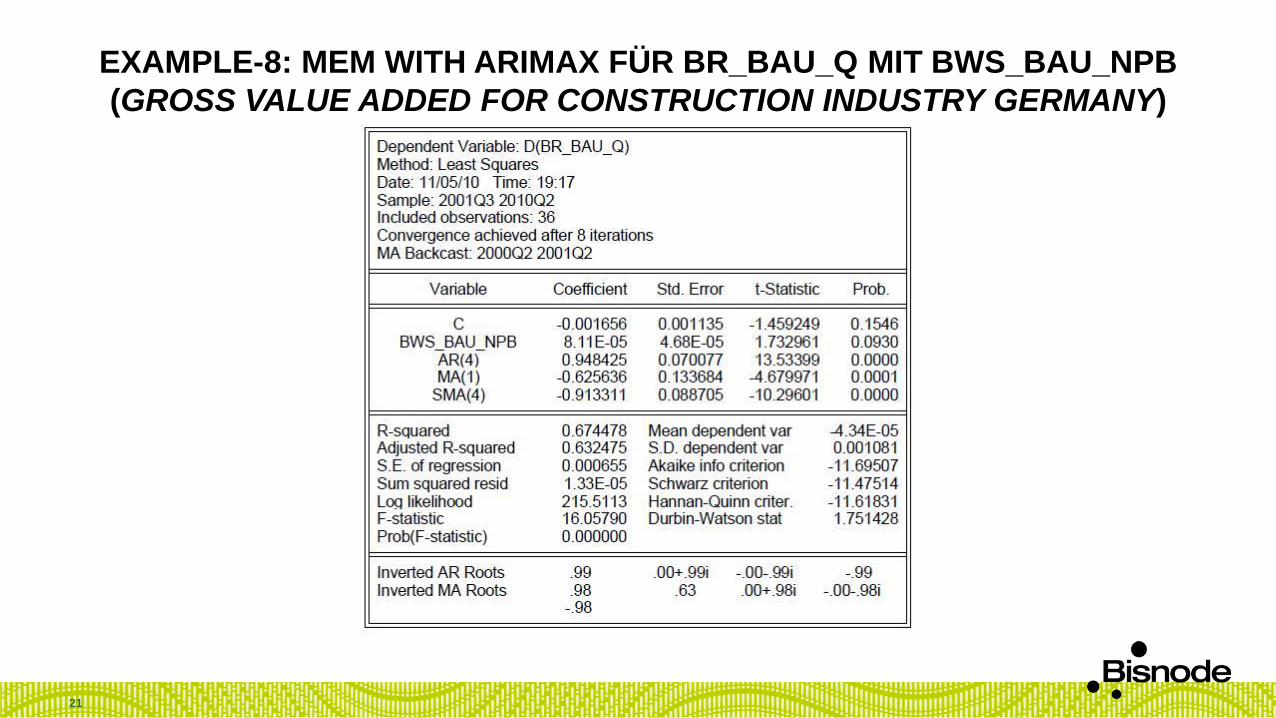
EXAMPLE-8: MEM WITH ARIMAX FÜR BR_BAU_Q MIT BWS_BAU_NPB
(GROSS VALUE ADDED FOR CONSTRUCTION INDUSTRY GERMANY)
21

11,80 15,73
EXAMPLE-9: MEM WITH VECTOR AUTOREGRESSION (VAR)BR_FIN_Q, BWS_FIN, DAX30, BIP, ZINSEN_EZB, EURO/USD
MAIN PROBLEM IS RELATIONSHIP BETWEEN HISTORY SAMPLE (E.G. 42 Q), 6 VARIABLES AND TERMS IN VAR-MODEL
22
11,80 15,73
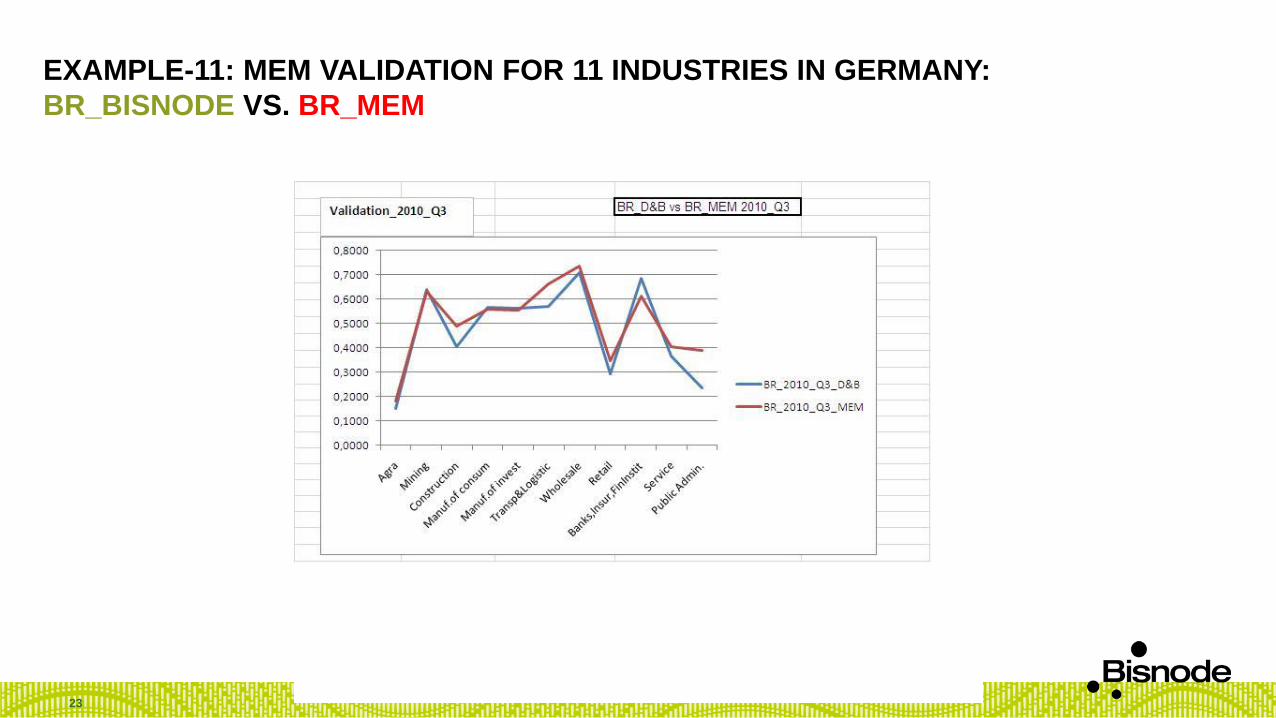
EXAMPLE-11: MEM VALIDATION FOR 11 INDUSTRIES IN GERMANY:
BR_BISNODE VS. BR_MEM
23
11,80 15,73
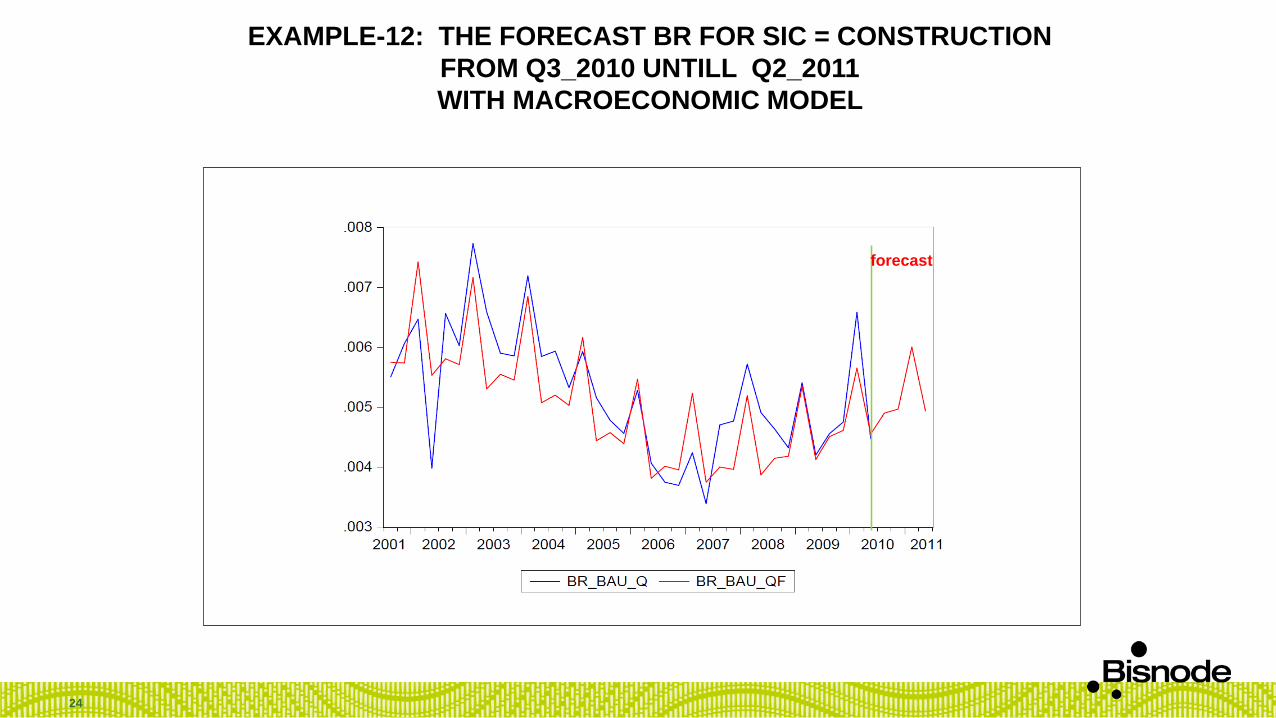
EXAMPLE-12: THE FORECAST BR FOR SIC = CONSTRUCTION
FROM Q3_2010 UNTILL Q2_2011
WITH MACROECONOMIC MODEL
24
forecast

11,80 15,73
EXAMPLE-13: GENERIC SCORECARD WITH MICRO- AND MACRO-ECONOMIC INDICATORS
FINAL MODEL CONSISTS OF THE FOLLOWING VARIABLES:
PD_COMPANY = F(SCORE_TOTAL) = (BASED ON MICRO-ECONOMIC INDICATORS: AGE, EMPLOY., REVENUE, PROFIT, TRADE, NEG. REM)
RISK OF INDUSTRY (BR OR WOE);
STATE UNEMPLOYMENT, ECT.
25
Significan.
Standard Wald criteria
Error Chi-Square t-statistic
Intercept 1 -19,5011 0,34830 3135,41 <.0001 -55,99
score_total 1 0,0172 0,00026 4237,70 <.0001 65,15 signific.
SIC/Risk (WoE) 1 0,5878 0,04650 159,52 <.0001 12,64 signific.
unemployment/state 1 -0,0043 0,00061 49,12 <.0001 -7,02 signific.
Analysis of Maximum Likelihood Estimates
Parameter DF Estimate Pr > ChiSq
Macro-economic indicators
(GDP, DAX-30, Oil prise…)

11,80 15,73
EXAMPLE 14: SIMULATION OF SCENARIOS AND STRESSTEST
SCENARIO 1
WHAT WILL HAPPEN TO PD AND RATING OF
A TRANSPORT COMPANY
IF STRESSTEST (SHOCK):
OIL PRICE DECREASES TO $60 PER BARREL?
OIL PRICE = $60 VAR-MODEL RI
SCORECARD PD RATING OF COMPANY
RISK MIGRATION MATRIX FROM NOW TO
4 QUARTERS FORWARD
SCENARIO 2
WHAT WILL HAPPEN TO PD AND RATING OF
A FINANCIAL COMPANY
IF STRESSTEST (SHOCK):
THE ECB INTEREST RATE INCREASES TO 4%?
INTEREST RATE = 4% VAR-MODEL RI
SCORECARD PD RATING OF COMP.
RISK MIGRATION MATRIX FROM NOW TO
4 QUARTERS FORWARD
26

11,80 15,73
„FIGURES FIRST, WORDS SECOND“
CONTACT:
DR. JAKOB MARGOLIS
SENIOR MODELER
MARKETING & RISK
BISNODE DEUTSCHLAND GMBH
TEL.: +49 (0)6151 380 628
MOBIL: +49 (0)151 58029567
E-MAIL: [email protected]
ADRESSE: ROBERT-BOSCH-STRAßE 11
64293 DARMSTADT
WWW.BISNODE.DE
27

11,80 15,73
28