FORECASTING MUAR RIVER WATER QUALITY USING RADIAL...
22
FORECASTING MUAR RIVER WATER QUALITY USING RADIAL BASIS FUNCTION NEURAL NETWORK MOHD RAZI BIN ABD JALAL A thesis submitted in fulfilment of the requirements for the award of the degree of Master of Engineering (Electrical) Faculty of Electrical Engineering Universiti Teknologi Malaysia DECEMBER 2013
Transcript of FORECASTING MUAR RIVER WATER QUALITY USING RADIAL...

FORECASTING MUAR RIVER WATER QUALITY USING
RADIAL BASIS FUNCTION NEURAL NETWORK
MOHD RAZI BIN ABD JALAL
A thesis submitted in fulfilment of the
requirements for the award of the degree of
Master of Engineering (Electrical)
Faculty of Electrical Engineering
Universiti Teknologi Malaysia
DECEMBER 2013
iii
To my beloved mother,
Fauziah Abdullah
My late father,
Abd Jalal Abd Hamid
To my beloved grandmother,
Sapiah Lisah
To my supportive wife,
Nor Azlin Halib
and my lovely daughters,
Ummi Aqilah and Ummi Ajwa Safiyyah
For their Sacrifice, Encouragements and Blessing....

iv
ACKNOWLEDGEMENT
The authors would like to express their gratitude to Universiti Teknologi
Malaysia and the Ministry of Education (formerly known as Ministry of Higher
Education) for providing the facilities and financial assistance to conduct this
research. The authors also would like to thank to my supervisors, Dr.Shahrum Shah
Bin Abdullah for his support and patience and to Syarikat Air Johor Holdings
(SAJH) especially to Mr. Nur Firdaus Mohd Daud for providing raw water quality
data. The authors would also like to thank reviewers for their valuable comments.
v
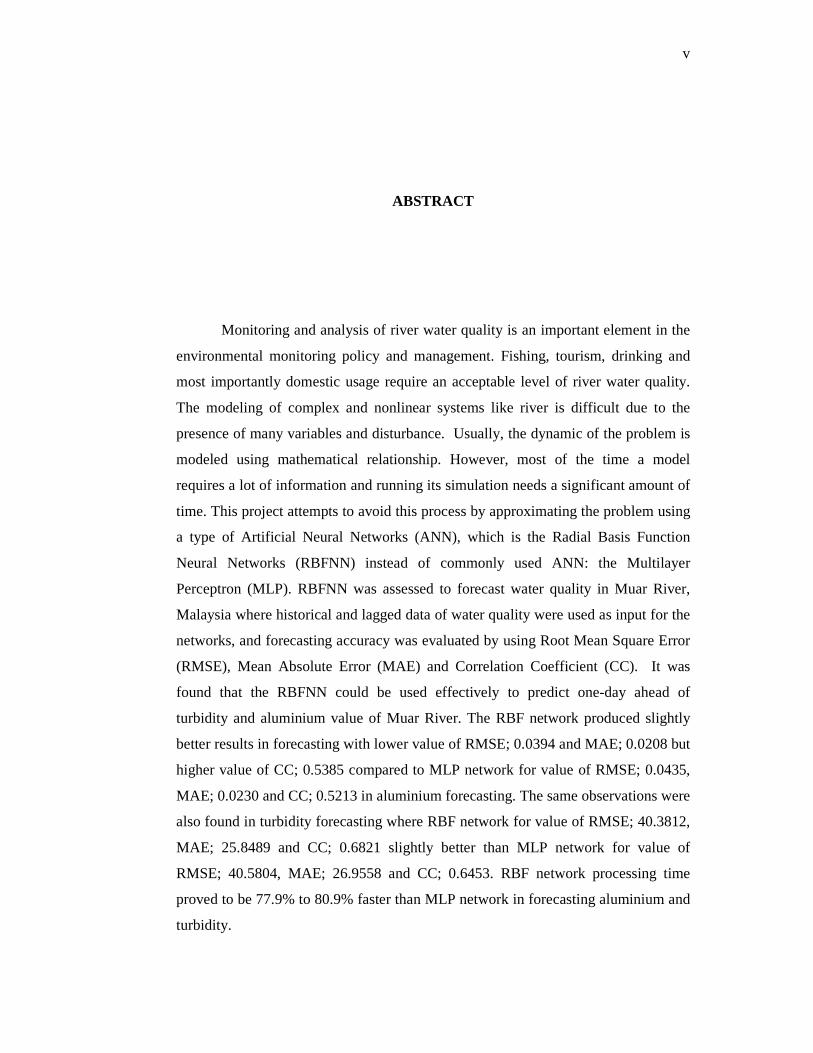
ABSTRACT
Monitoring and analysis of river water quality is an important element in the
environmental monitoring policy and management. Fishing, tourism, drinking and
most importantly domestic usage require an acceptable level of river water quality.
The modeling of complex and nonlinear systems like river is difficult due to the
presence of many variables and disturbance. Usually, the dynamic of the problem is
modeled using mathematical relationship. However, most of the time a model
requires a lot of information and running its simulation needs a significant amount of
time. This project attempts to avoid this process by approximating the problem using
a type of Artificial Neural Networks (ANN), which is the Radial Basis Function
Neural Networks (RBFNN) instead of commonly used ANN: the Multilayer
Perceptron (MLP). RBFNN was assessed to forecast water quality in Muar River,
Malaysia where historical and lagged data of water quality were used as input for the
networks, and forecasting accuracy was evaluated by using Root Mean Square Error
(RMSE), Mean Absolute Error (MAE) and Correlation Coefficient (CC). It was
found that the RBFNN could be used effectively to predict one-day ahead of
turbidity and aluminium value of Muar River. The RBF network produced slightly
better results in forecasting with lower value of RMSE; 0.0394 and MAE; 0.0208 but
higher value of CC; 0.5385 compared to MLP network for value of RMSE; 0.0435,
MAE; 0.0230 and CC; 0.5213 in aluminium forecasting. The same observations were
also found in turbidity forecasting where RBF network for value of RMSE; 40.3812,
MAE; 25.8489 and CC; 0.6821 slightly better than MLP network for value of
RMSE; 40.5804, MAE; 26.9558 and CC; 0.6453. RBF network processing time
proved to be 77.9% to 80.9% faster than MLP network in forecasting aluminium and
turbidity.
vi
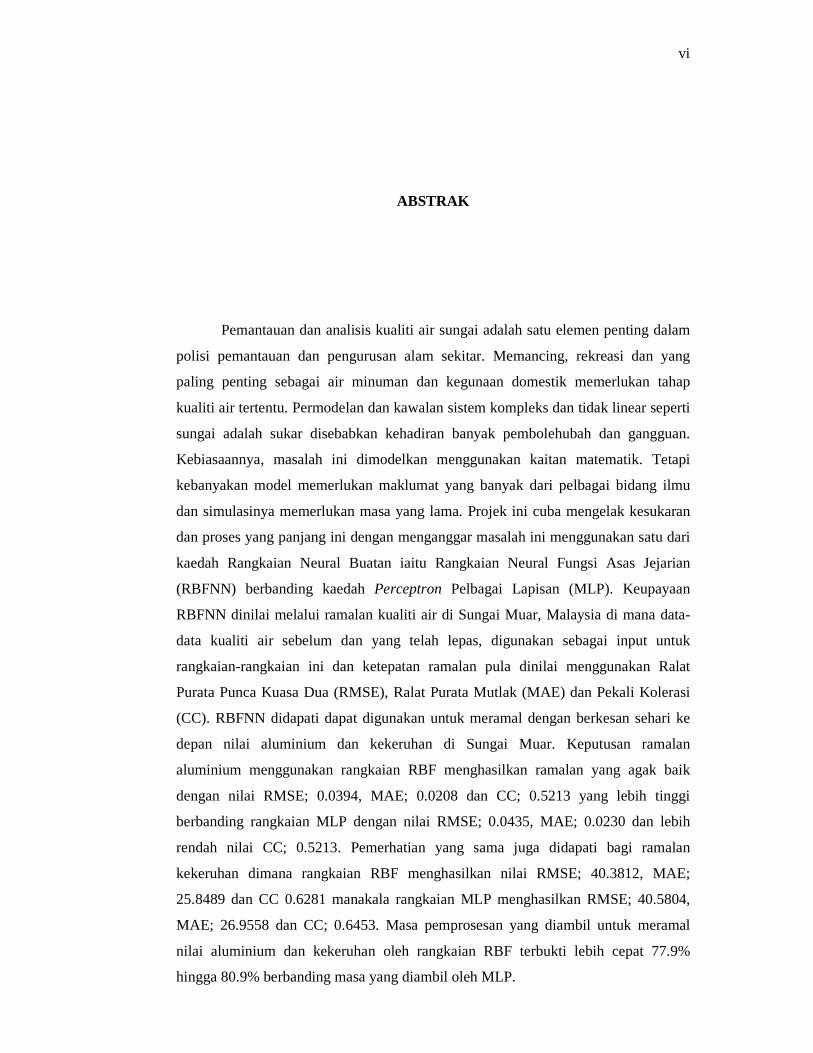
ABSTRAK
Pemantauan dan analisis kualiti air sungai adalah satu elemen penting dalam
polisi pemantauan dan pengurusan alam sekitar. Memancing, rekreasi dan yang
paling penting sebagai air minuman dan kegunaan domestik memerlukan tahap
kualiti air tertentu. Permodelan dan kawalan sistem kompleks dan tidak linear seperti
sungai adalah sukar disebabkan kehadiran banyak pembolehubah dan gangguan.
Kebiasaannya, masalah ini dimodelkan menggunakan kaitan matematik. Tetapi
kebanyakan model memerlukan maklumat yang banyak dari pelbagai bidang ilmu
dan simulasinya memerlukan masa yang lama. Projek ini cuba mengelak kesukaran
dan proses yang panjang ini dengan menganggar masalah ini menggunakan satu dari
kaedah Rangkaian Neural Buatan iaitu Rangkaian Neural Fungsi Asas Jejarian
(RBFNN) berbanding kaedah Perceptron Pelbagai Lapisan (MLP). Keupayaan
RBFNN dinilai melalui ramalan kualiti air di Sungai Muar, Malaysia di mana data-
data kualiti air sebelum dan yang telah lepas, digunakan sebagai input untuk
rangkaian-rangkaian ini dan ketepatan ramalan pula dinilai menggunakan Ralat
Purata Punca Kuasa Dua (RMSE), Ralat Purata Mutlak (MAE) dan Pekali Kolerasi
(CC). RBFNN didapati dapat digunakan untuk meramal dengan berkesan sehari ke
depan nilai aluminium dan kekeruhan di Sungai Muar. Keputusan ramalan
aluminium menggunakan rangkaian RBF menghasilkan ramalan yang agak baik
dengan nilai RMSE; 0.0394, MAE; 0.0208 dan CC; 0.5213 yang lebih tinggi
berbanding rangkaian MLP dengan nilai RMSE; 0.0435, MAE; 0.0230 dan lebih
rendah nilai CC; 0.5213. Pemerhatian yang sama juga didapati bagi ramalan
kekeruhan dimana rangkaian RBF menghasilkan nilai RMSE; 40.3812, MAE;
25.8489 dan CC 0.6281 manakala rangkaian MLP menghasilkan RMSE; 40.5804,
MAE; 26.9558 dan CC; 0.6453. Masa pemprosesan yang diambil untuk meramal
nilai aluminium dan kekeruhan oleh rangkaian RBF terbukti lebih cepat 77.9%
hingga 80.9% berbanding masa yang diambil oleh MLP.
vii
TABLE OF CONTENTS
CHAPTER TITLE
PAGE
DECLARATION ii
DEDICATION iii
ACKNOWLEDGEMENT iv
ABSTRACT v
ABSTRAK vi
TABLE OF CONTENTS vii
LIST OF TABLES ix
LIST OF FIGURES xi
LIST OF SYMBOLS xv
LIST OF ABBREVIATIONS xvi
LIST OF APPENDICES xvii
1 INTRODUCTION
1.1 Project Background
1.2 Problem Statement
1.3 Project Objective
1.4 Scope of the Project
1.5 Academic Contributions
1.6 Organization of Thesis
1
2
2
3
3
4
2 LITERATURE REVIEW
2.1 ANN in Water Resource Applications
2.2 River Water Quality
2.2.1 River Water Quality Parameter
2.3 Radial Basis Function Neural Networks
5
7
7
11
viii
3 DATA SET AND METHODOLOGY
3.1 Introduction
3.2 Data Set and Location
3.3 Methodology
3.3.1 Data Pre-Processing
3.3.2 Data Partitioning
3.3.3 Data Assembly
3.3.4 RBF Neural Network Design
3.3.5 Forecasting Performance Evaluation
3.3.6 RBF Network Training, Testing and Validation
3.3.7 RBF Network Settings Optimization
3.3.8 Comparison with MLP
15
15
21
21
24
26
30
32
34
36
39
4 RESULTS AND DISCUSSION
4.1 Introduction
4.2 Aluminium Networks
4.2.1 Aluminium RBF Network Settings Optimization
4.2.2 Aluminium MLP Network
4.2.3 Summary and Discussion
4.3 Turbidity Networks
4.3.1 Turbidity RBF Network Settings Optimization
4.3.2 Turbidity MLP Network
4.3.3 Summary and Discussion
41
42
42
52
53
64
64
73
74
5 CONCLUSIONS AND RECOMMENDATION
5.1 Conclusions
5.2 Recommendations
84
85
REFERENCES 86
Appendices A – B 91-117

ix
LIST OF TABLES
TABLE NO. TITLE PAGE
3.1 Summary of water quality data available 16
3.2 Summary of water quality data of Gombang WTP 19
3.3 Variable for water quality parameter 26
3.4 Description of input output vector matrices 30
3.5 Description of rbf neural network design 32
4.1 RMSE, MAE & CC results for data size tuning of
aluminium network
43
4.2 RMSE, MAE CC results for past day optimization of
aluminium network
45
4.3 RMSE, MAE & CC results for spread, β optimization of
aluminium network
47
4.4 RMSE, MAE and CC results of aluminium MLP networks 52
4.5 Summary result of aluminium network for Gombang
WTP
53
4.6 Overall RMSE, MAE and CC for aluminium network 54
4.7 Summary comparison between RBF and MLP for
aluminium forecasting
61
4.8 RMSE, MAE and CC results for data size optimization of
turbidity network
65
4.9 RMSE, MAE and CC results for past day optimization of
turbidity network
67
4.10 RMSE and CC results for spread,β optimization of
turbidity network
69

x
4.13 Overall RMSE, MAE and CC for turbidity network 75
4.14 Summary comparison between RBF and MLP for
turbidity forecasting
81

xi
LIST OF FIGURES
FIGURE NO. TITLE PAGE
2.1 Radial Basis Function Neural Network 12
2.2 Gaussian basis function 13
3.1 Location of Muar River in the state of Johor, Malaysia 18
3.2 Details location of WTP along the Muar River 18
3.3: Aluminium data for Gombang WTP 20
3.4 pH data for Gombang WTP 20
3.5 Turbidity data for Gombang WTP 20
3.6 Scatter diagram of pH vs. aluminium for Gombang WTP 22
3.7 Scatter diagram of aluminium at Gombang WTP vs.
aluminium at Bukit Serampang WTP
22
3.8 Scatter diagram of turbidity at Gombang WTP vs. turbidity
at Bukit Serampang WTP
23
3.9 Aluminium, pH and turbidity data after normalization 24
3.10 Timeline for overall data partition 25
3.11 Data partition of aluminium of Gombang WTP 25
3.12 Timeline for training data 26
3.13 Input output matrices 1st row formation for training data 27
3.14 Input output matrices 2nd row formation for training data 27
3.15 Input output matrices last row formation for training data 27
xii
3.16 Timeline for testing data and validation data 28
3.17 Input output matrices 1st row formation for testing data 28
3.18 Input output matrices 2nd row formation for testing data 29
3.19 Input output matrices last row formation for testing data 29
3.20 Neural network design for water quality forecasting 31
3.21 Projection of sliding window for data size tuning 37
4.1 Summary result of data size optimization of aluminium
RBF network
43
4.2 Testing set RMSE, MAE and CC result for data size=500 44
4.3 Summary result of past day optimization of aluminium
RBF network
45
4.4 Testing set RMSE, MAE and CC result for past day=1 46
4.5 Summary of spread, β optimization result aluminium RBF
network
48
4.6 Testing set RMSE, MAE and CC result for spread, β=4.0 49
4.7 Testing set RMSE, MAE and CC result for additional
input pH
50
4.8 Testing set RMSE, MAE and CC result for additional
input aluminium Bukit Serampang
51
4.9 Testing set RMSE, MAE & CC result of MLP network for
number of layer optimization
52
4.10 Overall RBF network actual vs, forecast aluminium (1st
500 data)
55
4.11 RBF - actual vs. forecast aluminium in training set (1st 500
data)
56
4.12 RBF - actual vs. forecast aluminium in testing set (1st 500
data)
56
4.13 RBF - actual vs. forecast aluminium in validation set (1st
500 data)
56

xiii
4.14 RBF - continuous 10 days aluminium forecast result
(sliding window projection)
57
4.15 RBF - RMSE, MAE and CC result for aluminium in
validation set
58
4.16 Overall MLP network actual vs forecast aluminium (1st
500 data)
59
4.17 MLP - actual vs forecast aluminium in training set (1st
500 data)
60
4.18 MLP - actual vs forecast aluminium in testing set (1st 500
data)
60
4.19 MLP - actual vs forecast aluminium in validation set (1st
500 data)
60
4.20 MLP - continuous 10 days forecast of aluminium in
Gombang
62
4.21 Comparison of RBF and MLP in aluminium validation set
(1st 500 data)
63
4.22 Summary result of data size optimization of turbidity RBF
network
65
4.23 Testing RMSE, MAE and CC result for data size=450 66
4.24 Summary result of past day optimization of turbidity RBF
network
67
4.25 Testing RMSE, MAE and CC result for past day=1 68
4.26 Summary result of spread,β optimization of turbidity RBF
network
70
4.27 Testing RMSE, MAE and CC result for Spread, β=1.0 71
4.28 Testing RMSE, MAE and CC result for additional input
turbidity Bukit Serampang
72
4.29 RMSE, MAE and CC result for number of layer
optimization for turbidity MLP network in testing set
73
4.30 Overall RBF network actual vs. forecast turbidity (1st 500
data)
75
xiv
4.31 RBF - actual vs. forecast turbidity in training set (1st 500
data)
76
4.32 RBF - actual vs. forecast turbidity in training set (1st 500
data)
76
4.33 RBF - actual vs. forecast turbidity in validation set (1st 500
data)
76
4.34 RBF - continuous 10 days turbidity forecast result (sliding
window projection)
77
4.35 RBF - RMSE, MAE and CC result for turbidity in
validation set
78
4.36 Overall MLP network result actual vs. forecast for
turbidity (1st 500 data)
79
4.37 MLP - actual vs. forecast for turbidity in training set (1st
500 data)
80
4.38 MLP - actual vs. forecast for turbidity in testing set (1st
500 data)
80
4.39 MLP - actual vs. forecast for turbidity in validation set (1st
500 data)
80
4.40 MLP - continuous 10 days turbidity forecast result (sliding
window projection)
82
4.41 Comparison of RBF and MLP in turbidity validation set
(1st 500 data)
83
xv
LIST OF SYMBOLS
a - Constant
 - Input space
ξ - Discrete design
- Neural Network input signal
- Neural Network output signal
σi - Receptive field controller
- Hidden unit
pi - Measurement weight
wi, - Weight
xi - Data sample
χ - Input set
β - Spread
Ф - Center value

xvi
LIST OF ABBREVIATIONS
AI - Artificial Neural Network
NN - Neural Networks
ANN - Artificial Neural Network
MLP - Multi-Layer Perceptrons
MLPNN - Multi-Layer Perceptrons Neural Network
RBF - Radial Basis Function
RBFNN - Radial Basis Function Neural Network
WQ - Water Quality
WQP - Water Quality Parameter
WTP - Water Treatment Plant
SAJH - Syarikat Air Johor Holdings
DOE - Department of Environment
DID - Department of Irrigation & Drainage
TSS - Total Suspended Solid
NTU - Nephelometric Turbidity Units
NFR - Non-Filterable Residue
E.coli - Escherichia coli
DO - Dissolved Oxygen
BOD - Biochemical Oxygen Demand
COD - Chemical Oxygen Demand
xvii
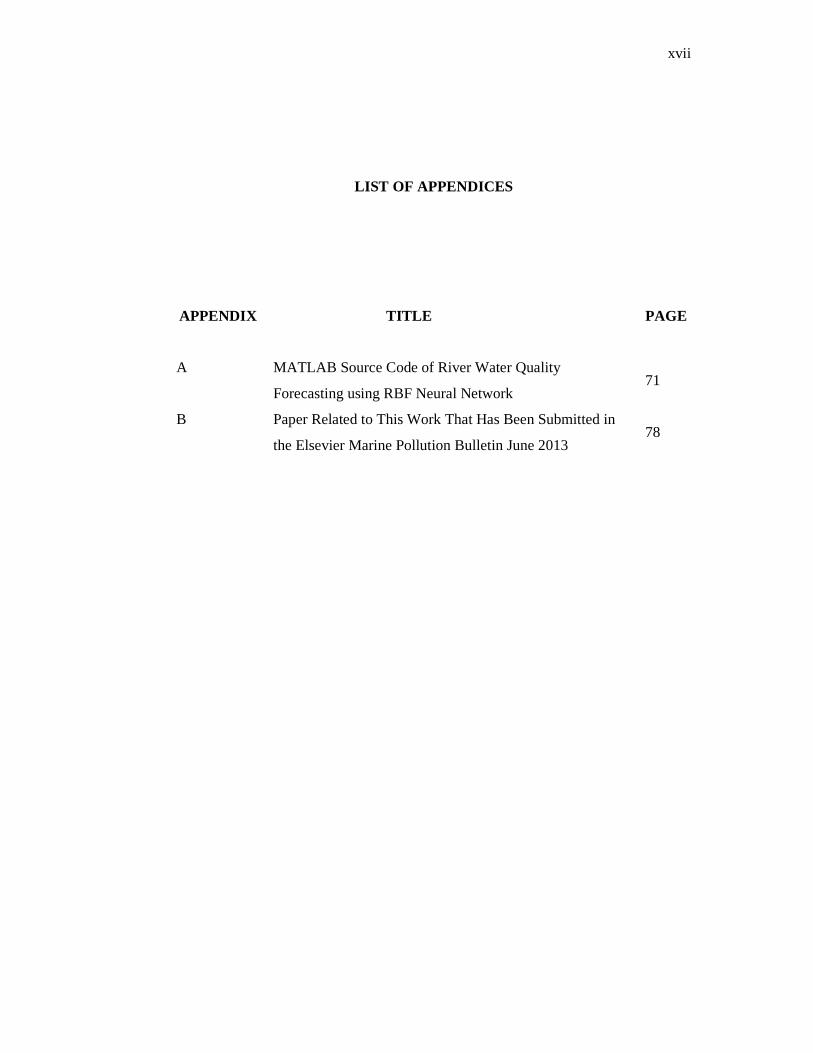
LIST OF APPENDICES
APPENDIX TITLE
PAGE
A MATLAB Source Code of River Water Quality
Forecasting using RBF Neural Network 71
B Paper Related to This Work That Has Been Submitted in
the Elsevier Marine Pollution Bulletin June 2013 78
CHAPTER 1
INTRODUCTION
1.1 Project Background
Monitoring and analysis of river water quality is an important element
in the global environmental monitoring policy and management. The deterioration
of river water quality has triggered the initiative of serious management efforts.
Fishing, tourism and more importantly drinking and domestic usage require an
acceptable level of river water quality.
The modeling and control of complex and nonlinear systems, like rivers, is
difficult due to the presence of many variables and disturbances. Usually, the
dynamics of the problem are modeled using mathematical relationships; however,
most of the times these models require a lot of information from various
fields of knowledge that formulating a realistic model is difficult and running
its simulation requires a significant amount of time.
This project demonstrates the application of ANNs to model and predict the
values of selected river water quality parameters that will be useful for early
detection of pollution influx.
2
1.2 Problem Statement
This project attempts to avoid this difficult and lengthy process by
approximating the problem using Artificial Intelligence (AI). A different type of AI
which is the RBFNN was used instead of commonly used Multilayer Perceptron
(MLP) which is the RBFNN for real-time prediction of river water quality. The RBF
were first used to design ANN by Broomhead and Lowe (1988) which offered
several advantages compared to MLP and it is expected that the RBFNN can perform
better than the MLP in terms of reducing the prediction error, consistent prediction
result and allowing a continuous update of network parameters to allow for on-line
application.
1.3 Project Objectives
The objective of this project is to identify and collect data related to river
quality from reliable source. The data need to be analyzed and preprocessed before
using for Radial Basis Function Neural Network (RBFNN) training.
The second objective is to identify appropriate RBFNN structures and
parameters to be used with the available data sets. These involve identifying the
network’s input, output, size, activation function and number of centers.
Next, the project objective is to develop appropriate training algorithm for
RBFNN.
Finally, the ability and performance of the RBFNN training algorithm in
predicting water quality will be assessed. This involves using some portion of the
data to validate the RBFNN based on the appropriate performance criteria.
3
1.4 Scope of the Project
The scope of this project includes collecting river water quality parameter
data from reliable source. The data was then being pre-processed and analyzed.
Parameters and input of water quality prediction was identified. Basic understanding
of water quality parameters is vital besides correlation analysis between parameter
for determining the input and parameter relation.
The data was split into 3 partitions for training, testing and validation before
it was used in the RBFNN. The RBFNN then was computed using MATLABTM
RBFNN toolbox which is much easier but with limited settings of RBFNN compared
to conventional source code writing. The RBFNN performance then was measured
with two performance criterion: prediction error and processing time.
The performances of RBFNN; prediction error and processing time then were
compared commonly used ANN type which was the MLP.
1.5 Academic Contributions
The advantage of using RBFNN instead of commonly used ANN which is the
MLP was proven in this project. RBFNN application in forecasting of water quality
was proven with slightly lower error and produced more consistent results compared
to MLP. Processing time of RBFNN also proved to be more superior to the
processing time of MLP where RBFNN was 77.9% to 80% faster than MLP.

4
1.6 Organization of Thesis
This thesis is divided into five chapters. The first chapter gives a general
overview and introduction of the project. Chapter Two covers the literature review
on water quality, ANN and its application in water resource as well as existing
methods and techniques. Chapter Three presents the methodology of the project
which consists of steps and process of project and description of each part of the
process. Chapter Four discusses and analyses the results obtained. Chapter Five
includes suggestion for further enhancement of this project and conclusions.
19
of the time it require a lot of information from various fields of knowledge and running its simulation requires a significant amount of time. The Radial Basis Function Neural Network, RBFNN has proved that it is a potential technique than can be used to forecast complex and nonlinear system of river. The results indicated that the RBFNN was an attractive alternative to forecast the water quality parameter and potentially to predict other water quality parameters. It has also proved the ability to produce consistent and robust result which is significant for real-time water quality forecasting. However, there are many more things that can be done to improve the efficiency of RBFNN forecasting efficiency as suggested in the recommendations below. References [1] S. S. Abdullah, M. M. Idris. 2008. Short Course in Artificial Neural
Networks. Control and Instrumentation Engineering Department, Universiti Teknologi Malaysia.
[2] D. S. Broomhead and D. Lowe. 2008. Multivariable Functional Interpolation and Adaptive Networks, Complex Systems. Vol. 2, pp 321-355.
[3] Iebeling Kaastra and Milton Boyd. Designing a Neural Network for Forecasting Financial and Economic Time Series. 1996. Neurocomputing, (Elsevier) 10. pp 215-236.
[4] Muttil, N. and Chau, K.W. 2006. Neural network and Genetic Programming for Modeling Coastal Algal Blooms. International Journal of Environment and Pollution 28 (3/4). 223–238.
[5] R. J. Schalkoff, Artificial Neural Networks. 1997. MIT Press and McGraw-Hill Companies, Inc.
[6] Hussein, S.F.M, Shah, M.B.N, Jalal, M.R.A, Abdullah, S.S. 2011. Gold Price Prediction Using Radial Basis Function Neural Network. 4th International Conference Modeling on Simulation and Applied Optimization (ICMSAO). (April) 19-21. Kuala Lumpur: IEEE. pp 1-11.
[7] A. G. Bors. Introduction of the Radial Basis Function (RBF) Networks. Online Symposium for Electronics Engineers, Issue 1, vol. 1, DSP Algorithms: Multimedia, Feb. 13 2001, pp. 1-7.
[8] Girosi, F. and Poggio, T. 1990. Networks and the Best Approximation Property. Biological Cybernetics. 63, pp 169-176.
[9] Najah, A., Elshafie, A., A. Karim, O. and Jaffar, O. Prediction of Johor River Water Quality Parameters Using Artificial Neural Networks, European Journal of Scientific Research. Vol.28 (No.3). 2009. pp.422-435.
[10] A. Najah, A. El-Shafie, O. A. Karim, O. Jaafar and Amr H. El-Shafie. 2011. An Application of Different Artificial Intelligences Techniques for Water Quality Prediction, International Journal of the Physical Sciences. Vol. 6(22). pp 5298-5308.
[11] Sundarambal Palani, Shie-Yui Liong, Pavel Tkalich. 2008. An ANN Application for Water Quality Forecasting, Marine Pollution Bulletin. 56. pp 1586–1597.
[12] Howard Demuth, Mark Beale and Martin Hagan. 2009. Neural Network Toolbox™ 6 User’s Guide. Version 6.0.3 (Release 2009b). Natick: The MathWorks, Inc.
[13] Talib, A.1, Y. Abu Hasan and N.N. Abdul Rahman. 2009. Predicting Biochemical Oxygen Demand as Indicator of River Pollution Using Artificial

20
Neural Networks. 18th World IMACS / MODSIM Congress. Cairns, Australia. (July) 13-17. pp 13-17. 824.
[14] Holger R. Maier , Graeme C. Dandy. 2000. Neural Networks for the Prediction and Forecasting of Water Resources Variables: A Review of Modeling Issues and Applications, Environmental Modelling & Software. 15. pp 101–124.
[15] Holger R. Maier , Graeme C. Dandy, Michael D. Burch. 1998. Use of Artificial Neural Networks for Modeling Cyanobacteria Anabaena spp. in the River Murray, South Australia, Ecological Modeling. 105. pp 257–272.
[16] H.K. Cigizoglu. 2008. Artificial Neural Networks In Water Resources, Integration of Information for Environmental Security NATO Science for Peace and Security Series C: Environmental Security. pp 115-148.
[17] M. R. Mustafa, M. H. Isa, R. B. Rezaur. 2012. Artificial Neural Networks Modeling in Water Resources Engineering: Infrastructure and Applications. World Academy of Science, Engineering and Technology. 62. 6. pp 341-349.
[18] El-Shafie, A.E.; Noureldin, M.R.; Taha; Basri, H. 2008. Neural network model for Nile River inflow forecasting analysis of historical inflow data. Journal of Applied Sciences 8 (24), 4487-4499.
[19] A.W. Jayawardena, D.A.K Fernando and M. C. Zhou. 1997. Comparison of Multilayer Perceptron and Radial Basis Function Networks as Tools for Flood Forecasting. Destructive Water: Water-Caused Natural Disasters, their Abatement and Control (Proceedings of the Conference held at Anaheim, California, June 1996). IAHS. Publ. No. 239.
[20] Mark J. L. Orr. Introduction to Radial Basis Function Networks. Technical Report, Institute for Adaptive Neural Computation, Division of Informatics, University of Edinburgh, 199


![UNIVERSITI PUTRA MALAYSIApsasir.upm.edu.my/42127/1/FK 2011 28R.pdfand the Constitution of the Universiti Putra Malaysia [P.U.(A) 106] 15 March 1998. The Committee recommends that the](https://static.fdocuments.us/doc/165x107/5e63d0f9c2d92d111e4c9246/universiti-putra-2011-28rpdf-and-the-constitution-of-the-universiti-putra-malaysia.jpg)