Forecasting cost and schedule performance
45
FORECASTING COST AND SCHEDULE PERFORMANCE IN THE PRESENCE OF UNCERTAINTY Probabilistic forecasting of program performance 1
-
Upload
glen-alleman -
Category
Documents
-
view
531 -
download
4
Transcript of Forecasting cost and schedule performance

FORECASTING COST AND SCHEDULE PERFORMANCE IN THE PRESENCE OF UNCERTAINTY
Probabilistic forecasting of program performance
1

Complexity, Risk, and Uncertainty drive all projects
2
Our project management methods must deal with this uncertainty

Top Level Theme 3
Earned Value metrics are lagging and linear representations of project performance
SPI/CPI are Cumm to date with this underlying variances washed out
Current period is a one period extension of a linearized accumulation
No information about the dynamics of the past is available
Forecasts of the future are linear projects from the current base point measurement
No statistical inference or probabilistic projects are provided

Top Level Theme (Continued) 4
“All models are wrong, some are useful”
Time series analysis: Forecasting and
Control, George E. P. Box and Gwilym
M. Jenkins, Holden-Day, 1976
Box actually said …

Top Level Themes (Concluded) 5
For credible decisions to be made, we need
confidence intervals on all the numbers we use to
make decisions.
These confidence intervals come from the underlying
statistics and the related probabilities.
Statistical forecasting, using time series analysis of
past performance, is mandatory for any credible
discussion of project performance in the future.

|
6
Uncertainties are things we can not be certain about. Uncertainty is created by Incomplete knowledge; not Ignorance
Risk

All Program Activities have Naturally Occurring Uncertainty
7
Naturally occurring uncertainty
and its resulting risk, impacts the
probability of a successful
outcome
What is the probability of making
a desired completion date or cost
target?
The statistical behavior of these activities, their
arrangement in a network of activities, and correlation
between their behaviors creates risk
Adding margin protects the outcome from the impact of
this naturally occurring uncertainty
Risk

8
Raw Material For Forecasting
Cost And Schedule

Earned Value Numbers 9
CPI / SPI
That’s it, that’s all we got
Cumulative to date
Current period
Cumulative values wipe out the underlying variance
Current period performance not adjusted for past
variance
Both cumulative and current period not adjusted for
risk

Technical Performance Numbers 10
Technical Performance Measures
Measures of Performance
Measures of Effectiveness
Key Performance Parameters
JROC
Program specific

11
Our goal in forecasting the future is to …
… Produce a forecast with a range of
confidence intervals

12 Performance-Based Project Management®, Copyright © Glen B. Alleman, 2012, 2013 Performance-Based Project Management®, Copyright © Glen B. Alleman, 2012, 2013

Forecasts Produce Patterns Of Possible
Future Outcomes
13
Some Principles
Reliable forecasting is a critical component of
project planning, controlling, and risk management.
At-Completion forecast made before the project
starts is the basis of credible project management
Execution phase forecasting serves as a leading
indicator of project success
14

Some Important Terms
The term confidence interval is applied to interval
estimates for fixed but unknown parameters
The term prediction interval is an interval estimate
for an (unknown) future value.
A prediction interval consists of an upper and a lower
limit at a prescribed probability, which are referred to
as prediction bounds
15

A core limitation of the current approach to performance forecasting
Standard EVM technique for forecasting the final
cost at completion is not applicable to forecasting
the project duration at completion†
This leads to inconsistent assumptions about the
relationships between past performance and future
performance
Using CPI creates a future forecast will be the same as
past performance
† Short 1993, Vandevoorde and Vanhoucke 2006, Leach 2005, and Lipke 2003.
16

Forecasting Methods
Probabilistic Forecasting – explicit uncertainties in
project performance and errors in measurement
provide prediction bounds on the predicted values
Integrative Forecasting Methodologies – collect all
relevant information from different sources in a
mathematically correct manner
Consistent Forecasting Methodologies – methods
that can be applied to both cost and schedule
performance forecasts
17

Elements of a good forecast
Timely
Reliable
Accurate
Meaningful
Easy to use
Actionable
18

Three types of forecasts
Judgmental – Subjective analysis of subjective
inputs
The Management EAC is a judgmental forecast
Associative Models – Analyzes historical data to
reveal relationships between (easily or in advance)
observable quantities and forecast quantities. Uses
this relationship to make predictions.
Time Series – Objective analysis historical data
assuming the future will be like the past
19

Forecasting Techniques
Moving average – taking the
value of a chosen number of
previous periods to use as an
estimate for the next period
Weighted average – same as
moving average except giving
greater weight to more recent
periods
Linear regression – a
mathematical algorithm is using
past data to create a line
showing the direction. The line
can then be carried forward to
create a forecast
Exponential smoothing –
combines most recent actual
figure with the previous period’s
forecast in order forecast an
upcoming period
Regression analysis – equations
that are used to analyze the
relationship between a
dependent variable and one or
more independent variables.
Time series – uses recent history
is a good predictor of the near
future
Trend analysis – finds trends in
historic data that can be used to
make forecasts.
20

21
Capturing and processing data requires work.
Making forecasts are essentially Free

22
We’ve got the start of the data capture process
UN/CEFACT is a place not the name of an XML
protocol
Cost and schedule information available at the
Control Account level on a monthly basis
In order to build the Control Account data stream,
the Work Package are used
Use the Work Package information as well

23

An Example of Additional Insight Gained By Comparing Schedules Against Planned Program Deliverables
24
FY05 FY06 FY07 FY08 FY09 FY10 FY11 FY12 FY13
1
25
20
15
10
5
Mile
stone
Coun
t
3/05 Plan (Rev. A)
Preliminary Rev. H
5/07 Plan (Rev. E)
0
0
6
1
1
9
2
6
4
2
8
6
9
7
0
5
3
0
6
0
0
(actual from
5/07 plan)
(1 actual from
5/07 plan)
3/05 Plan
12/08 Prel. Rev H
5/07 Plan
0
0
6
1
1
15
3
7
19
5
15
25
14
22
0
19
25
0
25
0
0 M/S Count
Cum
3/05 Plan
12/08 Prel. Rev H
5/07 Plan
M/S Count
Rate
Actual Plans of
the James Web
Space
Telescope
(JWST)

JWST Schedules and Deliverables by Subsystems
25
Spacecraft
Sunshield
PDR
CDR
Test Compl
I&T Compl
FY05 FY06 FY07 FY08 FY09 FY10 FY11 FY12
OTE
3/05 Plan (Rev. A)
Preliminary Rev. H
5/07 Plan (Rev. E)
3/05 Plan
5/07 Plan
0
0
6
1
1
9
2
6
4
2
8
6
9
7
0
5
3
0
6
0
0
(actual from
5/07 plan)
(1 actual from
5/07 plan)
ISIM
0
0
6
1
1
15
3
7
19
5
15
25
14
22
0
19
25
0
25
0
0
M/S Count
Rate
M/S Count
Cum
STR - PDR
STR - CDR
ETU - NIRSpec
ETU - MIRI
ETU - NIRCam
ETU - FGS
ETU - I&T
FM - NIRCam
FM - FGS
FM - I&T
FM - MIRI
FM - NIRSpec
OTE PDR
Start Polish
OTE CDR
1st Mirror Delivery
Final Mirror Delivery
PDR
CDR
Struct Compl
Prop I&T
3/05 Plan
Prel. Rev H
5/07 Plan
Prel. Rev H
Exhibit 30: Deliverables Planned vs Actuals

Probabilities of Success Results 26
Case 2: Baseline with Uncertainty, Discrete Risks @ 25 probability
34.8%
50.8%
57.4%
30 Sept 2022
Probability of meeting both
cost and schedule targets
Probability of meeting
targeted schedule
Probability of
meeting targeted cost
Exhibit 31: Probability of Meeting Cost and Schedule Targets

Current Execution Index (CEI)
• CEI is a forecast schedule
execution metric for a specific near
term window
• The goal of this metric is to
determine or measure how well
the near term schedule represents
what actually takes place through
execution
• The calculation is made through
capturing a forward-looking
snapshot of what is forecasted to
finish in the near term window.
Then a comparison is made to the
original snapshot after that window
has been executed
• CEI is NOT an actual to baseline
comparison. CEI is an actual to
forecast comparison.
27

Baseline Execution (BE) Chart
• Incomplete tasks, as well as
tasks completed late, instill risk to
executing program milestones and
events
• Used with CEI and VI measures,
these indicators can help the team
determine the level of confidence
in Prime’s ability to build a
realistic/ executable schedule
28
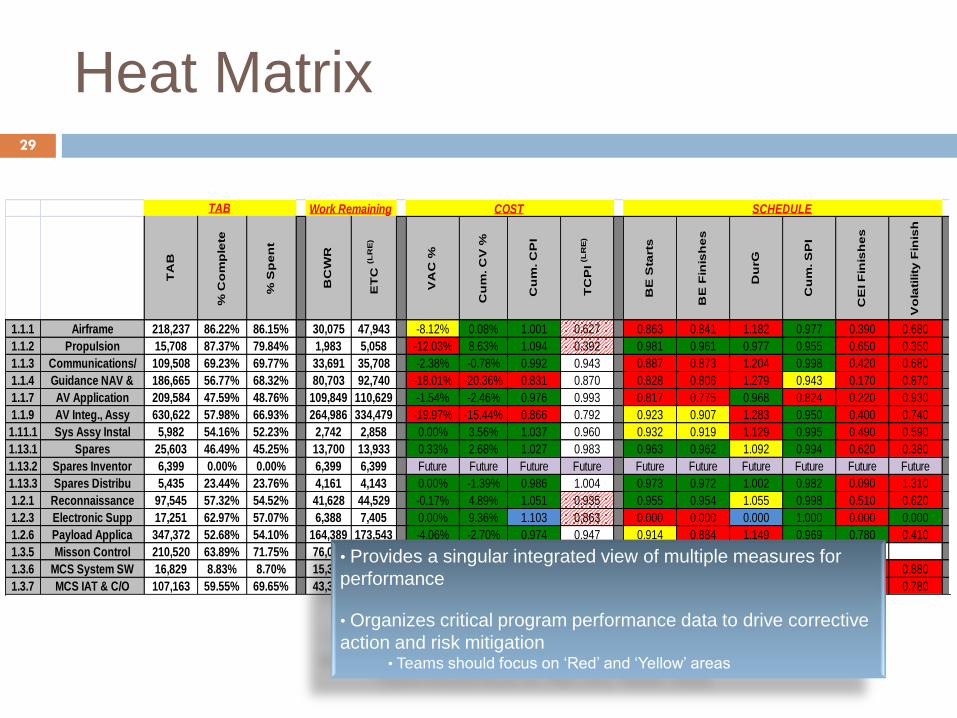
Heat Matrix
COST
TA
B
% C
om
ple
te
% S
pe
nt
BC
WR
ET
C (L
RE
)
VA
C %
Cu
m. C
V %
Cu
m. C
PI
TC
PI
(LR
E)
BE
Sta
rts
BE
Fin
ish
es
Du
rG
Cu
m. S
PI
CE
I F
inis
he
s
Vo
lati
lity
Fin
ish
No
tes
1.1.1 Airframe 218,237 86.22% 86.15% 30,075 47,943 -8.12% 0.08% 1.001 0.627 0.863 0.841 1.182 0.977 0.390 0.680
1.1.2 Propulsion 15,708 87.37% 79.84% 1,983 5,058 -12.03% 8.63% 1.094 0.392 0.981 0.961 0.977 0.955 0.650 0.350
1.1.3 Communications/ 109,508 69.23% 69.77% 33,691 35,708 -2.38% -0.78% 0.992 0.943 0.887 0.873 1.204 0.998 0.420 0.680
1.1.4 Guidance NAV & 186,665 56.77% 68.32% 80,703 92,740 -18.01% -20.36% 0.831 0.870 0.828 0.806 1.279 0.943 0.170 0.870
1.1.7 AV Application 209,584 47.59% 48.76% 109,849 110,629 -1.54% -2.46% 0.976 0.993 0.817 0.775 0.968 0.824 0.220 0.930
1.1.9 AV Integ., Assy 630,622 57.98% 66.93% 264,986 334,479 -19.97% -15.44% 0.866 0.792 0.923 0.907 1.283 0.950 0.400 0.740
1.11.1 Sys Assy Instal 5,982 54.16% 52.23% 2,742 2,858 0.00% 3.56% 1.037 0.960 0.932 0.919 1.129 0.995 0.490 0.590
1.13.1 Spares 25,603 46.49% 45.25% 13,700 13,933 0.33% 2.68% 1.027 0.983 0.963 0.962 1.092 0.994 0.620 0.380
1.13.2 Spares Inventor 6,399 0.00% 0.00% 6,399 6,399 Future Future Future Future Future Future Future Future Future Future
1.13.3 Spares Distribu 5,435 23.44% 23.76% 4,161 4,143 0.00% -1.39% 0.986 1.004 0.973 0.972 1.002 0.982 0.090 1.310
1.2.1 Reconnaissance 97,545 57.32% 54.52% 41,628 44,529 -0.17% 4.89% 1.051 0.935 0.955 0.954 1.055 0.998 0.510 0.620
1.2.3 Electronic Supp 17,251 62.97% 57.07% 6,388 7,405 0.00% 9.36% 1.103 0.863 0.000 0.000 0.000 1.000 0.000 0.000
1.2.6 Payload Applica 347,372 52.68% 54.10% 164,389 173,543 -4.06% -2.70% 0.974 0.947 0.914 0.884 1.149 0.969 0.780 0.410
1.3.5 Misson Control 210,520 63.89% 71.75% 76,024 84,565 -11.92% -12.31% 0.890 0.899 0.918
1.3.6 MCS System SW 16,829 8.83% 8.70% 15,343 16,063 -4.15% 1.43% 1.014 0.955 0.891 0.899 1.195 1.000 0.150 0.880
1.3.7 MCS IAT & C/O 107,163 59.55% 69.65% 43,347 69,151 -34.18% -16.96% 0.855 0.627 0.929 0.925 1.278 0.974 0.440 0.780
SCHEDULEWork RemainingTAB
• Provides a singular integrated view of multiple measures for
performance
• Organizes critical program performance data to drive corrective
action and risk mitigation • Teams should focus on ‘Red’ and ‘Yellow’ areas
29

Navy PoPS 30

KPP Current Status Indicators 31

Margin Management 32

Late Finish by Status Date 33

Late Finish Aging Metrics 34

Late Start Aging Metrics 35

Schedule Margin Analysis 36

Total Program Starts
0
50
100
150
200
250
300
To
tal
We
ek
ly S
tart
s
0
500
1000
1500
2000
2500
3000
3500
4000
CU
M S
tart
s
Planned 0 0 0 0 0 111 103 140 140 82 128 82 176 59 87 76 180 107 78 59
Actual 0 0 0 0 0 56 0 0 0 0 0 0 0 0 0 0 0 0 0 0
Forecast 0 0 0 0 0 56 276 154 194 119 138 123 195 83 138 102 232 107 81 86
CUM Planned 1554 1554 1554 1554 1554 1665 1768 1908 2048 2130 2258 2340 2516 2575 2662 2738 2918 3025 3103 3162
CUM Actual 1473 1473 1473 1473 1473 1529
CUM Forecast 1473 1473 1473 1473 1473 1529 1805 1959 2153 2272 2410 2533 2728 2811 2949 3051 3283 3390 3471 3557
6/11 6/18 6/25 7/2 7/9 7/16 7/23 7/30 8/6 8/13 8/20 8/27 9/3 9/10 9/17 9/24 10/1 10/8 10/15 10/22
37
Schedule Starts

Total Program Finishes
0
50
100
150
200
250
To
tal W
eekly
Fin
ish
es
0
500
1000
1500
2000
2500
3000
3500
CU
M F
inis
hes
Planned 0 0 0 0 0 129 154 194 128 120 126 151 151 83 95 151 195 92 106 87
Actual 0 0 0 0 0 96 0 0 0 0 0 0 0 0 0 0 0 0 0 0
Forecast 0 0 0 0 0 106 223 206 155 166 123 191 175 101 142 144 206 90 92 120
CUM Planned 943 943 943 943 943 1072 1226 1420 1548 1668 1794 1945 2096 2179 2274 2425 2620 2712 2818 2905
CUM Actual 793 793 793 793 793 889
CUM Forecast 793 793 793 793 793 899 1122 1328 1483 1649 1772 1963 2138 2239 2381 2525 2731 2821 2913 3033
6/11 6/18 6/25 7/2 7/9 7/16 7/23 7/30 8/6 8/13 8/20 8/27 9/3 9/10 9/17 9/24 10/1 10/810/1
5
10/2
2
38
Schedule Finishes

39
Program Start Metrics Bow-Wave Trend

40
Program Finish Metrics Bow-Wave Trend

Each status period counts the number of finishes moved to
forward periods and adds them to the planned finishes
This increase is the debt of work added to that period
41
Late Finish derived directly from the IMS

Leading Indicators come from integrating EVM and SE†
42
† Systems Engineering Applied Leading Indicators: Enabling Assessment of Acquisition Technical Performance, 24 September 2010, Paul
Montgomery and Ron Carlson, Graduate School of Engineering & Applied Sciences Naval Postgraduate School, NPS-AM-10-175

Leading Indicators must also connect MoE, MoP, and TPMs
43

In the end, leading indicators
must tell us how to take
corrective actions before we
end up in the ditch
44

45 Performance-Based Project Management®, Copyright © Glen B. Alleman, 2012, 2013 Performance-Based Project Management®, Copyright © Glen B. Alleman, 2012, 2013