FORECASTING AIRCRAFT CONDENSATION … REVIEW AND APPROVAL STArEMENT AWS/TR-81/001, Forecasting...
27
Fy.;*c/3 AWS/TR-81/0 FORECASTING AIRCRAFT CONDENSATION TRAILS DTjC September 1981 >,MAR I 1'18 Approved For Public Release; Distribution Unlimited AIR WEATHER SERVICE IMAC) Scott AFB, Illinois 62225 c! 2 '20
-
Upload
nguyentruc -
Category
Documents
-
view
215 -
download
0
Transcript of FORECASTING AIRCRAFT CONDENSATION … REVIEW AND APPROVAL STArEMENT AWS/TR-81/001, Forecasting...

Fy.;*c/3
AWS/TR-81/0
FORECASTINGAIRCRAFT CONDENSATION
TRAILS
DTjC
September 1981 >,MAR I 1'18
Approved For Public Release; Distribution Unlimited
AIR WEATHER SERVICE IMAC)Scott AFB, Illinois 62225
c! 2 '20

Ib
REVIEW AND APPROVAL STArEMENT
AWS/TR-81/001, Forecasting Aircraft Condensation Trails, September 1981, isapproved for public release. There is no objection to unlimited distributionof this document to the public at large, or by the Defense Technical Informa-tion Center (DTIC) to the National Technical Information Service (NTIS).
This technical report has been reviewed and is approved for publication.
KIRK E. LEHNEIS, Capt, USAFReviewing Officer
FOR THE COMIANDER
THXOMAS A. STU ERZ,Col, USAFDCS/Aerospace Sciences
ii
'--

I INC1,ASS Fl I)SECURITY CLASSIFICATION OF THIS PAGE (Whel. I)nti.nterrd)l
PAGE READ INSTRUCTIONSREPORT DOCUMENTATION BEFORE COMPLETING FORM
I. REPORT NUMBER 2. GOVT ACCESSION NO. 3. RECIPIENT'S CATALOG NUMBER
AWS/TR-81/001 ,,,,L- 1.... 76'
4. TITLE (and Subtitle) 5. TYPE OF REPORT & PERIOD COVERED
FORECASTING AIRCRAFT CONDENSATION TRAILS Technical Report
6. PERFORMING O1G. REPORT NUMBER
7. AUTHOR(s) 8. CONTRACT OR GRANT NUMBER($)
9. PERFORMING ORGANIZATION NAME AND ADDRESS 10. PROGRAM ELEMENT. PROJECT. TASK
Scot AFBIL 6225AREA & WORK UNiT NUMBERSHQ Air Weather Service/DNTS AE OKUI UBR
Scott AFB IL 62225
11. CONTROLLING OFFICE NAME AND ADDRESS 12. REPORT DATE
HQ Air Weather Service/DN September 1981
Scott AFB It, 62225 13. NUMBER OF PAGES25
14. MONITORING AGENCY NAME & ADDRESS(if different from Controlling Office) 15. SECURITY CLASS. (of this report)
UNCLASSIFIED15.. DECLASSIFICATION/DOWNGRADING
SCHEDULE
16 DISTRIBUTION STATEMENT (of this Report)
Approved for public release; distribution unlimited.
17. DISTRIBUTION STATEMENT (of the abstract entered In Block 20, if different from Report)
1S. SUPPLEMENTARY NOTES
This report is a republication of Air Weather Service Manual (AWSM) 105-100,Forecasting of Aircraft Condensation Trails, 11 March 1960 with Change 1,31 May 1973. A revised Chapter and other changes have been included.
19. KEY WORDS (Continue on reverse side if necessary and identify b' hloc, iumber)
meteorology, condensation trails, contrail aircraft, propeller aircraft,contrail-formation graphs, contrail probab, . urves
20. ABSTRACT (Continue on reverse side If necessary and Identify by block number)
Aircraft condensation trails (contrails) are caused by aircraft aerodynamics orengine exhaust in the proper atmospheric conditions. Engine-exhaust trails arethe most common and are discussed in this report. Jet aircraft contrail-formation graphs facilitate yes-or-no forecasts for any season with forecasts ofpressure, temperature, and relative humidity. Contrail probability curves givecondensation trail probabilities with forecast pressure and temperature. Engin
power setting does not affect contrail formation, but does affect intensity. Thecontrail-formation graph for propeller aircraft is similar to the jet graph.
DD o 1473 EDITION OF I NOV63 IS OBSOLETEii UNCLASSIFIED
SECURITY CLASSIFICATION OF THIS PAGE (When Dots Entered)

PREFACE
This technical report presents a method ofdiagnosing and forecasting aircraft condensation trails(contrails). This method has been extensively triedand found generally useful. The original research wasdone in the early 1950s; little new work has been donesince that time.
This report is a republication of AWSM 105-100, 11March 1960 with change 1. A few additional changes andcorrections have been incorporated. New material isincluded in Section 2.6 and Chapter 5.
'ce~ion o
DTIC TO
Ullannouaco I_ _ _ _G
'I - I~m c
Dis t . . ..- ..... iV
r-i
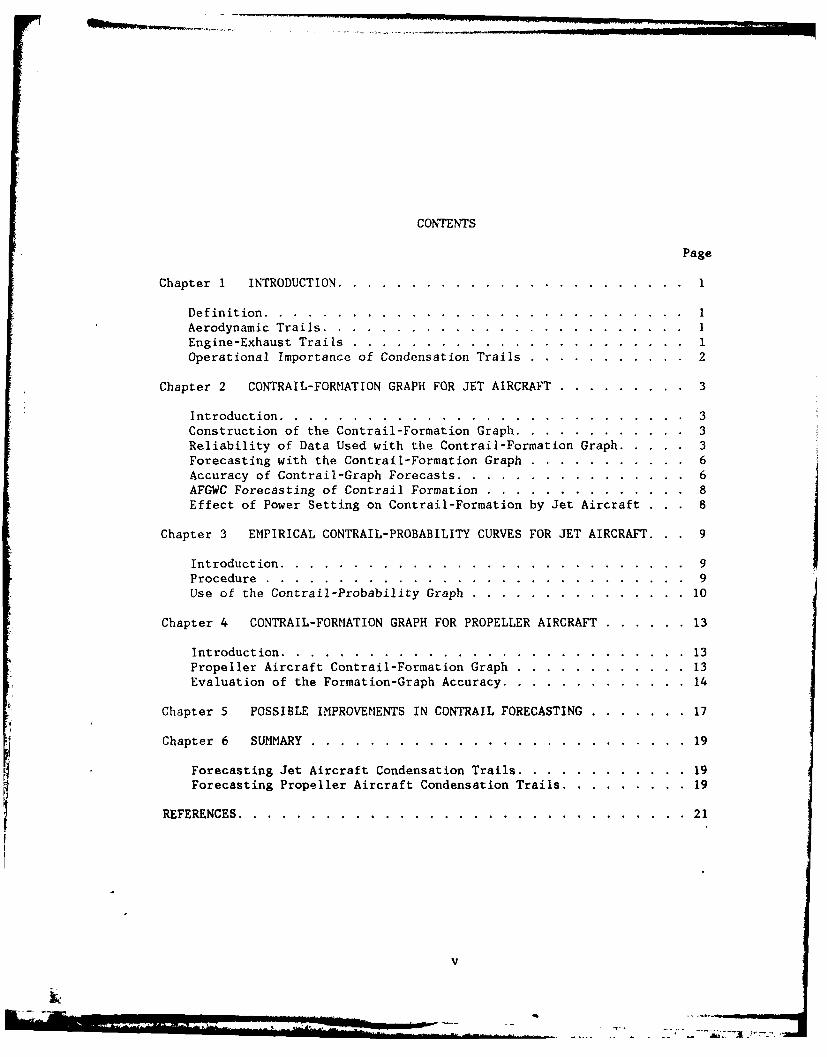
CONTENTS
Page
Chapter 1 INTRODUCTION .......... .......................... I
Definition .............. ............................. 1Aerodynamic Trails .......... ........................... IEngine-Exhaust Trails ......... ....................... ... 1Operational Importance of Condensation Trails ... ........... 2
Chapter 2 CONTRAIL-FORMATION GRAPH FOR JET AIRCRAFT .... ......... 3
Introduction ............. ............................ 3Construction of the Contrail-Formation Graph ...... ............ 3Reliability of Data Used with the Contrail-Formation Graph ........ 3Forecasting with the Contrail-Formation Graph ..... ........... 6Accuracy of Contrail-Graph Forecasts ........ ................ 6AFGWC Forecasting of Contrail Formation ....... .............. 8Effect of Power Setting on Contrail-Formation by Jet Aircraft . . . 8
Chapter 3 EMPIRICAL CONTRAIL-PROBABILITY CURVES FOR JET AIRCRAFT. . . 9
Introduction .............. ............................ 9Procedure ....... ............................. 9Use of the Contrail-Probability Graph ....... ............... 10
Chapter 4 CONTRAIL-FORMATION GRAPH FOR PROPELLER AIRCRAFT ........ .13
Introduction .................. ............................ 13Propeller Aircraft Contrail-Formation Graph .... ............ .13Evaluation of the Formation-Graph Accuracy .... ............. .14
Chapter 5 POSSIBLE IMPROVEMENTS IN CONTRAIL FORECASTING ......... .. 17
Chapter 6 SUMMARY ........... .......................... ... 19
Forecasting Jet Aircraft Condensation Trails .... ............ .19
Forecasting Propeller Aircraft Condensation Trails ............ ... 19
REFERENCES ............. ............................... .21
V

FIGURES
page
1. Relative Humidity Required for Jet AircraftContrail Formation as a Function of the Pressure andTemperature of the Environment ....... ................... 5
2. The Jet Aircraft Contrail-Formation Curves Plottedon a Portion of a Skew T, Log P Diagram ....... .............. 7
3. Probability of Jet Aircraft Contrail Formationas a Function of Pressure and Temperature .... ............. .. 11
4. Propeller Aircraft Contrail-Formation Graph .... ............ .15
5. M dification of Propeller Aircraft Contrail CurvesNear Operating Ceiling ......... ....................... .. 16
TABLES
page
1. Critical Temperatures for Jet Aircraft Contrail Formationas a Function of Pressure and Relative Humidity ..... .......... 4
2. Probability of Jet Aircraft Contrail Formationas a Function of Pressure and Temperature ...... ............. 10
3. Critical Temperatures for Contrail Formationby Propeller Aircraft ......... ....................... .. 14
vi

Chapter 1
INTRODUCTION
1.1 Definition
Condensation trails (contrails) are elongated tubular-shaped clouds co:m-
posed of water droplets or ice crystals which form behind aircraft when thiwake becomes supersaturated with respect to water. Depending upon theirorigin, they are called either "aerodynamic" or "engine-exhaust" trails.
1.2 Aerodynamic Trails
Aerodynamic trails are caused by the momentary reduction in pressure of air
flowing at high speed past an airfoil. This pressure fall can cause sufficient
adiabatic cooling of the air to raise the relative humidity of the affectedenvironment to saturation. In such cases condensation will occur, and if
enough liquid water is produced, a visible trail will form. (This is compa-rable to the formation of "conventional" clouds from air parcels by upwardvertical motion which reduces pressure and increases relative humidity, e.g.,over mountains or frontal surfaces and in incipient cumulus clouds.) The
trails are generally associated w.ith the areas of maximum pressure decrease,
i.e., the tips of the wings and propellers.
Aerodynamic trails are rare in occurrence and short in duration. They
occur in layers where Lhe atmosphere is near saturation, especially duringtimes of extreme flight maneuvers such as sharp "pull-outs" and high-speed
diving turns. If trails do form, a small change of altitude or a reduction in
airspeed may stop their formation.
1.3 Engine-Exhaust Trails
The second and most important type of condensation trail arises when the
water vapor in the exhaust gas mixes with and saturates the air in the wake ofthe aircraft (Appleman, 1953). Combustion of the hydrocarbon fuels used in
aircraft--both propeller and jet--injects both water vapor and heat into theaircraft wake. The added moisture raises the relative humidity in the wake,while the added heat lowers it. Whether or not the wake will reach saturationdepends on the ratio of water vapor to heat in the exhaust gas and on theinitial pressure, temperature, and relative humidity of the environment. Theremainder of this report deals with engine-exhaust trails.
1ur

1.4 Operational Importance of Condensation Trails
During an aerial invasion, contrails are of vital importance. They gener-ally aid the defender and hinder the attacker. Sections 1.4.1 through 1.4.4list the most important ways in which the defenders are helped directly and theattackers are hindered indirectly. Section 1.4.4 summarizes some of the waysin which the attackers are hindered directly. In some cases both the attackersand defenders are hindered.
1.4.1 Detection by Defenders. Radar defense networks are never perfect.Aircraft can penetrate holes in the radar coverage or use electronic counter-measures. This is of little use, however, if long white trails give away theirposition and direction of flight.
1.4.2 Interception by Defenders. Intercepting aircraft are vectored to theposition of the invading aircraft by means of radar. The presence of contrailsenhances visual contact, thus tremendously increasing the efficiency of theradar control.
1.4.3 Identificat ion b Dyefenders. By showing the number and spacing of theengines, contrails can reveal aircraft type.
1.4.4 Direct Obstacles to Invaders. Contrails produced by a flight ofaircraft may spread out to form a cirrus cloud layer which can hinder therendezvous of aircraft and refueling operations. Also, contrails may interferewith some of the radar-controlled apparatus on an aircraft.
2
qftd

Chapter 2
CONTRAIL-FORMATION GRAPH FOR JET AIRCRAFT
2.1. Introduction
The parameters which determine whether or not the wake of an aircraft vi'become saturated and contrails will form fall into two classes. Three ot theparameters are associated with the environment and one with the aircraft. Theenvironmental parameters are pressure (p), temperature (T), arid relativehumidity (RH). The aircraft parameter is the ratio of water vapor to heat(W/H) injected into the wake. For jet aircraft (unlike propeller aircraft),almost the entire amount of heat and all the water vapor liberated by thecombustion process go into the wake. Consequently, the ratio W/H does notchange with the type of jet aircraft nor with the rate of burning of the fuel.Thus, only the environmental parameters--p, T, and RH--determine whether or nota trail will form.
2.2 Construction of the Contrail-Formation Graph
The critical values of p, T, and RH for contrail formation were derived forpressure ranging from 1000 to 40 mb and for relative humidities of 0, 60, 90,and 100 percent with respect to water (Table 1 and Figure 1). The completetheoretical treatment is given in AWS TR 105-145 (Appleman, 1957).
Figure 1 shows the minimum relative humidity of the environment which willgive rise to jet exhaust trail formation at given values of pressure andtemperature. Since the atmospheric humidity must always be between 0 and 100percent, the graph can be divided into three main areas. If a pressure-temper-ature value lies to the left of the 0 percent line, contrails should alwaysform--even in absolutely dry air. This is the "Yes" area. If the value falls
to the right of the 100 percent line, contrails should never form--even ininitially saturated air. This is the "No" area. If the point falls betweenthe 0 and 100 percent lines, contrails will form if (and only if) the actualrelative humidity is equal to or greater than the value indicated at that pointon the graph. This is the uncertain or "Possible" area.
2.3 Reliability of Data Used with the Contrail-Formation Graph
In actual practice, forecasting contrails is not so objective. To beginwith, the forecaster must enter the graph with a forecast value of temperaturefor the particular pressure level. If the resulting point falls in the"Possible" area, a forecast relative humidity is also required. Chance forerror occurs in forecasting both of these parameters. In addition to theuncertainties in forecasts of upper-air temperatures, very large horizontaltemperature gradients occasionally exist in the atmosphere. Measurements have
3
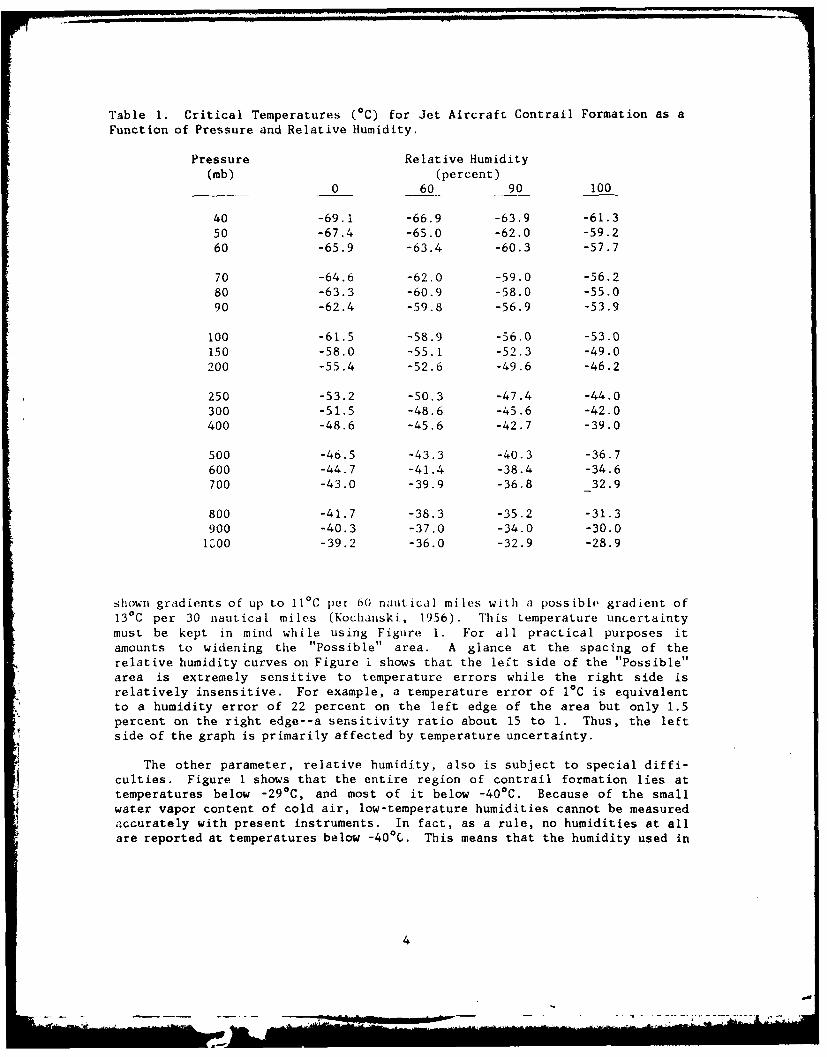
Table 1. Critical Temperatures (°C) for Jet Aircraft Contrail Formation as aFunction of Pressure and Relative Humidity.
Pressure Relative Humidity(mb) (percent)
0 60 90 100
40 -69.1 -66.9 -63.9 -61.350 -67.4 -65.0 -62.0 -59.260 -65.9 -63.4 -60.3 -57.7
70 -64.6 -62.0 -59.0 -56.280 -63.3 -60.9 -58.0 -55.090 -62.4 -59.8 -56.9 -53.9
100 -61.5 -58.9 -56.0 -53.0150 -58.0 -55.1 -52.3 -49.0
200 -55.4 -52.6 -49.6 -46.2
250 -53.2 -50.3 -47.4 -44.0300 -51.5 -48.6 -45.6 -42.0400 -48.6 -45.6 -42.7 -39.0
500 -46.5 -43.3 -40.3 -36.7600 -44.7 -41.4 -38.4 -34.6700 -43.0 -39.9 -36.8 32.9
800 -41.7 -38.3 -35.2 -31.3900 -40.3 -37.0 -34.0 -30.0IL00 -39.2 -36.0 -32.9 -28.9
shown gradients of up to 110C per bO nautical miles with a possible gradient of13 0 C per 30 nautical miles (Kochanski, 1956). This temperature uncertaintymust be kept in mind while using Figure 1. For all practical purposes itamounts to widening the "Possible" area. A glance at the spacing of therelative humidity curves on Figure 1 shows that the left side of the "Possible"area is extremely sensitive to temperature errors while the right side isrelatively insensitive. For example, a temperature error of 10C is equivalentto a humidity error of 22 percent on the left edge of the area but only 1.5
percent on the right edge--a sensitivity ratio about 15 to 1. Thus, the leftside of the graph is primarily affected by temperature uncertainty.
The other parameter, relative humidity, also is subject to special diffi-culties. Figure 1 shows that the entire region of contrail formation lies attemperatures below -290C, and most of it below -400C. Because of the smallwater vapor content of cold air, low-temperature humidities cannot be measuredaccurately with present instruments. In fact, as a rule, no humidities at all
are reported at temperatures below -400C. This means that the humidity used in
4
I ... i,,'. ' il II i lmlg lil iil l-l
aIN

Pressure Presuon Altitude(m b) (100's ft)40
I70
50I' 65 :
60 65
70 -60
80
90- 55100
Relotive Humidity (%) 500 6090 100
150 -45
40200-Yes Possible No
250ICAO STANDARD
300- ATMOSPHERE 30
300-320400\\\-. * o
50015
600
700 10
800900
1000- -00-70 -60 -50 -40 -30 -20
Temperature (*C)
Figure 1. Graph of the Relative Humidity Required for Jet Aircraft Contrail
Formation as a Function of the Pressure and Temperature of the Environment.
5

accurately with present instruments. In fact, as a rule, no humidities at allare reported at temperatures below -40 0 C. This means that the humidity used inFigure 1 must be "forecast" almost entirely from general knowledge of upper-airhum id i ty. Hloweve r, low-t tiporature hum di ty mteasuretmitellts have been made soSel Idom that our knowledge of them is scant. Empirical studies indicate thathe t results will generally be obtained by ,ssuming a relative humidity Of 40
percent. In the imtttediate vicinity of a itigh-cloud deck or near the tropo-pause, it is recommended that a hu, midity of 70 percent be assumed.
The final di fficult y wi th contrail forecasting is that trai Is are fre-quently not observed under adverse viewing conditions, such as against a densecirrostratus background or looking into the sun. Thus, there will always be asizable number of "no-trail" reports in the "Yes" region of the graph.
S4 ?orecas t i gwith the Contrail-Formation Graph
I* a flight is planned for a spcific altitude, the temperatures along the.,Ith at that altitude tre forecast using radiosondes, upper-air charts, recon-:iaissance reports, etc. The humidity is assumed to be 40 percent everywherealong the route, except near tile Lropopause or where clouds are present atflight level where it is assumed to be 70 percent. The pressure-temperaturevalues along the path are entered in Figure 1 (or Figure 2, which presents thec-uiives of Figure 1 ott a Skew T, Log P Diagram). If the required relativehumidity shown on the graph is greater than the assumed value, no contrails areforecast; if the reqaired value is less than the assumed value, contrails areforecast. The farther apart the required and assumed v'alues, the more confi-dence can be placed in the forecast.
In addition to the flight level forecast, the forecaster should determinethe proper direction (up or down) that tile aircraft should take to leave acontrail-producing layer quickly.
2.5 Accuracy_f Contrail-GraphForecasts
An extensive evaluation of tile contrail-formation graph, based on over 3000jet aircraft observations, was carried out in 1952 and 1953 (AWS, 1953,Table 28). The "Yes" area (to the left of the 0 percent line) showed 857positive reports and 125 negative reports for an accuracy of 87 percent. The"No" area (to the right of the 100 percent line) showed 70 positive reports and546 negative reports for an accuracy of 89 percent. Since no humidity datawere available, no determination could be made of forecast accuracy inside the"Possible" area. However, this area was divided into subregions Pl, P2, and P3-s delineated on the 0-60, 60-90, and 90-100 percent ]ines, and the contrailfrequencies determined; these were 69, 54, and 30 percent, respectively. Mostof the temperatures were measured by the aircraft and corrected for dynamicheating. Such measurements are generally not as accurate as desired forresearch purposes.
A second test, carried out in Europe, was based on radiosonde temperatures.It was reported in AWS TR 105-126 (AWS, 19.54). The "Yes" area showed 297positive reports and 49 negative reports for an accuracy of 86 percent.
6

100 to0
1200
1200
[40] 15
[50] 200
0/0
250 25
350 250
[75] 300 C) 400
350 45'/ 0
500 400
60] 400
650 00 0\60\0450
700 500
750 550
600,850 0650
900 700950 950
1000 1000
Figure 2. The Jet Aircraft Contrail-Formation Curves Plotted on a Portion of aSkew T, Log P Diagram. Dashed lines and brackets ii~dicate curves in the 100-
to4-mb region. One version of the SeTLgPiarm DD-WPC 9-16hathe curves overprinted on it.
7

f.q
The "No" area showed 33 positive reports and 698 negative reports for an
accuracy of 95 percent. Region PI, P2, and P3 showed contrail frequencies of
55, 41, and 34 percent respectively.
In general, therefore, the accuracy of the contrail graph using radiosonde
temperature data can be considered to be about 85 percent in the "Yes" region
and close to 95 percent in the "No" region. Both accuracies would, of course,increase with distance of the points from the 0 and 100 percent relative
humidity curves. With a decrease in reliability of the temperature data and/or
the need to forecast relative humidities for points falling in the "Possible"
rogion of the graph, forecast accuracies would decrease. In these cases, it
nay trequently prove more useful not to attempt a yes-or-no forecast, butrather to give the probability of contrail formation as a function of theptesstire and temperature. Such contrail probability curves are presented inChajt er 3.
. A \FGWC Forecastin _of Contrail Formation
AFGWC has a (.onLrail computer program for determining tops and bottoms oflayers within which contrails are expected to occur. Because of operational
considerations, only two contrail layers are retained for each grid pointconcerned. The program assumes relative humidity values of 40 percent from 500
nib to approximatel) 300 meters below the tropopause level, 70 percent in the
vicinity of the tropopause, and 10 percent in the stratosphere. Predictions
are made for the Northern Hemisphere and the tropics.
2.7 Effect of Power Setting on Contrail Formation by Jet Aircraft
It has been suggested that the formation of condensation trails might beprevented by varying the power setting of the aircraft engines. Because of the
importance of this point, a test was set up to gather data which would show the
relationship between contrail frequency and power setting (AWS, 1954). Using atotal of 1878 F-84 observations, it was found that a variation in power setting
from 85 to 98 percent of full power had no effect on contrail frequency.However, increased power settings did seem to result in increased trail inten-
sity. These empirical results are in accordance with theoretical expectations(see Section 2.1 above).
'odson (1954), a Canadian meteorologist, reached the same conclusion. In an:ndependent derivation of the critical conditions for contrail formation by jetaii.craft, he states, "This relation is independent of fuel consumption rate and
is therefore valid for any type of jet aircraft which uses a fuel comparable tokerosene."
8

Chapter 3
EMPIRICAL CONTRAIL-PROBABILITY CURVESFOR JET AIRCRAFT
3.1 Introduction
The theoretically derived curves presented in Chapter 2 show the pressure-temperature-relative humidity relationship necessary for contrail formation bythe exhaust from jet aircraft. These curves permit a specific yes-or-nocontrail forecast provided the temperature and relative humidity are known forthe level of interest. As pointed out in Section 2.3, however, there is anuncertainty in the temperature measurement, and generally only a guess can bemade regarding the true relative humidity.
To bypass these difficulties, AWS decided to obtain sufficient data to makean empirical study of contrail frequency as a function of pressure and tempera-ture alone. In this way, both the temperature uncertainty and the actual meanrelative humidity at each pressure-level point are absorbed into the frequencycurves. This method does not generally allow a yes-or-no forecast; it does,however, permit a statement as to the relative frequency (i.e., empiricalprobability) of contrail formation for any given value of pressure and tempera-ture.
3.2 Procedure
Project Cloud Trail was set up for one year (I December 1954 to 1 December1955) to obtain the necessary data. Data from twenty-three rawinsonde stationswere utilized in conjunction with data collected by Air Defense Command F-86aircraft. These fighter-interceptors climbed above the stations within onehour before to two hours after 1530Z. A wingman observed and recorded thebases and tops of any contrail layers on a special card.
Data on the occurrence and nonoccurrence of contrails at six pressurelevels--350, 300, 250, 200, 175, and 150 mb--were extracted from the cards.The associated temperatures were obtained from the raob. The contrail fre-quency was determined for each pressure-temperature point, and curves ofcontrail frequency drawn as functions of pressure and temperature. A moredetailed account of this procedure is given by Appleman (1957) in AWS TR
14 105-145. Separate studies were made for each season, for the northern andsouthern halves of the United States, and for the troposphere and stratosphere.Finally, a mean study was made combining the data from all seasons and stations(Table 2 and Figure 3). There was little difference between this mean graphand the individual graphs. Consequently, the mean graph can be used for allregions and seasons.
9

3.3 Use of the ConLrail-ProbabilitGr
The solid lines of Figure 3 show the probability of a jet aircraft produc-ing visible trails at the indicated pressures and temperatures. Unfortunately,the vertical range of the empirical curves is limited to the region between 350and 150 mb. Below 350 mb, temperatures tend to be too warm for contrailformation; above 150 mb, observations were too few to derive reliable proba-bilities.
The dashed lines on Figure 3 are the theoretically derived critical rela-tive humidity curves for contrail formation from figure 1. Assuming that thetheoretical curves are exact, perfect data would result in the 0 percent
contrail-probability curve coinciding with the 100 percent humidity line, andthe 100 percent probability curve coinciding with the 0 percent humidity line.As expected from the discussion in Section 2.3, on the right side of the graphthe theoretical and empirical curves are in good agreement; on the left side,there is a temperature deviation of from 2.5 to 50C between the theoreticalcurves and the 95 percent probability line. The deviation is largest near 250nib, and is 40C or more between 210 and 300 mb; this is the region between thepolar and tropical tropopauses. Below 300 mb, the deviation reduces markedlyand would be only 1 or 20 C at 350 mb.
Although the theoretical curves may actually be more representative ofcontrail formation with perfect data, the probability curves are more represen-tative of the data available to the operational forecaster. To use the proba-bility curves, the forecaster refers to the most recent radiosonde temperaturesand upper-air charts available for the altitudes under consideration. Time andspace extrapolation is then applied to bring the temperature to its most likelyvalue at the time and place of interest. Using this temperature and altitude,the contrail-probability graph gives the actual percentage probability ofcontrail formation.
Table 2. Probability of Jet Aircraft Contrail Formation as a Function ofPressure and Temperature
Pressure Contrail Probability(mb) (percent)
95 90 75 50 25 10 5
150 -60.5 0 C -59.30 C -57.1 0 C -55.5 0C -53.6 0 C -51.5 0C -30.7 0 C175 -58.8 -57.4 -55.3 -53.6 -51.4 -49.6 -48.5200 -58.5 -56.6 -54.8 -53.1 -51.0 -48.5 -47.0
250 -58.1 -56.3 -53.8 -52.2 -50.1 -47.1 -45.3
300 -55.5 -54.0 -52.0 -50.7 -49.1 -46.3 -44.3350 -49.9 -49.4 -49.0 -48.0 -45.9 -43.6
10

Pressure (mb) Pressure Altitude (ft)
150
9 90 \7 50 25 Iq5 \
175\\ \200 --______- -- 40,000
250 .- 35,000
300 0 060 90 ib0
3 0
I±b O\ 30,000
-65 -60 -55 -50 -45 -40Temperature (OC)
Figure 3. Probability of Jet Aircraft Contrail Formation as a Function of
Pressure and Temperature. Solid lines are empirically derived curves of
contrail probability (percent). Dashed lines are theoretically derived curves
of minimum relative humidity (percent) required for contrail formation.
*1I
q1
. ...-. -
This Document Contains
Missing Page/s That Are
Unavailable In The
Original Document
BESTAVAILABLE COPY

Chapter 4
CONTRAIL-FORMATION GRAPH FORPROPELLER AIRCRAFT
4.1 Introduction
In the case of jet exhaust trails, the parameters which deLermi! e ti.formation of a saturated wake (p, T, RH, W/H) are independent of the aircrafttype and fuel consumption rate. With conventional propeller aircraft, however,although all the water vapor is injected into the wake, a significant portion
of the heat is dissipated outside the wake in the form of heat losses from theradiator and mechanical losses from the propeller. The exact amount lost irn
this manner varies with the type of aircraft and the conditions under which Jtis operating. It is generally assumed to run 20 to 40 percent. With turbopropaircraft the loss would be less, Such external heat losses result in higherrelative humidities inside the wake and increase the probability of trailformation.
Since the value of W/H injected into the wake of propeller aircraft is not
a constant, it is not feasible to construct theoretical curves showing theconditions under which contrails form. Instead, actual data were gathered fromB-29 and B-36 aircraft, and empirical curves constructed. These curves apply
primarily to multiengine aircraft flying under normal cruise conditions. Underconditions of excessive fuel consumption, such as climbing or operating nearmaximum altitude, there is an increased tendency for trail formation.
4.2 prpeller Aircraft Contrail-Formation Graph
The best graph for propeller aircraft proved to be similar to the graph forjet aircraft but displaced a few degrees to the right (Table 3 and Figure 4).
The line of demarcation separating the new "Yes" and "Possible" regions is thejet aircraft 90 percent relative humidity line. The line of demarcationseparating the new "Possible" and "No" regions is a line parallel to and 3*C tothe right of the jet aircraft 100 percent relative humidity line--the R-line inAWS TR 105-112 (AWS, 1953).
As mentioned previously, the operation of a propeller aircraft near itsmaximum altitude results in increased contrail probability. To compensate forthis effect, it is recommended that the two bounding curves be broken at a
point 5000 feet below the operating ceiling of the aircraft, and drawn throughtemperature values at the operating ceiling 5oC warmer than their formerpositions. An example of this adjustment for a propeller aircraft with anoperating ceiling of 45,000 feet is shown in Figure 5.
13

4.3 Evaluation of the Formation-Graph Accuracy
An evaluation of the graph in Figure 4 was carried out using a largequantity of B-36 data LAWS, [953, Table 14). ()n ly tJIhe propollet" tligilies wetretested. 1In the "Yes" area, the r were 1451) posit ive contrail er rts and 54negative reports for an atcuracy of 96 porcent. in the "No" area, there were30o9 negative reports but only 92 positive reports for an accuracy of 97percent. The contrail frequency in the area between the new "Yes" boundaryline in Figure 4 (the jet aircraft 90 percent relative humidity line) and thejet aircraft 100 percent relative humidity line was 81 percent and between the100 percent line and the boundary of the new "No" area was 44 percent.
Table 3. Critical Temperatures for Contrail Formation by Propeller Aircraft
Temperature (0 C)Pressure
(mb) Left Right___ Boundary BoundAry
100 -56.0 -50.0150 -52.3 -46.0200 -49.6 -43.2250 -47.4 -41.0
300 -45.6 -39.0400 -42.7 -36.0500 -40.3 -33.7600 -38.4 -31.6
700 -36.8 -29.9800 -35.2 -28.3900 -34.0 -27.01000 -32.9 -25.9
14

Preqsure Pressur Altitude(mb) (1000s ft)100
-50
150- 4
-40200-
I--5
250 5ICAO STANDARD
300-=c ATMOSPHERE 30YES * NO
400-sssss 2
20500-
600 ~JET- -AIRCRAFT700- 100% RH LINE 0
9000
-70 -60 -5o) -40 -30 -20
Temperature (00
Figure 4. Propeller Aircraft Contrail -Formation Graph.
15
low _ &h~sh~' . .

0 0 /uOPERATIN CELNG4,00
OPERTIN CELINGMINS 500'--40000
200 m
C3d
EXAMPLE FOR AIRCRAFT WITHOPERATING CEILING AT 45,000 FT
Figure 5. Modification of Propeller Aircraft Contrail Curves Near OperatingCeiling.
16

Chapter 5
POSSI BLE 1 NPROVEMENTS IN CONTRAIL FORECASTING
When humidity elements sufficiently responsive at low temperatures aredeveloped for rawinsondes, the forecasting of contrails by these methods shoul 1
improve. Meanwhile, several empirical methods of estimating the humidi..parameter have been suggested, such as correlating the wind directioi afo.with humidity or with contrail occurrences (Kern, 1956).
Pilie and Jiusto (1956) suggest that the assumed critical water content forvisibility of a contrail is valid only for ideal illumination conditions andviewing angles. This effect may also greatly depend on the contrail particlesize and type. For including these effects, theoretical or empirical correc-tions to the present curves might be feasible. One study (Wilson, 1978)discussed a computer program to calculate the co-itrasts of a smoky rocketexhaust trail in various prevailing weather conditions and estimated thethreshold contrast necessary for the plume to be visible to an average obser-ver. Two kinds of observations were considered: side-on, in which the rocketthat produced the smoke trail is assumed to be flying horizontal and at rightangles to the observer, and head-on, in which the rocket is assumed to beflying directly at the observer.
Another study suggested that not all the energy from fuel combustionimmediately appears as heat. Thus, condensation (and the almost immediate icenucleation) may occur before all the heat from combustion has been ma.iifested.If the ambient condition is saturated with respect to ice, the contrail willpersist (Knollenberg, 1972). This could allow contrails to appear in the "No"region of Figure 1 as is sometimes observed (Knollenberg, 1972; Konrad andHoward, 1974).
17

This Document Contains
Missing Page/s That Are
Unavailable In The
Original Document
BESTAVAILABLE COPY

Chapter 6
SU ARY
o. 1 Foreca tin8 Je t A i rcra f t Coy idens at ion Trails
Figures 1 and 2 can be used to issue a yes-or-no contrail forecast in
area and any season from the surface of the earth to the 40-mb surfac,-.
major weakness is the difficulty in accurately forecasting the temperature ad
relative humidity, the former because of the large horizontal temperature
gradients that occasionally occur in the upper atmosphere, the latter because
relative humidity is rarely measured at the low temperatures where contrails
occur. Past studies indicate best results are obtained by assuming a relative
humidity near 40 percent, except when near the tropopause or clouds where the
value should be 70 percent.
To avoid the above temperature and relative humidity uncertainties, empir-
ically determined contrail probability curves (Figure 3) enable the forecaster
to state the probability of contrail formation for a given value of pressure
and temperature. These curves do not permit a yes-or-no type of forecast.
Also, they are presently available only between the 350- and 150-mb pressure
surfaces.
Both the theory and the results of a detailed and extensive test program
indicate that a change in engine power setting has no affect on whether or not
contrails form. There is some indication that an increase in power setting
results in a somewhat more intense trail. The same conclusions can be drawn
with regard to other factors affecting the rate of fuel consumption such as the
type of jet aircraft, and flight altitude (climbing, level flight, or
descending). Only contrail intensity is affected, not contrail probability.
6.2 Forecasting Propeller Aircraft Condensation Trails
Although all the combustion water vapor is injected into the wake of
propeller-driven aircraft, from 20 to 40 percent of the heat is dissipated
outside the wake in the form of heat losses from the radiator and mechanical
losses from the propeller. This results in a higher relative humidity in the
wake and a greater probability of contrails. The percentage of heat loss is
not constant; it varies somewhat with aircraft type, altitude, operating
efficiency, etc.
Because of the variation in the ratio of water vapor to heat in the exhaust
gas, empirical contrail-forecasting curves were determined for the most impor-tant case--multiengine aircraft in normal flight. The curves are shown inFigure 4. They were found to be parallel to the jet curves but displaced a few
19

degrees to the right. Although most of the data were obtained from between25,000 and 40,000 feet, the curves were arhitrarily cont inued parallel to tlejet curv's from I 1000 to 100 [11.
When flying near the operational ceiling, the water vapor to heat ratio inaAi -raft exhaust increases, thus increasing contrail probability. A correctionfor this effect is given in Section 4.2 and is illustrated in Figure 5.Climbing also results in a greater tendency for contrail formation by propelleraircraft.
20
.- I

REFERENCES
Appleman, H.S., 1953: The Formiat ion of Exhaust Condensation Trails by JetAircraft, Bull. Amer. Se,. Soc., Vol. 34, No. 1, 14-20.
Applemmn, H.S., 1957: Derivation of Jet-Aircraft Contrail-Formation Curves,AWS TR 105-145, January 1957 (AD-125760).
AWS, 1953: A Further Analysis of Contrail Data, AWS TR 105-112, December 1933(AD-26922). This TR was made obsolete by AWS TR 105-145 above.
AWS, 1954: Memorandum on Effect of Engine Power Setting on Contrail Formationand Intensity, AWS TR 105-126, August 1954 (AD-74310).
Godson, W. L., 1954: The Foundation of Condensation Trails by Jet Aircraft,CIR-2423, TEC-178, Meteorological Division, Department of Transport,Canada, 1-10.
Kern, C. D., 1956: Contrail Forecasting at Albuquerque: A Preliminary Study,3d Weather Group Technical Bulletin, Vol. IV, No. 1, March 1956.
Kochanski, A., 1956: Horizontal Temperature Gradient at 200 mb and AdjacentLevels, Bull. Amer. Met. Soc., Vol. 37, No. 2, 47-54.
Konrad, T.G. and J.C. Howard, 1978: Multiple Contrail Streamers Gbsal.'cd byRadar, J. of Appl. Met., Vol. 13, No. 5, 563-572.
Knollenberg, R.G. , 1972: Measurements of the Growth of thc ;r-.- iudget n d
Persisting Contrail, J. of Atmos Sci. , Vol. 29, 1367-1374.
Oesterle, F., 1956: Condensation Trail Prediction, Final Report, Department ofMechanical Engineering, Carnegie Inst. of Tech.
Pilie, R.J., and J.E. Jiusto, 1956: A Laboratory Study of Contrails, J. ofMet., Vol. 15, No. 2, 149-154.
Wilson, A.S., 1978; Contrail: A Computer Code for Calculating the VisibleContrast of a Rocket Exhaust Smoke Trail, Propellents, Explosives and
RocketMotor Establishment - Wescott (England), April 1978.
DISTRIBUTIONHQ AWS, AWS Wings, AWS Squadrons, AWS Detachments--I copy eachSpecial Distribution List--i copy each
21