For personal use only - corporate-ir.net
16
BILLABONG INTERNATIONAL LIMITED ABN 17 084 923 946 FULL YEAR RESULTS PRESENTATION 08 09 For personal use only
Transcript of For personal use only - corporate-ir.net

BILLABONG INTERNATIONAL LIMITED ABN 17 084 923 946
FULL YEAR RESULTS PRESENTATION
0809
For
per
sona
l use
onl
y
2
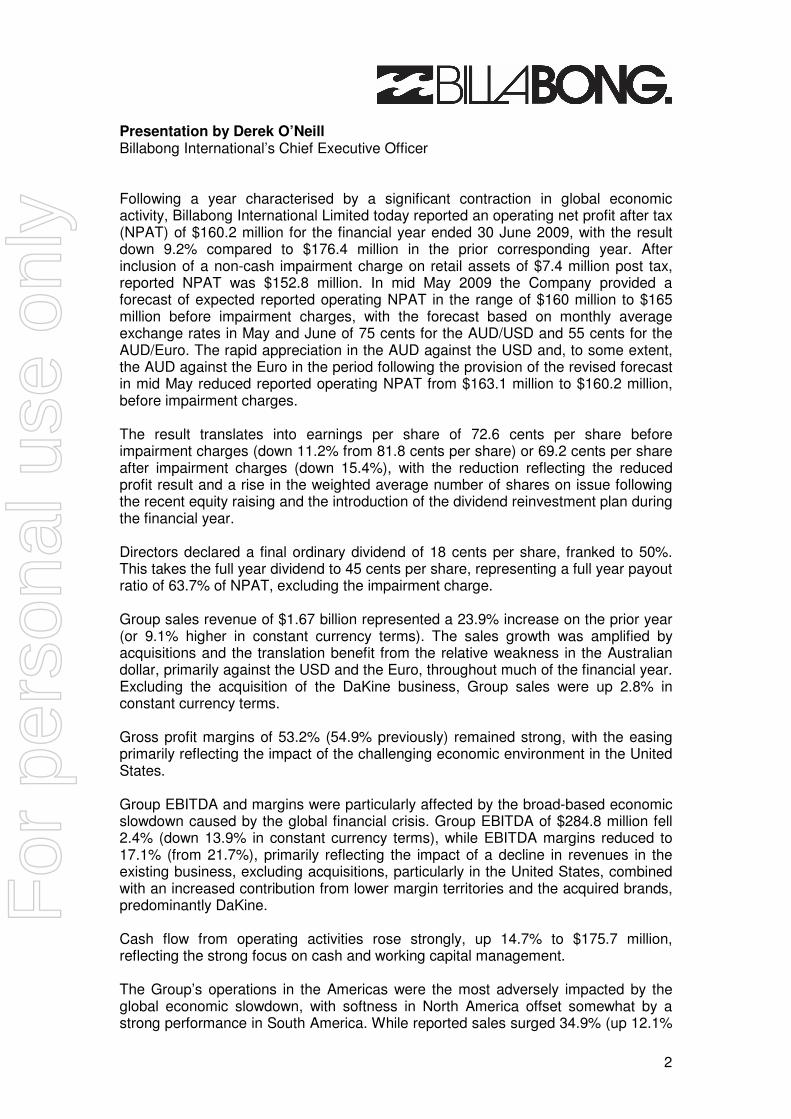
Presentation by Derek O’Neill Billabong International’s Chief Executive Officer Following a year characterised by a significant contraction in global economic activity, Billabong International Limited today reported an operating net profit after tax (NPAT) of $160.2 million for the financial year ended 30 June 2009, with the result down 9.2% compared to $176.4 million in the prior corresponding year. After inclusion of a non-cash impairment charge on retail assets of $7.4 million post tax, reported NPAT was $152.8 million. In mid May 2009 the Company provided a forecast of expected reported operating NPAT in the range of $160 million to $165 million before impairment charges, with the forecast based on monthly average exchange rates in May and June of 75 cents for the AUD/USD and 55 cents for the AUD/Euro. The rapid appreciation in the AUD against the USD and, to some extent, the AUD against the Euro in the period following the provision of the revised forecast in mid May reduced reported operating NPAT from $163.1 million to $160.2 million, before impairment charges. The result translates into earnings per share of 72.6 cents per share before impairment charges (down 11.2% from 81.8 cents per share) or 69.2 cents per share after impairment charges (down 15.4%), with the reduction reflecting the reduced profit result and a rise in the weighted average number of shares on issue following the recent equity raising and the introduction of the dividend reinvestment plan during the financial year. Directors declared a final ordinary dividend of 18 cents per share, franked to 50%. This takes the full year dividend to 45 cents per share, representing a full year payout ratio of 63.7% of NPAT, excluding the impairment charge. Group sales revenue of $1.67 billion represented a 23.9% increase on the prior year (or 9.1% higher in constant currency terms). The sales growth was amplified by acquisitions and the translation benefit from the relative weakness in the Australian dollar, primarily against the USD and the Euro, throughout much of the financial year. Excluding the acquisition of the DaKine business, Group sales were up 2.8% in constant currency terms. Gross profit margins of 53.2% (54.9% previously) remained strong, with the easing primarily reflecting the impact of the challenging economic environment in the United States. Group EBITDA and margins were particularly affected by the broad-based economic slowdown caused by the global financial crisis. Group EBITDA of $284.8 million fell 2.4% (down 13.9% in constant currency terms), while EBITDA margins reduced to 17.1% (from 21.7%), primarily reflecting the impact of a decline in revenues in the existing business, excluding acquisitions, particularly in the United States, combined with an increased contribution from lower margin territories and the acquired brands, predominantly DaKine. Cash flow from operating activities rose strongly, up 14.7% to $175.7 million, reflecting the strong focus on cash and working capital management. The Group’s operations in the Americas were the most adversely impacted by the global economic slowdown, with softness in North America offset somewhat by a strong performance in South America. While reported sales surged 34.9% (up 12.1%
For
per
sona
l use
onl
y
3
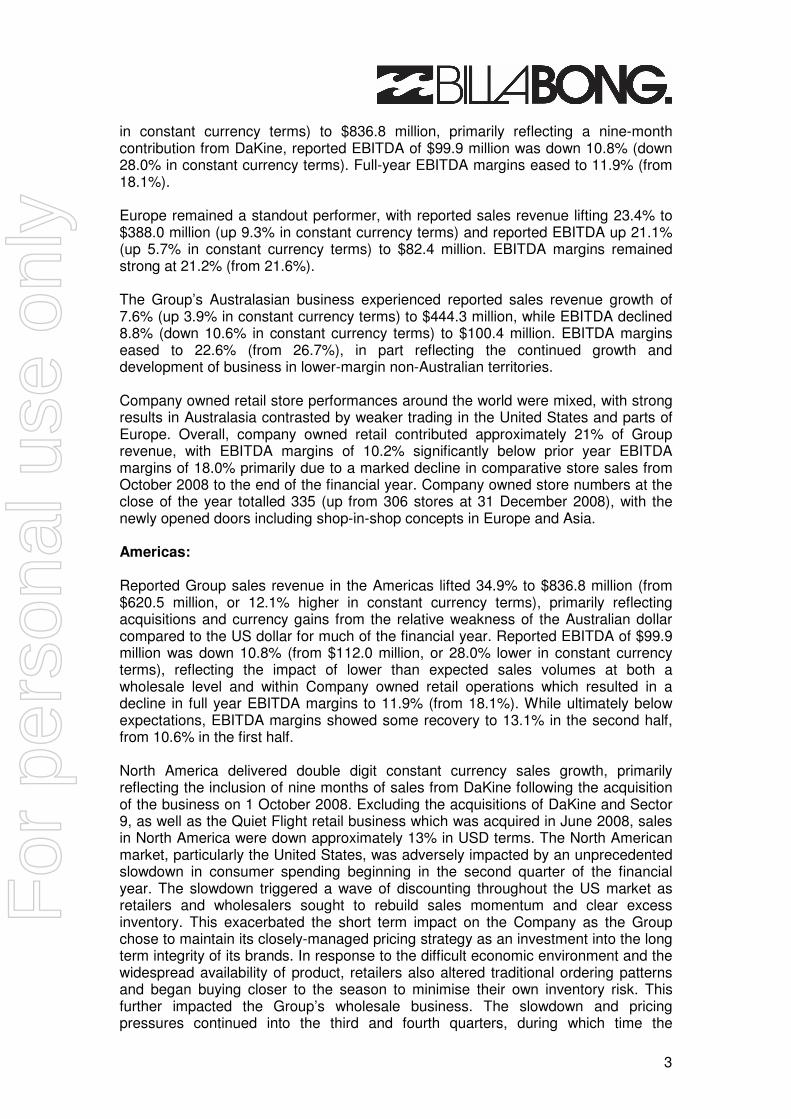
in constant currency terms) to $836.8 million, primarily reflecting a nine-month contribution from DaKine, reported EBITDA of $99.9 million was down 10.8% (down 28.0% in constant currency terms). Full-year EBITDA margins eased to 11.9% (from 18.1%). Europe remained a standout performer, with reported sales revenue lifting 23.4% to $388.0 million (up 9.3% in constant currency terms) and reported EBITDA up 21.1% (up 5.7% in constant currency terms) to $82.4 million. EBITDA margins remained strong at 21.2% (from 21.6%). The Group’s Australasian business experienced reported sales revenue growth of 7.6% (up 3.9% in constant currency terms) to $444.3 million, while EBITDA declined 8.8% (down 10.6% in constant currency terms) to $100.4 million. EBITDA margins eased to 22.6% (from 26.7%), in part reflecting the continued growth and development of business in lower-margin non-Australian territories. Company owned retail store performances around the world were mixed, with strong results in Australasia contrasted by weaker trading in the United States and parts of Europe. Overall, company owned retail contributed approximately 21% of Group revenue, with EBITDA margins of 10.2% significantly below prior year EBITDA margins of 18.0% primarily due to a marked decline in comparative store sales from October 2008 to the end of the financial year. Company owned store numbers at the close of the year totalled 335 (up from 306 stores at 31 December 2008), with the newly opened doors including shop-in-shop concepts in Europe and Asia. Americas: Reported Group sales revenue in the Americas lifted 34.9% to $836.8 million (from $620.5 million, or 12.1% higher in constant currency terms), primarily reflecting acquisitions and currency gains from the relative weakness of the Australian dollar compared to the US dollar for much of the financial year. Reported EBITDA of $99.9 million was down 10.8% (from $112.0 million, or 28.0% lower in constant currency terms), reflecting the impact of lower than expected sales volumes at both a wholesale level and within Company owned retail operations which resulted in a decline in full year EBITDA margins to 11.9% (from 18.1%). While ultimately below expectations, EBITDA margins showed some recovery to 13.1% in the second half, from 10.6% in the first half. North America delivered double digit constant currency sales growth, primarily reflecting the inclusion of nine months of sales from DaKine following the acquisition of the business on 1 October 2008. Excluding the acquisitions of DaKine and Sector 9, as well as the Quiet Flight retail business which was acquired in June 2008, sales in North America were down approximately 13% in USD terms. The North American market, particularly the United States, was adversely impacted by an unprecedented slowdown in consumer spending beginning in the second quarter of the financial year. The slowdown triggered a wave of discounting throughout the US market as retailers and wholesalers sought to rebuild sales momentum and clear excess inventory. This exacerbated the short term impact on the Company as the Group chose to maintain its closely-managed pricing strategy as an investment into the long term integrity of its brands. In response to the difficult economic environment and the widespread availability of product, retailers also altered traditional ordering patterns and began buying closer to the season to minimise their own inventory risk. This further impacted the Group’s wholesale business. The slowdown and pricing pressures continued into the third and fourth quarters, during which time the
For
per
sona
l use
onl
y

4
Company responded to the conditions by reducing overheads. While there were encouraging signs at retail around the Easter holidays in April, conditions again deteriorated and were worse than previous expectations through May and June. The ongoing structural changes being made to the business, combined with the maintenance of brand equity through the downturn, have positioned the Company well to take advantage of any future return to a more normalised trading environment. Similar macroeconomic conditions were experienced throughout the broader North America region which, combined with the weaker Canadian dollar relative to the USD, adversely impacted the region’s results. However, the Group’s South American operations performed very well, with sales in the region growing approximately 30% in constant currency terms and more than 35% in reported terms, on improving margins. The difficult trading conditions in the Americas, particularly the United States, were felt by each of the brands, although they each competed well in response to their continued focus on product quality and maintenance of brand equity. The Billabong and Element brands experienced percentage sales declines in the mid teens in USD terms. However, these declines were somewhat less significant excluding business with retailer Pacific Sunwear. Nixon performed well, which was pleasing given its ongoing focus on product innovation. Sales of Von Zipper declined in a difficult market for eyewear, wetsuit brand Xcel continued to show good growth and both the Sector 9 skate longboard brand and the DaKine brand made strong initial contributions to the Group. Tigerlily was introduced into the US market late in the year and received an encouraging initial response from retailers. The Group retained its disciplined distribution strategy, which focuses on the independent specialty retail channel and select mall-based chain retailers. The broad-based nature of the consumer slowdown in the United States saw both the specialty channel and chain retailers experience similar sales trends across the country. Most retailers in the boardsports sector indicated they had negative comparative store sales in the teen and low 20% range through most of the second half. As previously foreshadowed, sales to chain retailer Pacific Sunwear continued to decline and accounted for less than 10% of the Group’s sales in the Americas. This followed the Group’s reluctance to endorse Pacific Sunwear’s shift into a value price driven retail offer. The Group’s own retail network recorded good sales growth following a lift in stores numbers to 111 (from 97 at the half year), with half of the new doors added in South America. Looking ahead, the Company anticipates a continuation of negative comparative store sales through the first quarter, although the size of the declines is expected to moderate. From the second quarter, the Company begins to cycle the prior year’s lower sales levels so comparative store sales are expected to improve. The Group’s overall inventory holding in the Americas was brought back to very manageable levels in the second half of the year and there is a growing expectation that retailers are likely to experience an inventory shortage in key categories leading into the holiday season in the second quarter of the 2009-10 financial year. While this is yet to translate into a return to traditional forward ordering patterns, the overhang of excess product in the retail channel had begun to dissipate by the close of the 2008-09 financial year. Storewide promotional activity throughout the boardsport retail channel is showing some signs of easing, although continued in-season discounting by some competitors may further delay any immediate return to traditional indent patterns.
For
per
sona
l use
onl
y

5
Europe: Europe maintained its strong momentum, with reported sales revenue lifting 23.4% to $388.0 million (from $314.4 million, or 9.3% higher in constant currency terms), with organic growth and currency translation benefits contributing to the reported rise. Reported EBITDA climbed 21.1% to $82.4 million (from $68.0 million, or 5.7% higher in constant currency terms). EBITDA margins remained strong at 21.2% (from 21.6%), with adverse currency impacts from the weakening British pound compared to the Euro offset by operational synergies and currency-related product purchasing benefits. Germany and other central European countries were the standout territories, while Italy performed well through the year but softened a little in the latter part of the period. Eastern Europe performed well but some territories were impacted by significant shifts in currency which weakened retailer and consumer buying power. The difficult trading environment that has defined the United Kingdom retail market for some years remained largely unchanged but there were positive signs late in the second half of the financial year, while high unemployment levels in Spain resulted in a modest decline in Group sales in the territory. While the macroeconomic environment throughout the region was subdued and numerous economies officially were in recession, there were limited signs of the dramatic market deterioration that impacted the North America region. Among the Group’s brands, sales of Billabong remained steady, while Element, Von Zipper and Nixon all showed strong growth. The Company’s own retail network in Europe grew to 81 doors (from 77 at the half year), with 25 of the total doors being low overhead shop-in-shop locations primarily in Spain. The primary contributor to the growth of the Company owned store base was the acquisition of the 2 Seasons retail business in the UK. The acquisition has brought new retail management experience into the Group and the Company is beginning to see improvements in its entire UK retail portfolio. The decline of various European economies is tempering growth opportunities in some territories but the Company still anticipates solid ongoing sales growth, particularly given the conversion of a number of DaKine’s European distributors into directly-controlled operations in the 2009-10 financial year. The Company has continued to realise market share gains within the core specialty retail channel and continues to see strong growth opportunities. Retailers showed a level of caution late in the 2008-09 financial year due to erratic and generally cooler summer weather patterns. This was evident through repeat business in the spring and summer period. While the winter forward order book is strong on the back of a very good season in the prior year, it is expected that retailers will again show some caution in early orders for spring and summer 2010. Overall, the Company’s brands remain in strong demand and continue to gain market share. Australasia: The ongoing development of the Group’s business in the Australasian region contributed to a 7.6% increase in reported sales revenue to $444.3 million (from $412.7 million, or 3.9% higher in constant currency terms). Reported EBITDA eased 8.8% to $100.4 million (from $110.1 million, or 10.6% lower in constant currency terms), reflecting lower EBITDA margins in Australia, combined with growing contributions from lower margin territories outside Australia, which contributed to an
For
per
sona
l use
onl
y

6
easing in EBITDA margins to 22.6% (from 26.7%). EBITDA margins in Australia eased in the second half in part reflecting weaker product purchase hedge rates compared to the prior year. Group sales in Australia remained steady, despite some retailers exercising caution and de-stocking their stores. Overall, the Australian retail environment remained resilient through the year, although it is difficult to separate sustainable underlying demand from spending supported by the Federal Government’s economic stimulus packages. There was strong constant currency sales growth in all Asian territories, while New Zealand and South Africa experienced more modest growth. The performance of each of the brands was generally reflective of trends in individual regional economies, although Nixon experienced good growth and Tigerlily performed very strongly in Australia. Billabong and Element were recognised as leading brands within their target market, with both placing highly in the Australian results of a global youth survey. Retailers remained cautious through the year in anticipation of a sharp slowdown in demand along the lines of that experienced in the United States. However, this did not materialise and retailers generally ended the period in a clean inventory position. Within the Company’s own retail network, sales were strong. The number of company owned doors in the region grew to 143 stores (from 132 at the half year) and comprised standalone retail doors as well as shop-in-shops in emerging Asian territories. The vast majority of the region’s own retail network is in areas outside of Australia, with Asia providing the primary growth opportunities. The Australasian region ended the year with good momentum and confidence is beginning to return in most territories. Forward orders in Australia are flat to slightly down, but early repeat business has been very good. It is anticipated forward orders will begin to lift again through 2009-10 as retailers seek to minimise the risk of in-season product shortages. Elsewhere in the region, the Group’s business in Japan slowed in the last quarter of 2008-09 and the early part of the new financial year after being particularly resilient through the depth of the country’s recession. Strong sales and profit growth is expected through the balance of Asia on the back of further growth in the account base. New Zealand’s performance was satisfactory through the year, while business in South Africa remains difficult, particularly given the large fluctuations in the South African Rand and the resultant impact on product pricing. Summary and Outlook: The Company completed the 2008-09 financial year in a relatively strong position, particularly given the series of unprecedented shocks to the global economy and the resultant extreme volatility in exchange rates. Together, these presented enormous challenges in forecasting the expected financial performance of the business. Ultimately, the Group recorded a decline in profit in the 2008-09 financial year which, while uncharacteristic for a company with a strong historical growth profile, was reflective of the trading climate. Highlights for the Company included the protection of brand equity as demonstrated by the preservation of gross profit margins, revenues surpassing the $1.5 billion milestone for the first time, the implementation of ongoing structural changes with a focus on global overhead and higher cashflow from operating activities, with inventory under control.
For
per
sona
l use
onl
y
7
The Company also undertook significant measures to ensure the ongoing strength of its overall financial position. In June 2009 the Group successfully completed an accelerated, non-renounceable, pro-rata entitlement offer to shareholders. The offer, which closed oversubscribed, raised approximately $291 million. Proceeds from the offer were used to pay down existing debt and further strengthen the Company’s balance sheet. As at 30 June 2009, the Company has a conservative gearing ratio of 16%. Following the close of the financial year, the Group also rolled over several of its financing facilities. The first tranche of the Group’s existing US$534 million unsecured, multi-currency, syndicated facility, which was due to roll over on or prior to 1 July 2010, has now been extended to 1 July 2012 and reduced from US$266.75 million to US$216.75 million. The second tranche of this syndicated facility remains unchanged, with a roll over of this facility being required on or prior to 1 July 2011. Separately, the Group also received approval for the extension of its existing US$100 million unsecured, multi-currency, drawdown facility to 1 July 2012, which was due to roll over on or prior to 17 July 2010. Looking to the 2009-10 financial year, the business is generally well positioned. Forward orders remain solid in Europe and reasonably static in Australasia. The US is experiencing lower initial forward orders, but there are early signs of emerging product shortages in some fashion-driven categories and discounting at retail is more sporadic rather than widespread throughout stores. Overall, the current level of business is encouraging but it is difficult to build a recovery in retailer demand and consumer spending into the Group’s forecasts at this time. Therefore, the Group enters the 2009-10 financial year with conservative expectations. In the absence of any further unforeseen, exceptional circumstances impacting the global boardsports market, the Group is forecasting reported NPAT to be flat for the 2009-10 financial year compared to the prior year. This is based on actual monthly average exchange rates for the month of July 2009 and an assumption of August exchange rates as the monthly average exchange rate for the remainder of the 2009-10 financial year, in particular a AUD/USD rate of 83 cents and a AUD/Euro rate of 58 cents. The forecast represents constant currency NPAT growth of approximately 5% when excluding the impairment charge from the prior year, or NPAT growth of approximately 10% when including the impairment charge from the prior year.
For
per
sona
l use
onl
y

8
Presentation by Craig White Billabong International’s Chief Financial Officer The following commentary should be read in conjunction with the attached tables. Table 1: Consolidated Results • As previously foreshadowed, reported operating net profit after tax (NPAT) of
$160.2 million (excluding a $7.4 million post-tax impairment charge relating to the Group’s impaired retail store assets in various countries, but predominately in the United Kingdom and the United States) represents a decrease of 9.2% over the prior year. Including this impairment charge, reported NPAT decreased 13.3% to $152.8 million. In constant currency terms, NPAT decreased by 22.6% over the prior year excluding the impairment charge and 26.2% including the impairment charge.
The components of this result include:
• Reported sales revenue of $1,669.1 million, excluding third party royalties,
represents a 23.9% increase over the prior year. Constant currency sales revenue growth over the prior year was 9.1%.
• The Group’s gross margin remained strong at 53.2% compared to the prior
year’s 54.9%. The 1.7% gross margin decrease reflects a combination of various factors including stronger purchase hedge rates achieved in Australia and Europe offset by higher product sourcing costs, higher levels of promotional activity in the United States in the current challenging trading environment, together with the dilutionary impact of the acquisitions of DaKine and Sector 9 whose gross margins are lower due to the extensive use of third party distributors.
• Reported Group EBITDA of $284.8 million, represents a slight decrease of
2.4% compared to the prior year, principally reflecting the current challenging trading environment, particularly in the United States. In constant currency terms EBITDA decreased 13.9% compared to the prior year.
• The Group’s EBITDA margin of 17.1% is 4.6% lower than that for the prior
year of 21.7%, driven by segment mix with strong reported EBITDA growth and consistent strong EBITDA margins in Europe offset by lower margins in the Americas and, to a lesser extent, Australasia.
• Excluding the impairment charge, earnings per share was 72.6 cents, a decrease of 11.2% over the prior year (81.8 cents). Including the impairment charge, earnings per share was 69.2 cents, a decrease of 15.4% over the prior year. This reduction reflects the reduced profit result and a rise in the weighted average number of shares on issue following the recent equity raising and the introduction of the dividend reinvestment plan during the financial year.
• Return on average equity was 15.5% (2008: 22.7%).
For
per
sona
l use
onl
y

9
Table 2: Depreciation, Amortisation, Impairment Charge, Interest Expense and Tax Expense • Reported depreciation and amortisation expense increased by 40.1% (22.7% in
constant currency terms) to $38.1 million principally due to acquisitions, including DaKine, Sector 9, Quiet Flight and Two Seasons (a 15 store retail business in the United Kingdom), combined with organic retail store expansion.
• The pre-tax impairment charge of $9.5 million reflects management’s best
estimate of the charge required as at 30 June 2009 in relation to the Group’s impaired retail store assets in various countries but predominately the United Kingdom and the United States.
• Reported net interest expense increased 62.6% (43.6% in constant currency
terms) to $31.2 million driven by the capital expenditure requirements for acquisitions and organic retail store expansion, together with increased working capital requirements to support both organic growth as well as acquired businesses.
• The income tax expense for the year is $53.2 million (2008: $69.3 million), an
effective tax rate of 25.8% (2008: 28.2%) reflecting in part the increasing impact of net exempt income from branch operations, in particular GSM (Europe) Pty Ltd, consistent with the Group’s changing segment mix, together with several one-off prior year tax adjustments. Adjusting for these one-off prior year tax adjustments, the effective tax rate would have been approximately 28%. In addition to the bilateral Advanced Pricing Agreement the Group has in place with both the Australian Tax Office and the United States Internal Revenue Service, on 2 July 2009 a unilateral Advanced Pricing Agreement was entered into with the French Taxation Authority in France in relation to the royalty rate used by GSM (Europe) Pty Ltd for the right to use certain Group brands and trademarks. This agreement will cover the period 1 July 2006 to 30 June 2011 and provides certainty for the Group in respect of royalties being paid in accordance with French transfer pricing rules and regulations.
Table 3: Balance Sheet • Working capital (including factored receivables) at $441.0 million represents
28.1% as a percentage of the prior twelve months’ sales stated at year end exchange rates, being a 2.5% increase over the prior year, or a 19.4% increase in absolute dollars compared to revenue growth of 9.1% in constant currency terms, in part reflecting the impact of the acquisition of DaKine for which only nine months of sales were included in the financial year following the acquisition. Excluding the acquisition of DaKine, working capital represents 27.0% as a percentage of the prior twelve months’ sales stated at year end exchange rates, being a 1.4% increase over the prior year, or a 8.8% increase in absolute dollars compared to revenue growth of 3.3% in constant currency terms.
• This working capital result represents a significant improvement on the Group’s
half year working capital position and in particular reflects the impact of strategies adopted by management to return inventory to more normal levels, with inventory excluding DaKine growing by 4.7% compared to revenue growth of 3.3% in constant currency terms.
For
per
sona
l use
onl
y
10
• The doubtful debts provision at $23.1 million is considered to be conservative and
should be sufficient to meet the Group’s requirements. • Net debt decreased 36.6% to $225.0 million taking into account the proceeds
received from the entitlement offer noted below, with a conservative gearing ratio (net debt to net debt plus equity) of 16.0% (2008: 30.9%).
• Interest cover remains strong at 7.1 times (2008: 11.1 times). • On 17 July 2008 a new AUD600 million unsecured, multi-currency, syndicated
facility was entered into by the Group to replace the previous AUD515 million secured facilities and to provide additional liquidity to the Group. The new facility was structured on an unsecured basis with two and three year tranches of AUD300 million each. Consistent with the Group’s capital risk management strategy, on 16 October 2008 the Group converted this facility into a USD533.5 million facility to minimise the volatility in the Group’s financing facilities due to movements in the AUD/USD exchange rate. The two year tranche under this facility, which was due for roll-over on or prior to 1 July 2010, was extended to 1 July 2012 on 11 August 2009 and the facility balance relating to this tranche was reduced from USD266.75 million to USD216.75 million. The three year tranche under this facility is due for roll-over on or prior to 1 July 2011.
• On 21 July 2008 a new AUD100 million unsecured, multi-currency, drawdown
facility was entered into by the Group, replacing the previous secured facility for the same amount. On 22 December 2008 the Group converted this facility into a USD100 million facility to further minimise the volatility in the Group’s financing facilities due to movements in the AUD/USD exchange rate. This new facility, which was due for roll-over on or prior to 17 July 2010, was extended to 1 July 2012 on 30 July 2009, subject to finalisation of formal documentation with the facility provider.
• In May 2009, the Company invited institutional and retail shareholders to
participate in accelerated, non-renounceable, pro-rata entitlement offers to subscribe for 2 new ordinary shares for every 11 existing ordinary shares held at an issue price of $7.50 per share. Each offer was fully underwritten by Goldman Sachs JBWere. Details of these offers are as follows:
• The institutional entitlement offer was made on 18 May 2009 with shares issued on and ranking for dividends after 29 May 2009. As a result, 30.6 million new shares were issued, resulting in cash proceeds of $229.2 million.
• The retail entitlement offer was made on 25 May 2009 with shares issued on and ranking for dividends after 19 June 2009. As a result, 8.2 million new shares were issued, resulting in cash proceeds of $61.6 million.
In total the entitlement offer raised cash proceeds of $290.8 million, before transaction costs. F
or p
erso
nal u
se o
nly

11
• The Dividend Reinvestment Plan (DRP) was approved by the Directors on 21
August 2008. In the financial year ended 30 June 2009, the DRP was offered to ordinary shareholders for the first time and provided the opportunity to acquire fully paid ordinary shares, without transaction costs, at the prevailing market value less 2.5%. For the final dividend to be paid on 23 October 2009, the DRP is optional and offers ordinary shareholders the opportunity to acquire fully paid ordinary shares, without transaction costs, at the prevailing market value. A shareholder can elect to participate in or terminate their involvement in the DRP in respect of the 2009 final dividend at any time prior to the record date of 25 September 2009. The DRP was underwritten to 50% of the 2008 final dividend by Goldman Sachs JBWere and was also underwritten to 50% of the 2009 interim dividend by Goldman Sachs JBWere. The DRP in relation to the 2009 final dividend is not underwritten.
The terms of the DRP may be varied for future dividends beyond the final dividend for the year ended 30 June 2009.
• The unfranked portion of the final ordinary dividend to be paid on 23 October
2009 is declared to be conduit foreign income. Australian dividend withholding tax is not payable by non-resident shareholders on the unfranked portion of the dividend sourced from conduit foreign income.
Table 4: Cash Flow Statement • Cash flow from operations of $175.7 million represents a strong increase of
14.7% over the prior year period driven by both higher net cash receipts and the timing of income tax payments in the prior year offset by higher finance cost payments. Net cash receipts of $258.6 million are 11.7% higher than the prior year period.
• Cash outflow from investing activities of $215.2 million was in accordance with
expectations and includes the acquisitions of DaKine, Sector 9 and Two Seasons, together with general investment in owned retail globally.
For
per
sona
l use
onl
y
12
The following tables should be read in conjunction with the presentation by
Billabong’s Chief Executive Officer and presentation by Billabong’s Chief
Financial Officer as set out in the Full Year Results Summary.
CONSOLIDATED RESULTS
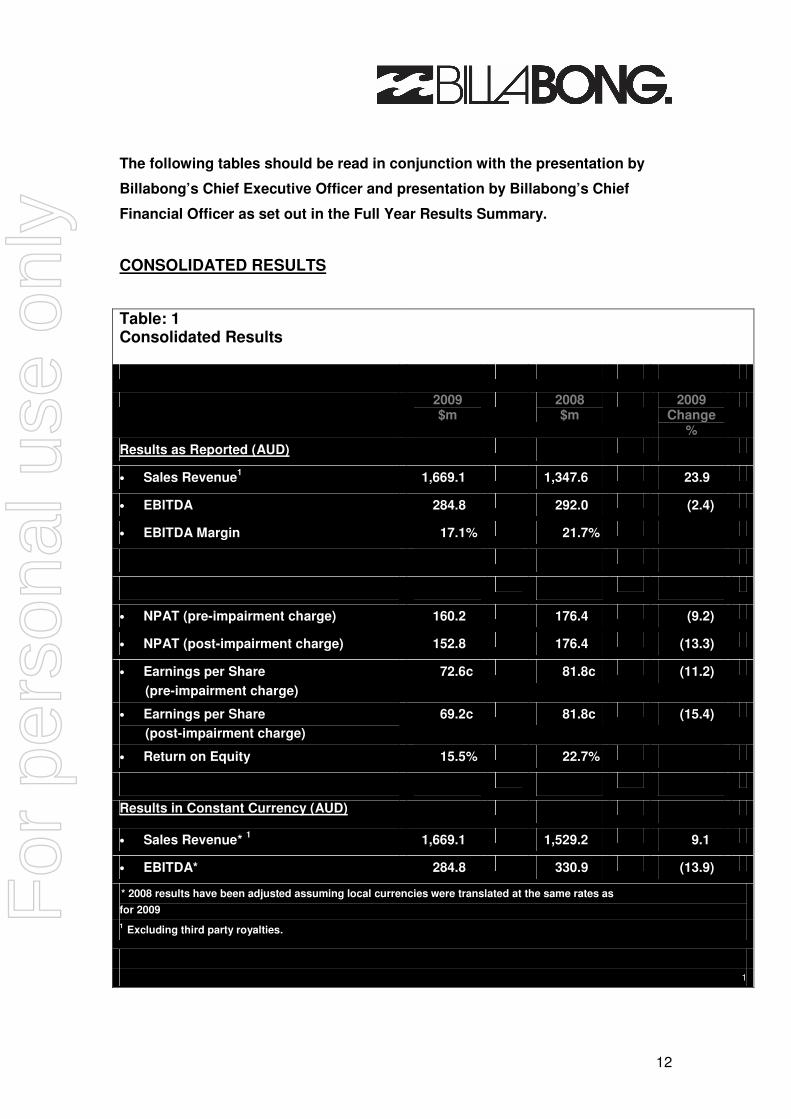
Table: 1 Consolidated Results
2009 $m
2008 $m
2009 Change
%
Results as Reported (AUD)
• Sales Revenue1 1,669.1 1,347.6 23.9
• EBITDA 284.8 292.0 (2.4)
• EBITDA Margin 17.1% 21.7%
• NPAT (pre-impairment charge) 160.2 176.4 (9.2)
• NPAT (post-impairment charge) 152.8 176.4 (13.3)
• Earnings per Share
(pre-impairment charge)
72.6c 81.8c (11.2)
• Earnings per Share
(post-impairment charge)
69.2c 81.8c (15.4)
• Return on Equity 15.5% 22.7%
Results in Constant Currency (AUD)
• Sales Revenue* 1 1,669.1 1,529.2 9.1
• EBITDA* 284.8 330.9 (13.9)
* 2008 results have been adjusted assuming local currencies were translated at the same rates as
for 2009
1 Excluding third party royalties.
1
For
per
sona
l use
onl
y
13
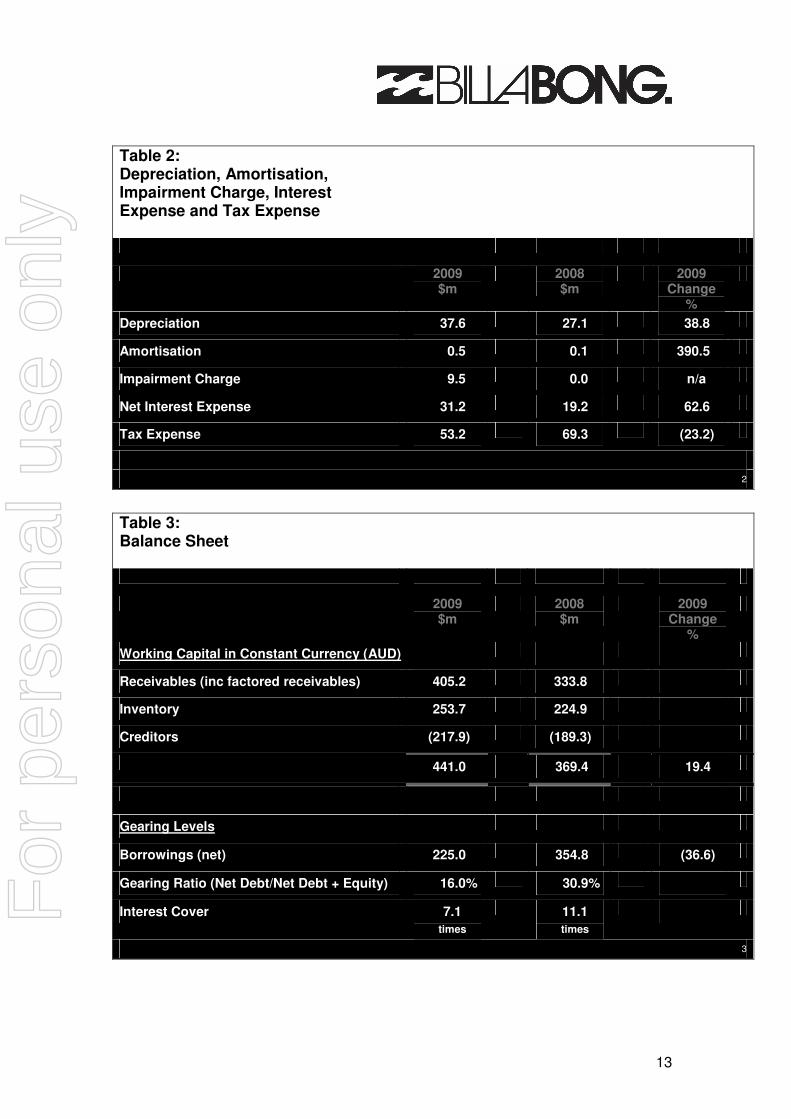
Table 2: Depreciation, Amortisation, Impairment Charge, Interest Expense and Tax Expense
2009 $m
2008 $m
2009 Change
%
Depreciation 37.6 27.1 38.8
Amortisation 0.5 0.1 390.5
Impairment Charge 9.5 0.0 n/a
Net Interest Expense 31.2 19.2 62.6
Tax Expense 53.2 69.3 (23.2)
2
Table 3: Balance Sheet
2009 $m
2008 $m
2009 Change
%
Working Capital in Constant Currency (AUD)
Receivables (inc factored receivables) 405.2 333.8
Inventory 253.7 224.9
Creditors (217.9) (189.3)
441.0 369.4 19.4
Gearing Levels
Borrowings (net) 225.0 354.8 (36.6)
Gearing Ratio (Net Debt/Net Debt + Equity) 16.0% 30.9%
Interest Cover 7.1
times
11.1
times
3
For
per
sona
l use
onl
y

14
Table 4: Cash Flow Statement
2009 $m
2008 $m
2009 Change
%
Net Cash Inflow from Operating Activities 175.7 153.2 14.7
Payment for Purchase of Subsidiaries, net of Cash Acquired
(143.8) (90.7)
Net Payments for Plant and Equipment (65.2) (52.9)
Payments for Intangibles (6.2) (3.2)
Net Cash Outflow from Investing Activities (215.2) (146.8)
Proceeds from Issues of Shares, net of Transaction Costs
316.9 0.1
Payments for Treasury Shares held in Employee Share Plan Trusts
(7.2) (10.8)
Net Proceeds from Borrowings 32.3 141.3
Dividends Paid (92.2) (112.0)
Net Cash Inflow from Financing Activities 249.8 18.6
Net Movement in Cash Held 210.3 25.0
4
For
per
sona
l use
onl
y
15
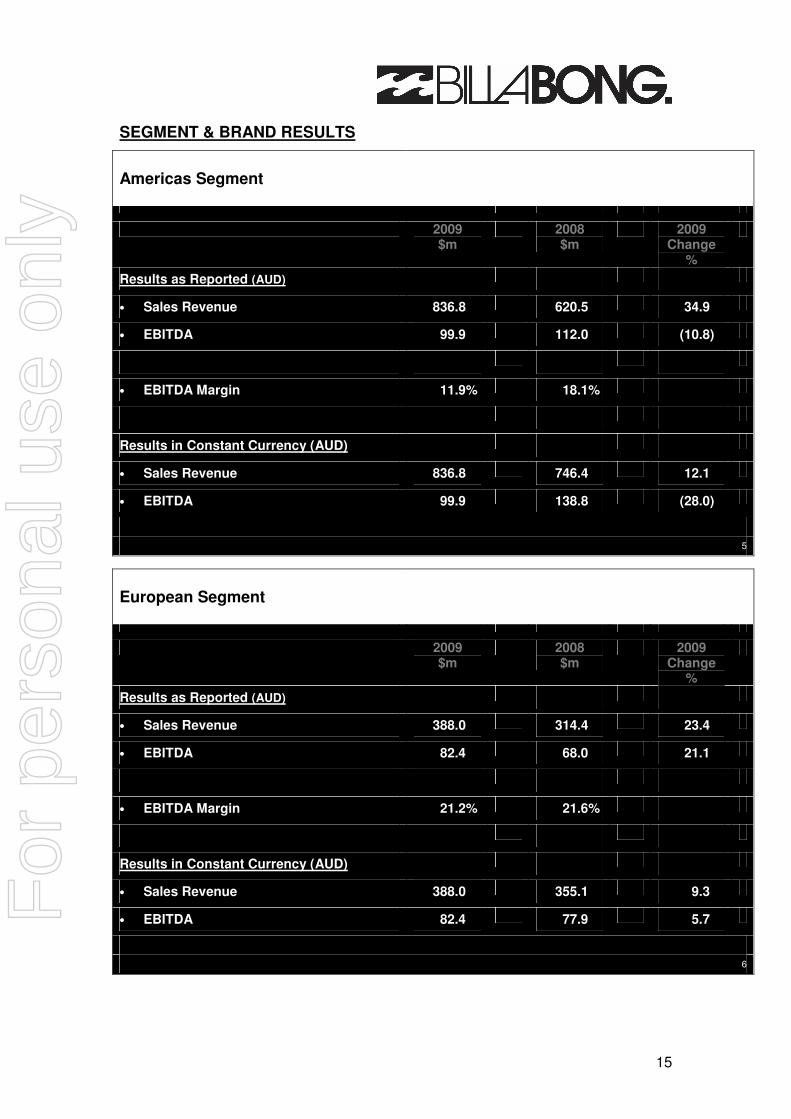
SEGMENT & BRAND RESULTS
Americas Segment
2009 $m
2008 $m
2009 Change
%
Results as Reported (AUD)
• Sales Revenue 836.8 620.5 34.9
• EBITDA 99.9 112.0 (10.8)
• EBITDA Margin 11.9% 18.1%
Results in Constant Currency (AUD)
• Sales Revenue 836.8 746.4 12.1
• EBITDA 99.9 138.8 (28.0)
5
European Segment
2009 $m
2008 $m
2009 Change
%
Results as Reported (AUD)
• Sales Revenue 388.0 314.4 23.4
• EBITDA 82.4 68.0 21.1
• EBITDA Margin 21.2% 21.6%
Results in Constant Currency (AUD)
• Sales Revenue 388.0 355.1 9.3
• EBITDA 82.4 77.9 5.7
6
For
per
sona
l use
onl
y

16
Australasian Segment
2009 $m
2008 $m
2009 Change
%
Results as Reported (AUD)
• Sales Revenue 444.3 412.7 7.6
• EBITDA 100.4 110.1 (8.8)
• EBITDA Margin 22.6% 26.7%
Results in Constant Currency (AUD)
• Sales Revenue 444.3 427.7 3.9
• EBITDA 100.4 112.3 (10.6)
7
Note:
Segment Earnings Before Interest, Taxes, Depreciation and Amortisation (EBITDA) excludes inter-company royalties and sourcing fees and includes an allocation of head office corporate overhead costs (including international advertising and promotion costs). Consistent with prior reporting periods corporate overhead costs have been allocated to each segment based on each segment’s sales as a proportion of Group sales.
2009 FX Impacts
• The current policy of hedging purchases, but not profit translation, remains unchanged.
• The short term impact of currency movements on the 2009 full year result (profit translation) is as follows:
1 cent increase in the average monthly rate for the AUD against the
USD = decrease NPAT by 0.3% EURO = decrease NPAT by 0.9%
8
∞
For
per
sona
l use
onl
y