
For personal use only - Australian Securities Exchange2015/11/25 · CMW – 2015 Annual General...
33
2015 Annual General Meeting 25 NOVEMBER 2015 For personal use only
Transcript of For personal use only - Australian Securities Exchange2015/11/25 · CMW – 2015 Annual General...

2015 Annual General Meeting25 NOVEMBER 2015
For
per
sona
l use
onl
y

CMW – 2015 Annual General Meeting 2
Important Information & Disclaimer
This presentation including its appendices(“Presentation”) is dated 25 November 2015 and hasbeen prepared by the Cromwell Property Group,which comprises Cromwell Corporation Limited (ACN001 056 980) and Cromwell Property SecuritiesLimited (ACN 079 147 809; AFSL 238052) asresponsible entity of the Cromwell DiversifiedProperty Trust (ARSN 102 982 598). Units in theCromwell Diversified Property Trust are stapled toshares in Cromwell Corporation Limited. The stapledsecurities are listed on the ASX (ASX Code: CMW).
This Presentation contains summary informationabout Cromwell Property Group as at 30 June 2015.Statutory financial information has been reviewed byCromwell Property Group’s auditors. Operatingfinancial information has not been subjected to auditreview. All financial information is in Australian dollarsand all statistics are as at 30 June 3015 unlessotherwise stated. All statistics include 50% share ofNorthpoint tower
The information in this Presentation is subject tochange without notice and does not purport to becomplete or comprehensive. It should be read inconjunction with Cromwell Property Group’s otherperiodic and continuous disclosure announcementsavailable at www.asx.com.au.
The information in this Presentation does not takeinto account your individual objectives, financialsituation or needs. Before making an investmentdecision, investors should consider, with or without afinancial or taxation adviser, all relevant information(including the information in this Presentation) havingregard to their own objectives, financial situation andneeds. Investors should also seek such financial,legal or tax advice as they deem necessary or
consider appropriate for their particular jurisdiction.
Cromwell Property Group does not guarantee anyparticular rate of return or the performance ofCromwell Property Group nor do they guarantee therepayment of capital from Cromwell Property Groupor any particular tax treatment. Past performance isnot indicative of future performance. Any “forwardlooking” statements are based on assumptions andcontingencies which are subject to change withoutnotice. Any forward looking statements are providedas a general guide only and should not be relied uponas an indication or guarantee of future performance.
The information in this Presentation has beenobtained from or based on sources believed byCromwell Property Group to be reliable. To themaximum extent permitted by law, Cromwell PropertyGroup, their officers, employees, agents and advisorsdo not make any warranty, expressed or implied, asto the currency, accuracy, reliability or completenessof the information in this Presentation and disclaim allresponsibility and liability for the information(including, without limitation, liability for negligence).
To the extent that any general financial productadvice in respect of Cromwell Property Group stapledsecurities is provided in this Presentation, it isprovided by Cromwell Property Securities Limited.Cromwell Property Securities Limited and its relatedbodies corporate, and their associates, will notreceive any remuneration or benefits in connectionwith that advice.
Cromwell Funds Management Limited ABN 63 114782 777 AFSL 333 214 (CFM) is the responsibleentity of the Cromwell Box Hill Trust ARSN 161 394243 (BHT), Cromwell Riverpark Trust ARSN 135 002
336 (CRT), Cromwell Ipswich City Heart Trust ARSN154 498 923 (ICH), Cromwell Phoenix PropertySecurities Fund ARSN 129 580 267 (PSF), CromwellPhoenix Opportunities Fund ARSN 602 776 536(POF), Cromwell Direct Property Fund ARSN 165011 905 (DPF), Cromwell Australian Property FundARSN 153 092 516 (APF), Cromwell Phoenix CoreListed Property Fund ARSN 604 286 071 (PCF) andthe Cromwell Property Trust 12 ARSN 166 216 995(C12). BHT, CRT, ICH, C12 and PSF are closed tonew investment. Applications for units in POF, DPF,APF and PCF can only be made on the applicationform accompanying the PDS for each. Beforemaking an investment decision in relation to thesefunds, please read the relevant PDS. PDS’s areissued by CFM and are available fromwww.cromwell.com.au or by calling Cromwell on1300 276 693.
This Presentation does not constitute an offer to sell,or the solicitation of an offer to buy, any securities inthe United States or to any ‘US person’ (as defined inRegulation S under the US Securities Act of 1933, asamended (“Securities Act”) (“US Person”)). CromwellProperty Group stapled securities have not been, andwill not be, registered under the Securities Act or thesecurities laws of any state or other jurisdiction of theUnited States, and may not be offered or sold in theUnited States or to any US Person without being soregistered or pursuant to an exemption fromregistration.
For
per
sona
l use
onl
y

CMW – 2015 Annual General Meeting 3
Directors
Geoffrey H. Levy, AONon-Executive Chairman
Paul WeightmanManaging Director / Chief Executive Officer
Richard FosterNon-Executive Director
Robert PullarNon-Executive Director
Michelle McKellarNon-Executive Director
Marc WainerNon-Executive Director
Andrew KonigNon-Executive Director
Jane TongsNon-Executive Director
Geoff CanningsAlternate Director to:
For
per
sona
l use
onl
y

CMW – 2015 Annual General Meeting 4
Meeting Agenda
Open
Chairman’s Address
CEO’s Address
Business
For
per
sona
l use
onl
y
CMW – 2015 Annual General Meeting 5
Chairman’s AddressMr Geoffrey H. Levy, AO
For
per
sona
l use
onl
y

CMW – 2015 Annual General Meeting 6
Clear and Well Established Strategic ObjectivesKey Objective
To provide secure and growing distributions for security holders
FY15 distributions per security up 3% at 7.86 cps
FY16 operating earnings guidance of not less than 9.00 cps
FY16 target of 3% distribution growth to 8.10 cps
Consistent Strategic Objectives
Ensure core assets are leased, with quality tenants, long WALE
Focus on active assets and value add transformation opportunities
Maintain a disciplined and focused approach to new acquisitions
Grow Funds Management to 20% of earnings contribution
Conservative capital management and disciplined use of gearing
*Assumes limited transactional revenue and cash is not deployed in an accretive fashion
Disciplined use of gearing
Distributions Growth Profile
For
per
sona
l use
onl
y

CMW – 2015 Annual General Meeting 7
Property Portfolio – Active Asset Management
For
per
sona
l use
onl
y

CMW – 2015 Annual General Meeting 8
Funds Management - Capital Is Increasingly Global
TOP 10 MARKETS BY TOTAL CRE INVESTMENT - H1 2015
Source: CBRE Research, Real Capital Analytics, H1 2015
For
per
sona
l use
onl
y

CMW – 2015 Annual General Meeting 9
39%
24%
31%
7%
Office
Retail
Industrial
Other
European Business Snapshot
‘Real estate investment manager dedicated to delivering superior value creation through local and Pan European expertise’
Portfolio
€5.3 billion AUM2
24 mandates
400+ properties
3,700 tenants
AUM by Sector
AUM by Geography
22%
21%
19%
14%
13%
10%CEE
UK
Germany
Benelux
Nordics
France
1. As at 10 April 20152. Including investment capacity
4.2 million sqmFor
per
sona
l use
onl
y

CMW – 2015 Annual General Meeting 10
CEO’s AddressMr Paul Weightman
For
per
sona
l use
onl
y
CMW – 2015 Annual General Meeting 11
FY15 Operating Profit Remains Robust
1) See Appendix for further details of operating profit and reconciliation to statutory profit
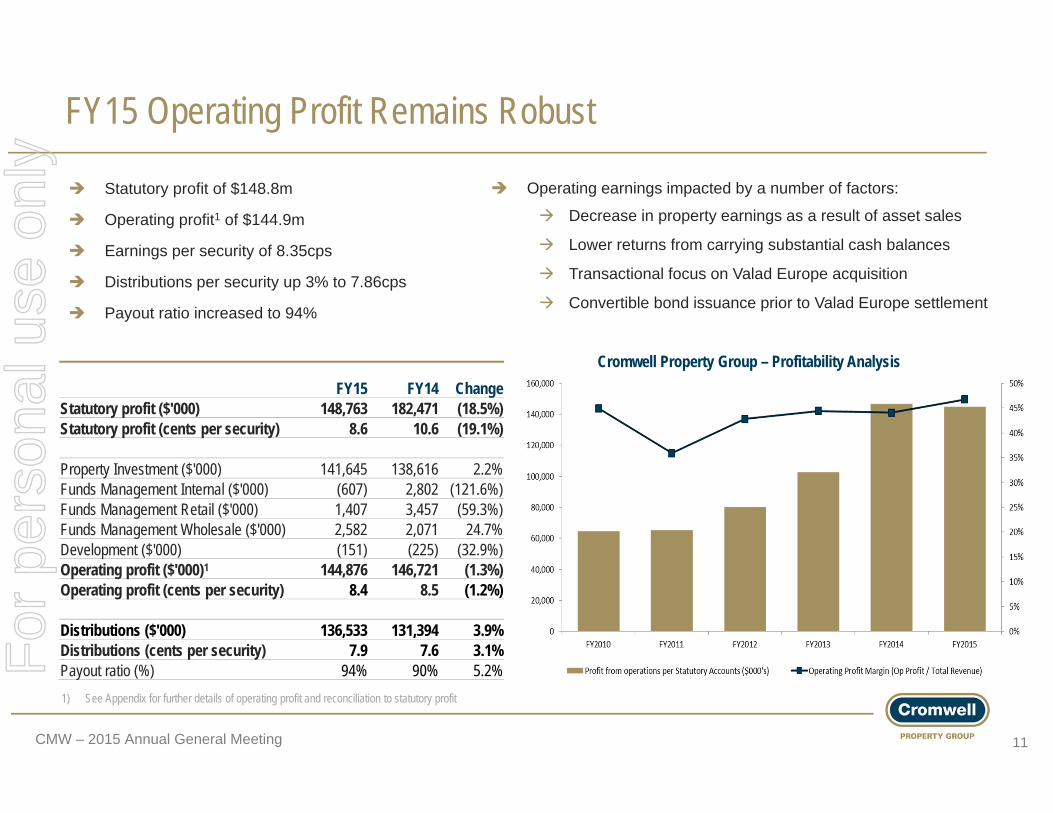
Statutory profit of $148.8m
Operating profit1 of $144.9m
Earnings per security of 8.35cps
Distributions per security up 3% to 7.86cps
Payout ratio increased to 94%
FY15 FY14 ChangeStatutory profit ($'000) 148,763 182,471 (18.5%)Statutory profit (cents per security) 8.6 10.6 (19.1%)
Property Investment ($'000) 141,645 138,616 2.2%Funds Management Internal ($'000) (607) 2,802 (121.6%)Funds Management Retail ($'000) 1,407 3,457 (59.3%)Funds Management Wholesale ($'000) 2,582 2,071 24.7%Development ($'000) (151) (225) (32.9%)Operating profit ($'000)1 144,876 146,721 (1.3%)Operating profit (cents per security) 8.4 8.5 (1.2%)
Distributions ($'000) 136,533 131,394 3.9%Distributions (cents per security) 7.9 7.6 3.1%Payout ratio (%) 94% 90% 5.2%
Operating earnings impacted by a number of factors:
Decrease in property earnings as a result of asset sales
Lower returns from carrying substantial cash balances
Transactional focus on Valad Europe acquisition
Convertible bond issuance prior to Valad Europe settlement
Cromwell Property Group – Profitability Analysis
For
per
sona
l use
onl
y

CMW – 2015 Annual General Meeting 12
45.0%
31.9%
23.1% Government Authority
Listed Company/SubsidaryPrivate Company
Property Portfolio - Strong Tenant Profile
Very strong tenant profile
Government2 contributes 45% of income
Top five tenants account for 60% of income
Average like for like property income growth of 2.2% in FY15
Remain overweight to recovering Sydney office markets
Focus on Canberra on back of recovering Government demand
Tenant Classification1
1) By current passing gross income. Excludes Bligh Street, Sydney NSW and Bridge Street, Hurstville, NSW2) Includes Government owned and funded entities3) S&P Ratings as at 26 August 2015.
Geographic Diversification1 Sector Diversification1
Top Five Tenants1% of Gross
Income Cumulative % Credit Rating3
Federal Government 23.3% 23.3% AAAQantas 11.5% 34.8% BB+NSW State Government 10.9% 45.7% AAAQLD State Government 10.4% 56.1% AA+AECOM Australia Pty Ltd 4.0% 60.1%
TOTAL 60.1%
98.7%
1.3%
Office
Retail
220.7%
41.5%
27.4%
6.6%
1.1% 2.7%
ACT
NSW
QLD
VIC
TAS
SA
For
per
sona
l use
onl
y

CMW – 2015 Annual General Meeting 13
5.00%
5.50%
6.00%
6.50%
7.00%
7.50%
8.00%
8.50%
9.00%
9.50%
10.00%
Qtr4‐2002
Qtr2‐2003
Qtr4‐2003
Qtr2‐2004
Qtr4‐2004
Qtr2‐2005
Qtr4‐2005
Qtr2‐2006
Qtr4‐2006
Qtr2‐2007
Qtr4‐2007
Qtr2‐2008
Qtr4‐2008
Qtr2‐2009
Qtr4‐2009
Qtr2‐2010
Qtr4‐2010
Qtr2‐2011
Qtr4‐2011
Qtr2‐2012
Qtr4‐2012
Qtr2‐2013
Qtr4‐2013
Qtr2‐2014
Qtr4‐2014
Qtr2‐2015
Property Portfolio - Valuations Continue To Rise Fair value increase in investment property of $25.4m net of capex and incentives
Increase in valuation for assets with long leases / decrease for some assets with short-term expiry profiles
Spread between primary and secondary cap rates remains at a high
Potential for further increase in valuations as spread is expected to compress with competition for assets
Weighted Average Cap Rate ChangeSecondary CBD Office Yields
Prime CBD Office Yields
Prime vs. Secondary Office Yields
8.20% 0.29%
0.03% 7.89%
7.00%
7.50%
8.00%
8.50%
9.00%
June 2014 Revaluations Sales June 2015
Source: JLL
For
per
sona
l use
onl
y

CMW – 2015 Annual General Meeting 14
Property Portfolio - Transformation Track Record
Core Portfolio
14 assets worth $1.6 billion
64% by current value purchased since 1 July 2008
WALE of 7.9 years (8.7 if Heads of Agreement progress)
Weighted property ungeared IRR since acquisition of 13%
Average valuation uplift over costs of 11%
Active Portfolio
11 assets worth $0.6 billion
WALE of 2.4 years (2.6 if Heads of Agreement progress)
Track record for realising value demonstrated by Recycled Assets history
Recycled Assets History
22 assets sold for more than $900 million over the past 9 years
Weighted property ungeared IRR of 13.8%For
per
sona
l use
onl
y

CMW – 2015 Annual General Meeting 15
Funds Management – Wholesale
1) Includes 45% of Phoenix Portfolios AUM, 50% of Oyster Group AUM and Valad Europe as at their respective exchange rates on 30 June 20152) Assumes completion of property currently under construction and $1.8 billion of investment capacity at Valad Europe
Significant evolution of funds management business in FY15
FY15 FUM grows to $11.9 billion1,2
European business provides
AUM of $5.9 billion
Investment capacity of $1.8 billion
30+ funds across 15 countries
Access to a broad range of international institutional, banking, assurance, sovereign wealth and pension fund customers
Platform now positioned to lead capital flows
Unique local real estate operating platforms in 15 countries
Investors around the globe have wide investment choices
Growth in AUM and Investment Capacity1,2
For
per
sona
l use
onl
y

CMW – 2015 Annual General Meeting 16
Funds Management – Retail
Total Retail Funds AUM grew 25% from $1.2 billion to $1.5 billion
Nine funds in Australia consisting of five closed and four open funds
Cromwell Phoenix Core Listed Property Securities Fund launched in March 2015 as Cromwell Phoenix Property Securities Fund reached capacity
AUM at Oyster Group in New Zealand grew 18% to $NZ 733 million
We could grow substantially but protecting customers capital ‘through the cycle’ is core to our proposition
ATO BOX HILL The recently completed ATO Box Hill building, owned by the Cromwell Box Hill Trust, was sold in September 2015 for $156 million, 18.6% above the March 2015 valuation of $131.5 million.
Unitholders’ original $1.00 investment in December 2012 earned $0.21 per unit in monthly distributions over the life of the Trust and received a Special Distribution Payment of $1.335 per unit post settlement.
ATO Box Hill
For
per
sona
l use
onl
y

CMW – 2015 Annual General Meeting 17
Key Terms of Convertible BondOffer Size €150 million
RankingSenior, unsecured, subordinated to Cromwell’s secured bank facilities
Term Five yearsCoupon 2.0% per annum payable semi-annually in arrearsConversion Price A$1.1503Reference Price A$1.07 (the closing price on January 23, 2015)Anti-dilution Protection Standard provisions
Dividend ProtectionTerms allow for payment of Cromwell’s FY15distribution, grown by 3% during the life of the bond
Capital Management – Transforming Debt Platform
CMW Group Gearing
1) Group gearing is calculated as (total borrowings less cash)/(total tangible assets less cash). Look through gearing adjusts for the 50% interest in Northpoint Tower.2) Portfolio gearing removes impact of convertible bond
Convertible bond issued to fund Valad Europe acquisition The offer was 2.3 times covered at final price Strong support from Asian and European fixed income investors Diversified Cromwell’s sources of capital
Maintaining appropriate gearing is a key focus Gearing reducing via asset sales and valuation increases Increase from FY14 due to Valad Europe acquisition Group gearing1 of 45% with disposals post 30 June
lowering rate to 42% (43% look through) Portfolio gearing2 of 36% with disposals post 30 June
lowering rate to 32% (33% look through)
For
per
sona
l use
onl
y

CMW – 2015 Annual General Meeting 18
Capital Management - Interest Rate Hedging
CMW Hedging Profile1
1) Includes 50% of Northpoint debt
Targeting lower interest rates again in FY16
Weighted average margin of 1.34% on current facilities1
Average interest rates on existing debt 5.5% in FY151
Average interest rates on existing debt expected to be 4.7% in FY16 1
Maximum Base Rate 2.25% 2.09% 2.37% 2.67% 2.67% 3.39% 3.39% 3.39% 3.38% 3.75%
Weighted average hedge term of 3.5 years
Long term interest rate cap expiry in May 2019
Five year convertible bond fixed at 2%
High degree of certainty over interest expense until FY19
88%
102% 102% 101% 100% 98% 98% 98%
18% 18%
0%0%10%20%30%40%50%60%70%80%90%
100%110%
2H15 1H16 2H16 1H17 2H17 1H18 2H18 1H19 2H19 1H20 2H20
For
per
sona
l use
onl
y

CMW – 2015 Annual General Meeting 19
Capital Management – Diversified Debt Profile1
Debt Expiry Profile1
1) Includes 50% of Northpoint Debt.
40.5 69.7 95.3 123.5
77.0100.0
95.3
123.538.6
50.0
110.7
19.3
25.044.3
218.5
$M
$100M
$200M
$300M
$400M
$500M
$600M
$700M
FY16 FY17 FY18 FY19 FY20
Value Expiring $40.5m $69.7m $325.5m $577.0m $218.5m
% Expiring 3.3% 5.7% 26.4% 46.9% 17.7%
Facilities are diversified across eight lenders and the Convertible Bond issue with varying maturity dates
Weighted average debt expiry of 3.5 years with 64% not expiring until FY19+
Australian Major Banks
International Banks
Other Australian Bank
Convertible Bond
Debt Expiry Profile1
For
per
sona
l use
onl
y

CMW – 2015 Annual General Meeting 20
Market Overview
Sales to hit $25 billion in 2015, 40% >10 year average
SYD/MEL are now in Top 10 cities for international capital
Yields are c3% higher than other global gateway cities
Competition forcing investors to move to fringe/secondary stock
CDB Office net absorption is positive, vacancies are below 8% in both
SYD/MEL and certain fringe locations but more than 15% PER/BNE
Our Preference
Continues to be well leased, commercial office property
A-Grade assets in secondary locations with transformation potential
Pockets of value in most capital cities but asset selection is paramount
Active portfolio will be key to future performance
Australian Outlook – Leasing Conditions Remain ChallengingCommercial Property Sales
Australian CBD Office Net Absorption
For
per
sona
l use
onl
y
CMW – 2015 Annual General Meeting 21
European Outlook – High Volumes, Increased Appetite
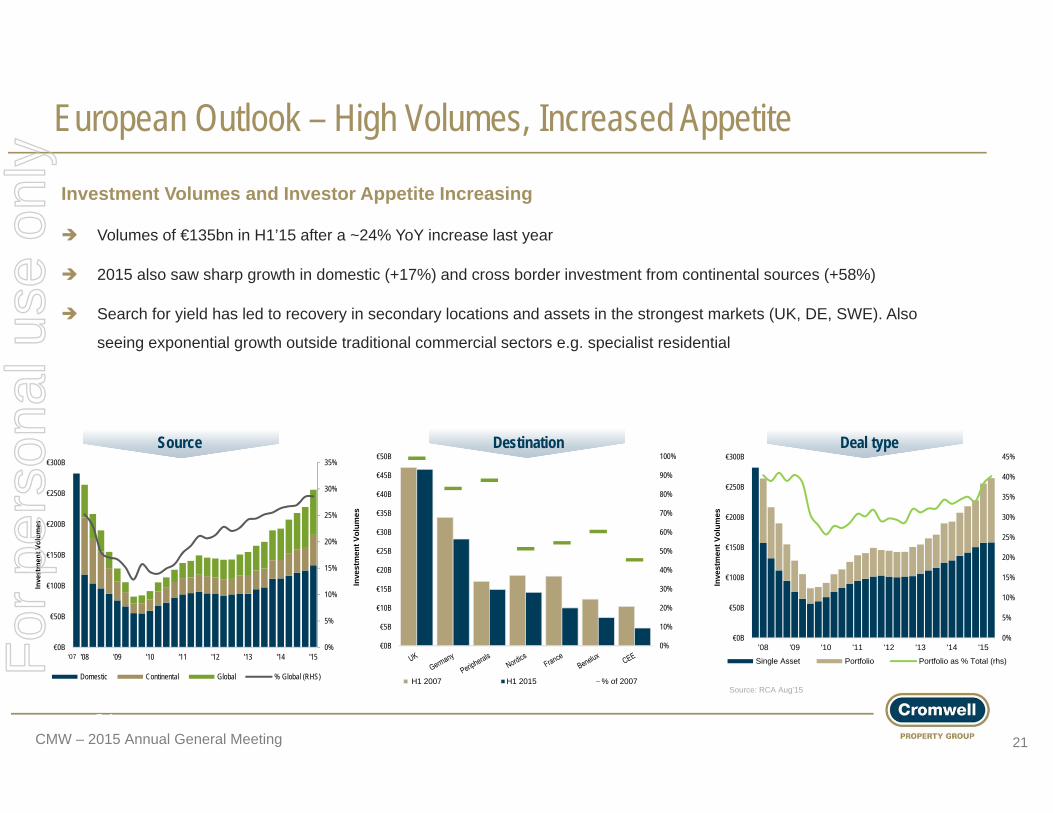
Investment Volumes and Investor Appetite Increasing
Volumes of €135bn in H1’15 after a ~24% YoY increase last year
2015 also saw sharp growth in domestic (+17%) and cross border investment from continental sources (+58%)
Search for yield has led to recovery in secondary locations and assets in the strongest markets (UK, DE, SWE). Also
seeing exponential growth outside traditional commercial sectors e.g. specialist residential
Destination
21
Deal type
Source: RCA Aug’15
Source
0%
10%
20%
30%
40%
50%
60%
70%
80%
90%
100%
€0B
€5B
€10B
€15B
€20B
€25B
€30B
€35B
€40B
€45B
€50B
Inve
stm
ent V
olum
es
H1 2007 H1 2015 % of 2007
0%
5%
10%
15%
20%
25%
30%
35%
€0B
€50B
€100B
€150B
€200B
€250B
€300B
'08 '09 '10 '11 '12 '13 '14 '15
Investmen
t Volum
es
Domestic Continental Global % Global (RHS)
‘07
0%
5%
10%
15%
20%
25%
30%
35%
40%
45%
€0B
€50B
€100B
€150B
€200B
€250B
€300B
'08 '09 '10 '11 '12 '13 '14 '15
Inve
stm
ent V
olum
es
Single Asset Portfolio Portfolio as % Total (rhs)For
per
sona
l use
onl
y

CMW – 2015 Annual General Meeting 22
Cromwell Performance June 2015(Annualised Total Securityholder Return)1
Direct Property Returns (to 30 June 2015 Annualised)1
1) Includes distributions. 2) 10 and 15 year CMW return includes period prior to stapling in December 2006.
Source: IPD1) Returns are for On Balance Sheet assets only* IPD Australia All-fund Universe (excl. Super & Major Regional Shopping Centres)
Consistent Strategy Delivers Consistent Outperformance
Outlook: FY16 earnings not less than 9.00 cps and distributions not less than 8.10 cpsFor
per
sona
l use
onl
y
CMW – 2015 Annual General Meeting 23
Formal VotingMr Geoffrey H. Levy, AO
For
per
sona
l use
onl
y
CMW – 2015 Annual General Meeting 24
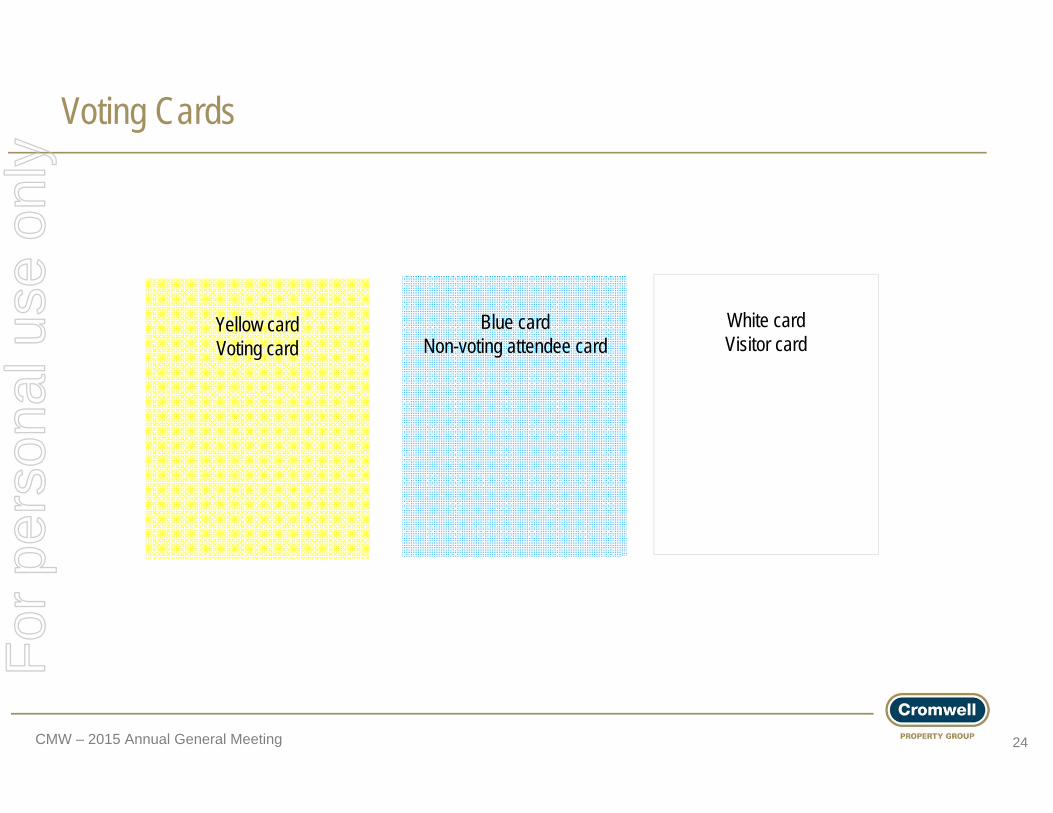
Voting Cards
Yellow cardVoting card
Blue card Non-voting attendee card
White cardVisitor card
For
per
sona
l use
onl
y
CMW – 2015 Annual General Meeting 25
Items of Business for the Company
For
per
sona
l use
onl
y
CMW – 2015 Annual General Meeting 26
Item 1
Consideration of the Financial, Directors’ and Auditor’s Reports
This is not the subject of a formal resolution and no proxies apply
For
per
sona
l use
onl
y

CMW – 2015 Annual General Meeting 27
Item 2
Number % of proxies received
For 933,904,855 89.60%
Open 13,149,152 1.26%
Against 95,257,360 9.14%
Abstain 2,846,615
Re-election of Mr Richard Foster as a Director
“That Mr Richard Foster, who retires by rotation in accordance with the constitution of Cromwell
Corporation Limited and offers himself for re-election, is re-elected as a director of Cromwell
Corporation Limited.”
For
per
sona
l use
onl
y

CMW – 2015 Annual General Meeting 28
Item 3
Remuneration Report
“That the remuneration report of Cromwell Corporation Limited for the year ended 30 June 2015
is adopted.”
Number % of proxies received
For 833,167,626 82.93%
Open 12,877,967 1.28%
Against 158,595,206 15.79%
Abstain 10,290,295For
per
sona
l use
onl
y
CMW – 2015 Annual General Meeting 29
Item of Business for the Group
For
per
sona
l use
onl
y
CMW – 2015 Annual General Meeting 30
Item 4
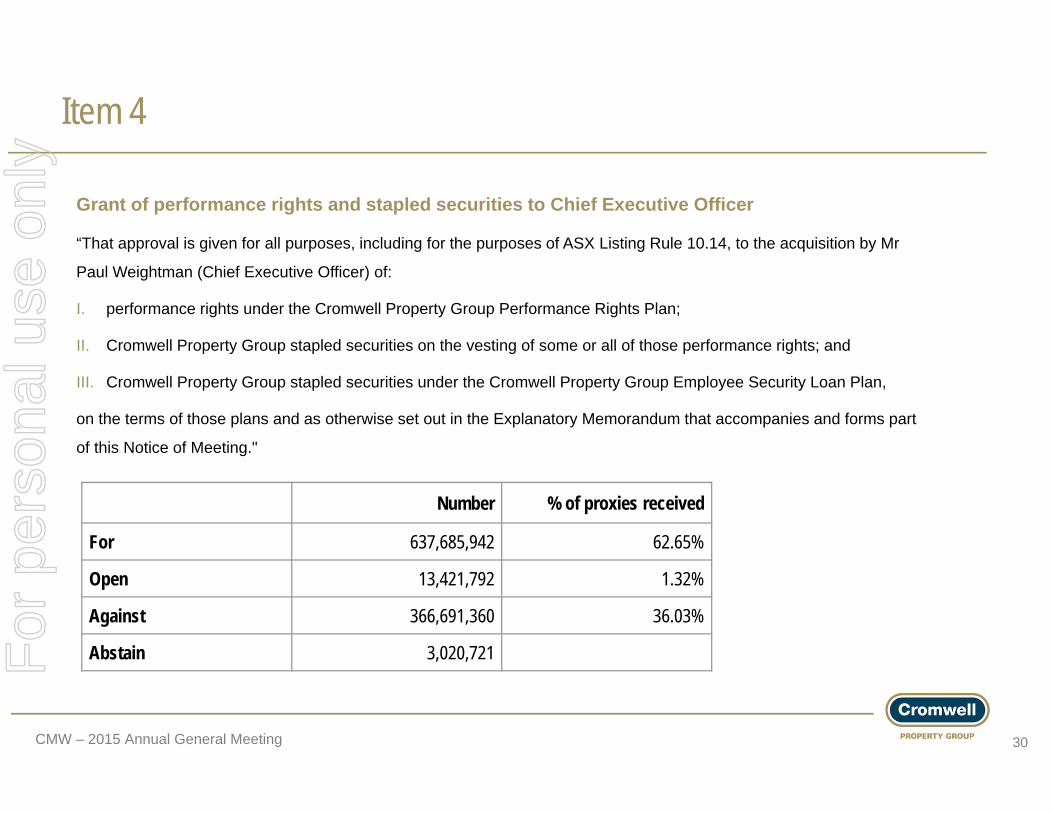
Number % of proxies received
For 637,685,942 62.65%
Open 13,421,792 1.32%
Against 366,691,360 36.03%
Abstain 3,020,721
Grant of performance rights and stapled securities to Chief Executive Officer
“That approval is given for all purposes, including for the purposes of ASX Listing Rule 10.14, to the acquisition by Mr
Paul Weightman (Chief Executive Officer) of:
I. performance rights under the Cromwell Property Group Performance Rights Plan;
II. Cromwell Property Group stapled securities on the vesting of some or all of those performance rights; and
III. Cromwell Property Group stapled securities under the Cromwell Property Group Employee Security Loan Plan,
on the terms of those plans and as otherwise set out in the Explanatory Memorandum that accompanies and forms part
of this Notice of Meeting."
For
per
sona
l use
onl
y
CMW – 2015 Annual General Meeting 31
Questions, comments
For
per
sona
l use
onl
y

CMW – 2015 Annual General Meeting 32
Thank you for your time
For
per
sona
l use
onl
y

well versedwell timedwell considered
For
per
sona
l use
onl
y


![Cmw pasquinucci[1]](https://static.fdocuments.us/doc/165x107/5591f5df1a28ab5c0b8b4680/cmw-pasquinucci1.jpg)