For personal use only - ASX · 2020. 8. 13. · +61 439 525 135 [email protected] Ben...
28
To: From: Date: Subject: Company Announcements Office Maria Sanz Perez 14 August 2020 FY20 Full Year Results – Presentation Please find attached, for release to the market, a presentation to be given at the Company’s Full Year Results briefing this morning. The webcast of this presentation, commencing at 9.30am this morning, is accessible on the Company’s website and will be available for replaying at the end of the briefing. Yours sincerely Maria Sanz Perez Company Secretary Authorised by the Newcrest Board Executive Committee For further information please contact: Investor Enquiries Chris Maitland +61 3 9522 5717 +61 439 525 135 [email protected] Ben Lovick +61 3 9522 5334 +61 407 269 478 [email protected] North American Investor Enquiries Ryan Skaleskog +1 647 255 3139 +61 403 435 222 [email protected] Media Enquiries Chris Maitland +61 3 9522 5717 +61 439 525 135 [email protected] For personal use only
Transcript of For personal use only - ASX · 2020. 8. 13. · +61 439 525 135 [email protected] Ben...

To:
From:
Date:
Subject:
Company Announcements Office
Maria Sanz Perez
14 August 2020
FY20 Full Year Results – Presentation
Please find attached, for release to the market, a presentation to be given at the Company’s Full Year Results briefing this morning.
The webcast of this presentation, commencing at 9.30am this morning, is accessible on the Company’s website and will be available for replaying at the end of the briefing.
Yours sincerely
Maria Sanz Perez Company Secretary
Authorised by the Newcrest Board Executive Committee
For further information please contact:
Investor Enquiries Chris Maitland +61 3 9522 5717+61 439 525 [email protected]
Ben Lovick +61 3 9522 5334+61 407 269 [email protected]
North American Investor Enquiries Ryan Skaleskog +1 647 255 3139+61 403 435 [email protected]
Media Enquiries Chris Maitland +61 3 9522 5717+61 439 525 [email protected]
or p
erso
nal u
se o
nly

FY20 Full Year ResultsNEWCREST
Sandeep BiswasManaging Director and Chief Executive Officer
Gerard BondFinance Director and Chief Financial Officer
For
per
sona
l use
onl
y

DisclaimerForward Looking StatementsThis presentation includes forward looking statements. Forward looking statements can generally be identified by the use of words such as “may”, “will”, “expect”, “intend”, “plan”, “estimate”, “anticipate”, “continue”, “outlook” and“guidance”, or other similar words and may include, without limitation, statements regarding plans, strategies and objectives of management, anticipated production or construction commencement dates and expected costs or productionoutputs. Newcrest continues to distinguish between outlook and guidance. Guidance statements relate to the current financial year. Outlook statements relate to years subsequent to the current financial year.
Forward looking statements inherently involve known and unknown risks, uncertainties and other factors that may cause Newcrest’s actual results, performance and achievements to differ materially from statements in this presentation.Relevant factors may include, but are not limited to, changes in commodity prices, foreign exchange fluctuations and general economic conditions, increased costs and demand for production inputs, the speculative nature of explorationand project development, including the risks of obtaining necessary licences and permits and diminishing quantities or grades of reserves, political and social risks, changes to the regulatory framework within which Newcrest operates ormay in the future operate, environmental conditions including extreme weather conditions, recruitment and retention of personnel, industrial relations issues and litigation.
Forward looking statements are based on Newcrest’s good faith assumptions as to the financial, market, regulatory and other relevant environments that will exist and affect Newcrest’s business and operations in the future. Newcrestdoes not give any assurance that the assumptions will prove to be correct. There may be other factors that could cause actual results or events not to be as anticipated, and many events are beyond the reasonable control of Newcrest.Readers are cautioned not to place undue reliance on forward looking statements, particularly in the current economic climate with the significant volatility, uncertainty and disruption caused by the COVID-19 pandemic.Forward looking statements in these materials speak only at the date of issue. Except as required by applicable laws or regulations, Newcrest does not undertake any obligation to publicly update or revise any of the forward-lookingstatements or to advise of any change in assumptions on which any such statement is based.
Non-IFRS Financial InformationNewcrest’s results are reported under International Financial Reporting Standards (IFRS). This presentation includes non-IFRS information under ASIC Regulatory Guide 230: ‘Disclosing non-IFRS financial information’ published byASIC and also ‘non-GAAP financial measures’ within the meaning of Regulation G under the U.S. Securities Exchange Act of 1934, as amended, and are not recognised under AAS and IFRS. Such information includes All-In SustainingCost (determined in accordance with the updated World Gold Council Guidance Note on Non-GAAP Metrics which was released in November 2018), Leverage (net debt divided by EBITDA for the preceding 12 months), EBITDA(earnings before interest, tax, depreciation and amortisation and significant items), Net Debt (total borrowings less cash and cash equivalents), Gearing Ratio (total debt divided by total debt and equity), AISC Margin (realised gold priceless AISC per ounce sold (where expressed as US$), or realised gold price less AISC per ounce sold divided by realised gold price (where expressed as a %), Interest Coverage Ratio (EBITDA/Interest payable for the relevant period),Free cash flow (cash flow from operating activities less cash flow related to investing activities), EBITDA margin (EBITDA expressed as a percentage of revenue) and EBIT margin (EBIT expressed as a percentage of revenue). Thesemeasures are used internally by Newcrest management to assess the performance of the business and make decisions on the allocation of resources and are included in this Presentation to provide greater understanding of theunderlying performance of Newcrest’s operations. The non-IFRS information has not been subject to audit or review by Newcrest’s external auditor and should be used in addition to IFRS information. Such non-IFRS financialinformation/non-GAAP financial measures do not have a standardised meaning prescribed by AAS or IFRS. Therefore, the non-IFRS financial information may not be comparable to similarly titled measures presented by other entitiesand should not be construed as an alternative to other financial measures determined in accordance with AAS or IFRS. Although Newcrest believes these non-IFRS financial measures provide useful information to investors inmeasuring the financial performance and condition of its business, investors are cautioned not to place undue reliance on any non-IFRS financial information/non-GAAP financial measures included in this presentation. Certain figures,amounts, percentages, estimates, calculations of value and fractions provided in this presentation are subject to the effect of rounding. Accordingly, the actual calculation of these figures may differ from the figures set out in thisPresentation.
Reliance on Third Party Information
The views expressed in this presentation contain information that has been derived from sources that have not been independently verified. No representation or warranty is made as to the accuracy, completeness or reliability of the information. This presentation should not be relied upon as a recommendation or forecast by Newcrest.
Ore Reserves and Mineral Resources Reporting Requirements
As an Australian company with securities listed on the Australian Securities Exchange (ASX), Newcrest is subject to Australian disclosure requirements and standards, including the requirements of the Corporations Act and the ASX. Investors should note that it is a requirement of the ASX listing rules that the reporting of ore reserves and mineral resources in Australia comply with the 2012 Edition of the Australasian Code for Reporting of Exploration Results, Mineral Resources and Ore Reserves (the “JORC Code”) and that Newcrest’s ore reserve and mineral resource estimates comply with the JORC Code.Competent Person’s StatementThe information in this presentation that relates to Mineral Resources or Ore Reserves (other than Red Chris and Havieron) has been extracted from the release titled “Annual Mineral Resources and Ore Reserves Statement – 31 December 2019” dated 13 February 2020 (the original release). Newcrest confirms that it is not aware of any new information or data that materially affects the information included in the original release and, in the case of Mineral Resources or Ore Reserves, that all material assumptions and technical parameters underpinning the estimates in the original release continue to apply and have not materially changed. Newcrest confirms that the form and context in which the competent person’s findings are presented have not been materially modified from the original release.
The information in this presentation that relates to Exploration Results at Red Chris and Havieron has been extracted from the release titled “Quarterly Exploration Report” dated 23 July 2020. Newcrest confirms that it is not aware of any new information or data that materially affects the information included in the Quarterly Exploration Report. Newcrest confirms that the form and context in which the competent person’s findings are presented have not been materially modified from the Quarterly Exploration Report.
2
For
per
sona
l use
onl
y

Newcrest Mining Limited
For
per
sona
l use
onl
y

FY20 Key Achievements
Safety and Sustainability
Our growth story
FinancialsOperational results
Summary
For
per
sona
l use
onl
y

Continued Focus on Safety
Zero FatalitiesNearly 5 years fatality free
Safety TransformationRed Chris injury rates are much higher than the Newcrest average which is driving the higher FY20 TRIFR.
Excluding Red Chris, Newcrest’s FY20 TRIFR was 2.0
FY20 TRIFR & improvements at most operations
Cadia
Lihir
Telfer4.9 17%
0.6 0%
4.9 35%
Quarter on quarter, Red Chris is realising improvements in TRIFR
1 TRIFR – Total Recordable Injury Frequency Rate (per million hours worked)
2 Prior to the acquisition of Red Chris, Newcrest estimated Red Chris’ underlying TRIFR to be 17.0. The 25% improvement is based on 17.0 and the actual TRIFR outcome for FY20 of 12.7. The outcome for FY20 represents the period from 15 August 2019 to 30 June 2020
Total Recordable Injury Frequency Rate1
(per million hours worked)
Red Chris2
12.7 25%
5
For
per
sona
l use
onl
y
FY20 Key Achievements
Safety and Sustainability
Our growth story
FinancialsOperational results
Summary
For
per
sona
l use
onl
y

FY20 Key Achievements
7
• Zero Fatalities and 13% reduction in TRIFR (excluding Red Chris)• COVID-19 impacts successfully managed in the period
Safety
• Continue to deliver against our growth pillar• ~$1.7 billion invested in growth activities• Exciting pipeline of growth projects including Havieron and Red Chris
Growth
• Produced 2.2moz gold and 138kt copper at an AISC of $862/oz• Statutory profit of $647 million up 15%• Underlying profit of $750 million up 34%• Generated free cash flow before M&A activity of $670 million1
Strong Financial Performance
• Successful equity raising to fund growth• Refinanced existing corporate bonds at lower coupon rates and smoothed
and extended maturity profile
Strengthened Balance Sheet
• Full year dividends of US25 cents per share2, an increase of 14%
Increased Shareholder Returns1. Excludes the payment for the acquisition of Red Chris (70% ownership) of $769 million, the acquisition of Fruta del Norte finance facilities of $460 million, further investments in Lundin Gold of $79 million, net proceeds from divestment of Gosowong of $20 million and payment of $3 million for an interest in Antipa Minerals Ltd
2. Final dividend of US17.5 cents per share + interim dividend of US7.5 cents per share
For
per
sona
l use
onl
y

FY20 Key Achievements
Safety and Sustainability
Our growth story
FinancialsOperational results
Summary
For
per
sona
l use
onl
y

World class asset
• Grade decline on prior period in line with expectations
• Achieved record mined and milled tonnes in the period
• Strong free cash flow generation
• Water concerns alleviated
• Cadia Expansion and Moly plant projects progressed
Cadia
9
620 600
913 843
FY17 FY18 FY19 FY20
Gold Production (koz)
241
171
132 160
FY17 FY18 FY19 FY20
AISC ($/oz)
For
per
sona
l use
onl
y

Lihir
10
940 955 933
776
FY17 FY18 FY19 FY20
Gold Production (koz)
858 934 887
1,206
FY17 FY18 FY19 FY20
AISC ($/oz)
Challenging year
• Lower grade and recoveries in the period
• Higher proportion of stockpiled ore feed processed
• Autoclave maintenance and clay in feed material impacted recovery rates
• Improvement plan underway
• Higher stripping rates and processing of stockpiled Argillic feed to continue into FY21-22
For
per
sona
l use
onl
y
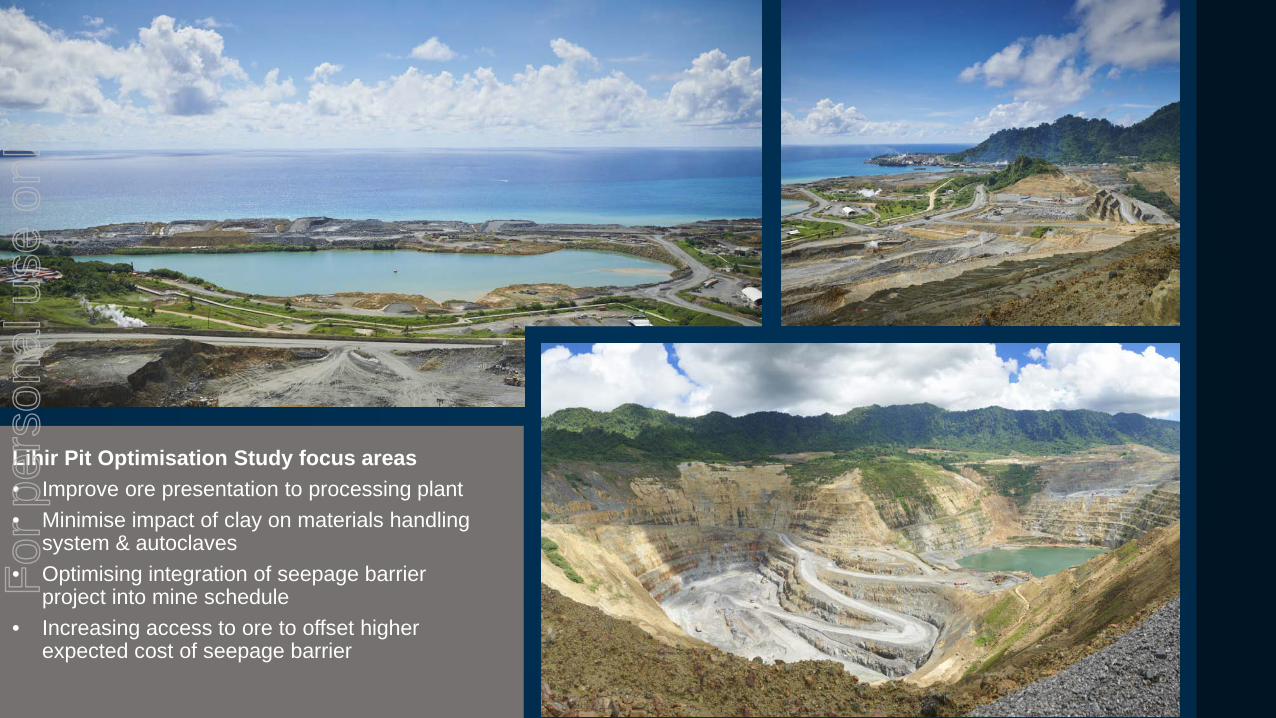
Lihir Pit Optimisation Study focus areas• Improve ore presentation to processing plant• Minimise impact of clay on materials handling
system & autoclaves• Optimising integration of seepage barrier
project into mine schedule• Increasing access to ore to offset higher
expected cost of seepage barrier
For
per
sona
l use
onl
y

Telfer
12
386 426
452
393
FY17 FY18 FY19 FY20
Gold Production (koz)
1,178
1,262 1,253
1,281
FY17 FY18 FY19 FY20
AISC ($/oz)
Solid performance
• Lower milled volumes as planned
• Free cash flow improved by $43 million
• $82 million impact to revenue from gold hedges
• Latent infrastructure value to be realised with Havieron development
For
per
sona
l use
onl
y

Stabilising performance
• Improved safety performance
• Investing in the future• Exciting drill results
Red Chris
Production and AISC is reported at Newcrest’s attributable share of 70%
13
3
9
12
15
Q1 Q2 Q3 Q4FY20
Gold Production (koz)
4,317
1,8571,413 1,536
Q1 Q2 Q3 Q4FY20
AISC ($/oz)
For
per
sona
l use
onl
y

FY20 Key Achievements
Safety and Sustainability
Our growth story
FinancialsOperational results
Summary
For
per
sona
l use
onl
y

Investing in growth from a position of strength
Strong financial performance
- Underlying profit of $750m- Statutory profit of $647m- Free cash flow before M&A
activity of $670m1
Robust balance sheet- Refinanced existing debt- Successful equity raising- Well within financial policy
metrics
Investing in the future- $1.3bn to acquire Red Chris and
increase exposure to Fruta del Norte
- $273m on major capital projects- $113m on exploration
Increased shareholder returns- Full year dividends of 25 cents
per share, fully franked- 14% increase on FY19- Final dividend 21% higher YOY
15
1. Excludes the payment for the acquisition of Red Chris (70% ownership) of $769 million, the acquisition of Fruta del Norte finance facilities of $460 million, further investments in Lundin Gold of $79 million, net proceeds from divestment of Gosowong of $20 million and payment of $3 million for an interest in Antipa Minerals Ltd
For
per
sona
l use
onl
y

Newcrest has a high level of exposure to a rising gold price
16
1. The proportion of ounces exposed to the gold price has been determined by dividing total gold ounces delivered into the hedge book by total gold sales for the financial year
2. Data for Northern Star was sourced from their June Quarterly Activities Report dated 23 July 2020. For Evolution, data was sourced from their FY20 Quarterly Reports dated 23 July 2020, 23 April 2020, 29 January 2020 and 15 October 2019. Data for Saracen was sourced from their FY20 Quarterly Reports dated 21 July 2020, 28 April 2020, 28 January 2020 and 22 October 2019. For St Barbara data was sourced from their June Quarterly Report dated 29 July 2020 and their FY19 Annual Report dated 13 September 2019
• In the period, Newcrest’s gold ounces had the greatest exposure to the appreciation of the gold price, compared to some other Australian producers
• Newcrest’s hedged gold volumes are declining over coming years: o 217koz in FY21; o 205koz in FY22; and o 138koz in FY23
Proportion of FY20 gold production exposed to gold price
0.0%
20.0%
40.0%
60.0%
80.0%
100.0%
Saracen St Barbara Northern Star Evolution Newcrest
For
per
sona
l use
onl
y

Estimated cash flow impact of COVID-19 in FY20
Employees & Contractors
17
1. Labour costs includes pandemic leave, costs associated with roster changes, additional coverage, overtime and allowances
2. Other costs includes medical related expenditure, additional shutdown costs, additional contractor costs and accommodation costs
3. Inventory & Asset purchases represents increases in working capital to mitigate the risk of supply chain disruptions as well as the purchase of additional buses at Lihir to enable social distancing
4. FIFO related costs are due to a reduction in FIFO flights
• Managing COVID-19 had an estimated cost impact of ~$20m (pre-tax) in FY20, excluding productivity impacts
• The cost impact in FY21 is expected to be ~$30-40m (pre-tax), assuming no operational interruptions
For
per
sona
l use
onl
y

Invested ~$1.3bnin M&A activities in FY20
Cumulative free cash flow ($m)
1. Cash investment in M&A activity in FY20 comprises the payment for the acquisition of Red Chris (70% ownership) of $769 million, the acquisition of Frutadel Norte finance facilities of $460 million, further investments in Lundin Gold of $79 million, net proceeds from divestment of Gosowong of $20 million and payment of $3 million for an interest in Antipa Minerals Ltd
$3.5
Bill
ion
For
per
sona
l use
onl
y

Debt structure optimised
19
Maturity profile as at 30 June 20201
($m
)
• Refinanced debt at lower coupon rates and smoothed and extended the debt maturity profile• Weighted average maturity profile now ~16 years (previously ~7 years)• Secured long term debt funding at coupons much lower than existing corporate bonds
1 On 13 May 2020, Newcrest issued US$1.15 billion of senior unsecured notes, comprising 10-year bonds totalling US$650 million (maturing in 2030) and 30-year bonds totalling US$500 million (maturing in 2050). The proceeds from the new bonds were used to repay all of the Company’s notes due in 2021 and to repay all but US$380 million of the notes due in 2022
For
per
sona
l use
onl
y

Strong financial position
• Continue to be comfortably within our financial policy targets
Investment Grade Credit RatingCoverage ($bn)
Leverage Ratio (Net Debt / EBITDA) Gearing Ratio
0.6x
0.2x
0.8x
0.3x
Target less than 2.0x
(for trailing 12 months)
31 Dec 2018 30 Jun 2019 31 Dec 2019 30 Jun 2020
11.5%
4.9%
15.1%
6.8%
Target less than 25%
31 Dec 2018 30 Jun 2019 31 Dec 2019 30 Jun 2020
3.06
3.60
2.69
3.45
1.04
1.60
0.69
1.45
Target minimum
$1.5b, ~1/3 as cash
31 Dec 2018 30 Jun 2019 31 Dec 2019 30 Jun 2020
Coverage Cash
20
For
per
sona
l use
onl
y

Increasing returns to shareholders
• Fifth consecutive year of dividend increases
• Targeting a total dividend payment of at least 10-30% of free cash flow
• With the dividend being no less than US15 cents per share on a full year basis
• Final fully franked dividend of US17.5 cents is 21% higher year on year
Increasing Dividends1 (US$/share)
1 Dividends declared/determined in respect of each financial year
14%
0.00
0.05
0.10
0.15
0.20
0.25
0.30
FY16 FY17 FY18 FY19 FY20
US$
per
sha
re
21
For
per
sona
l use
onl
y

FY20 Key Achievements
Safety and Sustainability
Our growth story
FinancialsOperational results
Summary
For
per
sona
l use
onl
y

Jun-19 Dec-19 Jun-20
+464200
0
??
?
??
OPEN
+464000
+464200
0 100
?
?OPEN
+463800 E
+464000 E
+464200 E
+463800 E
+464000 E
+464200 E
0
100m
lphide Zone
al Dyke
e 0.5g/t Au Leapfrog Shell
e 1.0g/t Au Leapfrog Shell
?
??
?
The Havieron diagrams included in this slide have been extracted from the Newcrest release titled “Quarterly Exploration Report” dated 23 July 2020 and other prior exploration releases. This release includes the exploration results for all material drill-holes.
23
Growing Havieron
• Havieron continued to grow over FY20
• Expecting to commence decline by the end of CY20 or early 2021
For
per
sona
l use
onl
y
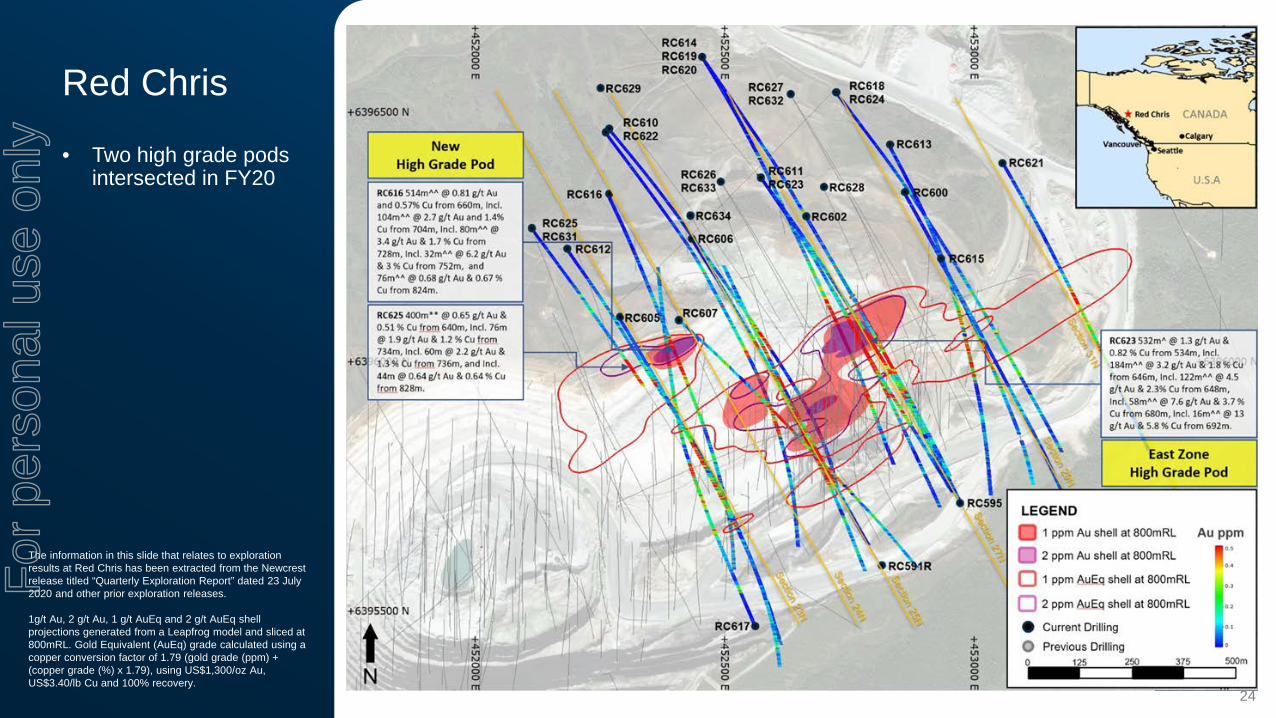
The information in this slide that relates to exploration results at Red Chris has been extracted from the Newcrest release titled “Quarterly Exploration Report” dated 23 July 2020 and other prior exploration releases.
1g/t Au, 2 g/t Au, 1 g/t AuEq and 2 g/t AuEq shell projections generated from a Leapfrog model and sliced at 800mRL. Gold Equivalent (AuEq) grade calculated using a copper conversion factor of 1.79 (gold grade (ppm) + (copper grade (%) x 1.79), using US$1,300/oz Au, US$3.40/lb Cu and 100% recovery.
24
Red Chris
• Two high grade pods intersected in FY20
For
per
sona
l use
onl
y

FY20 Key Achievements
Safety and Sustainability
Our growthstory
FinancialsOperational results
Summary
For
per
sona
l use
onl
y

What makes Newcrest different Long
reserve lifeLow cost production
Strong exploration & technical capabilities
Organic growth options(at Cadia, Lihir, Wafi-Golpu, Havieron & Red Chris)
Do what we say
Financially robust
26
For
per
sona
l use
onl
y

Find out more:www.newcrest.com
Engage with us
+61 3 9522 5717
+1 (647) 255 3139
27
For
per
sona
l use
onl
y