For personal use only · 2016. 8. 1. · • Regulatory upside - No ‘paydayloans’ - No...
20
FY16 Results Presentation Thomas Beregi, CEO Michael Eadie, CFO 2 August 2016 For personal use only
Transcript of For personal use only · 2016. 8. 1. · • Regulatory upside - No ‘paydayloans’ - No...
FY16 Results Presentation
Thomas Beregi, CEO
Michael Eadie, CFO
2 August 2016
For
per
sona
l use
onl
y
Competitive leadership in the credit impaired consumer segment…
FY16 Results Presentation | 2
For
per
sona
l use
onl
y
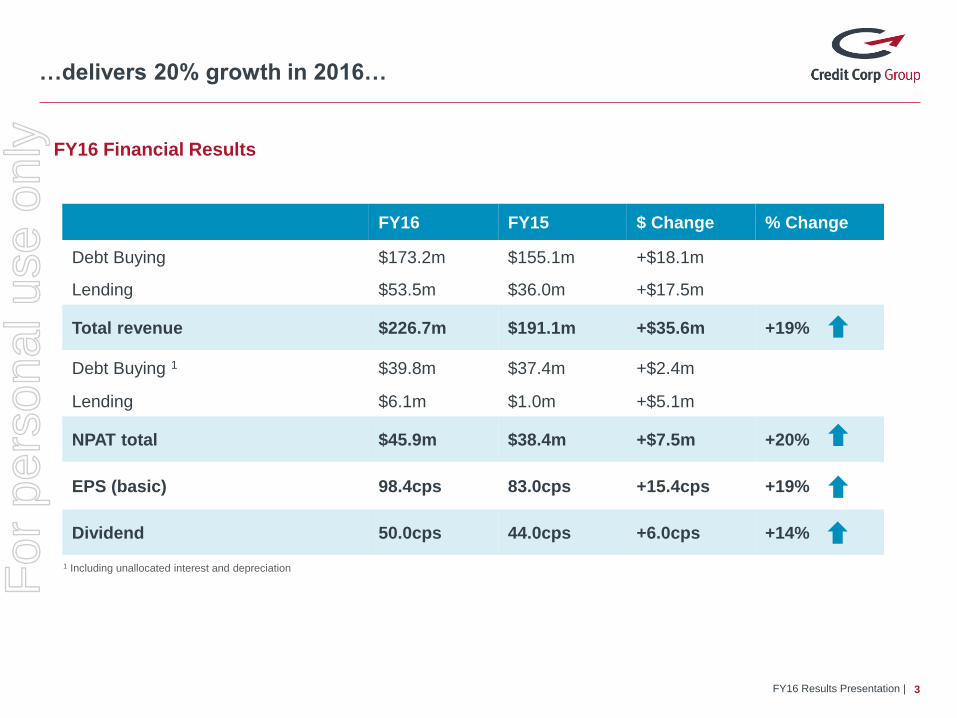
…delivers 20% growth in 2016…
3
FY16 FY15 $ Change % Change
Debt Buying $173.2m $155.1m +$18.1m
Lending $53.5m $36.0m +$17.5m
Total revenue $226.7m $191.1m +$35.6m +19%
Debt Buying 1 $39.8m $37.4m +$2.4m
Lending $6.1m $1.0m +$5.1m
NPAT total $45.9m $38.4m +$7.5m +20%
EPS (basic) 98.4cps 83.0cps +15.4cps +19%
Dividend 50.0cps 44.0cps +6.0cps +14%
FY16 Financial Results
FY16 Results Presentation |
1 Including unallocated interest and depreciationFor
per
sona
l use
onl
y
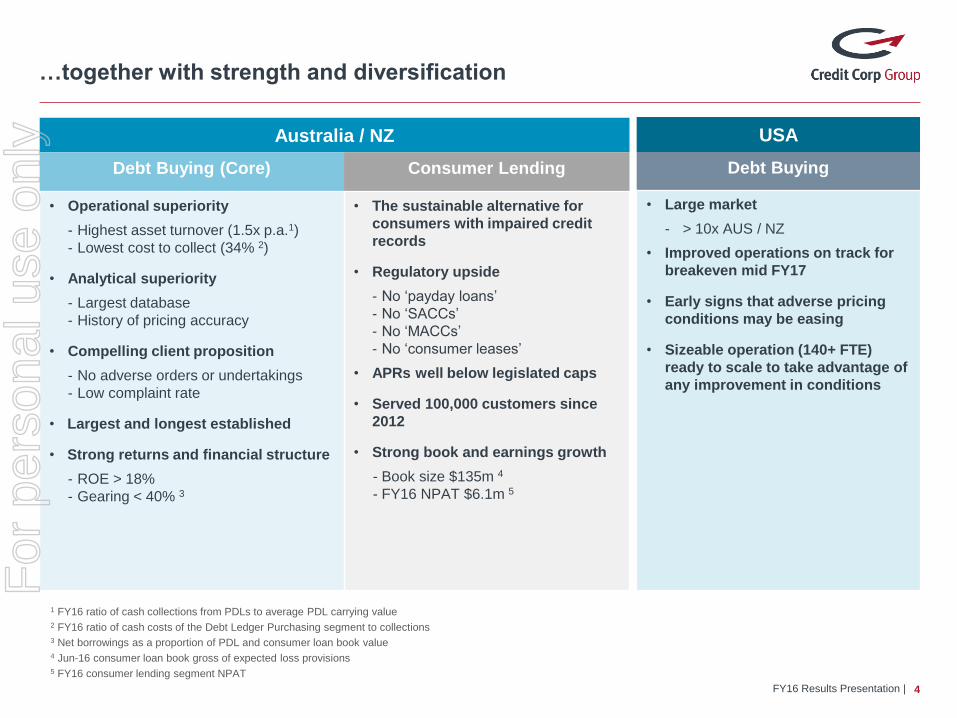
…together with strength and diversification
4
Australia / NZ
Debt Buying (Core) Consumer Lending
• Operational superiority
- Highest asset turnover (1.5x p.a.1)
- Lowest cost to collect (34% 2)
• Analytical superiority
- Largest database
- History of pricing accuracy
• Compelling client proposition
- No adverse orders or undertakings
- Low complaint rate
• Largest and longest established
• Strong returns and financial structure
- ROE > 18%
- Gearing < 40% 3
• The sustainable alternative for
consumers with impaired credit
records
• Regulatory upside
- No ‘payday loans’
- No ‘SACCs’
- No ‘MACCs’
- No ‘consumer leases’
• APRs well below legislated caps
• Served 100,000 customers since
2012
• Strong book and earnings growth
- Book size $135m 4
- FY16 NPAT $6.1m 5
USA
Debt Buying
• Large market
- > 10x AUS / NZ
• Improved operations on track for
breakeven mid FY17
• Early signs that adverse pricing
conditions may be easing
• Sizeable operation (140+ FTE)
ready to scale to take advantage of
any improvement in conditions
1 FY16 ratio of cash collections from PDLs to average PDL carrying value2 FY16 ratio of cash costs of the Debt Ledger Purchasing segment to collections3 Net borrowings as a proportion of PDL and consumer loan book value4 Jun-16 consumer loan book gross of expected loss provisions5 FY16 consumer lending segment NPAT
FY16 Results Presentation |
For
per
sona
l use
onl
y
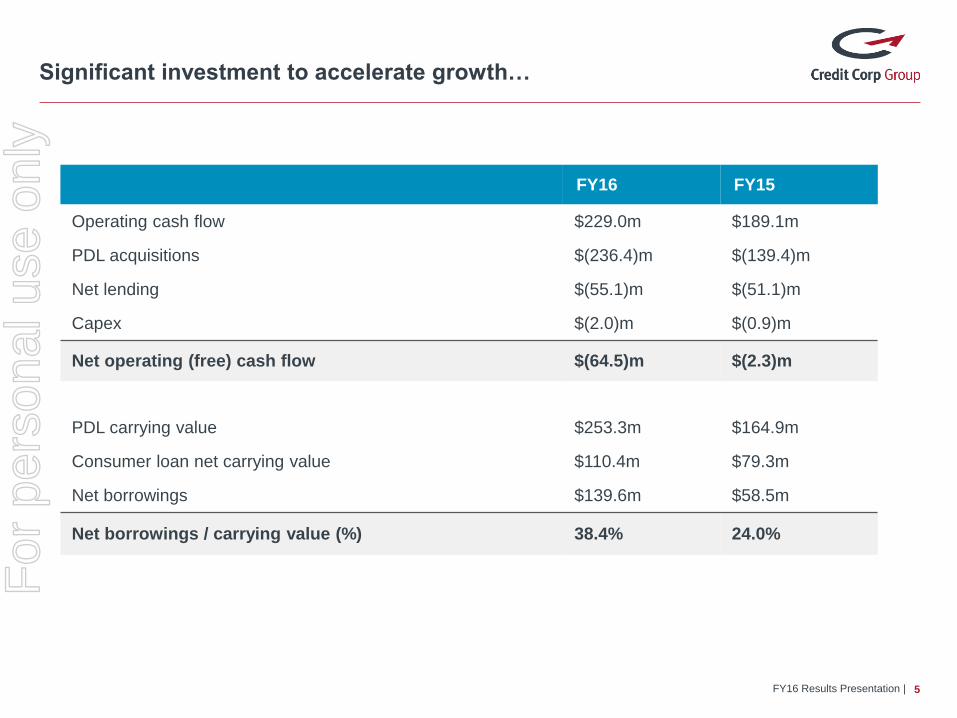
Significant investment to accelerate growth…
FY16 Results Presentation | 5
FY16 FY15
Operating cash flow $229.0m $189.1m
PDL acquisitions $(236.4)m $(139.4)m
Net lending $(55.1)m $(51.1)m
Capex $(2.0)m $(0.9)m
Net operating (free) cash flow $(64.5)m $(2.3)m
PDL carrying value $253.3m $164.9m
Consumer loan net carrying value $110.4m $79.3m
Net borrowings $139.6m $58.5m
Net borrowings / carrying value (%) 38.4% 24.0%
For
per
sona
l use
onl
y
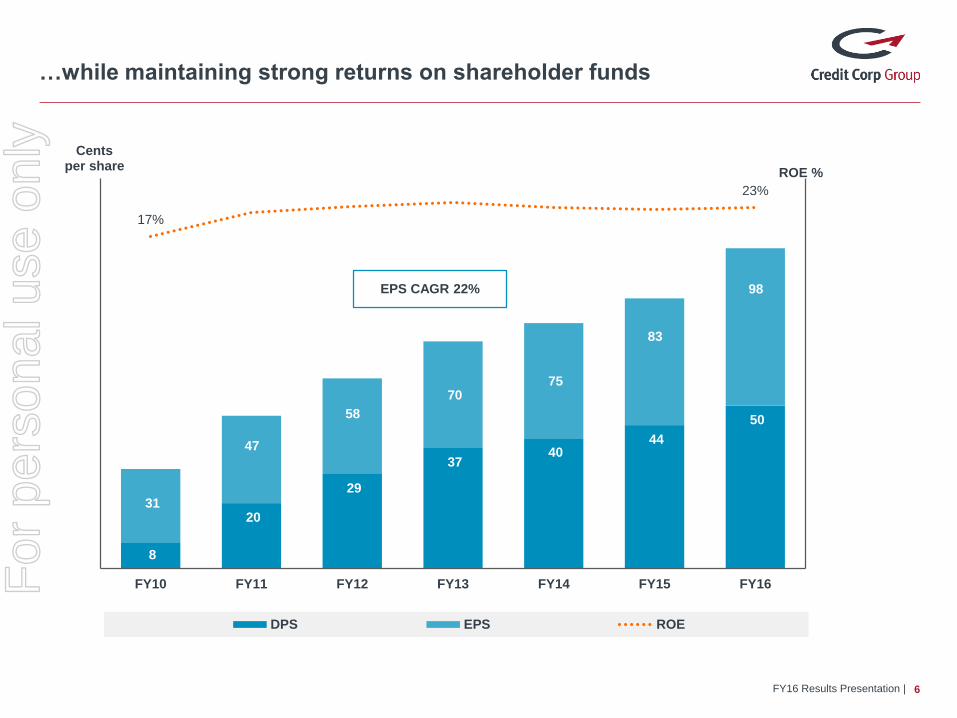
8
20
29
3740
44
50
31
47
58
7075
83
98
17%
23%
FY10 FY11 FY12 FY13 FY14 FY15 FY16
ROE %
Centsper share
DPS EPS ROE
EPS CAGR 22%
…while maintaining strong returns on shareholder funds
6FY16 Results Presentation |
For
per
sona
l use
onl
y
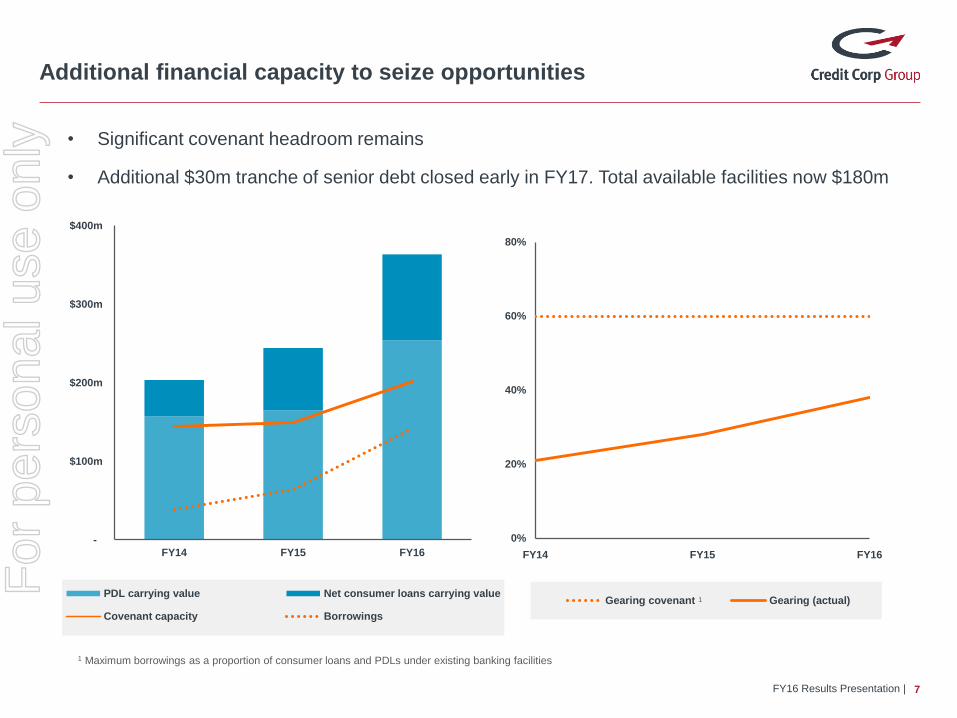
0%
20%
40%
60%
80%
FY14 FY15 FY16
Gearing covenant Gearing (actual)
Additional financial capacity to seize opportunities
7
• Significant covenant headroom remains
• Additional $30m tranche of senior debt closed early in FY17. Total available facilities now $180m
FY16 Results Presentation |
1 Maximum borrowings as a proportion of consumer loans and PDLs under existing banking facilities
1
-
$100m
$200m
$300m
$400m
FY14 FY15 FY16
PDL carrying value Net consumer loans carrying value
Covenant capacity Borrowings
For
per
sona
l use
onl
y
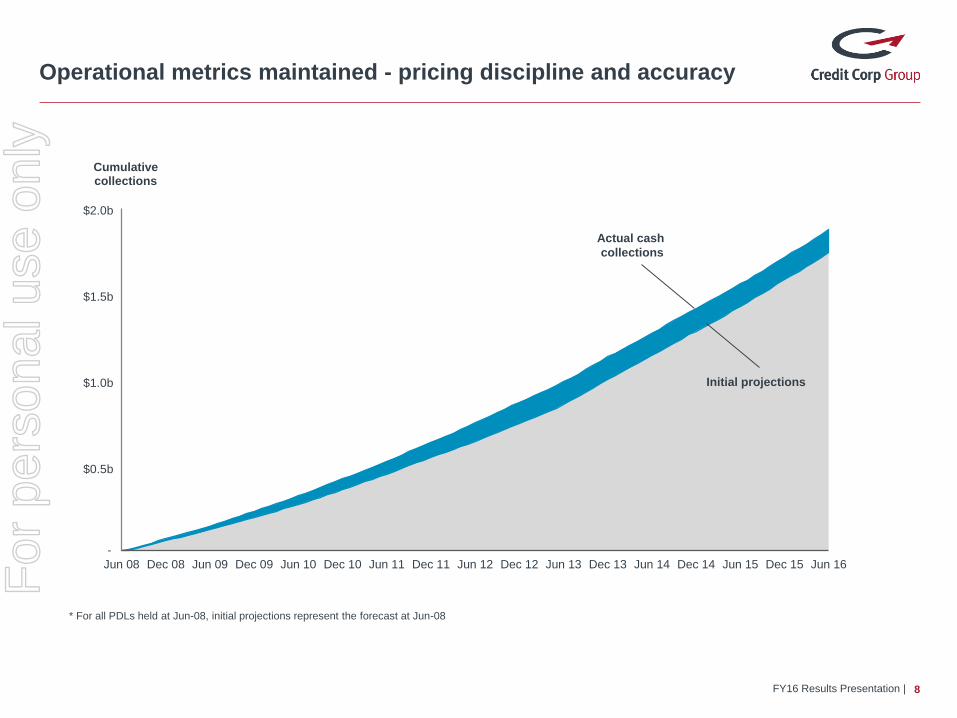
-
$ 500m
$ 1,000m
$ 1,500m
$ 2,000m
Jun 08 Dec 08 Jun 09 Dec 09 Jun 10 Dec 10 Jun 11 Dec 11 Jun 12 Dec 12 Jun 13 Dec 13 Jun 14 Dec 14 Jun 15 Dec 15 Jun 16
Cumulativecollections
Operational metrics maintained - pricing discipline and accuracy
8
* For all PDLs held at Jun-08, initial projections represent the forecast at Jun-08
Actual cash
collections
Initial projections
FY16 Results Presentation |
$2.0b
$1.5b
$1.0b
$0.5b
For
per
sona
l use
onl
y
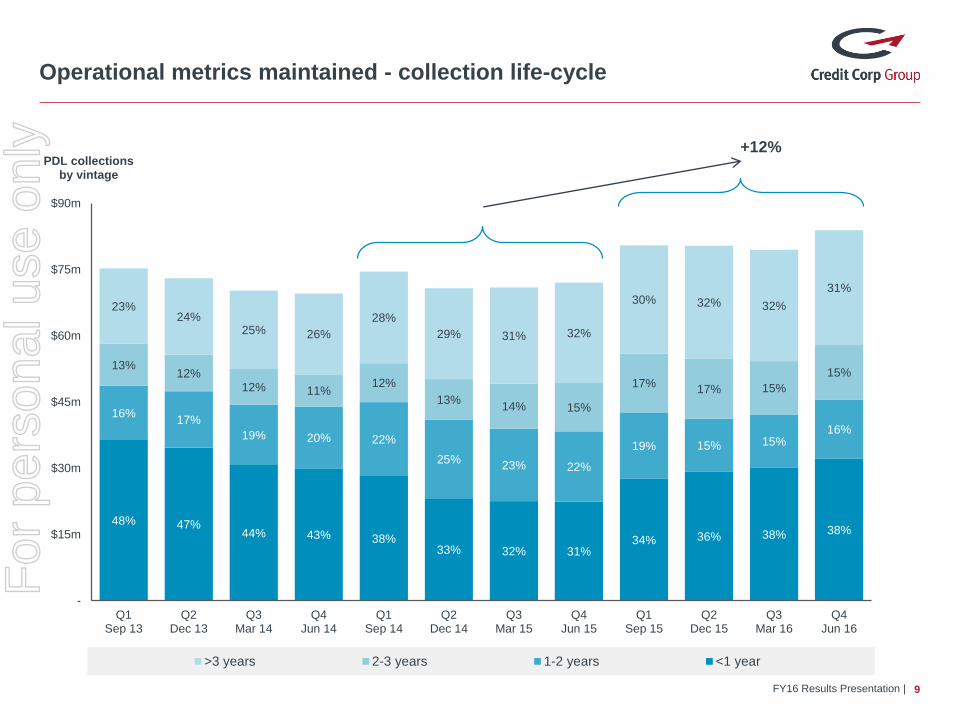
48% 47%44% 43% 38%
33% 32% 31%34% 36% 38% 38%
16%17%
19% 20% 22%
25%23% 22%
19% 15% 15%16%
13%12%
12% 11%12%
13%14% 15%
17%17% 15%
15%
23%24%
25% 26%
28%
29% 31% 32%
30% 32% 32%
31%
-
$15m
$30m
$45m
$60m
$75m
$90m
Q1Sep 13
Q2Dec 13
Q3Mar 14
Q4Jun 14
Q1Sep 14
Q2Dec 14
Q3Mar 15
Q4Jun 15
Q1Sep 15
Q2Dec 15
Q3Mar 16
Q4Jun 16
PDL collectionsby vintage
>3 years 2-3 years 1-2 years <1 year
9
Operational metrics maintained - collection life-cycle
+12%
FY16 Results Presentation |
For
per
sona
l use
onl
y
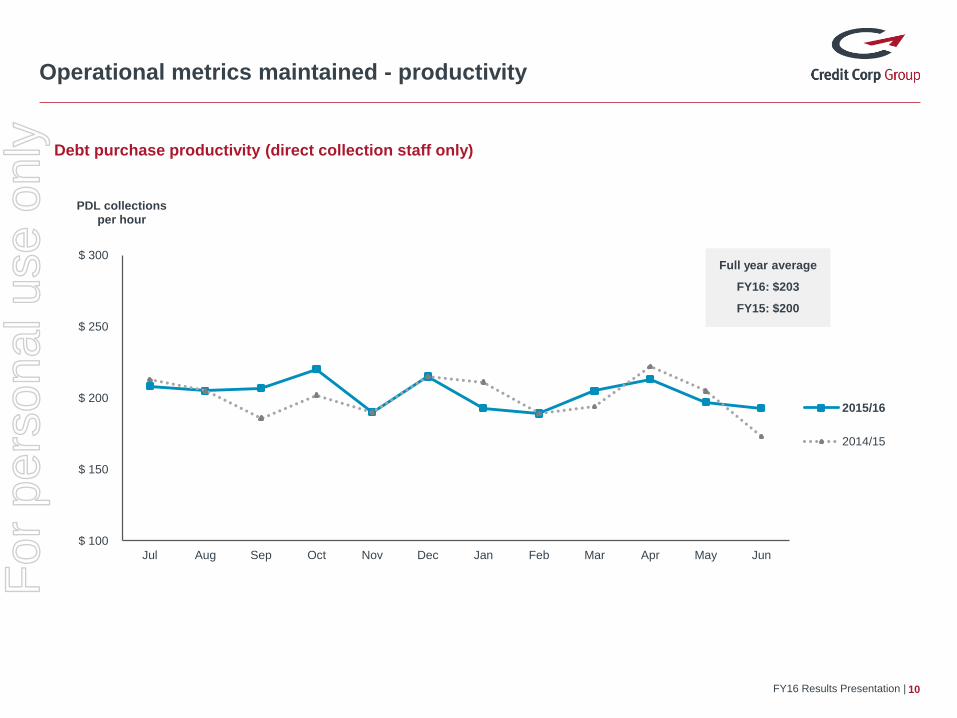
$ 100
$ 150
$ 200
$ 250
$ 300
Jul Aug Sep Oct Nov Dec Jan Feb Mar Apr May Jun
PDL collectionsper hour
2015/16
2014/15
10
Operational metrics maintained - productivity
Debt purchase productivity (direct collection staff only)
Full year average
FY16: $203
FY15: $200
FY16 Results Presentation |
For
per
sona
l use
onl
y
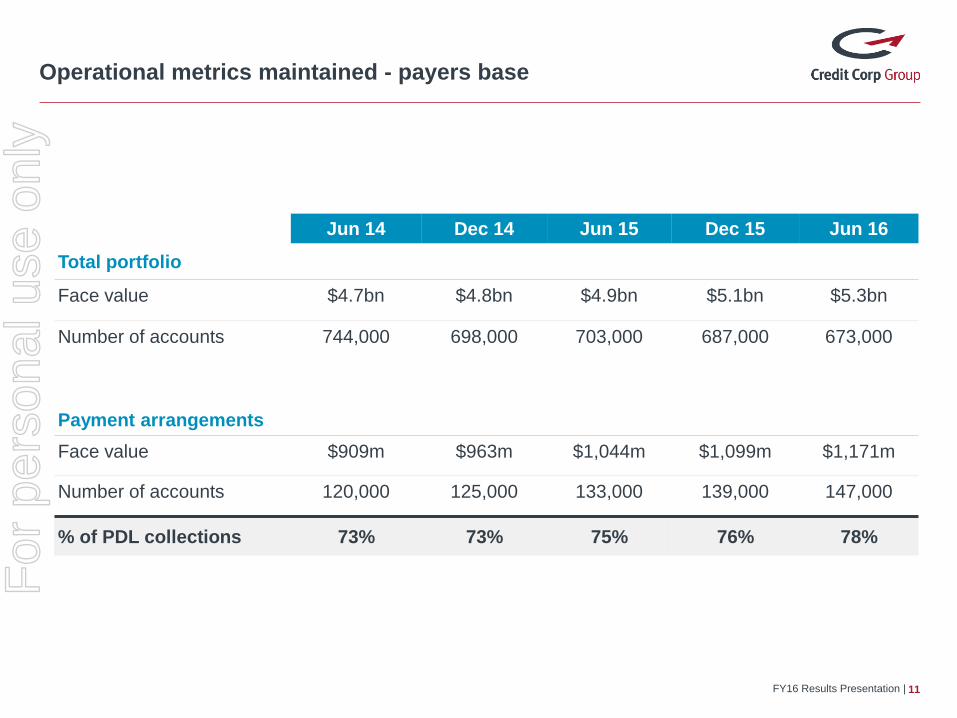
Operational metrics maintained - payers base
11
Jun 14 Dec 14 Jun 15 Dec 15 Jun 16
Total portfolio
Face value $4.7bn $4.8bn $4.9bn $5.1bn $5.3bn
Number of accounts 744,000 698,000 703,000 687,000 673,000
Payment arrangements
Face value $909m $963m $1,044m $1,099m $1,171m
Number of accounts 120,000 125,000 133,000 139,000 147,000
% of PDL collections 73% 73% 75% 76% 78%
FY16 Results Presentation |
For
per
sona
l use
onl
y
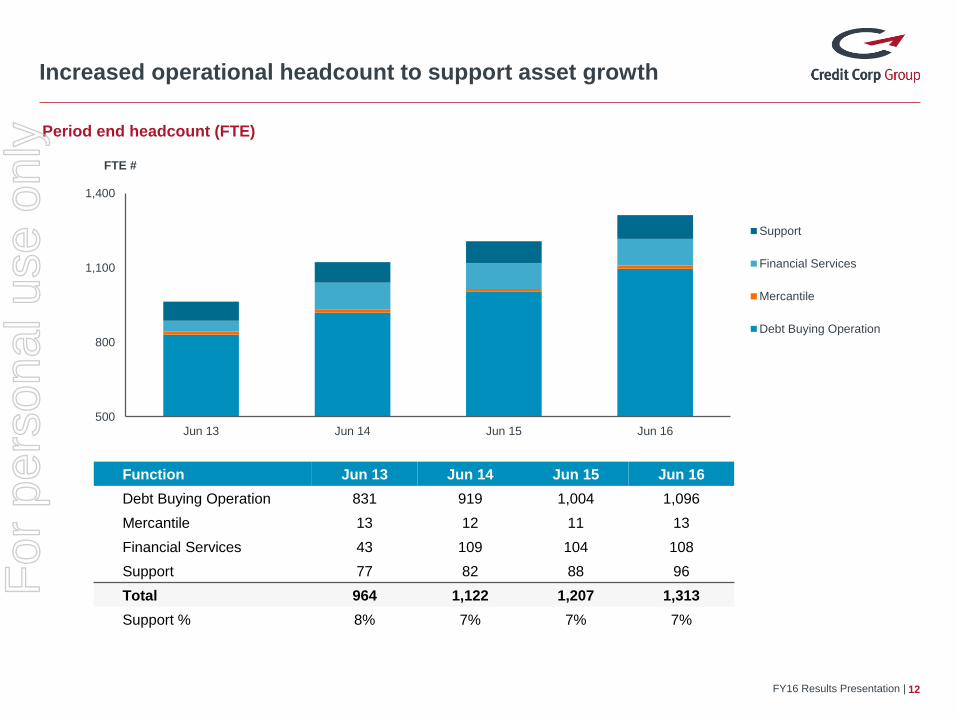
Increased operational headcount to support asset growth
12
Period end headcount (FTE)
FY16 Results Presentation |
Function Jun 13 Jun 14 Jun 15 Jun 16
Debt Buying Operation 831 919 1,004 1,096
Mercantile 13 12 11 13
Financial Services 43 109 104 108
Support 77 82 88 96
Total 964 1,122 1,207 1,313
Support % 8% 7% 7% 7%
500
800
1,100
1,400
Jun 13 Jun 14 Jun 15 Jun 16
FTE #
Support
Financial Services
Mercantile
Debt Buying Operation
For
per
sona
l use
onl
y
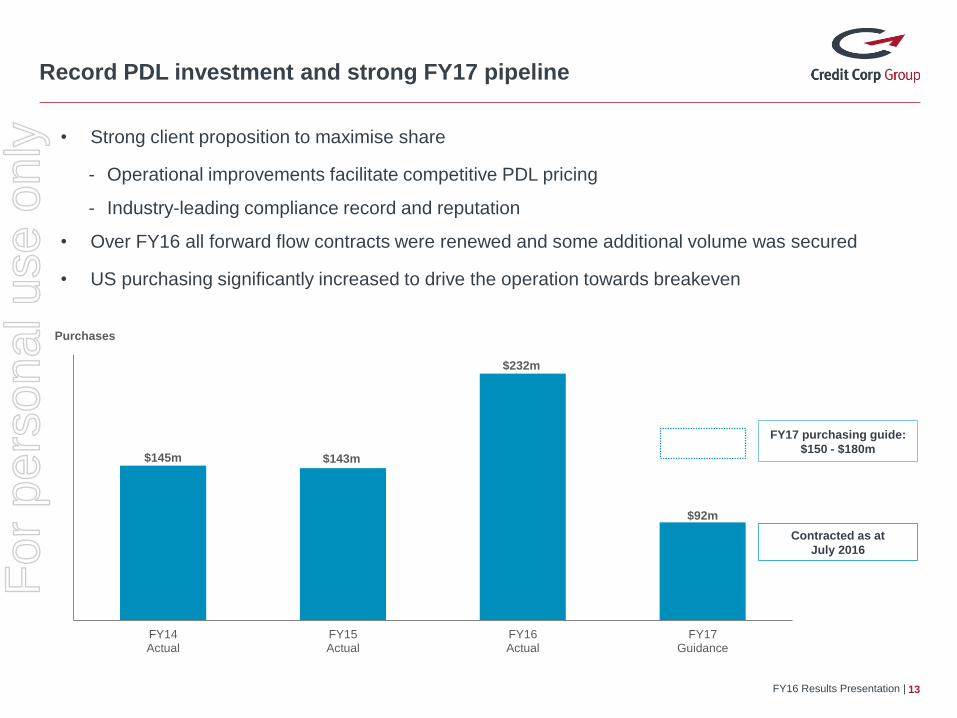
$145m $143m
$232m
$92m
FY14Actual
FY15Actual
FY16Actual
FY17Guidance
Purchases
Record PDL investment and strong FY17 pipeline
13
• Strong client proposition to maximise share
- Operational improvements facilitate competitive PDL pricing
- Industry-leading compliance record and reputation
• Over FY16 all forward flow contracts were renewed and some additional volume was secured
• US purchasing significantly increased to drive the operation towards breakeven
FY16 Results Presentation |
FY17 purchasing guide:
$150 - $180m
Contracted as at
July 2016
For
per
sona
l use
onl
y
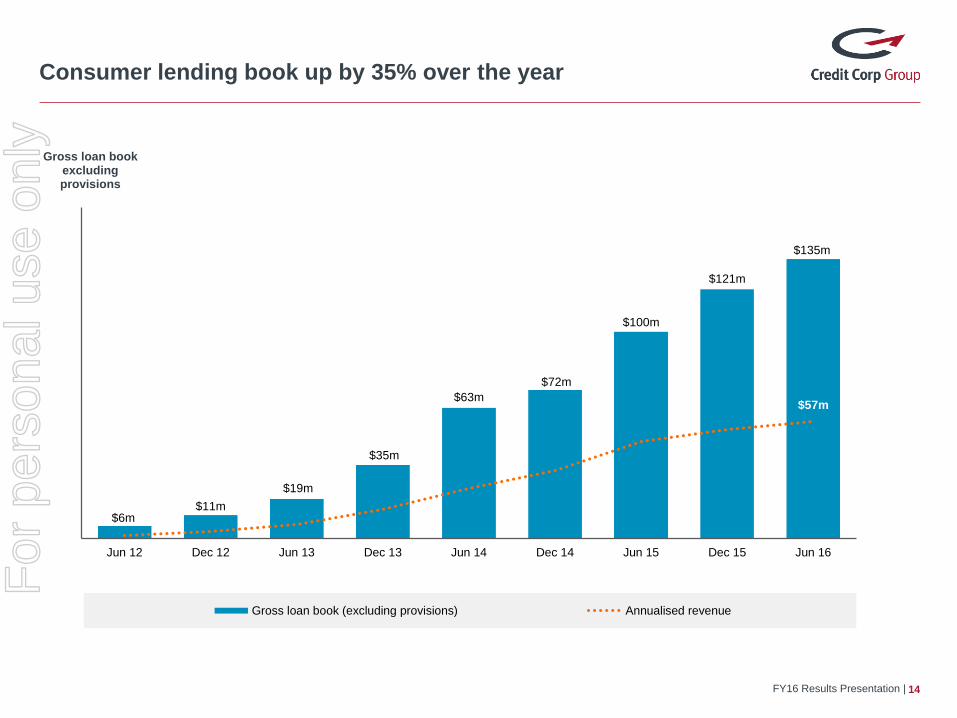
$6m$11m
$19m
$35m
$63m
$72m
$100m
$121m
$135m
$57m
Jun 12 Dec 12 Jun 13 Dec 13 Jun 14 Dec 14 Jun 15 Dec 15 Jun 16
Gross loan bookexcludingprovisions
Gross loan book (excluding provisions) Annualised revenue
Consumer lending book up by 35% over the year
14FY16 Results Presentation |
For
per
sona
l use
onl
y
Strong platform for continued growth in Consumer Lending
15
• Wallet Wizard brand well-established
- Increased brand recognition post-television campaign during 1H
- Referral channels established
- New customer originations maintained and returning customer volumes increasing
• Market leading offering - uniquely sustainable
- Amongst the lowest cost alternative for customers with impaired credit records
- Priced significantly below applicable rate cap
- Insulated from future regulatory or other stakeholder actions e.g. Google policy changes
- No ‘Payday loans’, SACCs, MACCs or consumer leases
FY16 Results Presentation |
For
per
sona
l use
onl
y
($8.0m)
($4.0m)
-
$4.0m
$8.0m
$12.0m
(8.0%)
(4.0%)
-
4.0%
8.0%
12.0%
NPATROA %
NPAT ROA
-
$25m
$50m
$75m
$100m
$125m
FY14 FY15 FY16
Average net book size 1
FY14 FY15 FY16
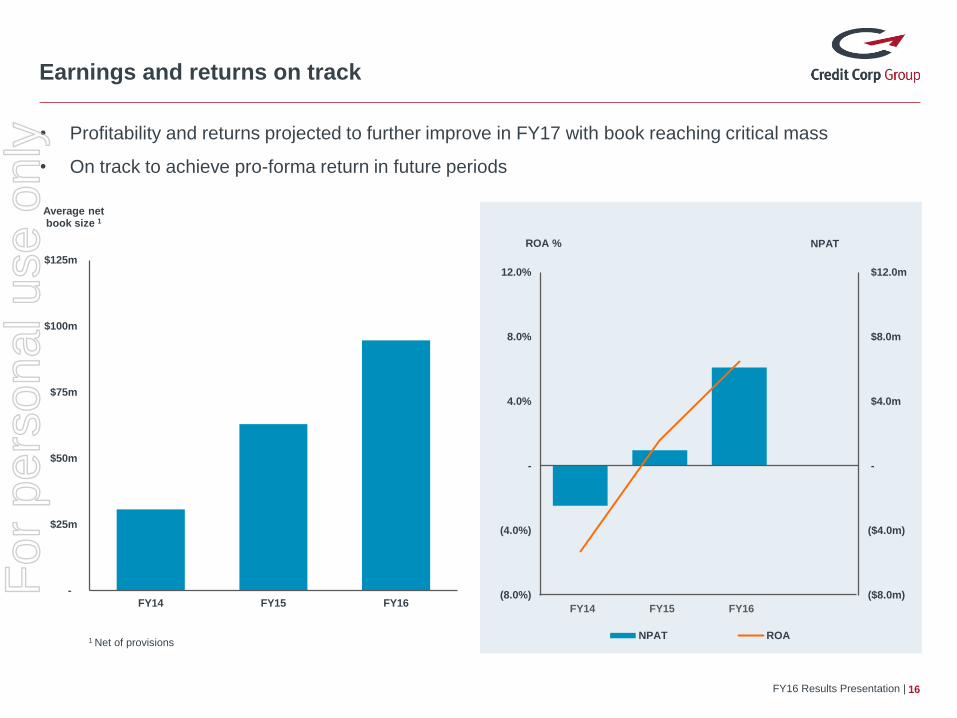
Earnings and returns on track
16
1 Net of provisions
FY16 Results Presentation |
• Profitability and returns projected to further improve in FY17 with book reaching critical mass
• On track to achieve pro-forma return in future periods
For
per
sona
l use
onl
y
Signs of US market conditions easing
17FY16 Results Presentation |
• Supply conditions remain unchanged but major industry participants report recent price and return
improvements:
- “We are seeing early signs of pricing improvements in the US market” 1
- “We are starting to see some softening in pricing…and slightly improved IRRs from where we
might have been a year ago” 2
1 Encore Capital Group (NASDAQ: ECPG) presentation to William Blair Growth Stock conference, June 2016
2 Portfolio Recovery Associates (NASDAQ: PRAA) Q1 FY2016 earnings call, May 2016
• Regulatory clarity progressing, albeit slowly
- CFPB recently issued its outline of proposed rules for debt collectors and buyers
- Consent orders with large banks and debt buyers in past 12 months provide a regulatory
template
• Rationalisation of debt buying panels as compliance hurdles increase
• Credit Corp is well-positioned to provide credit issuers with an alternative to existing participants
For
per
sona
l use
onl
y
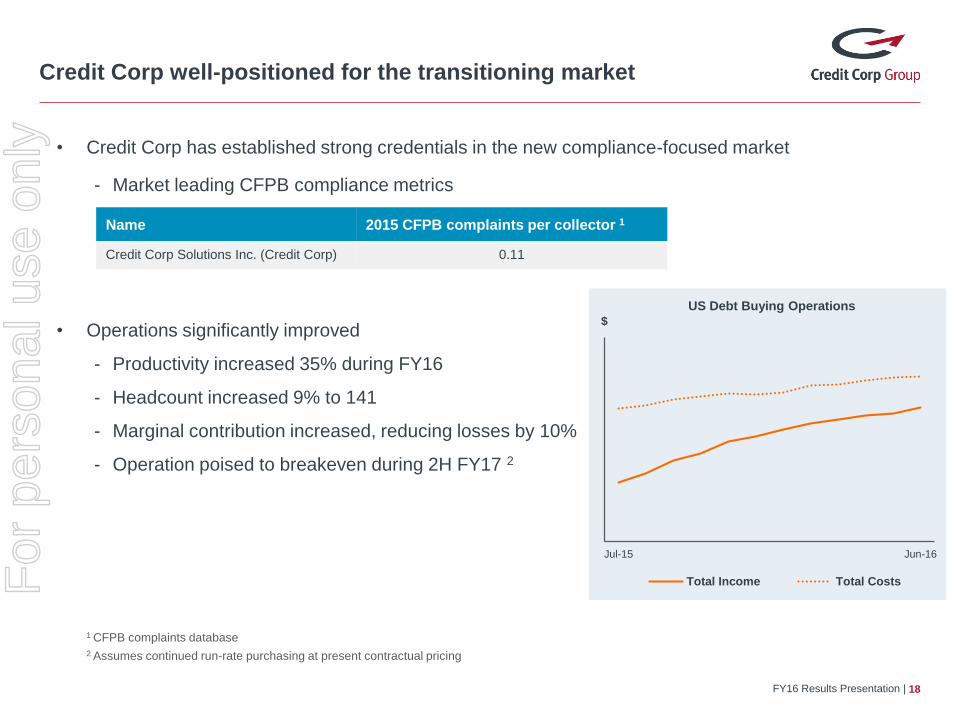
Credit Corp well-positioned for the transitioning market
18FY16 Results Presentation |
• Credit Corp has established strong credentials in the new compliance-focused market
- Market leading CFPB compliance metrics
1 CFPB complaints database
2 Assumes continued run-rate purchasing at present contractual pricing
Jul-15 Jun-16
$
US Debt Buying Operations
Total Income Total Costs
• Operations significantly improved
- Productivity increased 35% during FY16
- Headcount increased 9% to 141
- Marginal contribution increased, reducing losses by 10%
- Operation poised to breakeven during 2H FY17 2
Name 2015 CFPB complaints per collector 1
Credit Corp Solutions Inc. (Credit Corp) 0.11
For
per
sona
l use
onl
y
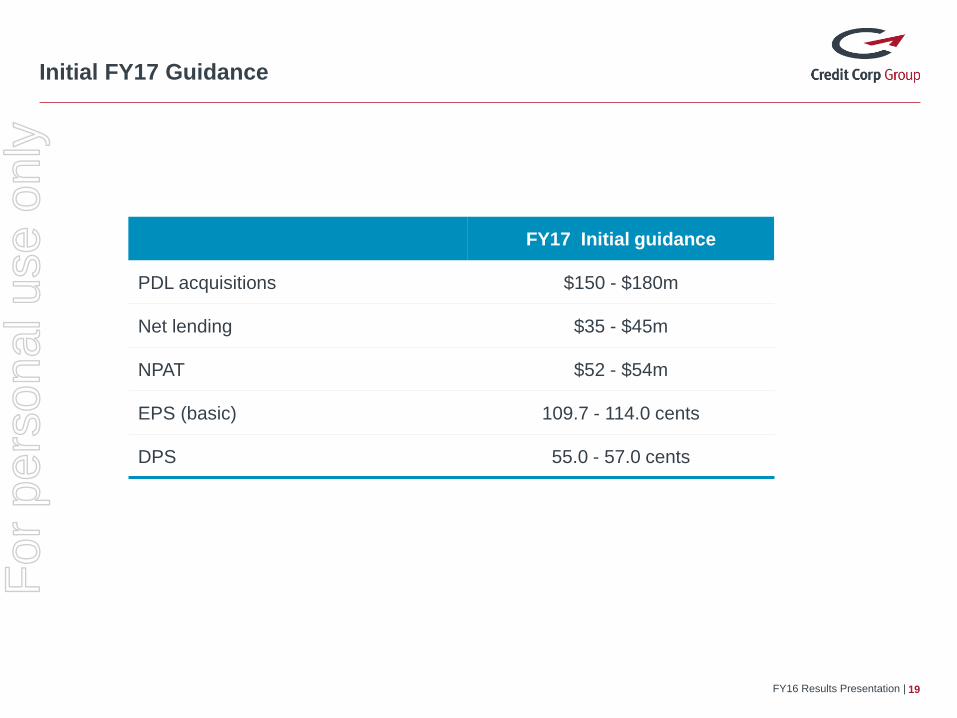
Initial FY17 Guidance
19
FY17 Initial guidance
PDL acquisitions $150 - $180m
Net lending $35 - $45m
NPAT $52 - $54m
EPS (basic) 109.7 - 114.0 cents
DPS 55.0 - 57.0 cents
FY16 Results Presentation |
For
per
sona
l use
onl
y

20
Questions
FY16 Results Presentation |
For
per
sona
l use
onl
y