for Kepler ID 5780885 Quarters 1 - 12
89
Data Validation (DV) Report for Kepler ID 5780885 Quarters 1 - 12 30-Oct-2012 13:08:26 Z
Transcript of for Kepler ID 5780885 Quarters 1 - 12

Data Validation (DV) Reportfor Kepler ID 5780885
Quarters 1 - 12
30-Oct-2012 13:08:26 Z

Contents
1 Summary 1
2 Flux Time Series 3
3 Dashboards 12
4 Centroid Cloud Plot 13
5 Pixel Level Diagnostics 145.1 Planet Candidate 1 . . . . . . . . . . . . . . . . . . . . . . . . . . . . . . . . . . . . . . . . . . . . . . . . . . . . . . . . . . . . . . . . . . . . . . . . . . . . 14
6 Planet Candidate 1 536.1 Model Fitter: All Transits . . . . . . . . . . . . . . . . . . . . . . . . . . . . . . . . . . . . . . . . . . . . . . . . . . . . . . . . . . . . . . . . . . . . . . . . 536.2 Model Fitter: Reduced Parameter Fit Results . . . . . . . . . . . . . . . . . . . . . . . . . . . . . . . . . . . . . . . . . . . . . . . . . . . . . . . . . . . . . 596.3 Validation Tests . . . . . . . . . . . . . . . . . . . . . . . . . . . . . . . . . . . . . . . . . . . . . . . . . . . . . . . . . . . . . . . . . . . . . . . . . . . . . 60
6.3.1 Flux-Weighted Centroid Test . . . . . . . . . . . . . . . . . . . . . . . . . . . . . . . . . . . . . . . . . . . . . . . . . . . . . . . . . . . . . . . . . . 606.3.2 Eclipsing Binary Discrimination Test . . . . . . . . . . . . . . . . . . . . . . . . . . . . . . . . . . . . . . . . . . . . . . . . . . . . . . . . . . . . . . 606.3.3 Bootstrap Test . . . . . . . . . . . . . . . . . . . . . . . . . . . . . . . . . . . . . . . . . . . . . . . . . . . . . . . . . . . . . . . . . . . . . . . . . . 60
Appendices 75
A Planet Candidate 1 75A.1 Model Fitter: All Transits . . . . . . . . . . . . . . . . . . . . . . . . . . . . . . . . . . . . . . . . . . . . . . . . . . . . . . . . . . . . . . . . . . . . . . . . 75A.2 Model Fitter: Odd & Even Transits . . . . . . . . . . . . . . . . . . . . . . . . . . . . . . . . . . . . . . . . . . . . . . . . . . . . . . . . . . . . . . . . . . 77A.3 Eclipsing Binary Discrimination Test . . . . . . . . . . . . . . . . . . . . . . . . . . . . . . . . . . . . . . . . . . . . . . . . . . . . . . . . . . . . . . . . . . 85
B Single Event Statistics from Residual Flux 86
C Alerts 87
ii

1 SUMMARY Target 5780885
1 Summary
Target Properties Value Uncertainty Units
Sky Group 65RA 19.23876800 hoursDec 41.08981000 degreesMagnitude 12.885Radius 1.26 0.611 Solar radiiEffective Temperature 6189 105 Kelvinlog(g) 4.28 0.219 cm/sec2
[Fe/H] -0.20 0 Solar metallicityNumber of Planet Candidates 1Categories MERGED,
ST SC1,ST SC3,PLANETARY,ST SC2,EB,PPA STELLAR,INCLUDE
Prior Pipeline Instance ID -Software Revision svn+ssh://murzim/repo/soc/tags/release/8.3.1@49247Date Report Generated 30-Oct-2012 13:08:26 Z
Quarter Target Module/ Crowding Flux Limb Darkening CoefficientsTable Output Metric Fraction 1 2 3 4
1 20 9/1 0.9895 0.9361 0.3337 0.7464 -0.5138 0.13022 21 7/1 0.9880 0.9373 0.3337 0.7464 -0.5138 0.13023 26 17/1 0.9863 0.9424 0.3337 0.7464 -0.5138 0.13024 29 19/1 0.9788 0.9526 0.3337 0.7464 -0.5138 0.13025 32 9/1 0.9868 0.9601 0.3337 0.7464 -0.5138 0.13026 35 7/1 0.9880 0.9379 0.3337 0.7464 -0.5138 0.13027 38 17/1 0.9863 0.9422 0.3337 0.7464 -0.5138 0.13028 41 19/1 0.9788 0.9527 0.3337 0.7464 -0.5138 0.13029 44 9/1 0.9867 0.9599 0.3337 0.7464 -0.5138 0.1302
10 47 7/1 0.9880 0.9378 0.3337 0.7464 -0.5138 0.130211 50 17/1 0.9864 0.9424 0.3337 0.7464 -0.5138 0.130212 53 19/1 0.9831 0.9292 0.3337 0.7464 -0.5138 0.1302
1

1 SUMMARY Target 5780885
Planet TPS Period DV Period Period Ratio TPS Epoch DV Epoch Semi-major Radius False SuspectedCandidate (days) (days) (DV) (JD-2454833) (BKJD) Axis (AU) (Earth radii) Alarm EB
1 4.9 4.9 1.0 134.3 134.3 0.1 11.4 N/A false
2

2 FLUX TIME SERIES Target 5780885
2 Flux Time Series
Summary plot of PDC flux time series (with harmonic content) and transits for target 5780885, marked with TPS epoch/period. Transits of identified planets are labeledwith epoch KJD and orbital period determined by TPS. For the data of quarter 1, target table 20, start JD is 2454964 and the vertical offset is 0 ppm. For the data ofquarter 2, target table 21, start JD is 2455002 and the vertical offset is 500000 ppm. For the data of quarter 3, target table 26, start JD is 2455093 and the vertical offsetis 1000000 ppm. For the data of quarter 4, target table 29, start JD is 2455184 and the vertical offset is 1500000 ppm.Open ./summary-plots/005780885-00-flux-with-harmonics-tps-01-020.fig
3

2 FLUX TIME SERIES Target 5780885
Summary plot of PDC flux time series (with harmonic content) and transits for target 5780885, marked with TPS epoch/period. Transits of identified planets are labeledwith epoch KJD and orbital period determined by TPS. For the data of quarter 5, target table 32, start JD is 2455276 and the vertical offset is 0 ppm. For the data ofquarter 6, target table 35, start JD is 2455372 and the vertical offset is 500000 ppm. For the data of quarter 7, target table 38, start JD is 2455463 and the vertical offsetis 1000000 ppm. For the data of quarter 8, target table 41, start JD is 2455568 and the vertical offset is 1500000 ppm.Open ./summary-plots/005780885-00-flux-with-harmonics-tps-05-032.fig
4

2 FLUX TIME SERIES Target 5780885
Summary plot of PDC flux time series (with harmonic content) and transits for target 5780885, marked with TPS epoch/period. Transits of identified planets are labeledwith epoch KJD and orbital period determined by TPS. For the data of quarter 9, target table 44, start JD is 2455641 and the vertical offset is 0 ppm. For the data ofquarter 10, target table 47, start JD is 2455739 and the vertical offset is 500000 ppm. For the data of quarter 11, target table 50, start JD is 2455834 and the verticaloffset is 1000000 ppm. For the data of quarter 12, target table 53, start JD is 2455932 and the vertical offset is 1500000 ppm.Open ./summary-plots/005780885-00-flux-with-harmonics-tps-09-044.fig
5

2 FLUX TIME SERIES Target 5780885
Summary plot of PDC flux time series (with harmonic content) and transits for target 5780885, marked with DV fitted epoch/period. Transits of identified planets arelabeled with epoch BKJD and orbital period determined by DV transit fitter. For the data of quarter 1, target table 20, start BJD is 2454964 and the vertical offset is0 ppm. For the data of quarter 2, target table 21, start BJD is 2455002 and the vertical offset is 500000 ppm. For the data of quarter 3, target table 26, start BJD is2455093 and the vertical offset is 1000000 ppm. For the data of quarter 4, target table 29, start BJD is 2455184 and the vertical offset is 1500000 ppm.Open ./summary-plots/005780885-00-flux-with-harmonics-dv-fit-01-020.fig
6

2 FLUX TIME SERIES Target 5780885
Summary plot of PDC flux time series (with harmonic content) and transits for target 5780885, marked with DV fitted epoch/period. Transits of identified planets arelabeled with epoch BKJD and orbital period determined by DV transit fitter. For the data of quarter 5, target table 32, start BJD is 2455276 and the vertical offset is0 ppm. For the data of quarter 6, target table 35, start BJD is 2455372 and the vertical offset is 500000 ppm. For the data of quarter 7, target table 38, start BJD is2455463 and the vertical offset is 1000000 ppm. For the data of quarter 8, target table 41, start BJD is 2455568 and the vertical offset is 1500000 ppm.Open ./summary-plots/005780885-00-flux-with-harmonics-dv-fit-05-032.fig
7

2 FLUX TIME SERIES Target 5780885
Summary plot of PDC flux time series (with harmonic content) and transits for target 5780885, marked with DV fitted epoch/period. Transits of identified planets arelabeled with epoch BKJD and orbital period determined by DV transit fitter. For the data of quarter 9, target table 44, start BJD is 2455641 and the vertical offset is 0ppm. For the data of quarter 10, target table 47, start BJD is 2455739 and the vertical offset is 500000 ppm. For the data of quarter 11, target table 50, start BJD is2455834 and the vertical offset is 1000000 ppm. For the data of quarter 12, target table 53, start BJD is 2455932 and the vertical offset is 1500000 ppm.Open ./summary-plots/005780885-00-flux-with-harmonics-dv-fit-09-044.fig
No figures named 005780885-00-flux-harmonics-free-tps-*.fig are available.
No figures named 005780885-00-flux-harmonics-free-dv-fit-*.fig are available.
8

2 FLUX TIME SERIES Target 5780885
Summary plot of raw flux time series. For the data of quarter 1, target table 20, start JD is 2454964 and the vertical offset is 0 electrons/cadence. For the data of quarter2, target table 21, start JD is 2455002 and the vertical offset is 0 electrons/cadence. For the data of quarter 3, target table 26, start JD is 2455093 and the vertical offsetis 0 electrons/cadence. For the data of quarter 4, target table 29, start JD is 2455184 and the vertical offset is 0 electrons/cadence.Open ./summary-plots/005780885-00-raw-flux-01-020.fig
9

2 FLUX TIME SERIES Target 5780885
Summary plot of raw flux time series. For the data of quarter 5, target table 32, start JD is 2455276 and the vertical offset is 0 electrons/cadence. For the data of quarter6, target table 35, start JD is 2455372 and the vertical offset is 0 electrons/cadence. For the data of quarter 7, target table 38, start JD is 2455463 and the vertical offsetis 0 electrons/cadence. For the data of quarter 8, target table 41, start JD is 2455568 and the vertical offset is 0 electrons/cadence.Open ./summary-plots/005780885-00-raw-flux-05-032.fig
10

2 FLUX TIME SERIES Target 5780885
Summary plot of raw flux time series. For the data of quarter 9, target table 44, start JD is 2455641 and the vertical offset is 0 electrons/cadence. For the data of quarter10, target table 47, start JD is 2455739 and the vertical offset is 0 electrons/cadence. For the data of quarter 11, target table 50, start JD is 2455834 and the verticaloffset is 0 electrons/cadence. For the data of quarter 12, target table 53, start JD is 2455932 and the vertical offset is 0 electrons/cadence.Open ./summary-plots/005780885-00-raw-flux-09-044.fig
11

3 DASHBOARDS Target 5780885 / Planet Candidate 1
3 Dashboards
Planet Candidate 1
Mod
elF
itte
r
Stellar Radius1.3 ± 0.0 Solar units C
entroid
Test
Period = 4.9 ± 0.0 daysDepth = 7566 ± 7 ppmPlanet Radius = 11.4 ± 0.0 Earth radiiSemi-major Axis = 0.1 ± 0.0 AUEquilibrium Temperature = 1272 ± 309 KelvinChi-squared/DoF = 0.9SNR = 1823.5
Flux Weighted Motion Detection Statistic
Value = 1.84e+02Significance = 0.00%Peak RA Offset 2.26e-05 ± 1.33e-05 arcsec (1.7 σ)Peak Dec Offset = -2.84e-06 ± 1.31e-05 arcsec (-0.22 σ)Source RA Offset = -2.96e-03 ± 4.02e-04 arcsec (-7.4 σ)Source Dec Offset = 3.72e-04 ± 2.87e-04 arcsec (1.3 σ)
Ecl
ipsi
ng
Bin
ary
Dis
crim
inat
ion
Tes
t
Odd-Even DepthComparison Statistic
Value = 6.75e-05Significance = 99.34%
Odd-Even EpochComparison Statistic
Value = 2.49e-07Significance = 99.96%
Offsets Relative to Out of Transit Centroid
Source RA Offset = -3.43e-02 ± 7.31e-03 arcsec (-4.69 σ)Source Dec Offset = 1.73e-02 ± 4.42e-03 arcsec (3.92 σ)Source Offset Distance = 3.84e-02 ± 6.83e-03 arcsec (5.63 σ)
Offsets Relative to KIC Position
Source RA Offset = -4.43e-02 ± 1.73e-02 arcsec (-2.55 σ)Source Dec Offset = -1.92e-01 ± 1.33e-02 arcsec (-14.38 σ)Source Offset Distance = 1.97e-01 ± 1.36e-02 arcsec (14.50 σ)
Diff
erence
Image
Cen
troidO
ffsets
Shorter PeriodComparison Statistic
Value = N/ASignificance = N/A
Longer PeriodComparison Statistic
Value = N/ASignificance = N/A
False Alarm = N/AFinal Skip Count = N/AObserved Number of Transits = 201Max Multiple Event Statistic = 9.91e+02
Bootstrap
Test
Summary of model fitter results and validation test results for target 5780885, planet candidate 1. In general, green denotes that the candidate is likely a planet, whilered denotes that the candidate is unlikely to be a planet. Cyan denotes that no data is available. The color of the Model Fitter block is: green, when the SNR of thefit is greater than or equal to 10; yellow, if the SNR is greater than or equal to 7.1 but less than 10; red, if the SNR is less than 7.1 or if the fitter failed. The colorof the Stellar Radius blocks are: green, if the KIC stellar radius differs from the fitted stellar radius by less than 20%; yellow, if this difference is greater than or equalto 20% but less than or equal to 100%; red, if the difference is greater than 100%. The color of the Centroid Test and Eclipsing Binary Discrimination Test blocks are:green, when the significance is within 2-sigma; yellow, when the significance is between 2- and 3-sigma; red when the significance is greater than 3-sigma. The color ofthe Difference Image Centroid Offsets block is: green, when the max offset distance sigma is less than or equal to 2; yellow, when the max sigma is between 2 and 3; redwhen the max sigma is greater than 3. The color of the Bootstrap Test block is: green, when the false alarm is less than or equal to the CCDF of the Gaussian at themax multiple event statistic; yellow, if the false alarm is greater than the CCDF of the Gaussian at the max multiple event statistic but less than or equal to 2 times theCCDF of the Gaussian at the max multiple event statistic; red, if the false alarm is greater than 2 times the CCDF of the Gaussian at the max multiple event statistic.
12

4 CENTROID CLOUD PLOT Target 5780885
4 Centroid Cloud Plot
KeplerId 5780885, KeplerMag 12.885 - This figure shows median detrended flux as a function of median detrended centroids for both ra and dec on the sky. Transitfeatures above the noise jitter are seen as scatter outside the central cloud. Features in the flux time series are seen in the vertical direction while features in the centroidtime series are seen in the horizontal direction. Any tilt to the out-of-cloud scatter indicates correlation between transit features in the flux and centroid time series. Theout of transit mean and standard deviation (SD) indicated in the lower left-hand corner are robust values.Open ./summary-plots/005780885-00-fluxWeighted-centroids-cloud.fig
13

5 PIXEL LEVEL DIAGNOSTICS Target 5780885 / Planet Candidate 1
5 Pixel Level Diagnostics
5.1 Planet Candidate 1
Difference image centroid offsets for target 5780885, planet candidate 1. Left: difference image PRF centroid offsets in RA and Dec with respect to the quarterlyout-of-transit centroids for the given target. Right: difference image PRF centroid offsets in RA and Dec with respect to the KIC coordinates of the given target. Symbolkey: green cross: quarterly centroid offsets with 1-sigma error bars in RA and Dec; magenta cross: robust weighted mean offset over all quarters with 1-sigma error barsin RA and Dec; blue circle: 3-sigma radius of confusion for weighted mean offset; red cross (where applicable): multi-quarter PRF centroid offset with 1-sigma error barsin RA and Dec; cyan circle (where applicable): 3-sigma radius of confusion for multi-quarter PRF offset; red asterisk: location of target star; blue asterisk: location ofother KIC objects in the neighborhood. KIC ID and magnitude are noted in the text associated with each marked object.Open ./planet-01/difference-image/005780885-01-difference-image-centroid-offsets.fig
14

5 PIXEL LEVEL DIAGNOSTICS Target 5780885 / Planet Candidate 1
Multi-Quarter Average PRF Fit of the Difference Images
Mean offset from the PRF fit to the out of transit imageRA Dec Units
Offset −0.0343± 7.31e− 03 0.0173± 4.42e− 03 arcsecondsOffset/σ −4.69 3.92
Offset Distance 0.0384± 6.83e− 03 arcsecondsOffset Distance/σ 5.633σ Radius 0.0205 arcseconds
Mean offset from the KIC RA and DecRA Dec Units
Offset −0.0443± 1.73e− 02 −0.1915± 1.33e− 02 arcsecondsOffset/σ −2.55 −14.38
Offset Distance 0.1966± 1.36e− 02 arcsecondsOffset Distance/σ 14.503σ Radius 0.0407 arcseconds
Bootstrap Multi-Quarter PRF Fit of the Difference Images
Bootstrap multi-quarter PRF fit results for the difference images associated with this planet candidate are not available.
15

5 PIXEL LEVEL DIAGNOSTICS Target 5780885 / Planet Candidate 1
Pixel correlation centroid offsets figure cannot be generated because there are no valid centroid offsets.
16

5 PIXEL LEVEL DIAGNOSTICS Target 5780885 / Planet Candidate 1 / Quarter 1 / Target Table 20
Difference image for target 5780885, planet candidate 1, quarter 1, target table 20. Upper left: difference between mean flux out-of-transit and in-transit; upper right:mean out-of-transit flux; lower left: mean in-transit flux; lower right: difference between mean flux out-of-transit and in-transit after normalizing by the uncertainty inthe difference for each pixel. The optimal aperture is outlined with a white dash-dotted line in each panel and the target mask is outlined with a solid white line. Symbolkey: x: target position from KIC RA and Dec converted to CCD coordinates via motion polynomials; *: position of nearby KIC objects converted to CCD coordinatesvia motion polynomials; +: PRF-fit location of target from out-of-transit image; triangle: PRF-fit location of transit source from the difference image. CCD row andcolumn coordinates are 0-based. Number of transits = 7; number of valid in-transit cadences = 56; number of in-transit cadence gaps = 0; number of valid out-of-transitcadences = 145; number of out-of-transit cadence gaps = 1.Open ./planet-01/difference-image/005780885-01-difference-image-01-020.fig
17

5 PIXEL LEVEL DIAGNOSTICS Target 5780885 / Planet Candidate 1 / Quarter 1 / Target Table 20
The pixel correlation statistic plot is not available because either the fit for target 5780885, planet candidate 1 failed,or there were no observed transits for this candidate in target table 20.
18

5 PIXEL LEVEL DIAGNOSTICS Target 5780885 / Planet Candidate 1 / Quarter 1 / Target Table 20
PRF Fit of the Difference Image
Offset from the PRF fit to the out of transit imageRow Column Units RA Dec Units
Out of Transit Image Centroid 297.16± 3.71e− 06 830.64± 3.51e− 06 pixels 19.23876775± 9.18e− 10 41.08977250± 1.06e− 08 hours/degreesDifference Image Centroid 297.18± 9.10e− 04 830.60± 9.02e− 04 pixels 19.23876602± 8.84e− 08 41.08972555± 9.97e− 07 hours/degreesOffset 0.0251± 9.10e− 04 −0.0386± 9.02e− 04 pixels −0.0707± 3.60e− 03 −0.1690± 3.59e− 03 arcsecondsOffset/σ 27.55 −42.84 −19.67 −47.08
Offset Distance 0.0461± 8.99e− 04 pixels 0.1832± 3.57e− 03 arcsecondsOffset Distance/σ 51.22 51.25
Offset from the KIC RA and Dec converted to pixels via motion polynomialsRow Column Units RA Dec Units
KIC Reference Centroid 297.13± 9.06e− 06 830.66± 8.58e− 06 pixels 19.23876800± 0.00e+ 00 41.08981000± 0.00e+ 00 hours/degreesDifference Image Centroid 297.18± 9.10e− 04 830.60± 9.02e− 04 pixels 19.23876602± 8.84e− 08 41.08972555± 9.97e− 07 hours/degreesOffset 0.0517± 9.10e− 04 −0.0599± 9.02e− 04 pixels −0.0808± 3.60e− 03 −0.3040± 3.59e− 03 arcsecondsOffset/σ 56.80 −66.37 −22.46 −84.70
Offset Distance 0.0791± 9.00e− 04 pixels 0.3146± 3.58e− 03 arcsecondsOffset Distance/σ 87.88 87.90
PRF Fit of the Pixel Correlation Image
The pixel correlation image centroid could not be calculated for target 5780885,planet candidate 1, in target table 20.
19

5 PIXEL LEVEL DIAGNOSTICS Target 5780885 / Planet Candidate 1 / Quarter 2 / Target Table 21
Difference image for target 5780885, planet candidate 1, quarter 2, target table 21. Upper left: difference between mean flux out-of-transit and in-transit; upper right:mean out-of-transit flux; lower left: mean in-transit flux; lower right: difference between mean flux out-of-transit and in-transit after normalizing by the uncertainty inthe difference for each pixel. The optimal aperture is outlined with a white dash-dotted line in each panel and the target mask is outlined with a solid white line. Symbolkey: x: target position from KIC RA and Dec converted to CCD coordinates via motion polynomials; *: position of nearby KIC objects converted to CCD coordinatesvia motion polynomials; +: PRF-fit location of target from out-of-transit image; triangle: PRF-fit location of transit source from the difference image. CCD row andcolumn coordinates are 0-based. Number of transits = 15; number of valid in-transit cadences = 118; number of in-transit cadence gaps = 3; number of valid out-of-transitcadences = 314; number of out-of-transit cadence gaps = 5.Open ./planet-01/difference-image/005780885-01-difference-image-02-021.fig
20

5 PIXEL LEVEL DIAGNOSTICS Target 5780885 / Planet Candidate 1 / Quarter 2 / Target Table 21
The pixel correlation statistic plot is not available because either the fit for target 5780885, planet candidate 1 failed,or there were no observed transits for this candidate in target table 21.
21

5 PIXEL LEVEL DIAGNOSTICS Target 5780885 / Planet Candidate 1 / Quarter 2 / Target Table 21
PRF Fit of the Difference Image
Offset from the PRF fit to the out of transit imageRow Column Units RA Dec Units
Out of Transit Image Centroid 297.78± 2.84e− 06 835.69± 3.50e− 06 pixels 19.23876616± 7.20e− 10 41.08976140± 8.09e− 09 hours/degreesDifference Image Centroid 297.77± 7.73e− 04 835.69± 9.60e− 04 pixels 19.23876611± 8.33e− 08 41.08976518± 9.79e− 07 hours/degreesOffset −0.0031± 7.73e− 04 0.0016± 9.60e− 04 pixels −0.0018± 3.39e− 03 0.0136± 3.52e− 03 arcsecondsOffset/σ −3.98 1.63 −0.53 3.86
Offset Distance 0.0035± 8.58e− 04 pixels 0.0137± 3.41e− 03 arcsecondsOffset Distance/σ 4.02 4.02
Offset from the KIC RA and Dec converted to pixels via motion polynomialsRow Column Units RA Dec Units
KIC Reference Centroid 297.75± 6.43e− 06 835.73± 6.86e− 06 pixels 19.23876800± 0.00e+ 00 41.08981000± 0.00e+ 00 hours/degreesDifference Image Centroid 297.77± 7.73e− 04 835.69± 9.60e− 04 pixels 19.23876611± 8.33e− 08 41.08976518± 9.79e− 07 hours/degreesOffset 0.0225± 7.73e− 04 −0.0388± 9.60e− 04 pixels −0.0768± 3.39e− 03 −0.1613± 3.52e− 03 arcsecondsOffset/σ 29.16 −40.46 −22.65 −45.79
Offset Distance 0.0449± 9.58e− 04 pixels 0.1787± 3.81e− 03 arcsecondsOffset Distance/σ 46.90 46.95
PRF Fit of the Pixel Correlation Image
The pixel correlation image centroid could not be calculated for target 5780885,planet candidate 1, in target table 21.
22

5 PIXEL LEVEL DIAGNOSTICS Target 5780885 / Planet Candidate 1 / Quarter 3 / Target Table 26
Difference image for target 5780885, planet candidate 1, quarter 3, target table 26. Upper left: difference between mean flux out-of-transit and in-transit; upper right:mean out-of-transit flux; lower left: mean in-transit flux; lower right: difference between mean flux out-of-transit and in-transit after normalizing by the uncertainty inthe difference for each pixel. The optimal aperture is outlined with a white dash-dotted line in each panel and the target mask is outlined with a solid white line. Symbolkey: x: target position from KIC RA and Dec converted to CCD coordinates via motion polynomials; *: position of nearby KIC objects converted to CCD coordinatesvia motion polynomials; +: PRF-fit location of target from out-of-transit image; triangle: PRF-fit location of transit source from the difference image. CCD row andcolumn coordinates are 0-based. Number of transits = 14; number of valid in-transit cadences = 112; number of in-transit cadence gaps = 1; number of valid out-of-transitcadences = 296; number of out-of-transit cadence gaps = 2.Open ./planet-01/difference-image/005780885-01-difference-image-03-026.fig
23

5 PIXEL LEVEL DIAGNOSTICS Target 5780885 / Planet Candidate 1 / Quarter 3 / Target Table 26
The pixel correlation statistic plot is not available because either the fit for target 5780885, planet candidate 1 failed,or there were no observed transits for this candidate in target table 26.
24

5 PIXEL LEVEL DIAGNOSTICS Target 5780885 / Planet Candidate 1 / Quarter 3 / Target Table 26
PRF Fit of the Difference Image
Offset from the PRF fit to the out of transit imageRow Column Units RA Dec Units
Out of Transit Image Centroid 293.06± 3.32e− 06 835.63± 3.13e− 06 pixels 19.23876755± 6.78e− 10 41.08973778± 7.89e− 09 hours/degreesDifference Image Centroid 293.05± 8.95e− 04 835.62± 8.52e− 04 pixels 19.23876635± 8.54e− 08 41.08974031± 9.59e− 07 hours/degreesOffset −0.0088± 8.95e− 04 −0.0088± 8.52e− 04 pixels −0.0487± 3.47e− 03 0.0091± 3.45e− 03 arcsecondsOffset/σ −9.86 −10.35 −14.02 2.64
Offset Distance 0.0125± 8.87e− 04 pixels 0.0496± 3.51e− 03 arcsecondsOffset Distance/σ 14.05 14.13
Offset from the KIC RA and Dec converted to pixels via motion polynomialsRow Column Units RA Dec Units
KIC Reference Centroid 293.01± 6.55e− 06 835.67± 5.99e− 06 pixels 19.23876800± 0.00e+ 00 41.08981000± 0.00e+ 00 hours/degreesDifference Image Centroid 293.05± 8.95e− 04 835.62± 8.52e− 04 pixels 19.23876635± 8.54e− 08 41.08974031± 9.59e− 07 hours/degreesOffset 0.0425± 8.95e− 04 −0.0496± 8.52e− 04 pixels −0.0672± 3.47e− 03 −0.2509± 3.45e− 03 arcsecondsOffset/σ 47.53 −58.19 −19.35 −72.67
Offset Distance 0.0653± 8.56e− 04 pixels 0.2597± 3.40e− 03 arcsecondsOffset Distance/σ 76.28 76.31
PRF Fit of the Pixel Correlation Image
The pixel correlation image centroid could not be calculated for target 5780885,planet candidate 1, in target table 26.
25
5 PIXEL LEVEL DIAGNOSTICS Target 5780885 / Planet Candidate 1 / Quarter 4 / Target Table 29
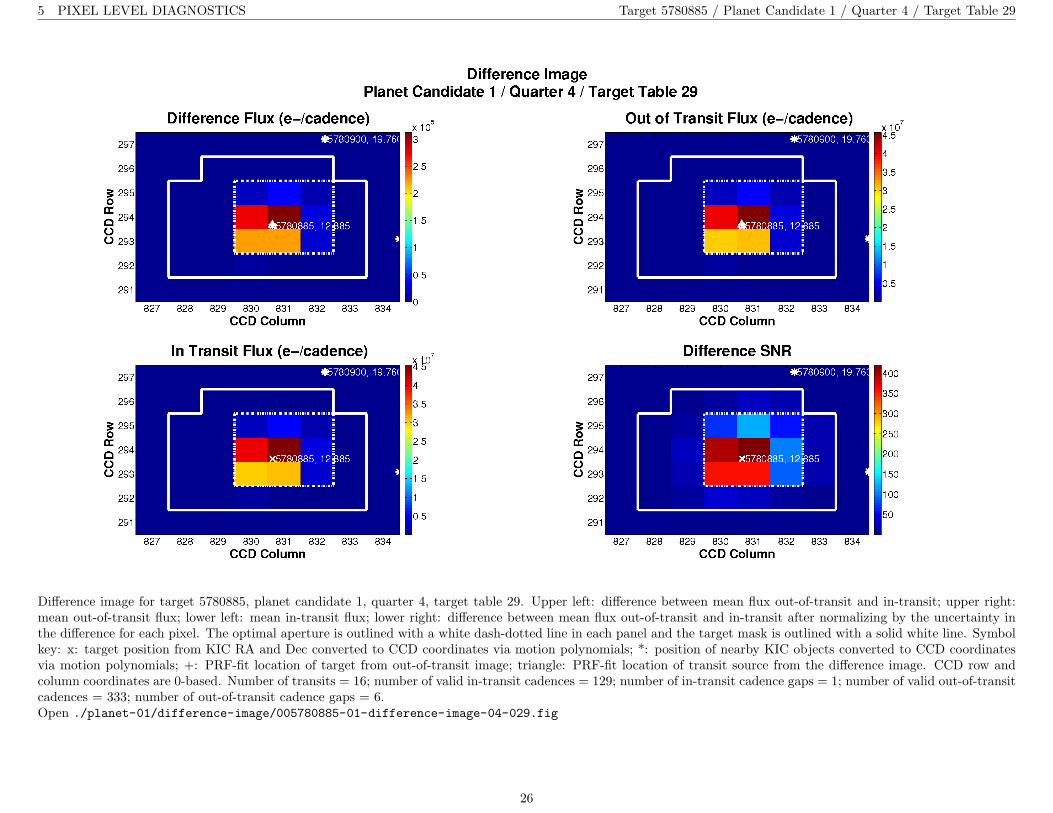
Difference image for target 5780885, planet candidate 1, quarter 4, target table 29. Upper left: difference between mean flux out-of-transit and in-transit; upper right:mean out-of-transit flux; lower left: mean in-transit flux; lower right: difference between mean flux out-of-transit and in-transit after normalizing by the uncertainty inthe difference for each pixel. The optimal aperture is outlined with a white dash-dotted line in each panel and the target mask is outlined with a solid white line. Symbolkey: x: target position from KIC RA and Dec converted to CCD coordinates via motion polynomials; *: position of nearby KIC objects converted to CCD coordinatesvia motion polynomials; +: PRF-fit location of target from out-of-transit image; triangle: PRF-fit location of transit source from the difference image. CCD row andcolumn coordinates are 0-based. Number of transits = 16; number of valid in-transit cadences = 129; number of in-transit cadence gaps = 1; number of valid out-of-transitcadences = 333; number of out-of-transit cadence gaps = 6.Open ./planet-01/difference-image/005780885-01-difference-image-04-029.fig
26

5 PIXEL LEVEL DIAGNOSTICS Target 5780885 / Planet Candidate 1 / Quarter 4 / Target Table 29
The pixel correlation statistic plot is not available because either the fit for target 5780885, planet candidate 1 failed,or there were no observed transits for this candidate in target table 29.
27

5 PIXEL LEVEL DIAGNOSTICS Target 5780885 / Planet Candidate 1 / Quarter 4 / Target Table 29
PRF Fit of the Difference Image
Offset from the PRF fit to the out of transit imageRow Column Units RA Dec Units
Out of Transit Image Centroid 293.67± 2.09e− 06 830.65± 2.64e− 06 pixels 19.23877002± 8.66e− 10 41.08976153± 8.48e− 09 hours/degreesDifference Image Centroid 293.66± 5.67e− 04 830.65± 7.15e− 04 pixels 19.23876934± 6.20e− 08 41.08976917± 7.21e− 07 hours/degreesOffset −0.0097± 5.67e− 04 −0.0019± 7.15e− 04 pixels −0.0279± 2.52e− 03 0.0275± 2.59e− 03 arcsecondsOffset/σ −17.05 −2.63 −11.05 10.60
Offset Distance 0.0099± 5.58e− 04 pixels 0.0392± 2.21e− 03 arcsecondsOffset Distance/σ 17.65 17.70
Offset from the KIC RA and Dec converted to pixels via motion polynomialsRow Column Units RA Dec Units
KIC Reference Centroid 293.63± 5.88e− 06 830.66± 9.61e− 06 pixels 19.23876800± 0.00e+ 00 41.08981000± 0.00e+ 00 hours/degreesDifference Image Centroid 293.66± 5.67e− 04 830.65± 7.15e− 04 pixels 19.23876934± 6.20e− 08 41.08976917± 7.21e− 07 hours/degreesOffset 0.0382± 5.67e− 04 −0.0096± 7.15e− 04 pixels 0.0545± 2.52e− 03 −0.1470± 2.59e− 03 arcsecondsOffset/σ 67.43 −13.38 21.59 −56.67
Offset Distance 0.0394± 5.95e− 04 pixels 0.1568± 2.37e− 03 arcsecondsOffset Distance/σ 66.21 66.18
PRF Fit of the Pixel Correlation Image
The pixel correlation image centroid could not be calculated for target 5780885,planet candidate 1, in target table 29.
28

5 PIXEL LEVEL DIAGNOSTICS Target 5780885 / Planet Candidate 1 / Quarter 5 / Target Table 32
Difference image for target 5780885, planet candidate 1, quarter 5, target table 32. Upper left: difference between mean flux out-of-transit and in-transit; upper right:mean out-of-transit flux; lower left: mean in-transit flux; lower right: difference between mean flux out-of-transit and in-transit after normalizing by the uncertainty inthe difference for each pixel. The optimal aperture is outlined with a white dash-dotted line in each panel and the target mask is outlined with a solid white line. Symbolkey: x: target position from KIC RA and Dec converted to CCD coordinates via motion polynomials; *: position of nearby KIC objects converted to CCD coordinatesvia motion polynomials; +: PRF-fit location of target from out-of-transit image; triangle: PRF-fit location of transit source from the difference image. CCD row andcolumn coordinates are 0-based. Number of transits = 17; number of valid in-transit cadences = 135; number of in-transit cadence gaps = 2; number of valid out-of-transitcadences = 356; number of out-of-transit cadence gaps = 2.Open ./planet-01/difference-image/005780885-01-difference-image-05-032.fig
29
5 PIXEL LEVEL DIAGNOSTICS Target 5780885 / Planet Candidate 1 / Quarter 5 / Target Table 32
The pixel correlation statistic plot is not available because either the fit for target 5780885, planet candidate 1 failed,or there were no observed transits for this candidate in target table 32.
30

5 PIXEL LEVEL DIAGNOSTICS Target 5780885 / Planet Candidate 1 / Quarter 5 / Target Table 32
PRF Fit of the Difference Image
Offset from the PRF fit to the out of transit imageRow Column Units RA Dec Units
Out of Transit Image Centroid 297.15± 2.33e− 06 830.73± 2.32e− 06 pixels 19.23876896± 7.92e− 10 41.08976503± 7.86e− 09 hours/degreesDifference Image Centroid 297.14± 6.57e− 04 830.71± 6.10e− 04 pixels 19.23876700± 6.14e− 08 41.08975965± 7.03e− 07 hours/degreesOffset −0.0073± 6.57e− 04 −0.0193± 6.10e− 04 pixels −0.0799± 2.50e− 03 −0.0194± 2.53e− 03 arcsecondsOffset/σ −11.14 −31.68 −31.97 −7.66
Offset Distance 0.0207± 6.21e− 04 pixels 0.0822± 2.46e− 03 arcsecondsOffset Distance/σ 33.29 33.46
Offset from the KIC RA and Dec converted to pixels via motion polynomialsRow Column Units RA Dec Units
KIC Reference Centroid 297.11± 5.61e− 06 830.74± 8.65e− 06 pixels 19.23876800± 0.00e+ 00 41.08981000± 0.00e+ 00 hours/degreesDifference Image Centroid 297.14± 6.57e− 04 830.71± 6.10e− 04 pixels 19.23876700± 6.14e− 08 41.08975965± 7.03e− 07 hours/degreesOffset 0.0319± 6.57e− 04 −0.0342± 6.11e− 04 pixels −0.0408± 2.50e− 03 −0.1813± 2.53e− 03 arcsecondsOffset/σ 48.51 −55.97 −16.34 −71.67
Offset Distance 0.0467± 6.25e− 04 pixels 0.1858± 2.49e− 03 arcsecondsOffset Distance/σ 74.70 74.72
PRF Fit of the Pixel Correlation Image
The pixel correlation image centroid could not be calculated for target 5780885,planet candidate 1, in target table 32.
31
5 PIXEL LEVEL DIAGNOSTICS Target 5780885 / Planet Candidate 1 / Quarter 6 / Target Table 35
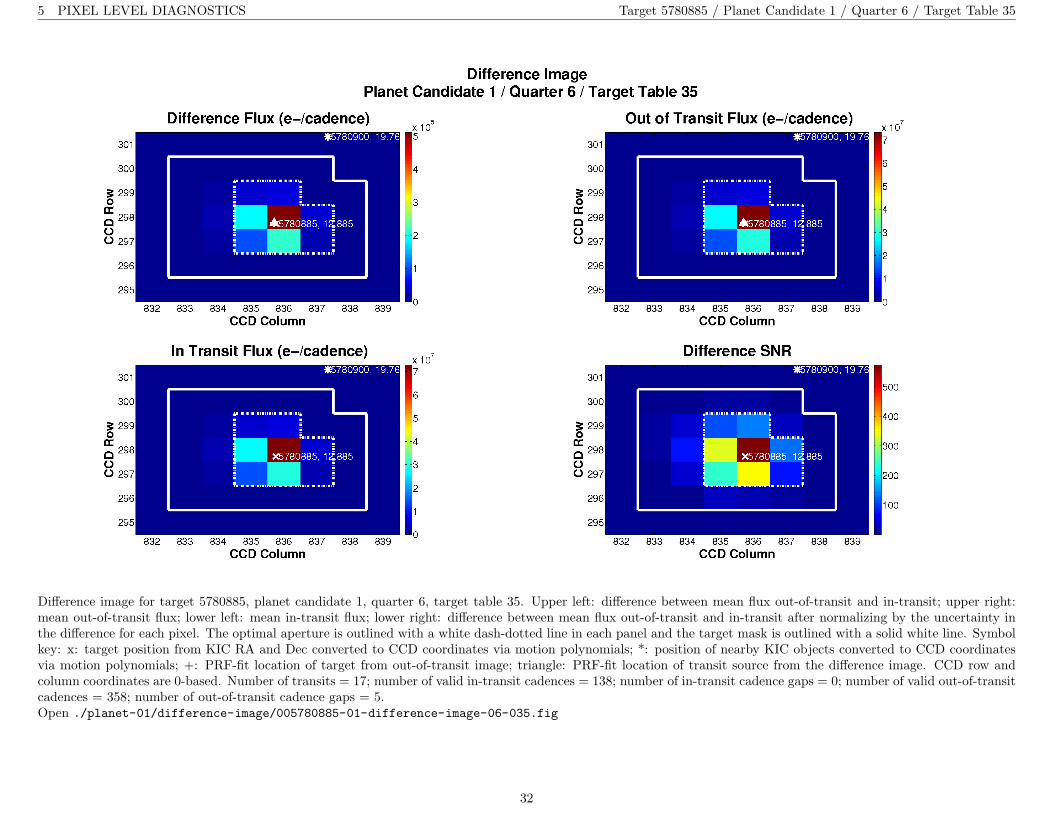
Difference image for target 5780885, planet candidate 1, quarter 6, target table 35. Upper left: difference between mean flux out-of-transit and in-transit; upper right:mean out-of-transit flux; lower left: mean in-transit flux; lower right: difference between mean flux out-of-transit and in-transit after normalizing by the uncertainty inthe difference for each pixel. The optimal aperture is outlined with a white dash-dotted line in each panel and the target mask is outlined with a solid white line. Symbolkey: x: target position from KIC RA and Dec converted to CCD coordinates via motion polynomials; *: position of nearby KIC objects converted to CCD coordinatesvia motion polynomials; +: PRF-fit location of target from out-of-transit image; triangle: PRF-fit location of transit source from the difference image. CCD row andcolumn coordinates are 0-based. Number of transits = 17; number of valid in-transit cadences = 138; number of in-transit cadence gaps = 0; number of valid out-of-transitcadences = 358; number of out-of-transit cadence gaps = 5.Open ./planet-01/difference-image/005780885-01-difference-image-06-035.fig
32

5 PIXEL LEVEL DIAGNOSTICS Target 5780885 / Planet Candidate 1 / Quarter 6 / Target Table 35
The pixel correlation statistic plot is not available because either the fit for target 5780885, planet candidate 1 failed,or there were no observed transits for this candidate in target table 35.
33

5 PIXEL LEVEL DIAGNOSTICS Target 5780885 / Planet Candidate 1 / Quarter 6 / Target Table 35
PRF Fit of the Difference Image
Offset from the PRF fit to the out of transit imageRow Column Units RA Dec Units
Out of Transit Image Centroid 297.75± 2.65e− 06 835.70± 3.39e− 06 pixels 19.23876571± 7.04e− 10 41.08975476± 7.87e− 09 hours/degreesDifference Image Centroid 297.75± 7.12e− 04 835.71± 9.20e− 04 pixels 19.23876563± 7.90e− 08 41.08976123± 9.19e− 07 hours/degreesOffset −0.0053± 7.12e− 04 0.0026± 9.20e− 04 pixels −0.0034± 3.22e− 03 0.0233± 3.31e− 03 arcsecondsOffset/σ −7.47 2.83 −1.06 7.04
Offset Distance 0.0059± 7.98e− 04 pixels 0.0236± 3.18e− 03 arcsecondsOffset Distance/σ 7.42 7.42
Offset from the KIC RA and Dec converted to pixels via motion polynomialsRow Column Units RA Dec Units
KIC Reference Centroid 297.73± 6.27e− 06 835.75± 6.73e− 06 pixels 19.23876800± 0.00e+ 00 41.08981000± 0.00e+ 00 hours/degreesDifference Image Centroid 297.75± 7.12e− 04 835.71± 9.20e− 04 pixels 19.23876563± 7.90e− 08 41.08976123± 9.19e− 07 hours/degreesOffset 0.0227± 7.12e− 04 −0.0449± 9.20e− 04 pixels −0.0964± 3.22e− 03 −0.1756± 3.31e− 03 arcsecondsOffset/σ 31.90 −48.84 −29.98 −53.07
Offset Distance 0.0504± 9.18e− 04 pixels 0.2003± 3.65e− 03 arcsecondsOffset Distance/σ 54.84 54.92
PRF Fit of the Pixel Correlation Image
The pixel correlation image centroid could not be calculated for target 5780885,planet candidate 1, in target table 35.
34

5 PIXEL LEVEL DIAGNOSTICS Target 5780885 / Planet Candidate 1 / Quarter 7 / Target Table 38
Difference image for target 5780885, planet candidate 1, quarter 7, target table 38. Upper left: difference between mean flux out-of-transit and in-transit; upper right:mean out-of-transit flux; lower left: mean in-transit flux; lower right: difference between mean flux out-of-transit and in-transit after normalizing by the uncertainty inthe difference for each pixel. The optimal aperture is outlined with a white dash-dotted line in each panel and the target mask is outlined with a solid white line. Symbolkey: x: target position from KIC RA and Dec converted to CCD coordinates via motion polynomials; *: position of nearby KIC objects converted to CCD coordinatesvia motion polynomials; +: PRF-fit location of target from out-of-transit image; triangle: PRF-fit location of transit source from the difference image. CCD row andcolumn coordinates are 0-based. Number of transits = 15; number of valid in-transit cadences = 121; number of in-transit cadence gaps = 0; number of valid out-of-transitcadences = 316; number of out-of-transit cadence gaps = 2.Open ./planet-01/difference-image/005780885-01-difference-image-07-038.fig
35

5 PIXEL LEVEL DIAGNOSTICS Target 5780885 / Planet Candidate 1 / Quarter 7 / Target Table 38
The pixel correlation statistic plot is not available because either the fit for target 5780885, planet candidate 1 failed,or there were no observed transits for this candidate in target table 38.
36

5 PIXEL LEVEL DIAGNOSTICS Target 5780885 / Planet Candidate 1 / Quarter 7 / Target Table 38
PRF Fit of the Difference Image
Offset from the PRF fit to the out of transit imageRow Column Units RA Dec Units
Out of Transit Image Centroid 293.07± 3.26e− 06 835.63± 3.04e− 06 pixels 19.23876839± 9.82e− 10 41.08975669± 1.14e− 08 hours/degreesDifference Image Centroid 293.07± 8.74e− 04 835.62± 8.25e− 04 pixels 19.23876782± 8.28e− 08 41.08976148± 9.37e− 07 hours/degreesOffset −0.0068± 8.74e− 04 −0.0023± 8.25e− 04 pixels −0.0229± 3.37e− 03 0.0172± 3.37e− 03 arcsecondsOffset/σ −7.81 −2.78 −6.79 5.11
Offset Distance 0.0072± 8.76e− 04 pixels 0.0286± 3.47e− 03 arcsecondsOffset Distance/σ 8.22 8.25
Offset from the KIC RA and Dec converted to pixels via motion polynomialsRow Column Units RA Dec Units
KIC Reference Centroid 293.03± 1.01e− 05 835.65± 9.38e− 06 pixels 19.23876800± 0.00e+ 00 41.08981000± 0.00e+ 00 hours/degreesDifference Image Centroid 293.07± 8.74e− 04 835.62± 8.25e− 04 pixels 19.23876782± 8.28e− 08 41.08976148± 9.37e− 07 hours/degreesOffset 0.0352± 8.74e− 04 −0.0263± 8.25e− 04 pixels −0.0071± 3.37e− 03 −0.1747± 3.37e− 03 arcsecondsOffset/σ 40.31 −31.85 −2.12 −51.78
Offset Distance 0.0440± 8.46e− 04 pixels 0.1748± 3.36e− 03 arcsecondsOffset Distance/σ 51.97 51.96
PRF Fit of the Pixel Correlation Image
The pixel correlation image centroid could not be calculated for target 5780885,planet candidate 1, in target table 38.
37
5 PIXEL LEVEL DIAGNOSTICS Target 5780885 / Planet Candidate 1 / Quarter 8 / Target Table 41
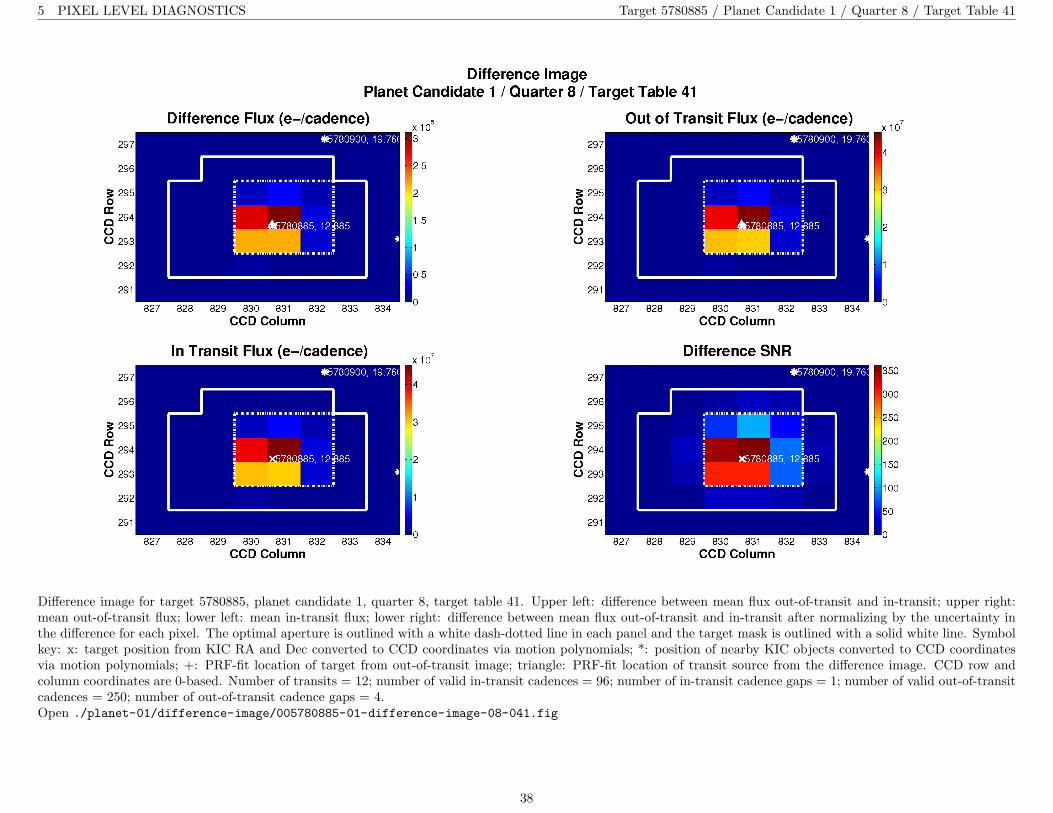
Difference image for target 5780885, planet candidate 1, quarter 8, target table 41. Upper left: difference between mean flux out-of-transit and in-transit; upper right:mean out-of-transit flux; lower left: mean in-transit flux; lower right: difference between mean flux out-of-transit and in-transit after normalizing by the uncertainty inthe difference for each pixel. The optimal aperture is outlined with a white dash-dotted line in each panel and the target mask is outlined with a solid white line. Symbolkey: x: target position from KIC RA and Dec converted to CCD coordinates via motion polynomials; *: position of nearby KIC objects converted to CCD coordinatesvia motion polynomials; +: PRF-fit location of target from out-of-transit image; triangle: PRF-fit location of transit source from the difference image. CCD row andcolumn coordinates are 0-based. Number of transits = 12; number of valid in-transit cadences = 96; number of in-transit cadence gaps = 1; number of valid out-of-transitcadences = 250; number of out-of-transit cadence gaps = 4.Open ./planet-01/difference-image/005780885-01-difference-image-08-041.fig
38

5 PIXEL LEVEL DIAGNOSTICS Target 5780885 / Planet Candidate 1 / Quarter 8 / Target Table 41
The pixel correlation statistic plot is not available because either the fit for target 5780885, planet candidate 1 failed,or there were no observed transits for this candidate in target table 41.
39
5 PIXEL LEVEL DIAGNOSTICS Target 5780885 / Planet Candidate 1 / Quarter 8 / Target Table 41
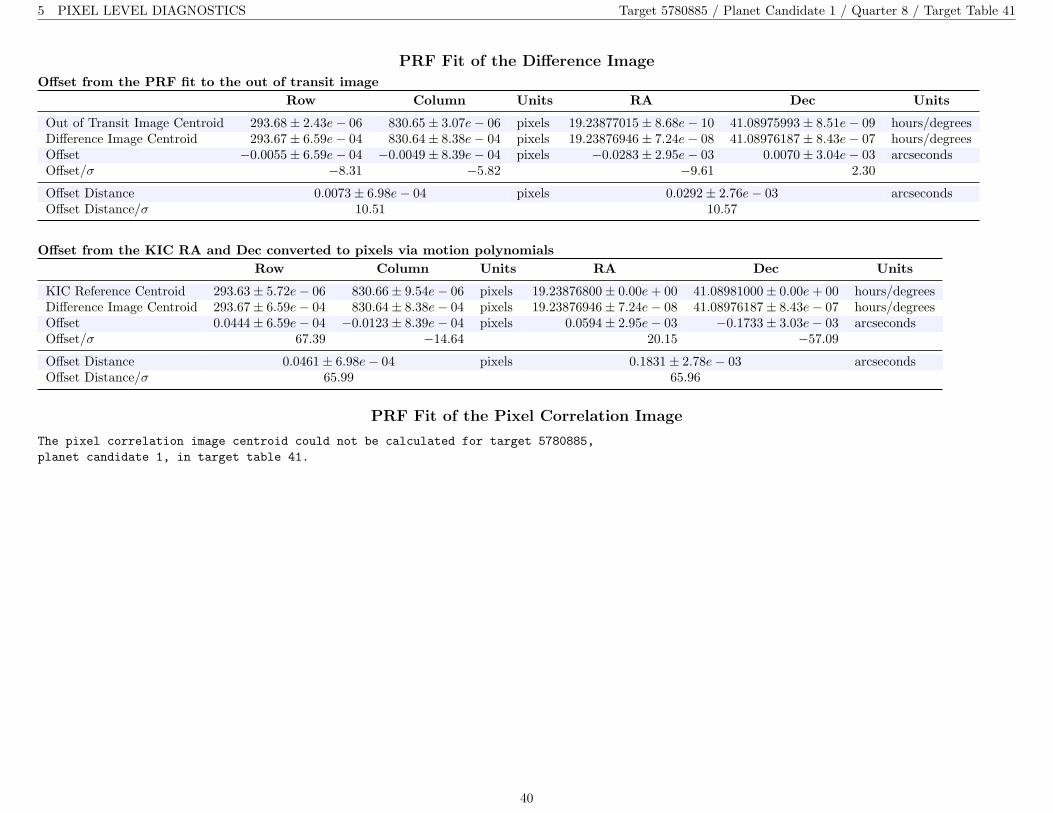
PRF Fit of the Difference Image
Offset from the PRF fit to the out of transit imageRow Column Units RA Dec Units
Out of Transit Image Centroid 293.68± 2.43e− 06 830.65± 3.07e− 06 pixels 19.23877015± 8.68e− 10 41.08975993± 8.51e− 09 hours/degreesDifference Image Centroid 293.67± 6.59e− 04 830.64± 8.38e− 04 pixels 19.23876946± 7.24e− 08 41.08976187± 8.43e− 07 hours/degreesOffset −0.0055± 6.59e− 04 −0.0049± 8.39e− 04 pixels −0.0283± 2.95e− 03 0.0070± 3.04e− 03 arcsecondsOffset/σ −8.31 −5.82 −9.61 2.30
Offset Distance 0.0073± 6.98e− 04 pixels 0.0292± 2.76e− 03 arcsecondsOffset Distance/σ 10.51 10.57
Offset from the KIC RA and Dec converted to pixels via motion polynomialsRow Column Units RA Dec Units
KIC Reference Centroid 293.63± 5.72e− 06 830.66± 9.54e− 06 pixels 19.23876800± 0.00e+ 00 41.08981000± 0.00e+ 00 hours/degreesDifference Image Centroid 293.67± 6.59e− 04 830.64± 8.38e− 04 pixels 19.23876946± 7.24e− 08 41.08976187± 8.43e− 07 hours/degreesOffset 0.0444± 6.59e− 04 −0.0123± 8.39e− 04 pixels 0.0594± 2.95e− 03 −0.1733± 3.03e− 03 arcsecondsOffset/σ 67.39 −14.64 20.15 −57.09
Offset Distance 0.0461± 6.98e− 04 pixels 0.1831± 2.78e− 03 arcsecondsOffset Distance/σ 65.99 65.96
PRF Fit of the Pixel Correlation Image
The pixel correlation image centroid could not be calculated for target 5780885,planet candidate 1, in target table 41.
40

5 PIXEL LEVEL DIAGNOSTICS Target 5780885 / Planet Candidate 1 / Quarter 9 / Target Table 44
Difference image for target 5780885, planet candidate 1, quarter 9, target table 44. Upper left: difference between mean flux out-of-transit and in-transit; upper right:mean out-of-transit flux; lower left: mean in-transit flux; lower right: difference between mean flux out-of-transit and in-transit after normalizing by the uncertainty inthe difference for each pixel. The optimal aperture is outlined with a white dash-dotted line in each panel and the target mask is outlined with a solid white line. Symbolkey: x: target position from KIC RA and Dec converted to CCD coordinates via motion polynomials; *: position of nearby KIC objects converted to CCD coordinatesvia motion polynomials; +: PRF-fit location of target from out-of-transit image; triangle: PRF-fit location of transit source from the difference image. CCD row andcolumn coordinates are 0-based. Number of transits = 19; number of valid in-transit cadences = 153; number of in-transit cadence gaps = 0; number of valid out-of-transitcadences = 394; number of out-of-transit cadence gaps = 9.Open ./planet-01/difference-image/005780885-01-difference-image-09-044.fig
41

5 PIXEL LEVEL DIAGNOSTICS Target 5780885 / Planet Candidate 1 / Quarter 9 / Target Table 44
The pixel correlation statistic plot is not available because either the fit for target 5780885, planet candidate 1 failed,or there were no observed transits for this candidate in target table 44.
42

5 PIXEL LEVEL DIAGNOSTICS Target 5780885 / Planet Candidate 1 / Quarter 9 / Target Table 44
PRF Fit of the Difference Image
Offset from the PRF fit to the out of transit imageRow Column Units RA Dec Units
Out of Transit Image Centroid 297.15± 2.27e− 06 830.69± 2.18e− 06 pixels 19.23876852± 8.02e− 10 41.08975777± 7.98e− 09 hours/degreesDifference Image Centroid 297.15± 6.15e− 04 830.68± 5.81e− 04 pixels 19.23876735± 5.81e− 08 41.08975000± 6.61e− 07 hours/degreesOffset −0.0009± 6.15e− 04 −0.0138± 5.81e− 04 pixels −0.0475± 2.37e− 03 −0.0280± 2.38e− 03 arcsecondsOffset/σ −1.50 −23.82 −20.08 −11.76
Offset Distance 0.0139± 5.82e− 04 pixels 0.0551± 2.30e− 03 arcsecondsOffset Distance/σ 23.83 23.92
Offset from the KIC RA and Dec converted to pixels via motion polynomialsRow Column Units RA Dec Units
KIC Reference Centroid 297.11± 5.76e− 06 830.71± 8.79e− 06 pixels 19.23876800± 0.00e+ 00 41.08981000± 0.00e+ 00 hours/degreesDifference Image Centroid 297.15± 6.15e− 04 830.68± 5.81e− 04 pixels 19.23876735± 5.81e− 08 41.08975000± 6.61e− 07 hours/degreesOffset 0.0411± 6.15e− 04 −0.0361± 5.81e− 04 pixels −0.0265± 2.37e− 03 −0.2160± 2.38e− 03 arcsecondsOffset/σ 66.83 −62.18 −11.20 −90.77
Offset Distance 0.0547± 5.94e− 04 pixels 0.2176± 2.36e− 03 arcsecondsOffset Distance/σ 92.13 92.13
PRF Fit of the Pixel Correlation Image
The pixel correlation image centroid could not be calculated for target 5780885,planet candidate 1, in target table 44.
43

5 PIXEL LEVEL DIAGNOSTICS Target 5780885 / Planet Candidate 1 / Quarter 10 / Target Table 47
Difference image for target 5780885, planet candidate 1, quarter 10, target table 47. Upper left: difference between mean flux out-of-transit and in-transit; upper right:mean out-of-transit flux; lower left: mean in-transit flux; lower right: difference between mean flux out-of-transit and in-transit after normalizing by the uncertainty inthe difference for each pixel. The optimal aperture is outlined with a white dash-dotted line in each panel and the target mask is outlined with a solid white line. Symbolkey: x: target position from KIC RA and Dec converted to CCD coordinates via motion polynomials; *: position of nearby KIC objects converted to CCD coordinatesvia motion polynomials; +: PRF-fit location of target from out-of-transit image; triangle: PRF-fit location of transit source from the difference image. CCD row andcolumn coordinates are 0-based. Number of transits = 18; number of valid in-transit cadences = 143; number of in-transit cadence gaps = 2; number of valid out-of-transitcadences = 381; number of out-of-transit cadence gaps = 4.Open ./planet-01/difference-image/005780885-01-difference-image-10-047.fig
44

5 PIXEL LEVEL DIAGNOSTICS Target 5780885 / Planet Candidate 1 / Quarter 10 / Target Table 47
The pixel correlation statistic plot is not available because either the fit for target 5780885, planet candidate 1 failed,or there were no observed transits for this candidate in target table 47.
45

5 PIXEL LEVEL DIAGNOSTICS Target 5780885 / Planet Candidate 1 / Quarter 10 / Target Table 47
PRF Fit of the Difference Image
Offset from the PRF fit to the out of transit imageRow Column Units RA Dec Units
Out of Transit Image Centroid 297.75± 2.59e− 06 835.70± 3.32e− 06 pixels 19.23876575± 6.91e− 10 41.08975260± 7.73e− 09 hours/degreesDifference Image Centroid 297.75± 7.02e− 04 835.70± 9.09e− 04 pixels 19.23876533± 7.80e− 08 41.08975804± 9.08e− 07 hours/degreesOffset −0.0065± 7.02e− 04 −0.0008± 9.09e− 04 pixels −0.0171± 3.18e− 03 0.0196± 3.27e− 03 arcsecondsOffset/σ −9.25 −0.84 −5.38 5.99
Offset Distance 0.0065± 6.92e− 04 pixels 0.0260± 2.75e− 03 arcsecondsOffset Distance/σ 9.45 9.46
Offset from the KIC RA and Dec converted to pixels via motion polynomialsRow Column Units RA Dec Units
KIC Reference Centroid 297.72± 6.18e− 06 835.75± 6.61e− 06 pixels 19.23876800± 0.00e+ 00 41.08981000± 0.00e+ 00 hours/degreesDifference Image Centroid 297.75± 7.02e− 04 835.70± 9.09e− 04 pixels 19.23876533± 7.80e− 08 41.08975804± 9.08e− 07 hours/degreesOffset 0.0234± 7.02e− 04 −0.0491± 9.09e− 04 pixels −0.1085± 3.18e− 03 −0.1871± 3.27e− 03 arcsecondsOffset/σ 33.28 −53.98 −34.18 −57.24
Offset Distance 0.0544± 9.10e− 04 pixels 0.2163± 3.61e− 03 arcsecondsOffset Distance/σ 59.77 59.86
PRF Fit of the Pixel Correlation Image
The pixel correlation image centroid could not be calculated for target 5780885,planet candidate 1, in target table 47.
46

5 PIXEL LEVEL DIAGNOSTICS Target 5780885 / Planet Candidate 1 / Quarter 11 / Target Table 50
Difference image for target 5780885, planet candidate 1, quarter 11, target table 50. Upper left: difference between mean flux out-of-transit and in-transit; upper right:mean out-of-transit flux; lower left: mean in-transit flux; lower right: difference between mean flux out-of-transit and in-transit after normalizing by the uncertainty inthe difference for each pixel. The optimal aperture is outlined with a white dash-dotted line in each panel and the target mask is outlined with a solid white line. Symbolkey: x: target position from KIC RA and Dec converted to CCD coordinates via motion polynomials; *: position of nearby KIC objects converted to CCD coordinatesvia motion polynomials; +: PRF-fit location of target from out-of-transit image; triangle: PRF-fit location of transit source from the difference image. CCD row andcolumn coordinates are 0-based. Number of transits = 14; number of valid in-transit cadences = 112; number of in-transit cadence gaps = 0; number of valid out-of-transitcadences = 295; number of out-of-transit cadence gaps = 4.Open ./planet-01/difference-image/005780885-01-difference-image-11-050.fig
47

5 PIXEL LEVEL DIAGNOSTICS Target 5780885 / Planet Candidate 1 / Quarter 11 / Target Table 50
The pixel correlation statistic plot is not available because either the fit for target 5780885, planet candidate 1 failed,or there were no observed transits for this candidate in target table 50.
48

5 PIXEL LEVEL DIAGNOSTICS Target 5780885 / Planet Candidate 1 / Quarter 11 / Target Table 50
PRF Fit of the Difference Image
Offset from the PRF fit to the out of transit imageRow Column Units RA Dec Units
Out of Transit Image Centroid 293.07± 3.38e− 06 835.62± 3.17e− 06 pixels 19.23876640± 8.81e− 10 41.08973495± 1.16e− 08 hours/degreesDifference Image Centroid 293.06± 9.11e− 04 835.62± 8.65e− 04 pixels 19.23876573± 8.64e− 08 41.08973958± 9.80e− 07 hours/degreesOffset −0.0073± 9.11e− 04 −0.0033± 8.65e− 04 pixels −0.0274± 3.52e− 03 0.0166± 3.53e− 03 arcsecondsOffset/σ −8.06 −3.84 −7.78 4.72
Offset Distance 0.0081± 9.11e− 04 pixels 0.0320± 3.61e− 03 arcsecondsOffset Distance/σ 8.84 8.88
Offset from the KIC RA and Dec converted to pixels via motion polynomialsRow Column Units RA Dec Units
KIC Reference Centroid 293.02± 1.12e− 05 835.68± 6.80e− 06 pixels 19.23876800± 0.00e+ 00 41.08981000± 0.00e+ 00 hours/degreesDifference Image Centroid 293.06± 9.11e− 04 835.62± 8.65e− 04 pixels 19.23876573± 8.64e− 08 41.08973958± 9.80e− 07 hours/degreesOffset 0.0395± 9.11e− 04 −0.0552± 8.65e− 04 pixels −0.0926± 3.52e− 03 −0.2535± 3.53e− 03 arcsecondsOffset/σ 43.31 −63.85 −26.32 −71.89
Offset Distance 0.0679± 8.70e− 04 pixels 0.2699± 3.46e− 03 arcsecondsOffset Distance/σ 77.96 78.01
PRF Fit of the Pixel Correlation Image
The pixel correlation image centroid could not be calculated for target 5780885,planet candidate 1, in target table 50.
49

5 PIXEL LEVEL DIAGNOSTICS Target 5780885 / Planet Candidate 1 / Quarter 12 / Target Table 53
Difference image for target 5780885, planet candidate 1, quarter 12, target table 53. Upper left: difference between mean flux out-of-transit and in-transit; upper right:mean out-of-transit flux; lower left: mean in-transit flux; lower right: difference between mean flux out-of-transit and in-transit after normalizing by the uncertainty inthe difference for each pixel. The optimal aperture is outlined with a white dash-dotted line in each panel and the target mask is outlined with a solid white line. Symbolkey: x: target position from KIC RA and Dec converted to CCD coordinates via motion polynomials; *: position of nearby KIC objects converted to CCD coordinatesvia motion polynomials; +: PRF-fit location of target from out-of-transit image; triangle: PRF-fit location of transit source from the difference image. CCD row andcolumn coordinates are 0-based. Number of transits = 12; number of valid in-transit cadences = 95; number of in-transit cadence gaps = 2; number of valid out-of-transitcadences = 254; number of out-of-transit cadence gaps = 1.Open ./planet-01/difference-image/005780885-01-difference-image-12-053.fig
50

5 PIXEL LEVEL DIAGNOSTICS Target 5780885 / Planet Candidate 1 / Quarter 12 / Target Table 53
The pixel correlation statistic plot is not available because either the fit for target 5780885, planet candidate 1 failed,or there were no observed transits for this candidate in target table 53.
51

5 PIXEL LEVEL DIAGNOSTICS Target 5780885 / Planet Candidate 1 / Quarter 12 / Target Table 53
PRF Fit of the Difference Image
Offset from the PRF fit to the out of transit imageRow Column Units RA Dec Units
Out of Transit Image Centroid 293.63± 2.61e− 06 830.60± 3.22e− 06 pixels 19.23876782± 1.12e− 09 41.08976116± 1.26e− 08 hours/degreesDifference Image Centroid 293.62± 7.26e− 04 830.60± 8.85e− 04 pixels 19.23876681± 7.81e− 08 41.08976591± 9.01e− 07 hours/degreesOffset −0.0093± 7.26e− 04 −0.0060± 8.85e− 04 pixels −0.0408± 3.18e− 03 0.0171± 3.24e− 03 arcsecondsOffset/σ −12.87 −6.83 −12.85 5.27
Offset Distance 0.0111± 7.41e− 04 pixels 0.0443± 2.93e− 03 arcsecondsOffset Distance/σ 15.03 15.10
Offset from the KIC RA and Dec converted to pixels via motion polynomialsRow Column Units RA Dec Units
KIC Reference Centroid 293.59± 1.08e− 05 830.63± 1.13e− 05 pixels 19.23876800± 0.00e+ 00 41.08981000± 0.00e+ 00 hours/degreesDifference Image Centroid 293.62± 7.26e− 04 830.60± 8.85e− 04 pixels 19.23876681± 7.81e− 08 41.08976591± 9.01e− 07 hours/degreesOffset 0.0261± 7.26e− 04 −0.0326± 8.85e− 04 pixels −0.0483± 3.18e− 03 −0.1587± 3.24e− 03 arcsecondsOffset/σ 35.92 −36.79 −15.19 −48.95
Offset Distance 0.0417± 8.61e− 04 pixels 0.1659± 3.42e− 03 arcsecondsOffset Distance/σ 48.47 48.48
PRF Fit of the Pixel Correlation Image
The pixel correlation image centroid could not be calculated for target 5780885,planet candidate 1, in target table 53.
52

6 PLANET CANDIDATE 1 Target 5780885 / Planet Candidate 1
6 Planet Candidate 1
6.1 Model Fitter: All Transits
Model Characteristic Name
Transit Model mandel-agol geometric transit modelLimb Darkening Model claret nonlinear limb darkening model 2011
Parameter Value Uncertainty Units
SNR 1823.5Model Chi Square 6907Degrees of Freedom 7420Transit Epoch 134.2760667 7.1189e-05 BKJDEccentricity 0.0000 0.0000e+00Peri Longitude 0.0000 0.0000e+00 degreesPlanet Radius 11.4003 1.8478e-02 Earth radiiPlanet Radius to Star Radius Ratio 0.0827827 1.3418e-04Semi-major Axis 0.0581 5.1614e-09 AUEquilibrium Temperature 1272 3.0874e+02 KelvinSemi-major Axis to Star Radius Ratio 6.6482 4.7559e-02Impact Parameter 0.5558 9.1520e-03Star Radius 1.2620 0.0000e+00 solar radiiTransit Duration 5.2166 7.7009e-03 hoursTransit Ingress Time 0.5591 8.9825e-03 hoursTransit Depth 7566 7.0074e+00 ppmOrbital Period 4.8854893 6.5077e-07 days
53

6 PLANET CANDIDATE 1 Target 5780885 / Planet Candidate 1
PDC Flux time series for KeplerId 5780885, Planet candidate 1 in the unwhitened domain. For the data of Quarter-01/TargetTableId-020, start BJD is 2454964 and thevertical offset is 0. For the data of Quarter-02/TargetTableId-021, start BJD is 2455002 and the vertical offset is 0.5. For the data of Quarter-03/TargetTableId-026, startBJD is 2455093 and the vertical offset is 1. For the data of Quarter-04/TargetTableId-029, start BJD is 2455184 and the vertical offset is 1.5.Open ./planet-01/planet-search-and-model-fitting-results/all-transits-fit/005780885-01-all-unwhitened-01-020.fig
54

6 PLANET CANDIDATE 1 Target 5780885 / Planet Candidate 1
PDC Flux time series for KeplerId 5780885, Planet candidate 1 in the unwhitened domain. For the data of Quarter-05/TargetTableId-032, start BJD is 2455276 and thevertical offset is 0. For the data of Quarter-06/TargetTableId-035, start BJD is 2455372 and the vertical offset is 0.5. For the data of Quarter-07/TargetTableId-038, startBJD is 2455463 and the vertical offset is 1. For the data of Quarter-08/TargetTableId-041, start BJD is 2455568 and the vertical offset is 1.5.Open ./planet-01/planet-search-and-model-fitting-results/all-transits-fit/005780885-01-all-unwhitened-05-032.fig
55

6 PLANET CANDIDATE 1 Target 5780885 / Planet Candidate 1
PDC Flux time series for KeplerId 5780885, Planet candidate 1 in the unwhitened domain. For the data of Quarter-09/TargetTableId-044, start BJD is 2455641 and thevertical offset is 0. For the data of Quarter-10/TargetTableId-047, start BJD is 2455739 and the vertical offset is 0.5. For the data of Quarter-11/TargetTableId-050, startBJD is 2455834 and the vertical offset is 1. For the data of Quarter-12/TargetTableId-053, start BJD is 2455932 and the vertical offset is 1.5.Open ./planet-01/planet-search-and-model-fitting-results/all-transits-fit/005780885-01-all-unwhitened-09-044.fig
56

6 PLANET CANDIDATE 1 Target 5780885 / Planet Candidate 1
PDC Flux time series for KeplerId 5780885, Planet candidate 1 in the unwhitened domain, zoomed on last 5 transits in the unit of work. If # of transits is smaller than5, all transits are shown.Open ./planet-01/planet-search-and-model-fitting-results/all-transits-fit/005780885-01-all-unwhitened-zoomed.fig
PDC Flux time series for KeplerId 5780885, Planet candidate 1 in the unwhitened domain. Data has been high-pass filtered via a median filter operating at the geometricmean of the transit duration and the orbital period, folded per the fitted period and epoch, and zoomed to the location of the model transit.Open ./planet-01/planet-search-and-model-fitting-results/all-transits-fit/005780885-01-all-unwhitened-filtered-zoomed.fig
57

6 PLANET CANDIDATE 1 Target 5780885 / Planet Candidate 1
Folded flux time series for KeplerId 5780885, Planet candidate 1 in the whitened domain. Values are averaged into 1 cadence wide bins. Blue diamonds represent theoriginal data; the red line represents the fit; the green squares are the residuals (data - fit), vertically offset for clarity.Open ./planet-01/planet-search-and-model-fitting-results/all-transits-fit/005780885-01-all-whitened.fig
Folded flux time series for KeplerId 5780885, Planet candidate 1 in the whitened domain, zoomed on the transit. Values are averaged into 1 cadence wide bins. Bluediamonds represent the original data; the red line represents the fit; the green squares are the residuals (data - fit), vertically offset for clarity. Magenta circles are theoriginal data but with a phase shift of 0.5 relative to the blue diamonds, vertically offset for clarity.Open ./planet-01/planet-search-and-model-fitting-results/all-transits-fit/005780885-01-all-whitened-zoomed.fig
58

6 PLANET CANDIDATE 1 Target 5780885 / Planet Candidate 1
6.2 Model Fitter: Reduced Parameter Fit Results
Reduced parameter fits not enabled.
59

6 PLANET CANDIDATE 1 Target 5780885 / Planet Candidate 1
6.3 Validation Tests
The Centroid Test and Eclipsing Binary Discrimination Test are chi-squared hypothesis tests. For these tests, a significance of 100% favors a planet, while 0% indicatesan unlikely planet.
6.3.1 Flux-Weighted Centroid Test
Result Value Uncertainty Units Value in Sigmas Significance (%)
Stellar Magnitude 12.8850Motion Detection Statistic 1.8358e+02 0.00Peak RA Offset 2.2593e-05 1.3278e-05 arcseconds 1.7016Peak Dec Offset -2.8371e-06 1.3102e-05 arcseconds -0.2165Source RA Offset -2.9636e-03 4.0231e-04 arcseconds -7.3665Source Dec Offset 3.7216e-04 2.8668e-04 arcseconds 1.2982Source RA 19.23876774 1.1185e-07 hoursSource Dec 41.08976170 1.1957e-06 degrees
Offsets are relative to the out-of-transit centroid.
6.3.2 Eclipsing Binary Discrimination Test
Result Value Value in Sigmas Significance (%)
Odd Even Transit Depth Comparison Statistic 6.7503e-05 0.0082 99.34Odd Even Transit Epoch Comparison Statistic 2.4930e-07 0.0005 99.96
6.3.3 Bootstrap Test
No bootstrap results available.
60

6 PLANET CANDIDATE 1 Target 5780885 / Planet Candidate 1
KeplerId 5780885, KeplerMag 12.89 - FOLDED FLUX AND CENTROIDS - This figure shows detrended flux and centroid data folded at the fitted orbital period andcentered on the fitted transit over a few fitted transit durations. The top panel shows the change in corrected flux for this target, normalized to the median out of transitvalue, median detrended with the median out of transit value removed. The bottom two panels show the corresponding change in the centroid in right ascension (RA)and declination (DEC) angles on the sky. The centroids are detrended against ancillary data and have the mean out-of-transit value removed. The scaled transit modelfit to the target flux is shown on the centroid plots in red. The peak fitted offset from the out-of-transit centroid is indicated by the solid black horizontal line. One sigmaerror bars are indicated with dashed black horizontal lines. In-transit data points for any other planets identified for this target have been gapped. The out-of-transitmean and standard deviation (SD) indicated in the lower left-hand corner are robust estimates.Open ./planet-01/centroid-test-results/005780885-01-folded-transit-fit-fluxWeighted-centroids.fig
61

6 PLANET CANDIDATE 1 Target 5780885 / Planet Candidate 1
KeplerId 5780885, KeplerMag 12.89 - UNFOLDED FLUX AND CENTROIDS - This figure shows detrended flux and centroid data over the full time range of the dataset. The top panel shows the change in corrected flux for this target, normalized to the median out of transit value, median detrended with the median out of transitvalue removed. The bottom two panels show the corresponding change in the centroid in right ascension (RA) and declination (DEC) angles on the sky. The centroidsare detrended against ancillary data and have the mean out-of-transit value removed. The scaled transit model fit to the target flux is shown on the centroid plots in red.The peak fitted offset from the out of transit centroid is indicated by the solid black horizontal line. One sigma error bars are indicated with dashed black horizontallines. Red diamonds and vertical dotted lines mark the fitted transit centers. In-transit data points for any other planets identified for this target have been gapped. Theout-of-transit mean and standard deviation (SD) indicated in the lower left-hand corner are robust estimates.Open ./planet-01/centroid-test-results/005780885-01-transit-fit-fluxWeighted-centroids-01.fig
62
6 PLANET CANDIDATE 1 Target 5780885 / Planet Candidate 1
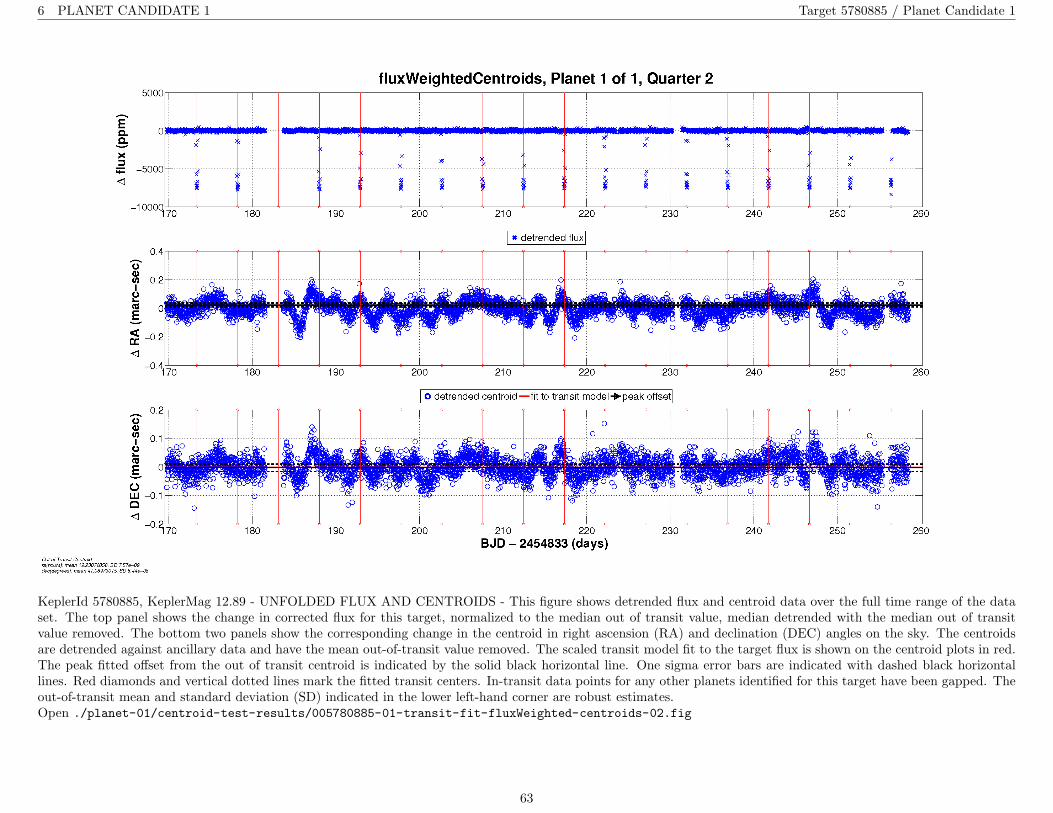
KeplerId 5780885, KeplerMag 12.89 - UNFOLDED FLUX AND CENTROIDS - This figure shows detrended flux and centroid data over the full time range of the dataset. The top panel shows the change in corrected flux for this target, normalized to the median out of transit value, median detrended with the median out of transitvalue removed. The bottom two panels show the corresponding change in the centroid in right ascension (RA) and declination (DEC) angles on the sky. The centroidsare detrended against ancillary data and have the mean out-of-transit value removed. The scaled transit model fit to the target flux is shown on the centroid plots in red.The peak fitted offset from the out of transit centroid is indicated by the solid black horizontal line. One sigma error bars are indicated with dashed black horizontallines. Red diamonds and vertical dotted lines mark the fitted transit centers. In-transit data points for any other planets identified for this target have been gapped. Theout-of-transit mean and standard deviation (SD) indicated in the lower left-hand corner are robust estimates.Open ./planet-01/centroid-test-results/005780885-01-transit-fit-fluxWeighted-centroids-02.fig
63

6 PLANET CANDIDATE 1 Target 5780885 / Planet Candidate 1
KeplerId 5780885, KeplerMag 12.89 - UNFOLDED FLUX AND CENTROIDS - This figure shows detrended flux and centroid data over the full time range of the dataset. The top panel shows the change in corrected flux for this target, normalized to the median out of transit value, median detrended with the median out of transitvalue removed. The bottom two panels show the corresponding change in the centroid in right ascension (RA) and declination (DEC) angles on the sky. The centroidsare detrended against ancillary data and have the mean out-of-transit value removed. The scaled transit model fit to the target flux is shown on the centroid plots in red.The peak fitted offset from the out of transit centroid is indicated by the solid black horizontal line. One sigma error bars are indicated with dashed black horizontallines. Red diamonds and vertical dotted lines mark the fitted transit centers. In-transit data points for any other planets identified for this target have been gapped. Theout-of-transit mean and standard deviation (SD) indicated in the lower left-hand corner are robust estimates.Open ./planet-01/centroid-test-results/005780885-01-transit-fit-fluxWeighted-centroids-03.fig
64

6 PLANET CANDIDATE 1 Target 5780885 / Planet Candidate 1
KeplerId 5780885, KeplerMag 12.89 - UNFOLDED FLUX AND CENTROIDS - This figure shows detrended flux and centroid data over the full time range of the dataset. The top panel shows the change in corrected flux for this target, normalized to the median out of transit value, median detrended with the median out of transitvalue removed. The bottom two panels show the corresponding change in the centroid in right ascension (RA) and declination (DEC) angles on the sky. The centroidsare detrended against ancillary data and have the mean out-of-transit value removed. The scaled transit model fit to the target flux is shown on the centroid plots in red.The peak fitted offset from the out of transit centroid is indicated by the solid black horizontal line. One sigma error bars are indicated with dashed black horizontallines. Red diamonds and vertical dotted lines mark the fitted transit centers. In-transit data points for any other planets identified for this target have been gapped. Theout-of-transit mean and standard deviation (SD) indicated in the lower left-hand corner are robust estimates.Open ./planet-01/centroid-test-results/005780885-01-transit-fit-fluxWeighted-centroids-04.fig
65

6 PLANET CANDIDATE 1 Target 5780885 / Planet Candidate 1
KeplerId 5780885, KeplerMag 12.89 - UNFOLDED FLUX AND CENTROIDS - This figure shows detrended flux and centroid data over the full time range of the dataset. The top panel shows the change in corrected flux for this target, normalized to the median out of transit value, median detrended with the median out of transitvalue removed. The bottom two panels show the corresponding change in the centroid in right ascension (RA) and declination (DEC) angles on the sky. The centroidsare detrended against ancillary data and have the mean out-of-transit value removed. The scaled transit model fit to the target flux is shown on the centroid plots in red.The peak fitted offset from the out of transit centroid is indicated by the solid black horizontal line. One sigma error bars are indicated with dashed black horizontallines. Red diamonds and vertical dotted lines mark the fitted transit centers. In-transit data points for any other planets identified for this target have been gapped. Theout-of-transit mean and standard deviation (SD) indicated in the lower left-hand corner are robust estimates.Open ./planet-01/centroid-test-results/005780885-01-transit-fit-fluxWeighted-centroids-05.fig
66

6 PLANET CANDIDATE 1 Target 5780885 / Planet Candidate 1
KeplerId 5780885, KeplerMag 12.89 - UNFOLDED FLUX AND CENTROIDS - This figure shows detrended flux and centroid data over the full time range of the dataset. The top panel shows the change in corrected flux for this target, normalized to the median out of transit value, median detrended with the median out of transitvalue removed. The bottom two panels show the corresponding change in the centroid in right ascension (RA) and declination (DEC) angles on the sky. The centroidsare detrended against ancillary data and have the mean out-of-transit value removed. The scaled transit model fit to the target flux is shown on the centroid plots in red.The peak fitted offset from the out of transit centroid is indicated by the solid black horizontal line. One sigma error bars are indicated with dashed black horizontallines. Red diamonds and vertical dotted lines mark the fitted transit centers. In-transit data points for any other planets identified for this target have been gapped. Theout-of-transit mean and standard deviation (SD) indicated in the lower left-hand corner are robust estimates.Open ./planet-01/centroid-test-results/005780885-01-transit-fit-fluxWeighted-centroids-06.fig
67

6 PLANET CANDIDATE 1 Target 5780885 / Planet Candidate 1
KeplerId 5780885, KeplerMag 12.89 - UNFOLDED FLUX AND CENTROIDS - This figure shows detrended flux and centroid data over the full time range of the dataset. The top panel shows the change in corrected flux for this target, normalized to the median out of transit value, median detrended with the median out of transitvalue removed. The bottom two panels show the corresponding change in the centroid in right ascension (RA) and declination (DEC) angles on the sky. The centroidsare detrended against ancillary data and have the mean out-of-transit value removed. The scaled transit model fit to the target flux is shown on the centroid plots in red.The peak fitted offset from the out of transit centroid is indicated by the solid black horizontal line. One sigma error bars are indicated with dashed black horizontallines. Red diamonds and vertical dotted lines mark the fitted transit centers. In-transit data points for any other planets identified for this target have been gapped. Theout-of-transit mean and standard deviation (SD) indicated in the lower left-hand corner are robust estimates.Open ./planet-01/centroid-test-results/005780885-01-transit-fit-fluxWeighted-centroids-07.fig
68

6 PLANET CANDIDATE 1 Target 5780885 / Planet Candidate 1
KeplerId 5780885, KeplerMag 12.89 - UNFOLDED FLUX AND CENTROIDS - This figure shows detrended flux and centroid data over the full time range of the dataset. The top panel shows the change in corrected flux for this target, normalized to the median out of transit value, median detrended with the median out of transitvalue removed. The bottom two panels show the corresponding change in the centroid in right ascension (RA) and declination (DEC) angles on the sky. The centroidsare detrended against ancillary data and have the mean out-of-transit value removed. The scaled transit model fit to the target flux is shown on the centroid plots in red.The peak fitted offset from the out of transit centroid is indicated by the solid black horizontal line. One sigma error bars are indicated with dashed black horizontallines. Red diamonds and vertical dotted lines mark the fitted transit centers. In-transit data points for any other planets identified for this target have been gapped. Theout-of-transit mean and standard deviation (SD) indicated in the lower left-hand corner are robust estimates.Open ./planet-01/centroid-test-results/005780885-01-transit-fit-fluxWeighted-centroids-08.fig
69

6 PLANET CANDIDATE 1 Target 5780885 / Planet Candidate 1
KeplerId 5780885, KeplerMag 12.89 - UNFOLDED FLUX AND CENTROIDS - This figure shows detrended flux and centroid data over the full time range of the dataset. The top panel shows the change in corrected flux for this target, normalized to the median out of transit value, median detrended with the median out of transitvalue removed. The bottom two panels show the corresponding change in the centroid in right ascension (RA) and declination (DEC) angles on the sky. The centroidsare detrended against ancillary data and have the mean out-of-transit value removed. The scaled transit model fit to the target flux is shown on the centroid plots in red.The peak fitted offset from the out of transit centroid is indicated by the solid black horizontal line. One sigma error bars are indicated with dashed black horizontallines. Red diamonds and vertical dotted lines mark the fitted transit centers. In-transit data points for any other planets identified for this target have been gapped. Theout-of-transit mean and standard deviation (SD) indicated in the lower left-hand corner are robust estimates.Open ./planet-01/centroid-test-results/005780885-01-transit-fit-fluxWeighted-centroids-09.fig
70

6 PLANET CANDIDATE 1 Target 5780885 / Planet Candidate 1
KeplerId 5780885, KeplerMag 12.89 - UNFOLDED FLUX AND CENTROIDS - This figure shows detrended flux and centroid data over the full time range of the dataset. The top panel shows the change in corrected flux for this target, normalized to the median out of transit value, median detrended with the median out of transitvalue removed. The bottom two panels show the corresponding change in the centroid in right ascension (RA) and declination (DEC) angles on the sky. The centroidsare detrended against ancillary data and have the mean out-of-transit value removed. The scaled transit model fit to the target flux is shown on the centroid plots in red.The peak fitted offset from the out of transit centroid is indicated by the solid black horizontal line. One sigma error bars are indicated with dashed black horizontallines. Red diamonds and vertical dotted lines mark the fitted transit centers. In-transit data points for any other planets identified for this target have been gapped. Theout-of-transit mean and standard deviation (SD) indicated in the lower left-hand corner are robust estimates.Open ./planet-01/centroid-test-results/005780885-01-transit-fit-fluxWeighted-centroids-10.fig
71

6 PLANET CANDIDATE 1 Target 5780885 / Planet Candidate 1
KeplerId 5780885, KeplerMag 12.89 - UNFOLDED FLUX AND CENTROIDS - This figure shows detrended flux and centroid data over the full time range of the dataset. The top panel shows the change in corrected flux for this target, normalized to the median out of transit value, median detrended with the median out of transitvalue removed. The bottom two panels show the corresponding change in the centroid in right ascension (RA) and declination (DEC) angles on the sky. The centroidsare detrended against ancillary data and have the mean out-of-transit value removed. The scaled transit model fit to the target flux is shown on the centroid plots in red.The peak fitted offset from the out of transit centroid is indicated by the solid black horizontal line. One sigma error bars are indicated with dashed black horizontallines. Red diamonds and vertical dotted lines mark the fitted transit centers. In-transit data points for any other planets identified for this target have been gapped. Theout-of-transit mean and standard deviation (SD) indicated in the lower left-hand corner are robust estimates.Open ./planet-01/centroid-test-results/005780885-01-transit-fit-fluxWeighted-centroids-11.fig
72

6 PLANET CANDIDATE 1 Target 5780885 / Planet Candidate 1
KeplerId 5780885, KeplerMag 12.89 - UNFOLDED FLUX AND CENTROIDS - This figure shows detrended flux and centroid data over the full time range of the dataset. The top panel shows the change in corrected flux for this target, normalized to the median out of transit value, median detrended with the median out of transitvalue removed. The bottom two panels show the corresponding change in the centroid in right ascension (RA) and declination (DEC) angles on the sky. The centroidsare detrended against ancillary data and have the mean out-of-transit value removed. The scaled transit model fit to the target flux is shown on the centroid plots in red.The peak fitted offset from the out of transit centroid is indicated by the solid black horizontal line. One sigma error bars are indicated with dashed black horizontallines. Red diamonds and vertical dotted lines mark the fitted transit centers. In-transit data points for any other planets identified for this target have been gapped. Theout-of-transit mean and standard deviation (SD) indicated in the lower left-hand corner are robust estimates.Open ./planet-01/centroid-test-results/005780885-01-transit-fit-fluxWeighted-centroids-12.fig
73

6 PLANET CANDIDATE 1 Target 5780885 / Planet Candidate 1
No figures named 005780885-01-bootstrap-false-alarm.fig are available.
74

APPENDIX A: PLANET CANDIDATE 1 Target 5780885 / Planet Candidate 1
Appendix A Planet Candidate 1
A.1 Model Fitter: All Transits
Robust weights distribution for KeplerId 5780885, Planet candidate 1. Top plot: all data points. Middle plot: all data points, folded per the fitted period and epoch.Bottom plot: all data points, folded and zoomed.Open ./planet-01/planet-search-and-model-fitting-results/all-transits-fit/005780885-01-all-robust-weights.fig
75

APPENDIX A: PLANET CANDIDATE 1 Target 5780885 / Planet Candidate 1
Fit residuals distribution for KeplerId 5780885, Planet candidate 1. Only the valid data points used to constrain the fit are shown here. A Gaussian fit to the histogramis shown in red.Open ./planet-01/planet-search-and-model-fitting-results/all-transits-fit/005780885-01-all-histo-used.fig
Fit residuals distribution for KeplerId 5780885, Planet candidate 1. Top plot: all valid data. Bottom plot: valid data not used to constrain fit (due to distance from atransit). Gaussian fits to the histograms are shown in red.Open ./planet-01/planet-search-and-model-fitting-results/all-transits-fit/005780885-01-all-histo-all-and-unused.fig
76

APPENDIX A: PLANET CANDIDATE 1 Target 5780885 / Planet Candidate 1
A.2 Model Fitter: Odd & Even Transits
Parameter Odd Transits Odd Transits Even Transits Even Transits Units Difference‖Uncertainty‖Value Uncertainty Value Uncertainty
SNR 1293.6 1289.8Model Chi Square 5415 5415Degrees of Freedom 5774 5774Transit Epoch 134.2759865 2.0643e-04 139.1615846 2.1010e-04 BKJD 3.6928e-01Eccentricity 0.0000 0.0000e+00 0.0000 0.0000e+00Peri Longitude 0.0000 0.0000e+00 0.0000 0.0000e+00 degreesPlanet Radius 11.3833 5.5262e-02 11.4096 5.4057e-02 Earth radii 3.4029e-01Planet Radius to Star Radius Ratio 0.0826597 4.0129e-04 0.0828507 3.9253e-04 3.4029e-01Semi-major Axis 0.0581 1.4896e-08 0.0581 1.5440e-08 AU 3.0551e-01Equilibrium Temperature 1272 3.0874e+02 1272 3.0874e+02 Kelvin 1.6430e-07Semi-major Axis to Star Radius Ratio 6.6998 1.4377e-01 6.6225 1.3834e-01 3.8716e-01Impact Parameter 0.5458 2.8398e-02 0.5606 2.6291e-02 3.8170e-01Star Radius 1.2620 0.0000e+00 1.2620 0.0000e+00 solar radiiTransit Duration 5.2087 2.2699e-02 5.2212 2.2711e-02 hours 3.9014e-01Transit Ingress Time 0.5495 2.6483e-02 0.5638 2.6452e-02 hours 3.8192e-01Transit Depth 7567 2.0700e+01 7566 2.0678e+01 ppm 3.0050e-02Orbital Period 4.8854900 1.8782e-06 4.8854892 1.9468e-06 days 3.0551e-01
77

APPENDIX A: PLANET CANDIDATE 1 Target 5780885 / Planet Candidate 1
PDC Flux time series for KeplerId 5780885, Planet candidate 1 in the unwhitened domain. For the data of Quarter-01/TargetTableId-020, start BJD is 2454964 and thevertical offset is 0. For the data of Quarter-02/TargetTableId-021, start BJD is 2455002 and the vertical offset is 0.5. For the data of Quarter-03/TargetTableId-026, startBJD is 2455093 and the vertical offset is 1. For the data of Quarter-04/TargetTableId-029, start BJD is 2455184 and the vertical offset is 1.5.Open ./planet-01/planet-search-and-model-fitting-results/odd-even-transits-fit/005780885-01-odd-even-unwhitened-01-020.fig
78

APPENDIX A: PLANET CANDIDATE 1 Target 5780885 / Planet Candidate 1
PDC Flux time series for KeplerId 5780885, Planet candidate 1 in the unwhitened domain. For the data of Quarter-05/TargetTableId-032, start BJD is 2455276 and thevertical offset is 0. For the data of Quarter-06/TargetTableId-035, start BJD is 2455372 and the vertical offset is 0.5. For the data of Quarter-07/TargetTableId-038, startBJD is 2455463 and the vertical offset is 1. For the data of Quarter-08/TargetTableId-041, start BJD is 2455568 and the vertical offset is 1.5.Open ./planet-01/planet-search-and-model-fitting-results/odd-even-transits-fit/005780885-01-odd-even-unwhitened-05-032.fig
79

APPENDIX A: PLANET CANDIDATE 1 Target 5780885 / Planet Candidate 1
PDC Flux time series for KeplerId 5780885, Planet candidate 1 in the unwhitened domain. For the data of Quarter-09/TargetTableId-044, start BJD is 2455641 and thevertical offset is 0. For the data of Quarter-10/TargetTableId-047, start BJD is 2455739 and the vertical offset is 0.5. For the data of Quarter-11/TargetTableId-050, startBJD is 2455834 and the vertical offset is 1. For the data of Quarter-12/TargetTableId-053, start BJD is 2455932 and the vertical offset is 1.5.Open ./planet-01/planet-search-and-model-fitting-results/odd-even-transits-fit/005780885-01-odd-even-unwhitened-09-044.fig
80

APPENDIX A: PLANET CANDIDATE 1 Target 5780885 / Planet Candidate 1
PDC Flux time series for KeplerId 5780885, Planet candidate 1 in the unwhitened domain, zoomed on last 5 transits in the unit of work. If # of transits is smaller than5, all transits are shown.Open ./planet-01/planet-search-and-model-fitting-results/odd-even-transits-fit/005780885-01-odd-even-unwhitened-zoomed.fig
PDC Flux time series for KeplerId 5780885, Planet candidate 1 in the unwhitened domain. Data has been high-pass filtered via a median filter operating at the geometricmean of the transit duration and the orbital period, folded per the fitted period and epoch, and zoomed to the location of the model transit.Open ./planet-01/planet-search-and-model-fitting-results/odd-even-transits-fit/005780885-01-odd-even-unwhitened-filtered-zoomed.fig
81

APPENDIX A: PLANET CANDIDATE 1 Target 5780885 / Planet Candidate 1
Folded flux time series for KeplerId 5780885, Planet candidate 1 in the whitened domain. Values are averaged into 1 cadence wide bins. Blue diamonds represent theoriginal data; the red line represents the fit; the green squares are the residuals (data - fit), vertically offset for clarity.Open ./planet-01/planet-search-and-model-fitting-results/odd-even-transits-fit/005780885-01-odd-even-whitened.fig
Folded flux time series for KeplerId 5780885, Planet candidate 1 in the whitened domain, zoomed on the transit. Values are averaged into 1 cadence wide bins. Bluediamonds represent the original data; the red line represents the fit; the green squares are the residuals (data - fit), vertically offset for clarity. Magenta circles are theoriginal data but with a phase shift of 0.5 relative to the blue diamonds, vertically offset for clarity.Open ./planet-01/planet-search-and-model-fitting-results/odd-even-transits-fit/005780885-01-odd-even-whitened-zoomed.fig
82

APPENDIX A: PLANET CANDIDATE 1 Target 5780885 / Planet Candidate 1
Robust weights distribution for KeplerId 5780885, Planet candidate 1. Top plot: all data points. Middle plot: all data points, folded per the fitted period and epoch.Bottom plot: all data points, folded and zoomed.Open ./planet-01/planet-search-and-model-fitting-results/odd-even-transits-fit/005780885-01-odd-even-robust-weights.fig
83

APPENDIX A: PLANET CANDIDATE 1 Target 5780885 / Planet Candidate 1
Fit residuals distribution for KeplerId 5780885, Planet candidate 1. Only the valid data points used to constrain the fit are shown here. A Gaussian fit to the histogramis shown in red.Open ./planet-01/planet-search-and-model-fitting-results/odd-even-transits-fit/005780885-01-odd-even-histo-used.fig
Fit residuals distribution for KeplerId 5780885, Planet candidate 1. Top plot: all valid data. Bottom plot: valid data not used to constrain fit (due to distance from atransit). Gaussian fits to the histograms are shown in red.Open ./planet-01/planet-search-and-model-fitting-results/odd-even-transits-fit/005780885-01-odd-even-histo-all-and-unused.fig
84

APPENDIX A: PLANET CANDIDATE 1 Target 5780885 / Planet Candidate 1
A.3 Eclipsing Binary Discrimination Test
Top-left: Diagnostic plot of Odd/Even Transit Depth Test for keplerId 5780885, planet 1. A significance level close to 1/0 favors a transiting planet/an eclipsing binary.Top-right: Diagnostic plot of Odd/Even Transit Epoch Test for keplerId 5780885, planet 1. A significance level close to 1/0 favors a transiting planet/an eclipsing binary.Open ./planet-01/binary-discrimination-test-results/005780885-01-eclipsing-binary-discrimination-tests.fig
85

APPENDIX B: SINGLE EVENT STATISTICS FROM RESIDUAL FLUX Target 5780885
Appendix B Single Event Statistics from Residual Flux
No figures named 005780885-00-residual-ses-*.fig are available.
86

APPENDIX C: ALERTS Target 5780885
Appendix C Alerts
Time Severity Message
56230.5338 warning Multi-quarter PRF fitting and offset analysis will not be performed because model fit SNR is above specified threshold (target=1,keplerId=5780885, planet=1, component=generateDvDifferenceImages)
56230.5474 warning Pixel correlation test is disabled (target=1, keplerId=5780885, component=Pixel correlation test)56230.5475 warning Statistical bootstrap is disabled (target=1, keplerId=5780885, component=bootstrap)
87