For All Generations
76
For All Generations Government Pension Investment Fund ESG REPORT 2020
Transcript of For All Generations

For All Generations
Government Pension Investment Fund
ESG REPORT2020

P.3 About GPIF
P.5 Ensuring Pension Stability
P.7 What is ESG?
P.9 Message from Our President
P.3 P.11IntroductionChapter 1GPIF’s ESG Initiatives
P.11 Activity Highlights
P.13 ESG-Related Governance and Organizational Frameworks
P.15 ESG Initiatives Within GPIF
P.17 Support for TCFD and Climate-Related Financial Disclosures
P.19 ESG Index Selection and ESG Index-Based Asset Management
P.21 ESG in External Equity and Fixed Income Management
P.23 Stewardship Activities and ESG Promotion
P.27 Column: Empirical Analysis of Engagement Effectiveness
P.29 Engagement with Index Providers and ESG ratings agencies
P.35 ESG in Alternative Asset Management
P.37 Collaboration with Overseas Public Pension Funds and Other Institutions
P.39 Review of ESG Activities and Future Outlook
P.40 Column: Global Approaches to Climate Change and Actions Taken by Japanese Companies
Contents
GPIF ESG REPORT 202001

GPIF is committed to fulfilling our fiduciary duty to secure adequate
retirement funds for both current and future beneficiaries.
We believe that improving the governance of the companies that
we invest in while minimizing negative environmental and social
externalities – that is, ESG (environmental, social and governance)
integration – is vital in ensuring the profitability of the portfolio over
the long term.
For All Generations
P.41 Chapter 2Measuring the Impacts of ESG Activities
P.41 ESG Index Performance
P.43 Portfolio ESG Rating
P.45 ESG Rating Ranking by Country
P.46 Column: Corporate Governance and Corporate Behavior of Japanese Companies
P.47 Gender Diversity in Japanese Companies
P.49P.49 Disclosure and Analysis of Climate-Related Financial Information: Composition and Key Points
P.51 Analysis of Portfolio Greenhouse Gas Emissions
P.55 Analysis of Equity and Corporate Bond Portfolio Using Climate Value-at-Risk, etc.
P.61 Greenhouse Gas Emission and Climate Value-at-Risk Analysis of Government Bond Portfolio
P.63 Analysis of Real Estate Portfolio Using Climate Value-at-Risk
P.65 Analysis of Inter-Industry Transfer of Transition Risks and Opportunities
P.69 Analysis of Revenue Opportunities through Contributions to SDGs
P.71 Editor’s Note
Chapter 3 Evaluation and Analysis of Climate Change Risks and Opportunities
GPIF ESG REPORT 2020 02

Introduction: Government Pension Investment Fund
About GPIF
Japan adopts a “pay-as-you-go” pension system in which
contributions from the current working generation are used to pay the
pensions of elder generations. As such, with the birth rate declining
and the population aging at a rapid pace, in order to avoid an unduly
heavy burden being placed on future generations, pension
contributions not immediately applied to the payment of benefits are
accumulated as pension reserves and placed under fiscal
management so that these payments can continue to be made into
the future.
GPIF invests this reserve in Japanese and overseas capital
markets. Both returns on the reserve and the reserve itself will be
used to supplement pension payments to future generations as part
of a 100-year fiscal plan. For this reason, even if a valuation gain or
loss occurs in a particular year, pension payments for the following
year will not be affected.
Pension System in Japan1
(Note) The above diagram is for illustrative purposes; please refer to the Ministry of Health, Labour and Welfare website for details on the public pension system.
Decline in current working
generation
Decline in current working
generation
Government contribution
Government contribution
Government contribution
Pension premium
s
Pension premium
s
Pension premium
s
Covers deficit
50 years later
Surplus
Present
Covers deficit
100 years later
100%
0%
Pension payment sources
Long-term plan
Role of the reserve (conceptual diagram)
PensionReserve
Secure funds through investment
returns
Pension benefits
Pension benefits
Pensionpremiums
Pensionpremiums
Pay-as-you-go system
Japan adopts a system where the current working
generation supports the livelihoods of the elderly.
Current recipient
generation
Current working
generation
Future working
generation
Payment
Payment
Government Pension Investment Fund (GPIF) manages and invests Japan’s pension reserve fund, which is used
to pay Employee Pension Insurance and National Pensions. We contribute to the stability of the pension system
by earning returns on our investments and distributing these to the government.
GPIF ESG REPORT 202003

Diversified, International Investment Over the Long-Term2GPIF manages the pension reserve through a combination of long-term
and diversified investments with the aim of stable returns. Investment
returns fluctuate on a daily basis due to a variety of factors, but in
general, short-term oscillations even out as the investment period
grows, resulting in more stable returns on an annualized basis. In
addition, the market value of the assets under management fluctuates
depending on economic conditions, foreign exchange rates, and other
factors. For this reason, with assets under management of
approximately ¥186 trillion as of March 31, 2021, we invest not in a
single asset class but in a broad, diverse range of assets, including
equities, bonds, and alternative investments both in Japan and
overseas. We expect such diversified investment to generate profits
from economic activities all around the world and reduce the possibility
of major losses.
Integrating ESG (Environmental, Social and Governance) into the Investment Process3GPIF promotes ESG integration throughout all of our investment processes
in line with our Investment Principles, which state that “sustainable growth
of investee companies and the capital market as a whole are vital in
enhancing long-term investment returns.” Of these investments, the assets
under management tracking ESG indexes, which can be described as ESG
investments in a narrow sense, total approximately ¥10.6 trillion, and
investment in green, social and sustainability bonds issued by multilateral
development banks is currently at approximately ¥1.1 trillion.
GPIF’s ESG activities (investments)
¥10.6 trillion ¥1.1 trillion¥186 trillion
ESG integration(all assets)
A+Rating by PRI (strategy and governance)
Universal owner Cross-generational investor
GPIF in numbers
Number of GPIF-owned
issues
Playing a role in pension finance with an
investment time horizon of over 100 years
100 years
Investment time horizon
World’s largest pension fund
¥186 trillion Asset size
¥
Assets under management tracking ESG indexes¥
Investments in green bonds, etc.¥
5,702 stocks
14,829 bonds
GPIF ESG REPORT 2020 04

Introduction: GPIF’s Mission
Ensuring Pension Stability
Our Mission
Our Conviction
We firmly believe that enhancing the sustainability of financial markets as a whole
through ESG activities will help stabilize the pension system to the ultimate advantage
of all beneficiaries.
We are committed to continue promoting ESG in order to reduce the negative
impact of environmental and social problems on financial markets, and thus
encourage sustainable economic growth and improve long-term returns from all the
assets we manage.
Our mission at GPIF is to contribute to the stability of the national pension system by
managing and investing the pension reserves entrusted to us by all beneficiaries.
To fulfill its role of contributing to stable pension finance, GPIF has been given an
investment return target of 1.7% above wage growth by the Minister of Health, Labour
and Welfare. We began managing assets as we are today in fiscal 2001, and since then,
we have recorded a cumulative return rate of +3.61% (annualized) and total returns of
¥95.3 trillion as of the end of fiscal 2020.
Pension reserves managed by GPIF are used to prevent the burden on future
generations from becoming too excessive.
GPIF ESG REPORT 202005

Pension reserves
Pension reserves are managed based on legislation that includes the Employees'
Pension Insurance Act, National Pension Act, and the Act on the Government
Pension Investment Fund, Independent Administrative Agency. These laws require
GPIF to invest these reserves safely and efficiently from a long-term perspective
and for the sole benefit of pension recipients.
In addition, GPIF conducts its business operations in accordance with medium-
term targets set by the Minister of Health, Labour and Welfare. GPIF’s 4th Medium-
term Plan (FY2020–FY2024), which it established in response to those medium-
term targets, states that GPIF will promote investments that are conscious of
non-financial factors, namely ESG, while being mindful of the Pension Reserve
Basic Policy.
In 2020, the Basic Policy of Pension Reserves that GPIF follows was revised to
require that the fund, from the perspective of securing long-term returns for the
benefit of pension recipients, consider different activities to promote investments
integrating non-financial factors, namely ESG (environmental, social and
governance) in addition to financial factors, and take the necessary actions to
implement these. GPIF is committed to promoting ESG investment based on the
Basic Policy and the Medium-term Plan.
Cumulative returns
¥ trillion100
(20)
(10)
0
10
20
30
40
50
60
70
80
90
2001 20202019(fiscal year)
2002 2003 2004 2005 2006 2007 2008 2009 2010 2011 2012 2013 2014 2015 2016 20182017
Returns
+¥95.3trillion(cumulative)
Assets under management
¥186.2trillion
As of the end of March 2021
Cumulative returns since fiscal 2001
GPIF ESG REPORT 2020 06

Introduction: Why Does GPIF Focus on ESG?
What is ESG?ESG is the acronym for Environmental, Social, and Governance. While investors have traditionally used cash flows,
profit margins and other quantitative financial data to value a company’s equity or other securities, “ESG investment”
also takes non-financial ESG factors into consideration. GPIF is committed to promoting ESG investment.
The term “ESG” was first popularized in 2006, when the United
Nations proposed the Principles for Responsible Investment (PRI) – a
new framework for incorporating ESG into the investment process –
to institutional investors around the globe. As the world economy has
grown, environmental, social and corporate governance issues that
have the potential to negatively impact socio-economic sustainability,
such as climate change, supply chain labor problems, and corporate
misconduct, have surfaced. Based on this recognition, ESG
investment is expected to improve risk-adjusted returns over the long
term by incorporating environmental, social, and corporate
governance perspectives into investment decisions.
What is ESG?1
Environmental
Governance
Social
Climate change
Water resources
Biodiversity etc.
Composition of the board of directors
Protection of minority shareholders etc.
Diversity
Supply chain etc.GovernanceSocial
Environmental
GPIF can be accurately described as a “universal owner”; that is, a
long-term investor with a substantial level of assets under
management that invests in securities spanning the entire world
capital market. Furthermore, the pension reserves managed by GPIF
are used to mitigate the burden of pension contributions made by
future generations. Long-term corporate value creation by each
investee company and the sustainable, stable growth of the entire
capital market is critical for GPIF – a universal owner and cross-
generational investor – to achieve stable income over the long run.
Since environmental and social issues will inevitably impact capital
markets over the long term, it is essential that we reduce the negative
impact of these problems in our pursuit of sustainable returns.
Why Does GPIF Focus on ESG?2
GPIF ESG REPORT 202007

The SDGs (Sustainable Development Goals) are international goals set
forth by the United Nations in the “2030 Agenda for Sustainable
Development” adopted at the UN Summit in September 2015. The
SDGs evolved from the Millennium Development Goals formulated by
the UN in 2001 and are targeted for achievement by 2030. The SDGs
advocate “leaving no one on the planet behind.” And consist of 17
goals and 169 targets, including “Gender Equality,” “Industry, Innova-
tion, and Infrastructure”, and “Climate Action.”
As the goals and targets of ESG investment and the SDGs are
largely the same, the former can go a long way in accomplishing the
latter. Achieving the SDGs and realizing a sustainable economy and
society would lead to a better return on all assets managed by GPIF
over the long term.
About the SDGs3
Column
GPIF’s Investment Principles clearly state that we will promote
investments that consider ESG, and we thus integrate ESG
factors into all aspects of our pension reserve management. On
the other hand, GPIF does not conduct investment where the
explicit purpose is to create some type of social impact, such
as achieving the SDGs. While this may seem like a
contradiction, it is related to the legislation governing GPIF and
the objective of our investment behavior.
As mentioned above, GPIF is required by law to manage
pension reserves solely for the benefit of pension recipients
from a long-term perspective, thereby helping to fund future
pension benefits. In this context, benefit is construed as
economic benefit. The goal of GPIF’s ESG investment is to
ensure the economic benefit of pension recipients from a
long-term perspective by reducing the negative impact of
environmental and social issues on capital markets. For this
reason, it was decided that, under existing legislation and the
objective of investment behavior to be taken by the fund, GPIF
would not make investments whose sole purpose was to
"contribute to the solution of social problems."
In general, there are many similarities between ESG investment
and impact investment, and few investors may be clearly aware of
the differences. We believe that GPIF’s ESG investment will have an
impact by enhancing companies’ ESG activities and improving their
ESG ratings, which will ultimately lead to the mitigation of risks and
improvement of portfolio returns. Having said that, GPIF’s ESG
investment does not directly target social impact itself, which is the
major difference with impact investment.
GPIF and Impact Investment
GPIF ESG REPORT 2020 08

Message f rom Our Pres ident
The year 2020, which marked the commencement of
the 4th Medium-term Plan, was a turbulent year for
GPIF. The COVID-19 pandemic, which began in the
previous fiscal year and exploded around the entire
world, continued to severely impact the global
economy and society in fiscal 2020. While progress is
being made with the vaccination roll-out in developed
countries in Europe and America, many other
countries, including Japan, are caught in a repeated
cycle of harsh restrictions to reduce transmission of
the virus and the easing of those restrictions.
Amid this unprecedented crisis, socioeconomic
systems and industrial structures are undergoing
major transformations. ESG also continued to
attract attention on many fronts, with the pandemic
driving an even greater awareness of the
importance of social (S) issues, including employee
health and safety, supply chain management, and
human rights. 2020 also saw the beginning of a
greater global alignment on climate change.
Several countries announced their intention to
reduce greenhouse gas emissions to net zero,
beginning with China in September 2020 followed
by Japan and South Korea the following month.
And on the inaugural day of the new Biden
administration in January 2021, the United States
announced its return to the Paris Agreement – an
international framework to combat climate change.
While the pandemic continues to rage on, the world
has already begun to look forward toward a post-
COVID future.
In this tumultuous year, both domestic and
overseas stock markets rose significantly due to
economic stimulus packages implemented in major
economies, including major fiscal spending and
continued accommodative monetary policies. Our
tactical allocation of funds to risk assets such as
domestic and foreign stocks whose prices had
dropped substantially due to the COVID-19 shock
contributed greatly to performance in fiscal 2020,
with our portfolio generating a record-high return
of around 25.2%, or approximately ¥37.8 trillion.
GPIF is committed to fulfilling our fiduciary duty
to secure adequate retirement funds for both
current and future beneficiaries by managing
pension reserves from a long-term perspective,
based on our Investment Principles and Code of
Conduct, without being swayed by short-term
investment results.
GPIF’s Investment Principles state that “we
promote investments that take into account the
non-financial elements of ESG, in addition to
financial elements, with a view to ensuring long-
term returns for the benefit of pension recipients.”
We also firmly believe that enhancing the
sustainability of financial markets as a whole
through ESG activities will help stabilize the
pension system, to the ultimate advantage of all
beneficiaries.
Based on this conviction, GPIF has been
promoting various ESG-related initiatives ever since
becoming a PRI signatory in 2015. In fiscal 2020,
GPIF ESG REPORT 202009

we adopted new ESG indexes for foreign equities
and collaborated with various international
organizations to promote green, social, and
sustainability bonds and investment in COVID-19
bonds. We also actively continued our engagement
with index providers and ESG ratings agencies
The benefits of ESG-related initiatives take a
long time to materialize. We have examined the
impact of our activities every year in our ESG
Report to confirm that we are headed in the right
direction and ensure that we ultimately achieve the
results we are aiming for. This is the fourth such
report since it was first published in fiscal 2017.
For the disclosure of climate change risks and
opportunities, the importance of which is
increasing year by year, we attempted to conduct a
more forward-looking analysis, as well as delve
more deeply into the analyses we have conducted
to date.
Although many challenges remain, such as
constraints on information availability, we are
committed to continuously improving our yearly
analysis and disclosures. We hope that our efforts
provide an impetus for other asset owners and
asset managers to disclose similar information.
Government Pension Investment Fund
MIYAZONO MasatakaPresident
10
Activity HighlightsIn fiscal 2020, GPIF continued to promote ESG in new areas. Here we present the highlights of our
ESG activities during the year.
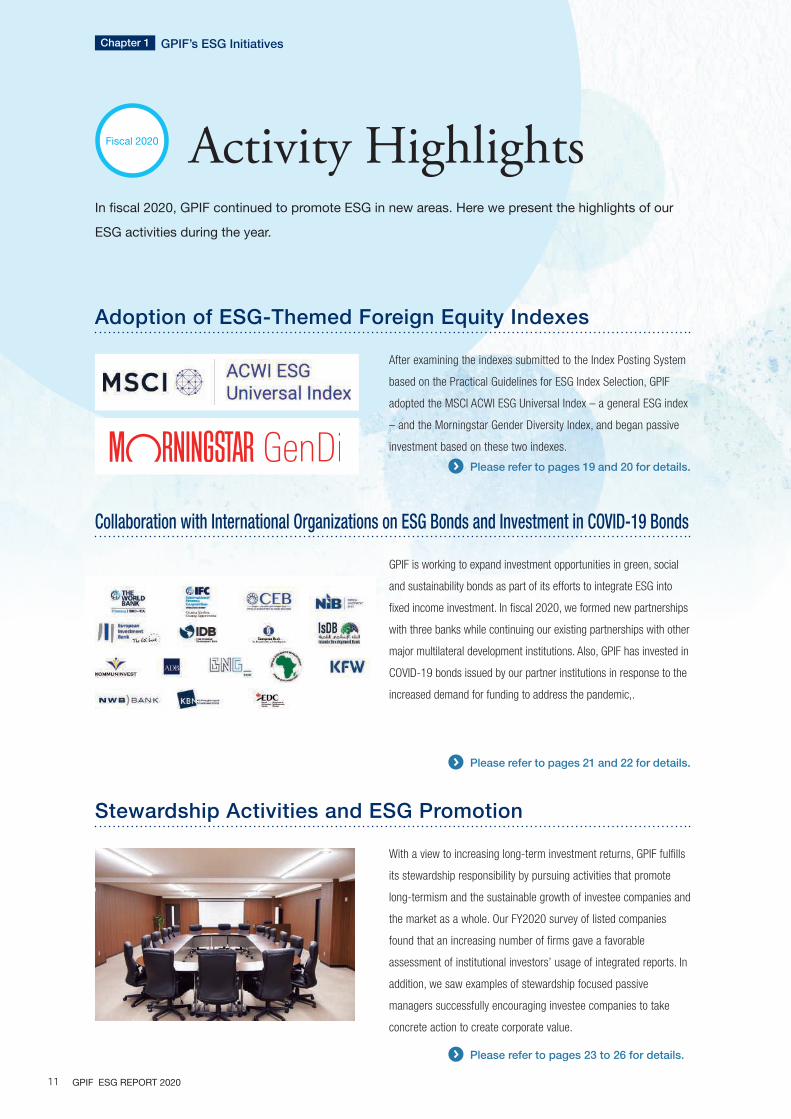
Adoption of ESG-Themed Foreign Equity Indexes
Collaboration with International Organizations on ESG Bonds and Investment in COVID-19 Bonds
After examining the indexes submitted to the Index Posting System
based on the Practical Guidelines for ESG Index Selection, GPIF
adopted the MSCI ACWI ESG Universal Index – a general ESG index
– and the Morningstar Gender Diversity Index, and began passive
investment based on these two indexes.
GPIF is working to expand investment opportunities in green, social
and sustainability bonds as part of its efforts to integrate ESG into
fixed income investment. In fiscal 2020, we formed new partnerships
with three banks while continuing our existing partnerships with other
major multilateral development institutions. Also, GPIF has invested in
COVID-19 bonds issued by our partner institutions in response to the
increased demand for funding to address the pandemic,.
Stewardship Activities and ESG Promotion
With a view to increasing long-term investment returns, GPIF fulfills
its stewardship responsibility by pursuing activities that promote
long-termism and the sustainable growth of investee companies and
the market as a whole. Our FY2020 survey of listed companies
found that an increasing number of firms gave a favorable
assessment of institutional investors’ usage of integrated reports. In
addition, we saw examples of stewardship focused passive
managers successfully encouraging investee companies to take
concrete action to create corporate value.
Please refer to pages 21 and 22 for details.
Please refer to pages 23 to 26 for details.
Fiscal 2020
Chapter 1 GPIF’s ESG Initiatives
Please refer to pages 19 and 20 for details.
GPIF ESG REPORT 202011

ESG in Alternative Asset Management
Publication of the Analysis of Climate Change-Related Risks and Opportunities in the GPIF Portfolio
Engagement with Index Providers and ESG Ratings Agencies
GPIF also takes ESG factors into consideration when investing in
alternative assets. We examine ESG initiatives in the process of
selecting asset management companies, and monitor these
managers after a mandate is awarded. In this report, we conduct a
quantitative analysis of climate change risk for domestic real estate
which GPIF invests in through private funds.
In the “Analysis of Climate Change-Related Risks and Opportunities in
the GPIF Portfolio” report published in October 2020, GPIF further
enhanced its disclosures in line with the recommendations of the Task
Force on Climate-related Financial Disclosures (TCFD) by broadening
the scope of analysis and conducting a comprehensive assessment of
climate change-related risks and opportunities across asset classes. As
GPIF is a “universal owner,” we are confident that this report not only
serves as an evaluation of our portfolio companies, but also provides a
wealth of implications about the different climate-related challenges
and risks countries around the world are facing, as well as the inherent
value of problem-solving technologies and business opportunities that
could emerge in the future.
GPIF has been actively engaging in dialogue with index providers and
ESG ratings agencies since first selecting ESG indexes for Japanese
equities in 2017. As GPIF’s investments are predominantly passive,
index providers and ESG ratings agencies play a pivotal role in the
success or failure of our fund management. GPIF engages in dialogue
with these providers in an effort to improve ESG rating coverage and
rating methodologies.
Please refer to pages 35 and 36 for details.
Please refer to pages 29 to 34 for details.
https://www.gpif.go.jp/en/investment/
GPIF_CLIMATE_REPORT_FY2019_2.pdf
Analysis of Climate Change-Related Risks and
Opportunities in the GPIF Portfolio
Supplementary Guide to GPIF ESG Report 2019
2020/09/17 14:14:22
GPIF ESG REPORT 2020 12
Chapter 2 Measuring the Im
pacts of ESG ActivitiesChapter 3 Evaluation and Analysis of Clim
ate Change Risks and OpportunitiesChapter 1 GPIF’s ESG Initiatives
Activity Highlights

Deliberations by the Board of Governors
The Board of Governors discusses and oversees the promotion
of ESG and approaches to ESG investment at GPIF. The Board,
established in October 2017, makes decisions concerning
important matters such as the formulation of the policy asset
mix and medium-term plans by mutual consent, and oversees
the execution of operations by the Executive Office.
In fiscal 2020, the Board of Governors met 13 times, and
ESG-related issues were discussed at six of those meetings.
The Board of Governors discusses and oversees the promotion
of ESG and approaches to ESG investment at GPIF. Details of
the discussions of the Board of Governors are posted on the
GPIF website in the form of a summary of the proceedings after
a certain period of time has passed.
ESG-Related Governance and Organizational FrameworksThe Board of Governors discusses and oversees the promotion of ESG and approaches to ESG investment at GPIF. The
Executive Office promotes ESG initiatives through coordination between the Public Market Investment Department,
Investment Strategy Department, Private Market Investment Department, and other departments related to asset
management, and reports to the Board of Governors on important matters.
Status of the Board of Governors
https://www.gpif.go.jp/operation/board/
Meeting number Meeting date Agenda item
42nd May 2020 Reported matter ESG Report (Outline)
44th June 2020
Matter for resolution Change of policy for fulfillment of stewardship responsibilities
Reported matter Selection of ESG-themed foreign equity indexes
45th July 2020
Matter for resolution ESG index selection
Reported matter ESG Report 2019 (final version)
46th September 2020 Matter for resolution ESG index selection (2)
47th October 2020 Reported matterAnalysis of Climate Change-Related Risks and Opportunities in the GPIF Portfolio(a supplementary guide to the ESG Report)
53rd March 2021 Reported matter Report on stewardship activities in 2020/2021
ESG-related items discussed and reported on at Board of Governor meetings
Chapter 1 GPIF’s ESG Initiatives
GPIF ESG REPORT 202013

ESG-related executive structure
Practical guidelines for the selection of ESG indexes
The Executive Office implements ESG initiatives through
coordination between the Public Market Investment
Department, Investment Strategy Department, Private Market
Investment Department, and other departments related to asset
management. The Investment Committee, chaired by the Chief
Investment Officer (CIO), deliberates and makes decisions on
ESG-related initiatives and other asset management-related
issues, and particularly important matters are reported to the
Board of Governors. Preparation of the ESG Report is also
deliberated on by the Investment Committee before being
reported to the Board of Governors.
At the 46th meeting of GPIF’s Board of Governors held in
September 2020, the Board deliberated and voted on the Practical
Guidelines for the Selection of ESG Indexes, which set forth basic
policies for the selection of ESG indexes. These guidelines clarified
several matters relating to the selection of ESG indexes, including
1) to avoid directly influencing financial markets and corporate
management, GPIF must not select individual stocks, nor give
directions for such selection, and 2) selection of indexes should be
conducted exclusively for the benefit of pension recipients (i.e.,
securing of long-term returns) from a long-term perspective. Based
on these fundamental rules, the guidelines stipulate that, “when
selecting an index that includes negative screening methods, ...
such selection must be based exclusively on an economic
rationale, avoid generating unnecessary speculation, include a
rational and transparent selection process, and be dealt with in a
cautious and conservative manner.”
Key departments responsible for ESG
Investment Strategy DepartmentThis department develops GPIF’s ESG investment strategies, such as the selection of ESG indexes.
Develop investment strategy, including rebalancing strategy and investment methods, etc.
Main Responsibilities
Private Market Investment DepartmentThis department integrates ESG into its selection and evaluation of external asset managers for alternative assets.
Selection and evaluation of external asset managers for alternative assets, etc.
Main Responsibilities
Public Market Investment Department This section examines ESG integration as part of the external asset manager evaluation process.
This section evaluates ESG and other stewardship activities by external asset managers, researches ESG investment and other new investment methods, and coordinates various activities across asset classes, including the production of the ESG Report.
Public Market Investment
Stewardship & ESG
Selection and evaluation of external asset managers for equity and fixed income, etc.
Main Responsibilities
Practical Guidelines for the Selection of ESG Indexes
GPIF ESG REPORT 2020 14
Chapter 2 Measuring the Im
pacts of ESG ActivitiesChapter 3 Evaluation and Analysis of Clim
ate Change Risks and OpportunitiesChapter 1 GPIF’s ESG Initiatives
ESG-Related Governance and Organizational Framew
orks

SDGs and Diversity-Related Initiatives
GPIF’s Code of Conduct states, “We are committed to GPIF’s
mission by promoting communication and teamwork and
nurturing a diversity of talents and capabilities,” and further,
“We shall respect each person’s personality, talents and
capabilities, perspectives, well-being, and privacy to maintain
a good working environment.” Building on this, in January
2020 GPIF launched the SDGs Promotion Group, which
reports directly to the President of GPIF and conducts regular
training sessions for fund employees on the SDGs. Further,
GPIF launched the Diversity and Inclusion Promotion Group
(“D&I Group”) as a sub-group to the SDGs Promotion Group,
which consists mainly of fund employees who have applied to
the group and been selected by the President. Both the SDGs
Promotion Group and the D&I Group are tasked with
developing initiatives designed to bolster the fund’s ESG-
conscious internal values, and members discuss specific
measures for creating a work environment in which everyone
can work with a sense of purpose.
In 2020, the D&I Group proposed a plan of action based
on the concept that understanding and accepting people with
different values and cultures and encouraging the
development of team members who generate new ideas is
crucial in enhancing fund management and investment. The
proposal sets out two approaches for its implementation. In
terms of conduct, it aims to create a workplace environment
where everyone can work with a sense of purpose. In terms
of raising awareness, it aims to foster a mindset and
awareness of diversity and inclusion in employees.
The advancement of women in the workplace is a crucial
part of diversity promotion. The table on the opposite page
includes GPIF’s numbers for the five metrics that companies are
required to disclose under the Act on Promotion of Women’s
Participation and Advancement in the Workplace, which are also
quantitative evaluation metrics used in the MSCI Japan
Empowering Women Index (WIN). GPIF will continue to implement
initiatives for enhancing diversity and inclusion in the future.
ESG Initiatives Within GPIFIn 2020, GPIF established the SDGs Promotion Group—a committee reporting directly to the President created to develop
initiatives designed to bolster the fund’s ESG and SDG-conscious internal values. GPIF went on to establish the Diversity
and Inclusion Promotion Group under the SDGs Promotion Group. Through these organizations, GPIF promotes ESG and
the SDGs within the fund itself.
FY2020 SDGs training
Session 1 October 2020
Part 1: SDGs Basics and Global TrendsLecturer: KANIE Norichika, Professor, Keio University Graduate School of Media and Gover-nancePart 2: Report on Joint Research on Society 5.0 for SDGs
Session 2 November 2020
Part 1: The Fight against COVID-19Lecturer: HANAKI Hideaki, Director of the Research Center for Infection Control, Kitasato University Omura Satoshi Memorial InstitutePart 2: Ministry of Health, Labour and Welfare’s COVID-19 Countermeasures
Session 3 March 2021Part 1: The Significance of WomenomicsLecturer: Kathy Matsui, General Partner, MPower PartnersPart 2: Introduction of Diversity & Inclusion Promotion Group
(Note) A fund employee in charge of D&I served as lecturer for Part 2.
Chapter 1 GPIF’s ESG Initiatives
GPIF ESG REPORT 202015

Environmental Initiatives
GPIF’s Response to COVID-19
As part of our environmentally-conscious initiatives within the fund,
GPIF established a “Basic Policy on Promoting Green Procurement”
for fiscal 2020 based on the Act on Promotion of Procurement of
Eco-Friendly Goods and Services by the State and Other Entities.
Based on this policy, GPIF works to ensure that the paper and
stationery, office furniture, office equipment, appliances, and other
office products we use have a minimal impact on the environment.
To reduce paper consumption, in principle, all meetings,
including Board of Governors and Investment Committee meetings,
are paperless. We ask asset managers and ESG ratings agencies
to provide meeting materials in advance in electronic form, and
use tablets, laptops, and other devices to view these presentations.
In fiscal 2020, these initiatives, in addition to enhancements to our
remote work frameworks made in response to the COVID-19
pandemic, resulted in about 40% less copier paper being
purchased and approximately 43% less paper used per employee
compared with the previous year.
From 2020 and into 2021, the global COVID-19 pandemic has
had a massive impact on society. GPIF was no exception.
In response to the pandemic, GPIF implemented remote
work beginning in March 2020, and set up a COVID-19 response
headquarters when a state of emergency was declared in the
Tokyo metropolitan area in April. The response headquarters,
chaired by the President and including the Executive Managing
Directors and departmental general managers, was established
to address issues such as how to secure the safety of fund
employees and ensure business continuity. The response
headquarters shared information on various issues within the
fund, coordinated different departmental efforts, and monitored
the status of those efforts. From April onward, we proactively
recommended all officers and employees to work from home. We
also began holding important meetings, such as meetings of the
Board of Governors and Investment Committee, remotely over the
Internet, while strictly managing information security. As a result,
every day an average of around 70% of officers and employees
worked from home during the states of emergency declared in
April 2020 and again in January and April 2021. In addition to
the promotion of remote work, we are also implementing other
initiatives in the workplace such as the introduction of staggered
working hours to avoid the “three Cs” (closed spaces, crowded
places, and close-contact settings) during the commuting rush.
GPIF will continue developing its business continuity framework
for continuing pension reserve management operations even in
times of emergency.
(i) % female new hires 0.0% (iv) % women in senior management 11.9%
(ii) % women in the workforce 30.3% (v) % women on board 16.7%
(iii) Difference in years men and women are employed by the company*
(47.8)%
Women in the workplace at GPIF
(Note) Data for (i) is for fiscal 2020; the other data is as of March 31 2021 or April 1, 2021.
* Difference in years men and women are employed by the company = (average years women employed – average years men employed) / average years men employed.
This ratio is highly sensitive to changes in hiring and retirement due to GPIF’s small workforce (174 employees) and thus fluctuates significantly from year to year.
** Percentage of women on the Board of Governors. Governors (including the President) are appointed by the Minister of Health, Labour and Welfare.
Amount of Copier Paper Purchased at GPIF
20
40
60
80
100
(FY2018=100)
0
1,000
2,000
3,000
4,000
5,000
6,000(kg)
FY2018 FY2019 FY2020■ Amount purchased (left axis)
Amount used per person (right axis)
0
GPIF ESG REPORT 2020 16
Chapter 2 Measuring the Im
pacts of ESG ActivitiesChapter 3 Evaluation and Analysis of Clim
ate Change Risks and OpportunitiesChapter 1 GPIF’s ESG Initiatives
ESG Initiatives Within GPIF

Climate-Related Financial Disclosure Consistent with TCFD Recommendations
The Financial Stability Board (FSB) established the Task Force
on Climate-related Financial Disclosures (TCFD) in December
2015, and in June 2017, the TCFD released their
recommendations on how companies and others can better
disclose information related to climate change risks and
opportunities. The recommendations published by the TCFD
outline a series of information disclosure practices for
companies and other organizations in (1) governance, (2)
strategy, (3) risk management, and (4) metrics and targets, in
relation to climate change.
Although the potential impact may vary in size, for
investors, climate change risks occur simultaneously across all
companies and asset classes and cannot be completely
eliminated simply through diversification. Moreover, these risks
are highly likely to manifest over the long term, and we
therefore believe that GPIF, as an asset owner, should take the
lead in addressing them. We therefore declared support for the
TCFD in December 2018 and began disclosing information in
accordance with the TCFD recommendations in that fiscal
year’s ESG Report. The analytical methods used to measure
climate change risks are evolving year by year, and we’ve
worked to further enhance our disclosures in this year’s report.
For example, in addition to analyzing transition and physical
risks and opportunities for individual asset classes, the
analyses in this year’s report include Scope 3 greenhouse gas
emissions data, in addition to Scope 1 and Scope 2 data.
It is difficult to separate climate change-focused investment
and activities from ESG activities as a whole, and GPIF regards
climate change as one of the most important themes in ESG
activities in general. Accordingly, as shown in “Disclosures
recommended by the TCFD and GPIF’s response” (on the
opposite page), our disclosures are not confined to initiatives only
relating to climate change but include all ESG activities. To make
it easy to understand what kind of information GPIF discloses for
the four TCFD disclosures, from this fiscal year, the ESG Report
will provide an illustration of the four core disclosure elements as
shown on the opposite page.
GPIF will work to enhance the sustainability of the entire
market by further improving its disclosure of information on ESG
in general, including climate change-related financial information.
Support for TCFD and Climate-Related Financial DisclosuresAlthough the potential impact may vary in size, climate change risks occur simultaneously across all companies and asset
classes, and it is difficult to completely eliminate these risks simply through diversification. In addition, as climate-change
risks are highly likely to manifest over the long term, we believe that, as an asset owner, GPIF should take the lead in
addressing them.
Chapter 1 GPIF’s ESG Initiatives
GPIF ESG REPORT 202017
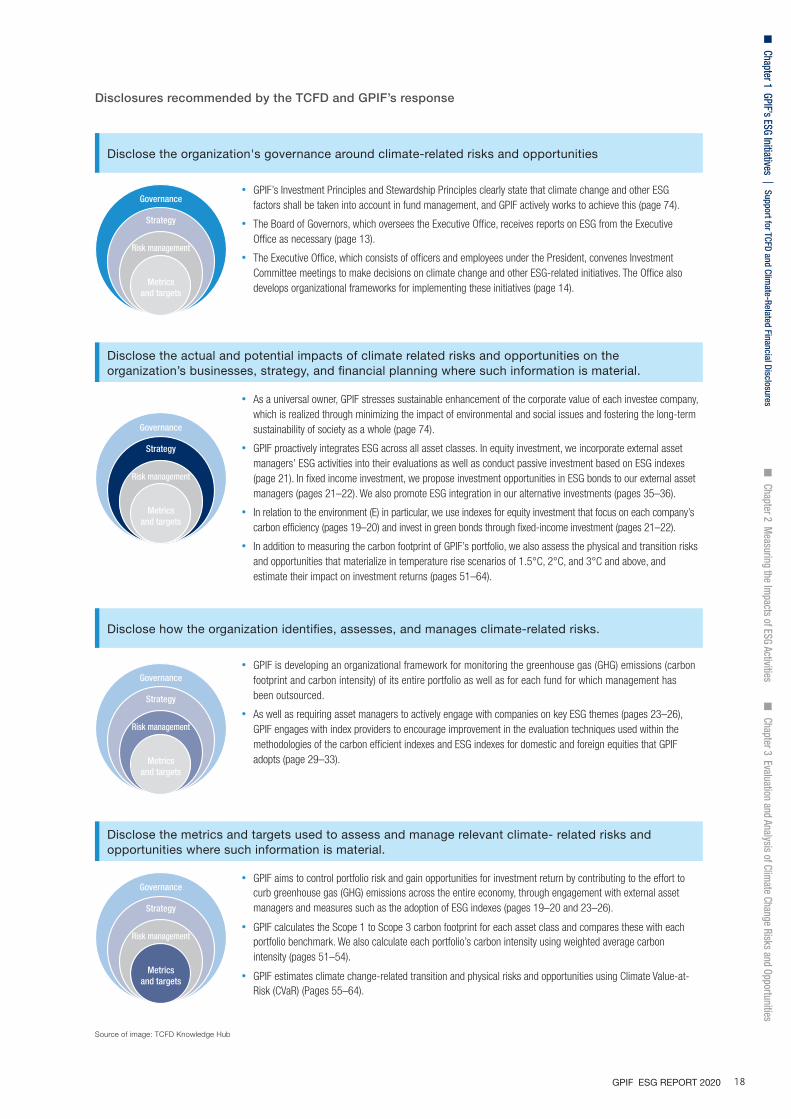
Disclosures recommended by the TCFD and GPIF’s response
•GPIF aims to control portfolio risk and gain opportunities for investment return by contributing to the effort to curb greenhouse gas (GHG) emissions across the entire economy, through engagement with external asset managers and measures such as the adoption of ESG indexes (pages 19–20 and 23–26).
•GPIF calculates the Scope 1 to Scope 3 carbon footprint for each asset class and compares these with each portfolio benchmark. We also calculate each portfolio’s carbon intensity using weighted average carbon intensity (pages 51–54).
•GPIF estimates climate change-related transition and physical risks and opportunities using Climate Value-at-Risk (CVaR) (Pages 55–64).
Governance
Strategy
Risk management
Metrics and targets
Disclose the metrics and targets used to assess and manage relevant climate- related risks and opportunities where such information is material.
•GPIF is developing an organizational framework for monitoring the greenhouse gas (GHG) emissions (carbon footprint and carbon intensity) of its entire portfolio as well as for each fund for which management has been outsourced.
•As well as requiring asset managers to actively engage with companies on key ESG themes (pages 23–26), GPIF engages with index providers to encourage improvement in the evaluation techniques used within the methodologies of the carbon efficient indexes and ESG indexes for domestic and foreign equities that GPIF adopts (page 29–33).
Governance
Strategy
Risk management
Metrics and targets
Disclose how the organization identifies, assesses, and manages climate-related risks.
•As a universal owner, GPIF stresses sustainable enhancement of the corporate value of each investee company, which is realized through minimizing the impact of environmental and social issues and fostering the long-term sustainability of society as a whole (page 74).
•GPIF proactively integrates ESG across all asset classes. In equity investment, we incorporate external asset managers’ ESG activities into their evaluations as well as conduct passive investment based on ESG indexes (page 21). In fixed income investment, we propose investment opportunities in ESG bonds to our external asset managers (pages 21–22). We also promote ESG integration in our alternative investments (pages 35–36).
•In relation to the environment (E) in particular, we use indexes for equity investment that focus on each company’s carbon efficiency (pages 19–20) and invest in green bonds through fixed-income investment (pages 21–22).
•In addition to measuring the carbon footprint of GPIF’s portfolio, we also assess the physical and transition risks and opportunities that materialize in temperature rise scenarios of 1.5°C, 2°C, and 3°C and above, and estimate their impact on investment returns (pages 51–64).
Governance
Strategy
Risk management
Metrics and targets
Disclose the actual and potential impacts of climate related risks and opportunities on the organization’s businesses, strategy, and financial planning where such information is material.
•GPIF’s Investment Principles and Stewardship Principles clearly state that climate change and other ESG factors shall be taken into account in fund management, and GPIF actively works to achieve this (page 74).
•The Board of Governors, which oversees the Executive Office, receives reports on ESG from the Executive Office as necessary (page 13).
•The Executive Office, which consists of officers and employees under the President, convenes Investment Committee meetings to make decisions on climate change and other ESG-related initiatives. The Office also develops organizational frameworks for implementing these initiatives (page 14).
Governance
Strategy
Risk management
Metrics and targets
Disclose the organization's governance around climate-related risks and opportunities
Source of image: TCFD Knowledge Hub
GPIF ESG REPORT 2020 18
Chapter 2 Measuring the Im
pacts of ESG ActivitiesChapter 3 Evaluation and Analysis of Clim
ate Change Risks and OpportunitiesChapter 1 GPIF’s ESG Initiatives
Support for TCFD and Climate-Related Financial Disclosures

Selection of Two ESG Indexes for Foreign Equities
GPIF has used ESG indexes as passive investment benchmarks
since fiscal 2017. We believe passive investment based on
indexes that focus on corporate sustainability will not only
improve the risk/return profile of the portfolio over the long run,
but also enhance the Japanese equity market through secondary
effects such as the improvement of ESG ratings.
GPIF selected three ESG benchmark indexes for Japanese
equities in fiscal 2017, followed by two domestic and foreign
equity indexes that focus on corporate greenhouse gas
emissions in fiscal 2018. In fiscal 2019, GPIF announced the
introduction of and began gathering information through the
“Index Posting System” (IPS), a new framework for collecting
index information on a continuous basis.
In fiscal 2020, the Board of Governors established the
Practical Guidelines for the Selection of ESG Indexes. Based on
these Guidelines, GPIF examined the posted indexes and
selected two ESG indexes for foreign equities.
Emphasis was placed on the following points in the selection
of these indexes:
Primary evaluation criteria
1) ESG ratings play a central role in the constituent selection/
weighting process.
2) The index encourages ESG disclosure (i.e., ratings are based
on public information).
3) The ratings methodology is clearly disclosed and the index
provider/ESG ratings agency actively engages in dialogue
with issuers.
4) The scope of issuers rated is sufficiently broad.
5) The governance and conflict of interest management structures
of the ESG ratings agency and index provider are adequate.
Of the ESG indexes newly adopted in fiscal 2020, the MSCI ACWI
ESG Universal Index, a comprehensive ESG index, increases the
investment weight of companies with high ESG scores and
companies whose score has improved as evaluated by MSCI. The
index aims to curb the ESG risk of the portfolio while limiting
tracking error versus the parent index.
The Morningstar Gender Diversity Index, on the other hand,
uses data from Amsterdam-based data provider Equileap to
assess companies’ gender equality initiatives. The index
increases the investment weight of companies that have a track
record for establishing policies and frameworks for the active
promotion of women. There is a large body of evidence that
shows that companies with greater gender diversity are able to
access a wider pool of talent, which gives them the potential to
elevate management performance. From a macro-economic
perspective, the improvement of gender diversity may boost the
economic growth of individual countries. By investing in
companies with greater gender diversity, the fund aims to
enhance long-term investment returns through the sustainable
growth of our investments and the market as a whole.
ESG Index Selection and ESG Index-Based Asset ManagementIn order to improve the long-term risk/return profile of the portfolio by reducing ESG risks, GPIF adopts several ESG-
integrated indexes as benchmarks for passive investment. In fiscal 2020, GPIF newly adopted a comprehensive ESG index
and a diversity-focused index for foreign stocks.
Chapter 1 GPIF’s ESG Initiatives
GPIF ESG REPORT 202019

GPIF’s Expanding ESG Investment
GPIF has expanded its ESG index-based investment since
beginning passive investment in three domestic equity ESG
indexes in fiscal 2017. In fiscal 2020, we started managing
investments on the scale of ¥1 trillion based on the MSCI ACWI
ESG Universal Index and ¥300 billion based on the Morningstar
Gender Diversity Index. As of March 2021, total ESG index-based
passive investments have grown to approximately ¥10.6 trillion.
Please refer to “ESG Index Performance” on pages 41 and 42 for
information on the performance of each index. By investing in
these indexes, GPIF aims to enhance long-term investment
returns through the sustainable growth of our investments and
the market as a whole.
Main characteristics of ESG indexes adopted by GPIF
ESG Indexes for Domestic Equities
FTSE Blossom Japan Index
MSCI Japan ESG Select Leaders Index
MSCI Japan Empowering Women Index (“WIN”)
S&P/JPX Carbon Efficient Index
Concept and characteristics of
index
・The index uses the ESG assessment scheme used in the FTSE4Good Japan Index Series, which has one of the longest track records globally for ESG indexes.
・It is a broad ESG index that selects stocks with high absolute ESG scores and adjusts industry weights to neutral.
・The MSCI Japan ESG Select Leaders Index is a broad ESG index that integrates various ESG risks into today’s portfolio. The index is based on MSCI ESG Research used globally by more than 1,000 clients.
・The index is comprised of stocks with relatively high ESG scores in each industry.
・MSCI calculates the gender-diversity scores based on information disclosed under “the Act on Promotion of Women’s Participation and Advancement in the Workplace” and selects companies with higher gender diversity scores from each sector.
・The first index designed to cover a broad range of factors related to gender diversity.
・Constructed by S&P Dow Jones Indices based on carbon data provided by Trucost, a pioneer in environmental assessment.
・This index is designed to overweight companies that have lower carbon footprints (annual greenhouse gas emissions divided by annual revenues) and that actively disclose their carbon emission information.
Index construction Best-in-Class Best-in-Class Best-in-Class Tilted
Constituent universe
(Parent index)
FTSE Japan All Cap Index (1,391 stocks)
MSCI Japan IMI Top 700(694 stocks)
MSCI Japan IMI Top 700(694 stocks)
TOPIX (2,187 stocks)
Number of index constituents 200 231 298 1,844
Assets under management
(¥billion)1,490.6 2,026.8 1,236.2 1,536.5
ESG Indexes for Foreign Equities
MSCI ACWI ESG Universal Index Morningstar® Developed Markets Ex-Japan
Gender Diversity IndexSM (GenDi)
S&P Global LargeMidCap Carbon Efficient Index
Concept and characteristics of
index
・One of MSCI’s flagship ESG indexes, this index adjusts the weight of constituents based on each issuer’s current ESG rating and rating trend to elevate the ESG metrics of the index overall.
・The index was developed for large investors seeking to enhance ESG integration while achieving the same level of investment opportunity and risk exposure as the parent index.
・Determines investment weighting based on assessment of companies’ commitment to gender equality, using the Equileap Gender Equality Scorecard.
・Ratings are conducted in four categories: (1) Gender balance in leadership and workforce; (2) equal compensation and work-life balance; (3) policies promoting gender equality; and (4) commitment, transparency, and accountability.
・Constructed by S&P Dow Jones Indices based on carbon data provided by Trucost, a pioneer in environmental assessment.
・This index is designed to overweight companies that have lower carbon footprints (annual greenhouse gas emissions divided by annual revenues) and that actively disclose their carbon emission information.
Index construction Tilted Tilted Tilted
Constituent universe (Parent index)
MSCI ACWI ex Japan ex China A ESG Universal with Special Taxes Index
(2,207 stocks)
Morningstar® Developed Markets Ex-Japan Large-Mid
(1,937 stocks)
S&P Global Ex-Japan LargeMidCap (3,003 stocks)
Number of index constituents 2,106 1,909 2,303
Assets under management
(¥billion)1,178.4 343.8 2,823.9
(Note) Data is current as of March 31, 2021
(Source) Prepared by GPIF based on data from FactSet and individual index providers.
GPIF ESG REPORT 2020 20
Chapter 2 Measuring the Im
pacts of ESG ActivitiesChapter 3 Evaluation and Analysis of Clim
ate Change Risks and OpportunitiesChapter 1 GPIF’s ESG Initiatives
ESG Index Selection and ESG Index-Based Asset Managem
ent
010_8221379102110.indd 20010_8221379102110.indd 20 2021/09/29 9:39:482021/09/29 9:39:48

ESG Integration in Asset Manager Evaluations
ESG Integration in Fixed Income Investments
ESG in External Equity and Fixed Income ManagementGPIF examines ESG initiatives when evaluating the external asset managers through which we manage our equity and
fixed income assets. We have also formed partnerships with several multilateral development banks and governmental
financial institutions to expand investment opportunities in green, social, and other ESG-related bonds.
Most of GPIF's portfolio assets are managed externally by asset
management companies in Japan and overseas. The Public Market
Investment Department and Investment Strategy Department work
together to select and evaluate these companies. Managers are
evaluated on their investment policies, asset management
processes, organizational structure and human resources. ESG
integration is a key part of the asset management process review.
As a PRI signatory, in 2018 we defined ESG integration as
“the explicit and systematic inclusion of ESG factors into
investment analysis and investment decisions,” based on the
definition provided by PRI.
In fiscal 2019, we established evaluation criteria for ESG
integration based on this definition and began comprehensive asset
manager evaluations according to these new criteria. In addition to
evaluating existing external asset managers, the new ESG integration
criteria are also used when selecting new external asset managers.
Although an increasing number of asset managers
emphasize ESG and are explicitly and systematically including it
in their investment analysis, there are no established methods for
assessing how and to what degree ESG factors have an impact
on corporate value, and individual asset managers have adopted
their own various initiatives in this regard. We hope to see further
progress in this and other areas of ESG integration among asset
managers in the future.
GPIF and the World Bank Group have been working together to
promote ESG integration in fixed income investment through efforts
such as publishing a joint research paper entitled “Incorporating
Environment, Social and Governance (ESG) Factors into Fixed Income
Investment” in 2018.
Following up on this research, the International Bank for
Reconstruction and Development (IBRD) and the International Finance
Corporation (IFC)—both members of the World Bank Group—drew up
a new proposal in 2019 to provide GPIF’s external asset managers
with an opportunity to invest in green, social and sustainability bonds.
GPIF provides its external asset managers with opportunities to
both integrate ESG into their fixed income investments and gain excess
return over government bonds by building platforms in which they can
invest in green, social and sustainability bonds issued by multilateral
development banks and governmental financial institutions.
The initiative, launched in collaboration with IBRD and IFC, has
since expanded to more of the world’s major multilateral development
banks. In fiscal 2020, while maintaining these existing partnerships,
we have entered into new partnerships with three governmental
financial institutions : Nederlandse Waterschapsbank (NWB Bank) in
the Netherlands, Kommunalbanken Norway (KBN) in Norway, and
Export Development Canada (EDC) in Canada. As of March 31, 2021,
we have built investment platforms with ten multilateral development
banks and six governmental financial institutions as issuers.
GPIF is committed to promoting ESG-based investment, not only
in equities but also in fixed income and other assets, in order to limit
negative environmental and social externalities and enhance the
long-term return of the portfolio across all asset classes.
Chapter 1 GPIF’s ESG Initiatives
GPIF ESG REPORT 202021

International organizations with investment platforms in green bonds, etc.
Investment in COVID-19 bonds
Column
The global response to COVID-19 triggered a dramatic
transformation of the ESG bonds market. There was a sharp increase
in issues of social and sustainability bonds to provide funds for
activities aimed at mitigating the effects of COVID-19, such as
assistance to medical institutions. In 2020, the size of that market
increased by 32% year on year to approximately ¥85 trillion.1
The issue of COVID-19 bonds is also progressing among
multilateral development banks that have built investment
platforms in conjunction with GPIF. Through these platforms and
other channels, GPIF invests in green, social, and sustainability
bonds via the investment decisions of its external asset
managers. The size of those investments, which also include
COVID-19 bonds, grew to around ¥1.1 trillion2 as of March 31,
2021. The largest of those investments is in the “Fight
COVID-19” Social Bond issued by the African Development Bank
(AfDB). The objectives of this COVID-19 bond are to support
responses to the COVID-19 pandemic in African nations and to
mitigate the pandemic’s impact on their economies and
societies. The funds raised by the bond issue are allocated to
projects with aims such as disseminating COVID-19 antigen tests
and supporting small businesses.
GPIF has also invested in COVID-19 bonds issued by the
International Finance Corporation (IFC), the European Investment
Bank (EIB), and the Islamic Development Bank (IsDB).
© African Development Bank (AfDB)
1 As calculated by GPIF based on Bloomberg data.
2 Track record in investment in bonds, calculated by GPIF, based on Bloomberg
data, in compliance with International Capital Market Association (ICMA)
principles, etc.
GPIF ESG REPORT 2020 22
Chapter 2 Measuring the Im
pacts of ESG ActivitiesChapter 3 Evaluation and Analysis of Clim
ate Change Risks and OpportunitiesChapter 1 GPIF’s ESG Initiatives
ESG in External Equity and Fixed Income M
anagement
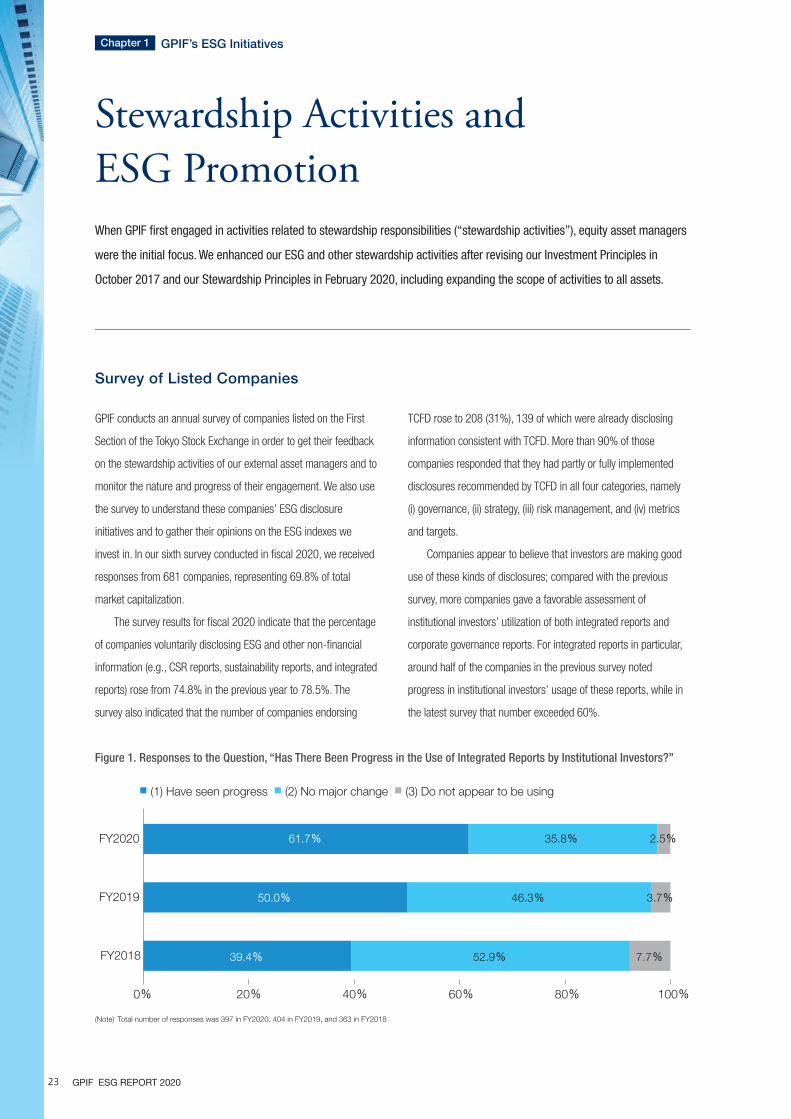
Survey of Listed Companies
GPIF conducts an annual survey of companies listed on the First
Section of the Tokyo Stock Exchange in order to get their feedback
on the stewardship activities of our external asset managers and to
monitor the nature and progress of their engagement. We also use
the survey to understand these companies’ ESG disclosure
initiatives and to gather their opinions on the ESG indexes we
invest in. In our sixth survey conducted in fiscal 2020, we received
responses from 681 companies, representing 69.8% of total
market capitalization.
The survey results for fiscal 2020 indicate that the percentage
of companies voluntarily disclosing ESG and other non-financial
information (e.g., CSR reports, sustainability reports, and integrated
reports) rose from 74.8% in the previous year to 78.5%. The
survey also indicated that the number of companies endorsing
TCFD rose to 208 (31%), 139 of which were already disclosing
information consistent with TCFD. More than 90% of those
companies responded that they had partly or fully implemented
disclosures recommended by TCFD in all four categories, namely
(i) governance, (ii) strategy, (iii) risk management, and (iv) metrics
and targets.
Companies appear to believe that investors are making good
use of these kinds of disclosures; compared with the previous
survey, more companies gave a favorable assessment of
institutional investors’ utilization of both integrated reports and
corporate governance reports. For integrated reports in particular,
around half of the companies in the previous survey noted
progress in institutional investors’ usage of these reports, while in
the latest survey that number exceeded 60%.
Stewardship Activities and ESG PromotionWhen GPIF first engaged in activities related to stewardship responsibilities (“stewardship activities”), equity asset managers
were the initial focus. We enhanced our ESG and other stewardship activities after revising our Investment Principles in
October 2017 and our Stewardship Principles in February 2020, including expanding the scope of activities to all assets.
Figure 1. Responses to the Question, “Has There Been Progress in the Use of Integrated Reports by Institutional Investors?”
(Note) Total number of responses was 397 in FY2020, 404 in FY2019, and 363 in FY2018
0% 20% 60% 80%40% 100%
FY2020
FY2019
FY2018 39.4% 52.9% 7.7%
50.0% 46.3% 3.7%
61.7% 35.8% 2.5%
(1) Have seen progress (2) No major change (3) Do not appear to be using
Chapter 1 GPIF’s ESG Initiatives
GPIF ESG REPORT 202023

The most recent survey showed that the COVID-19
pandemic elicited a change in the nature of the dialogues
companies have with institutional investors as well as in their
ESG initiatives. Of the companies surveyed, 78.1% responded
that the pandemic affected the content and topics of their
dialogue with institutional investors. Specifically, in addition to
pandemic-induced changes in the market and the impact on
business results, many companies responded that there was
more discussion about topics related to society (S), such as
employee health and safety initiatives and work styles. More than
half of the responding companies also indicated that the
pandemic had prompted changes in their ESG efforts. In addition
to a large number of responses indicating a change in initiatives
related to employee safety and work styles, some companies
also launched initiatives to develop new products to
accommodate social needs post-COVID-19.
Key ESG Issues Cited by External Managers
GPIF’s Stewardship Principles require external asset managers to
engage proactively on key ESG issues. When we surveyed our
external equity managers on what ESG issues they consider to
be key, all passive managers, who are required to hold investee
companies’ shares for extended periods of time, cited climate
change, diversity, and supply chain as key issues. They viewed
long-term challenges, including environmental (E) and social (S)
issues, as being of particular importance.
There was a notable change in the response regarding
supply chain from the previous year; all passive managers
mentioned this as a key issue, with a greater percentage of both
Japanese and foreign equity passive managers citing this as
important. This suggests that supply chains are now being
recognized as a serious issue due to the lockdowns and other
restrictions resulting from the COVID-19 pandemic.
Meanwhile, active asset managers, who primarily invest for
shorter periods ranging from several months to several years,
differed in what they consider to be key ESG issues depending
on if they managed Japanese or foreign equities. For foreign
equities, all asset managers considered climate change to be a
key issue, followed by multiple social (S) issues, whereas for
Japanese equities, all asset managers cited “composition and
evaluation of the board of directors” and “protection of minority
shareholders (cross-shareholdings, etc.)” as key issues,
indicating that they saw G (governance) themes as more
important. This year, fixed income investment managers were
also asked what they considered to be key ESG issues as
corporate bond investors. The results are shown below.
Japanese Equities – Passive Japanese Equities – Active Foreign Equities – Passive Foreign Equities – Active Japanese Bonds Foreign Bonds
Climate change 100% Composition and evaluation of the board of directors
100% Climate change 100% Climate change 100% Information disclosure 100% Climate change 95%
Misconduct and scandals 100% Protection of minority shareholders (cross-shareholdings, etc.)
100% Information disclosure 100% Other (society) 86% Climate change 89% Health and safety 67%
Information disclosure 100% Capital efficiency 89% Supply chain 100% Health and safety 86% Corporate governance 67% Composition and evaluation of the board of directors
57%
Supply chain 100% Misconduct and scandals 89% Diversity 100% Human rights and local communities
86% Composition and evaluation of the board of directors
56% Human rights and local communities
57%
Diversity 100% Information disclosure 89% Corporate governance 75% Corporate governance 86% Health and safety 56% Corporate governance 52%
Composition and evaluation of the board of directors
83% Supply chain 89% Other (society) 75% Information disclosure 86% Supply chain 52%
Protection of minority shareholders (cross-shareholdings, etc.)
83% Diversity 78% Health and safety 75% Diversity 71% Diversity 52%
Capital efficiency 83% Environmental market opportunities
78% Composition and evaluation of the board of directors
75% Social market opportunities 71% Pollution and resources 52%
Corporate governance 83% Climate change 67% Other (governance) 75% Labor standards 71% Information disclosure 52%
Environmental market opportunities
67% Corporate governance 67% Water resources and water use
75% Composition and evaluation of the board of directors
71% Product and service safety 52%
Health and safety 67% Health and safety 67% Risk management 75% Protection of minority shareholders (cross-shareholdings, etc.)
71% Waste management 52%
Human rights and local communities
67% Human rights and local communities
67% Deforestation 75% Supply chain 71% Labor standards 52%
Other (society) 67% Pollution and resources 67% Environmental market opportunities
71%
Water resources and water use
67% Product and service safety 67% Product and service safety 57%
Biodiversity 67% Waste management 67% Other (governance) 57%
Anti-corruption 67% Labor standards 67% Capital efficiency 57%
Deforestation 67% Other (society) 56% Anti-corruption 57% ▆ E (environment)
Other (governance) 56% Other (ESG) 57% ▆ S (society)
Other (environment) 56% Water resources and water use
57% ▆ G (governance)
Social market opportunities 56% Pollution and resources 57% ▆ Multiple ESG themes
Figure 2: Key ESG Issues Recognized by External Asset Managers
(Note) The above list is of issues cited as “key ESG issues” by more than 50% of external asset managers in each investment method. The figures in the above list indicate the percentage of asset managers that chose the
corresponding issues, with the number of external asset managers in each asset management method as the denominator. For Japanese equities, if an external asset manager adopts both active and passive
investment methods, it is counted in the method for which the investment amount mandated by GPIF is largest.
(Source) Survey of GPIF’s external equity and fixed investment asset managers as of December 2020
GPIF ESG REPORT 2020 24
Chapter 2 Measuring the Im
pacts of ESG ActivitiesChapter 3 Evaluation and Analysis of Clim
ate Change Risks and OpportunitiesChapter 1 GPIF’s ESG Initiatives
Stewardship Activities and ESG Prom
otion

Meanwhile, FIL Investments, which adopts a “bottom-up”
approach to asset management, leverages the insights of active
investment analysts to specify priority issues for engagement,
with the aim of efficiently enhancing beta by promoting change
in large corporations with a significant impact on the equity
index. Specifically, FIL Investments screens for engagement
target companies by selecting those with (i) market capitalization
of ¥1 trillion or greater, and/or (ii) corporate value with expected
improvement of 50% or more. This enables FIL Investments to
focus their engagement efforts on those companies that can
potentially exert a meaningful impact on total market
capitalization. The firm chooses engagement themes based on
issues that lead to corporate value creation, with several new
themes added in 2020. Progress is gauged using three
indicators—input, output, and outcomes, and in 2020 around
90% of target companies showed improvements. Many of the
issues resolved in the past year were related to governance, but
progress was also observed in some problems related to
business strategy.
Stewardship-Focused Passive Investment
In order to diversify and enhance our approach to stewardship
and improve the quality of the entire market through these
activities, in 2018 we selected two external managers – Asset
Management One Co., Ltd. and FIL Investments (Japan) Limited
– as “stewardship-focused passive investment managers.” In
selecting these managers, we focused on (i) the establishment of
appropriate KPIs and (ii) systems and methods of engagement.
Since the compensation level differs from that of normal passive
investment, we conduct an annual review of each manager and
renew these mandates based on each company’s progress on
the KPIs specified in their engagement plans and the next fiscal
year's milestones.
At Asset Management One, experienced analysts and fund
managers from the responsible investment group engage with
companies on ESG themes with the purpose of improving the
TOPIX as a whole. For each company they engage in dialogue
with, the firm selects specific ESG themes to engage on from
among 20 predetermined ESG issues – including digital
transformation from FY2020. Progress on each theme is closely
monitored according to eight milestones, from the identification
of issues to their resolution. When Asset Management One first
began engaging with companies, many themes were not yet at
the “issues recognized” stage, but by 2020, around two-thirds of
these themes had progressed to one of the final four milestones
where companies were taking concrete action towards resolving
the issue. Half of the themes that reached the “completing
engagement” stage in 2020 spanned the entire spectrum of
ESG, such as CSR/ESG management and CSR procurement.
E
E1: Climate changeE2: DeforestationE3: Water resource managementE4: BiodiversityE5: Waste and pollutionE6: Resources and energy management
S
S0: DiversityS1: Human rightsS2: Labor practices/Health and safetyS3: Product liability and safetyS4: Local community
G
G0: Board Governance and accountabilityG1: Capital efficiencyG2: Takeover defense measuresG3: Risk management
ESG
ESG1: CSR/ESG managementESG2: Corporate misconduct ESG3: Regional revitalizationESG4: CSR supply chain managementESG5: Digital transformation (DX)
20 ESG Issues 8 milestones
Figure 3. ESG Issues and Milestones Established by Asset Management One
(Source) Prepared by Asset Management One Co., Ltd.
Identifying ESG issues: ESG analyst identifies and sets out key ESG issues relevant to the company1
Raising concerns/ suggestions: ESG analyst raises concerns or suggestions to the company2
Issues recognized: The company recognizes the ESG issues raised by ESG analyst3
Issues recognized (Senior management): The ESG issues recognized by senior management of the company4
Initiatives taken: The company has taken initial steps to improve/tackle the issues5
Plans formulated: The company has established a concrete plan for solving the issues6
Plans implemented: The company has implemented the plan set out for solutions7
Completing engagement: Effective actions and positive outcome assessed/confirmed by ESG analyst8
Chapter 1 GPIF’s ESG Initiatives
GPIF ESG REPORT 202025

Interviews with Engagement Officers at Stewardship-Focused Passive Managers
(1) What is your view on the effectiveness of engagement under this mandate?
Many of the companies covered by this mandate are being forced to rethink their existing business strategies due to changes in the structure
of their industries. The patient understanding of shareholders who are able to support companies throughout the investment phase is crucial
for them to stay on course in enhancing corporate value over the medium to long term. That is where I see the advantage of passive
management, which allows for sustained engagement. Further, a recent empirical analysis conducted by Professor Kotaro Inoue of the Tokyo
Institute of Technology provided empirical confirmation of the usefulness of engagement skills and expertise that leverage our active
management insights. I see this as an extremely encouraging result that will lead to the success of this mandate. (Please refer to “Empirical
Analysis of Effects of Engagement” on pages 27 and 28.)
(2) Have your expectations of companies and your engagement themes changed in light of the pandemic?
Amid growing risk of unexpected environmental change, such as the COVID-19 pandemic and climate change, it has become even more
important for management to make decisions that are not merely an extension of existing strategies if companies are to improve
medium- to long-term corporate value. We aim to have constructive dialogue with companies by encouraging bold decisions from an
investor standpoint, such as business portfolio revision and business model transformation, as well as the establishment of mechanisms
the lead to highly effective governance and innovation that support such decisions.
●FIL Investments (Japan) Limited
* The descriptions and interviews regarding engagement by Asset Management One Co., Ltd. and FIL Investments (Japan) Limited are intended as disclosure information regarding
GPIF’s stewardship-focused passive managers and are not a recommendation of the products, etc. managed by these two companies.
(1) What are the strengths of passive management engagement?
Passive managers do not sell the shares we own in investee companies but hold them on a semi-permanent basis—much longer
than active managers. Nor do we engage in divestment. ESG is the most effective engagement theme for improving the market as a
whole from an ultra-long-term perspective. Passive managers tend to have a relatively high percentage of ownership of their investee
companies’ stock, which gives them more influence over the investee companies. Moreover, that relationship continues unbroken
over the long term, making it easier to persist with engagement to bring issues to a resolution.
(2) What are your expectations of the Japanese companies that you invest in and with which do you engage?
In what has been described as the VUCA1 era, and with the added trials of the COVID-19 pandemic, many companies are being called on
to address climate change and other social issues. To meet those expectations, we would like to see companies developing long-term
visions that are highly compatible with ESG through broad-ranging internal debate, and to establish medium-term plans to work toward
that vision. Those visions and plans will serve as the foundation from which companies transform their current business strategies into
seamless, sustainable management. The most important point will be how they will implement their initiatives and how effectively they
will be able to promote them to the world. We will also lend them our support through our engagement process.
GPIF asked engagement officers at the two stewardship-focused passive managers about GPIF’s mandate and what they expect
from Japanese companies. GPIF fulfills its duty of accountability by actively disclosing information related to this new mandate
launched in 2018.
●Asset Management One Co., Ltd.
1 Acronym standing for “volatility, uncertainty, complexity, and ambiguity.”
TERASAWA Toru, Head of the Responsible Investment Group, Asset Management One Co., Ltd. (Interviewed in May 2021)
IKAWA Tomohiro, Director of Engagement and Portfolio Manager, FIL Investments (Japan) Limited (Interviewed in May 2021)
GPIF ESG REPORT 2020 26
Chapter 2 Measuring the Im
pacts of ESG ActivitiesChapter 3 Evaluation and Analysis of Clim
ate Change Risks and OpportunitiesChapter 1 GPIF’s ESG Initiatives
Stewardship Activities and ESG Prom
otion

Column
Because the specific details of institutional investor engagements
are not usually made public, it is impossible to tell externally
whether changes in corporate behavior are due to the
effectiveness of that engagement or if they are autonomous
changes made by the companies themselves. Therefore, until
now, limited data availability and other issues have severely
limited the amount of empirical research on engagement
effectiveness. Recently, however, a number of major asset
managers provided a group led by Professor Kotaro Inoue of
Tokyo Institute of Technology (“K. Inoue Lab”) with information on
their engagement activities targeting Japanese companies, which
the group used to review each manager’s reasons for selecting
the companies to engage with, what kind of dialogue it held with
whom, and the effect that those engagements had.1
This column introduces K. Inoue Lab’s review of
engagements conducted by FIL Investments (Japan) Limited (FIL),
one of GPIF’s stewardship-focused passive managers. The
analysis covers a total of 248 dialogues that FIL conducted with
117 companies with shared KPIs and deadlines by FIL for
achieving the objective of improving corporate value from 2017
to 2019. The analysis includes engagements other than those
related to the stewardship-focused passive manager mandate,
but does not include the several thousands of interviews it
conducts with companies every year (Figure 1).
The results of the analysis showed that companies targeted for
engagement by FIL are characterized by (i) a high percentage of
share ownership by FIL and high portfolio weight and (ii) a low Tobin’s
Q2 (low ratio of market value to book value) (Figure 3, left column).
1. Hidaka, Ikeda, and Inoue, Motivations and Effects of Engagement by Institutional Investors (2021 RIETI Discussion Paper).
2. In this article, calculated using Tobin’s Q ([market value + total liabilities] divided by total assets)
3. This is entirely the opinion of FIL and is not the opinion of GPIF.
(Note) If a single dialogue covered discussion of multiple themes, it was counted multiple times in each of those themes.
(Source) Produced by K. Inoue Lab, Tokyo Institute of Technology, based on data provided by FIL
Year
DialogueDialogue Theme
Dialogue with CEOEnvironment/Society Governance Capital Policy
No. of Companies
Total Dialogues
No. of Dialogues
Percentage (%)
No. of Dialogues
Percentage (%)
No. of Dialogues
Percentage (%)
No. of Dialogues
Percentage (%)
2017 41 61 18 29.5 58 95.1 31 50.8 14 23.0
2018 59 75 42 56.0 72 96.0 30 40.0 7 9.3
2019 70 112 45 40.2 106 94.6 73 65.2 8 7.1
Total 117 248 105 42.3 236 95.2 134 54.0 29 11.7
Figure 1. Analysis of Effects of Engagement by FIL Investments (Japan) Limited
Empirical Analysis of Engagement Effectiveness
GPIF believes that active dialogue between asset managers and companies is essential in improving market sustainability and
enhancing investment returns. In addition to initiatives such as our survey of listed companies, we follow up on various empirical
studies conducted by academics in order to understand the state of engagement and verify its effectiveness. In this column, we
present one such study.
GPIF ESG REPORT 202027

In this analysis of engagement effectiveness, profit indicators
such as ROA (return on assets) and ROE (return on equity),
corporate value assessment indicators such as PBR (price-to-
book ratio) and Tobin’s Q, and corporate governance indicators
such as the ratio of cross-shareholdings to total assets and
whether the company had takeover defense measures were
selected as dependent variables. This column presents
particularly noteworthy areas in which the analysis confirmed the
effectiveness of FIL’s engagement activities.
First, with respect to corporate governance, engagement
effectiveness was confirmed by (i) decreases in the ratio of
cross-shareholdings to total assets and (ii) the scrapping of
takeover defense measures (Figure 2, left column). FIL considers
both of these governance issues to be particularly problematic
from the perspective of long-term investors.3 They believe that
cross-shareholdings can lead to management complacency as it
is an arrangement in which the company ensures stable
business from clients in exchange for unconditional approval of
the client’s management proposals during proxy voting. FIL has a
similar view of takeover defense measures, namely that they
reduce the incentive for management to improve corporate value
during normal times and work to earn the trust of existing
shareholders.
An analysis of the impact of engagement on share price also
provides evidence that FIL’s engagement approach is effective.
As mentioned above, companies targeted for engagement by FIL
are characterized by a low Tobin’s Q, but particularly in cases in
which FIL was able to engage in dialogue with the CEO after
sharing their issues of concern, the company’s Tobin’s Q was
shown to increase (Figure 3, right column).
(Note1) The figures for “engagement effect” are coefficients of multiple regression analysis, controlling for various factors such as seasonality and individual company attributes.
They indicate the difference between before and after engagement. *** and ** indicate statistical significance at the 1% and 5% level, respectively.
(Note2) Engagement effectiveness was analyzed based on the values one year after engagement.
(Source) Produced by K. Inoue Lab, Tokyo Institute of Technology, based on data provided by FIL
(Note1) The figures for “engagement effect” are coefficients of multiple regression analysis, controlling for various factors such as seasonality and individual company attributes.
They indicate the difference between before and after engagement. *** indicates statistical significance at the 1% level.
(Note2) Engagement effectiveness was analyzed based on the values one year after engagement.
(Source) Produced by K. Inoue Lab, Tokyo Institute of Technology, based on data provided by FIL
Variable Engagement Effect (2018–2020) Ref: Average of all listed companies (2017–2020)
Cross-shareholdings (%, percentage of total assets) -0.784** 4.431
Existence of takeover defense measures (0, 1) -0.111*** 0.099
VariableDifference between engagement target companies
and the average for all listed companies (2017–2019)
Engagement effect of achieving dialogue with CEO (2018–2020)
Tobin's Q -0.480*** 0.147***
Figure 2. Effect of Engagement on Corporate Governance
Figure 3. Effect of Engagement on Corporate Value (Tobin’s Q)
GPIF ESG REPORT 2020 28
Chapter 2 Measuring the Im
pacts of ESG ActivitiesChapter 3 Evaluation and Analysis of Clim
ate Change Risks and OpportunitiesChapter 1 GPIF’s ESG Initiatives
Column: Em
pirical Analysis of Effects of Engagement

Topics Discussed with Index Providers and ESG Ratings Agencies
In the press release “ESG Indices Selected” announcing the adoption
of ESG indices for Japanese equities in July 2017, GPIF explained
that it emphasized three major points in its selection of ESG indexes,
namely (i) that the index uses a “positive screening” methodology, in
other words that equities with high ESG scores are selected; (ii) that
ESG is evaluated based on publicly available information and the
assessment methods and results would be disclosed; and (iii) that
the governance frameworks and conflict-of-interest management of
ESG ratings agencies and index providers are robust. Almost four
years have passed since then, and GPIF believes that the importance
of those three points has in no way diminished. This section provides
details on GPIF’s engagement with index providers and ESG ratings
agencies since the adoption of ESG indexes with regards to these
three points.
Engagement with Index Providers and ESG ratings agenciesGPIF has been actively engaging in dialogue with index providers and ESG ratings agencies since selecting ESG indexes
for Japanese equities in 2017. We have held an ongoing dialogue with these agencies regarding (1) the expansion of
companies subject to ESG rating; (2) the promotion of dialogue between ESG ratings agencies and companies; (3)
improvement of ESG rating methods; and (4) the governance frameworks of ESG ratings agencies and index providers.
Figure 1. Key Evaluation Points of ESG Index Selection and Topics Discussed with Index Providers and ESG Ratings Agencies
Evaluation point (i) Emphasis on ESG, positive screening is key
● Emphasize ESG rating as the central element of the index
● Positive screening based on ESG evaluation is key
● Favor indexes that offer opportunities for a wide range of companies to be selected for the index in order to improve the overall market
Dialogue theme: (1) Expansion of ESG rating coverage
Evaluation point (ii) Promotion of disclosure (based on publicly released information), improvement of rating methodologies
● Encouraging companies to disclose more ESG information and improving ESG rating methodologies are essential to enhancing the precision of ESG ratings.
● Both FTSE and MSCI have a policy of actively disclosing their ESG rating methodologies and results in detail, providing feedback on rating outcomes to
companies, holding dialogue with investors that use their ESG indexes, and linking the outcomes to the improvement of ESG ratings.
Dialogue themes: (2) Promotion of dialogue with companies; (3) improvement of ESG rating methodologies
Evaluation point (iii) Management of governance frameworks and conflicts of interests by ESG ratings agencies
● Unlike market capitalization-weighted indexes, there is plenty of room in ESG indexes for human intervention, such as by analysts, in ESG rating and
index construction.
To ensure the continuity, transparency, and neutrality of ESG evaluation, the governance frameworks and conflict-of-interest management of ESG ratings
agencies and index providers are extremely important.
Dialogue theme: (4) Governance frameworks of ESG ratings agencies and index providers
(Source) Prepared by GPIF based on the press release, “ESG Indices Selected” (released July 2017)
Chapter 1 GPIF’s ESG Initiatives
GPIF ESG REPORT 202029

Expansion of ESG Rating Coverage
When selecting ESG indexes, GPIF has emphasized the
importance of providing a broad range of companies with the
opportunity to be selected as constituents, rather than
categorically excluding specific industries or companies from
eligibility. This is based on our belief that the possibility of index
inclusion acting as a driver to encourage companies to improve
their ESG profiles is key to enhancing the sustainability of the
market as a whole
Despite this, ESG index eligibility is naturally constrained by
the ESG rating universe. In many cases, companies are excluded
from eligibility merely because they are not covered by the relevant
ESG ratings agency, and in our survey of listed companies, many
have called for an expansion of ESG rating coverage.
On the other hand, for ESG ratings agencies, expanding the
coverage universe means hiring more analysts and a greater
investment of management resources. Over the course of
multiple discussions with them, however, the ratings agencies
have indicated that they understand the importance of expanding
the ratings universe, and both FTSE and MSCI have made major
strides in increasing the number of companies they cover (Figure
2). As a result, the number of stocks eligible for the MSCI Japan
ESG Select Leaders Index and the MSCI Japan Empowering
Women Index increased to the 700 largest stocks by market
capitalization in November 2018 and November 2019,
respectively. For the FTSE Blossom Japan Index, the scope of
companies eligible for inclusion expanded significantly to include
small-cap stocks in December 2020.
Currently, limited management resources and other issues have
impeded information disclosure for smaller companies as opposed to
larger ones. Even compared with foreign companies of a similar size,
these smaller companies have lower ESG scores. We hope that
expanding ESG index inclusion eligibility to small-cap stocks leads to
greater interest in ESG ratings by smaller companies, and ultimately
an enhancement of their ESG initiatives (Figure 3).
(Note1) Data is as of March 2021.
(Note2) FTSE Japan All Cap Index constituent stocks used for calculation.
(Source) FTSE Russell
Figure 3. Rate of Reporting and ESG Ratings of Japanese Companies by Size
Figure 2. Trends in Japanese Equities Included in ESG Rating Universe (FTSE, MSCI)
Rate of integrated report/ESG report publishing(%)
CDP response rate (%) FTSE ESG rating (simple average)
Large-cap 39 53 2.98
Medium-cap 33 32 2.32
Small-cap 10 4 1.58
(Note) In a media release dated June 11, 2021, MSCI announced that the number of Japanese stocks subject to ESG rating had expanded to 1,274, covering all stocks in the MSCI Japan IMI Index.
(Source) FTSE Russell. Reproduced by permission of MSCI ESG Research LLC ©2021.
(Number of Companies)
2017/3 2018/3 2019/3 2020/3 2021/30
300
600
900
1,200
1,500
597713 732
1,311
978
1,352
760 754760 755
MSCI FTSE
GPIF ESG REPORT 2020 30
Chapter 2 Measuring the Im
pacts of ESG ActivitiesChapter 3 Evaluation and Analysis of Clim
ate Change Risks and OpportunitiesChapter 1 GPIF’s ESG Initiatives
Engagement w
ith Index Providers and ESG ratings agencies

Improvement of ESG rating methodologies
As GPIF’s investments are predominantly passive, index providers
and ESG ratings agencies play a pivotal role in the success or
failure of our fund management. GPIF engages in dialogue with
index providers and ESG ratings agencies to improve the
sustainability of the market and enhance our long-term
investment performance. In our press release in July 2017
announcing the selection of ESG indexes for Japanese equities,
we pointed out that ESG ratings vary widely among ratings
agencies, and that more accurate ESG ratings would require
better ESG information disclosure by companies and improved
ESG rating methodologies.
We have seen some positive changes with respect to the
former, with a greater number of large-cap companies in
particular producing integrated reports and ESG reports, and
an increase in the number of companies disclosing
information on climate change risks and opportunities in line
with the TCFD framework.
(Source) Reproduced by permisson of MSCI ESG Research LLC ©2020.
Promotion of Dialogue with ESG Ratings Agencies and Companies
As in previous years, GPIF conducted feedback meetings with
ESG ratings agencies during fiscal 2020 to discuss the inquiries
and opinions they received from the companies that they rate.
More and more firms are consulting with ESG ratings agencies
over the course of the rating process, and according to MSCI,
Japanese firms are among the companies that contact them the
most out of the world’s major economies. (Figure 4).
The percentage of companies that consult with FTSE during
the ESG rating process is also rising, and data from FTSE clearly
shows that the more actively a company consults with them, the
greater the improvement in their ESG rating. This trend was also
seen in an analysis by MSCI.
Figure 4. Percentage of Companies Consulting with MSCI During the ESG Rating Process
(%)
2016 2017 2018 2019 20200
102030405060708090
Japan Europe North America Other (APAC excluding Japan)
Chapter 1 GPIF’s ESG Initiatives
GPIF ESG REPORT 202031

Meanwhile, ESG ratings agencies are also working to improve
their methodologies. When they consider changing these
methodologies, ESG ratings agencies provide end users such
as asset managers and pension funds with an opportunity to
express their opinions (consultations), similar to when they
consider changes to index methodologies. In addition to
regular dialogue, GPIF actively exchanges opinions with ESG
ratings agencies through consultations and other
opportunities. FTSE and MSCI are working to improve their
rating methods through continuous engagement with GPIF
and other ESG rating users (Figure 5).
There are currently significant discrepancies in ESG
ratings between different agencies. Since analysts’
opinions differ even in their assessment of companies
based on financial information, we will likely never see a
complete convergence in their assessment of companies
based on non-financial ESG information. Nevertheless,
GPIF believes that ESG information needs to be reflected
in the evaluation of companies in more appropriate ways,
by improving rating methods, enhancing information
Figure 5. Major Changes in FTSE and MSCI ESG Rating and Index Methodologies since 2017
FTSE Changes
Timing Major Changes
December 2017
ESG Rating: Update of climate change theme
Background: Response to climate change initiatives, e.g., TCFDDetails: Added research points on identification of risks and opportunities, scenario analysis, internal carbon pricing, etc.
December 2018
ESG Rating: Update of water security theme
Background: Efforts to further align with initiatives such as CDP, WBCSD (World Business Council for Sustainable Development), and GRIDetails: Added research points on governance, risk management, strategies, etc. concerning water security
December 2019
ESG Rating: Update of human rights theme
Background: Response to update of SASB, CHRB (Corporate Human Rights Benchmark), and UN Guiding Principles on Business and Human RightsDetails: Added research points on internal supervision of human rights, human rights training, implementation of mitigation measures, etc.
ESG Rating: Update of tax transparency theme
Background: Encourage improved disclosure by large-cap companies with high domestic sales ratios Details: Previously, only large-cap companies with a ratio of sales in high-risk countries of more than 30% had been targeted, but now all companies classified as large-cap companies are targeted regardless of country and sales.
September 2020
Change in index methodology: Change in threshold for inclusion in the FTSE Blossom Japan Index
Details: Changed from 3.1 to 3.3 (exclusion threshold also raised from 2.7 to 2.9 in line with this change)
December 2020
Change in index methodology: Change in FTSE Blossom Japan parent index
Details: The Blossom index’s parent index was changed from the FTSE Japan Index (large-cap and medium-cap equities) to the FTSE Japan All Cap Index (large-, medium- and small-cap equities). 12 small-cap equities were included in the Blossom Index as a result of this change.
MSCI Changes
Timing Major Updates
November 2018
Change in index methodology: Expansion of eligible universe for MSCI Japan ESG Select Leaders Index
Details: The parent index was changed from the MSCI Japan IMI Top 500 Index to the Top 700 Index to reflect expanded coverage of ESG ratings. Rebalancing frequency was also changed from annual to semi-annual for more timely reflection of ESG rating information.
November 2019
Change in index methodology: Expansion of eligible universe for MSCI Japan Empowering Women Index (WIN)
Details: The parent index was changed from the MSCI Japan IMI Top 500 Index to the Top 700 Index to reflect expansion of gender diversity score coverage.
November 2020
ESG Rating: Change in governance pillar
Details: A new theme, Corporate Behavior, was established in the Governance Pillar. This theme consists of the key issues of Business Ethics and Tax Transparency, and is applied to the ESG ratings of all companies alongside the Corporate Governance theme.
ESG Rating: Change in rating methodology for the financial sector
Background: Increased importance of climate change risk exposure analysis for banks, such as reporting in line with TCFD recommendations.Details: Added climate risk analysis and environmental opportunity factors for loans and expanded scope of financing projects covered by the Financing Environmental Impact assessment. Standardized risk levels among companies in the Consumer Financial Protection assessment.
ESG Rating: Addition of Community Relations as key issue
Background: Issues related to community relations had previously been divided into two key issues (Biodiversity & Land Use, Corruption & Instability) depending on what was being affected (the environment or communities).Details: Established new key issue of Community Relations in the Stakeholder Opposition theme, merging issues related to community relations into a single key issue.
(Source) Prepared by GPIF based on data from FTSE and MSCI. FTSE Russell. Reproduced by permission of MSCI ESG Research LLC ©2021.
GPIF ESG REPORT 2020 32
Chapter 2 Measuring the Im
pacts of ESG ActivitiesChapter 3 Evaluation and Analysis of Clim
ate Change Risks and OpportunitiesChapter 1 GPIF’s ESG Initiatives
Engagement w
ith Index Providers and ESG ratings agencies
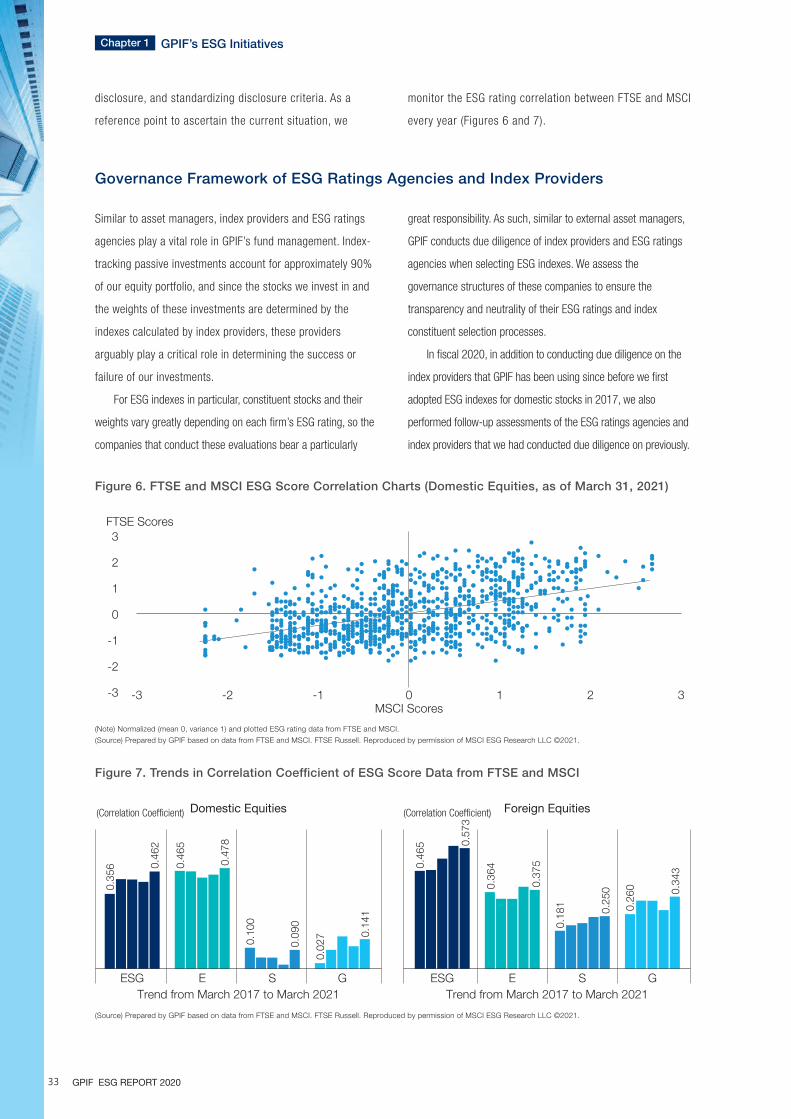
Governance Framework of ESG Ratings Agencies and Index Providers
Similar to asset managers, index providers and ESG ratings
agencies play a vital role in GPIF’s fund management. Index-
tracking passive investments account for approximately 90%
of our equity portfolio, and since the stocks we invest in and
the weights of these investments are determined by the
indexes calculated by index providers, these providers
arguably play a critical role in determining the success or
failure of our investments.
For ESG indexes in particular, constituent stocks and their
weights vary greatly depending on each firm’s ESG rating, so the
companies that conduct these evaluations bear a particularly
great responsibility. As such, similar to external asset managers,
GPIF conducts due diligence of index providers and ESG ratings
agencies when selecting ESG indexes. We assess the
governance structures of these companies to ensure the
transparency and neutrality of their ESG ratings and index
constituent selection processes.
In fiscal 2020, in addition to conducting due diligence on the
index providers that GPIF has been using since before we first
adopted ESG indexes for domestic stocks in 2017, we also
performed follow-up assessments of the ESG ratings agencies and
index providers that we had conducted due diligence on previously.
Figure 7. Trends in Correlation Coefficient of ESG Score Data from FTSE and MSCI
Figure 6. FTSE and MSCI ESG Score Correlation Charts (Domestic Equities, as of March 31, 2021)
(Source) Prepared by GPIF based on data from FTSE and MSCI. FTSE Russell. Reproduced by permission of MSCI ESG Research LLC ©2021.
(Note) Normalized (mean 0, variance 1) and plotted ESG rating data from FTSE and MSCI.
(Source) Prepared by GPIF based on data from FTSE and MSCI. FTSE Russell. Reproduced by permission of MSCI ESG Research LLC ©2021.
disclosure, and standardizing disclosure criteria. As a
reference point to ascertain the current situation, we
monitor the ESG rating correlation between FTSE and MSCI
every year (Figures 6 and 7).
FTSE Scores
MSCI Scores-3 -2 -1 0 1 2 3-3
-2
-1
0
1
2
3
Trend from March 2017 to March 2021
(Correlation Coefficient)
ESG E S G G
Domestic Equities
Trend from March 2017 to March 2021
(Correlation Coefficient)
ESG E S
Foreign Equities
0.35
6 0.46
2
0.46
5
0.47
8
0.10
0
0.09
0
0.02
7 0.14
1
0.46
5 0.57
3
0.36
4
0.37
5
0.18
1 0.25
0
0.26
0 0.34
3
Chapter 1 GPIF’s ESG Initiatives
GPIF ESG REPORT 202033

How would you describe the characteristics, strengths, and weaknesses of Japanese companies’ ESG initiatives in
comparison with other countries?
Japanese companies’ ESG initiatives have improved dramatically in recent years and are fast closing in on those of European
companies. This is because Japanese companies communicate with us more than the global average and are making efforts to
better understand how to improve their disclosures. Although the environmental scores of Japanese large-cap companies are lower
than their European counterparts, they are higher than U.S. companies and are on par with the average score for developed
countries. Combined with the fact that many companies are posting green revenue, Japanese companies are at an advantage at a
time when investors are starting to shift their portfolios to Paris Agreement targets. One area in which Japanese companies do need
to improve is corporate governance. When it comes to highly transparent information disclosure and building strong governance and
monitoring frameworks, Japanese companies are lagging behind companies in other developed countries.
What are your expectations of companies regarding their approaches to ESG?
Given the growing expectations from investors, there is an emerging need for companies to place more emphasis on sustainability in their
business decision-making processes. Securing transparency is also important, and consistent, accurate disclosure in line with international
standards such as TCFD has become essential not just for the IR and CSR divisions, but for the entire company and its executive
management. The expectation is that sustainability reports will become just as important as financial reports and that they will provide
supplementary viewpoints on material impacts on business. What investors want to see is not appealing stories about how companies are
putting sustainability into practice, but data with which they can measure companies’ clear commitment and state of progress.
What kind of changes are taking place in the world in terms of companies’ ESG initiatives?
There have been some noteworthy developments in companies’ efforts to respond to climate change and social inequality. (These
issues are also featured in MSCI’s 2021 ESG Trends to Watch.) A growing number of companies are announcing their commitments
to reducing greenhouse gas emissions to net zero by 2050 to address the climate change crisis.1 Some companies have also
announced their commitment to promoting further diversity in employment and promotion to address the problem of social inequality
that has been highlighted and exacerbated by the COVID-19 pandemic.2
What kinds of changes are you considering in your company's ESG rating methodology going forward?
To accelerate the transition to a net zero economy, we are focusing on the development of leading-edge analytical tools that will help
institutional investors and companies to measure climate change-related risks appropriately and to align their investment and business
activities with the path toward net zero.
We will also continue to explore how to make use of exciting new alternative data sources that will enable companies to analyze the
risks and opportunities they face regarding a variety of ESG issues, from social inequality to biodiversity, as well as initiatives to manage those
risks and opportunities in more detail.
Interviews with ESG Rating Officers
1. The Role of Capital in the Net-Zero Revolution, MSCI, April 2021; 2021 ESG Trends to Watch, MSCI ESG Research, December 2020.
2. 2021 ESG Trends to Watch, MSCI ESG Research, December 2020.
Jaakko Kooroshy, Head of Sustainable Investment Data & Methodologies, FTSE Russell (Interviewed in May 2021)
Linda-Eling Lee, Global Head of ESG Research, MSCI Inc. (Interviewed in May 2021)
●MSCI
●FTSE Russell
GPIF ESG REPORT 2020 34
Chapter 2 Measuring the Im
pacts of ESG ActivitiesChapter 3 Evaluation and Analysis of Clim
ate Change Risks and OpportunitiesChapter 1 GPIF’s ESG Initiatives
Engagement w
ith Index Providers and ESG ratings agencies

ESG in Alternative Assets
The holding period for alternative assets (infrastructure, real
estate, and private equity) is generally quite long, and in some
cases, the asset manager itself is involved in the corporate
management and business operations of the investee. As a
result, more asset managers are focusing on integrating ESG into
their investment processes in order to identify the risks
encountered during the holding period and, conversely, to find
opportunities for sustainable asset value growth and
improvement of corporate value. This trend is particularly
prominent among overseas asset managers.
Although we use the collective phrase “alternative asset
management,” material ESG factors actually differ depending on
the individual characteristics of the asset and/or business in
question. The asset manager’s individual investment strategies
also make a difference in the ESG initiatives they engage in. With
an understanding of these differences, GPIF as an asset owner
assesses asset managers’ approach to ESG and monitors the
status of their investment.
(1) ESG Ratings When Selecting Asset Managers
Since it began selecting alternative asset managers that adopt a
multi-manager strategy in April 2017, GPIF has added an
examination of prospective asset managers’ ESG initiatives to its
screening criteria. Screenings are conducted from many different
aspects, including through due diligence questionnaires,
interviews with ESG staff, and evaluations by third-party
consultants. Among other things, we look at the manager’s
company-wide ESG policies, ESG integration in the investment
process, their oversight systems and how they report to investors
after an investment is made. All asset managers selected by
GPIF have signed the Principles for Responsible Investment (PRI).
(2) Post-Investment Monitoring
As of yet, there is still no standardized rating criteria for ESG
factors that can be applied across all alternative assets. As such,
each asset manager creates their own unique ESG rating criteria
and scoring methodology based on the characteristics of the asset
and the fund manager’s investment strategy. GPIF monitors asset
managers for any changes in their ESG-related organizational
structure, whether or not the diversified funds in which they invest
are PRI signatories, and the status of their ESG initiatives. In
addition to requiring individual asset managers to provide a report
detailing the status of their ESG-related investment capabilities and
initiatives, we engage in regular dialogue with them to understand
the state of the ESG-related aspects of their portfolios.
ESG in Alternative Asset ManagementGPIF engages in initiatives to properly integrate ESG in the alternative asset manager selection and monitoring process. In
this report, we conduct a quantitative analysis of climate change risks for domestic real estate in which GPIF invests
through private funds.
Chapter 1 GPIF’s ESG Initiatives
35 GPIF ESG REPORT 2020

Analysis of Real Estate Portfolio Using Climate Value-at-Risk
Integrating ESG into Real Estate Investments Integrating ESG into Infrastructure Investments
In its climate-related financial disclosures for fiscal 2020, GPIF
conducted a quantitative analysis of the climate change risks for
domestic real estate in which GPIF invests through private funds.
Physical Risks
The physical risk analysis assessed risks related to (1) coastal
flooding, (2) fluvial flooding, (3) tropical cyclones, (4) extreme
heat, and (5) extreme cold by sector.
The results of the analysis indicated high risk from (3)
tropical cyclones and (4) extreme heat across all sectors. On the
other hand, physical risks to the portfolio arising from (1) coastal
flooding and (2) fluvial flooding, which are of particular concern
in Japan, are low despite the inclusion of a very small number of
properties exposed to a high risk of coastal and other flooding.
As a result, a comprehensive assessment of all physical risks
from (1) to (5) indicate “low” or “very low” risk across all sectors.
Transition Risks
In the transition risk analysis, we measured the carbon intensity
(greenhouse gas emissions per area) of each property, and
estimated the reduction in carbon intensity required by 2033 in order
to achieve temperature targets of 1.5°C, 2°C, and 3°C targets.
Results indicated that emissions needed to be reduced by a
total of 32.8 CO2 equivalent tons per square meter over the next
ten years or so in order for the portfolio analyzed to achieve the
1.5°C target.
The analysis also confirmed that the current warming
potential is currently 2.78°C, which is higher than the 2°C and
1.5 °C targets set by the Paris Agreement.
There are several limitations inherent this analysis, including the
fact that the average value for each sector was used for properties
for which information could not be obtained, and as such, there is
room to improve the accuracy of results. We will continue to engage
in dialogue with external asset managers to encourage further
disclosure of portfolio climate-related risk and risk management.
Investment Example
Medical offices building owned by a U.S. real estate fund in which GPIF has
invested. This facility has installed systems that automatically collect and
analyze environmental efficiency.
Investment Example
The portfolio of wind farms in which GPIF has jointly invested with a
Canadian public pension fund. The portfolio has facilities already in operation
with a capacity of approximately 4.7 GW, along with other facilities under
construction or in development totaling more than 10 GW. Stable revenue is
ensured through long-term power purchase agreements.
* Please refer to pages 63 and 64 for details of this analysis.
Increasingly stringent regulations on buildings’ environmental
performance and greenhouse gas emissions have made the
collection and analysis of data on energy use and CO2 emissions
generated from buildings owned essential for the real estate
sector. Many companies have installed integrated systems for
managing such data in order to monitor the effectiveness and
progress of energy conservation measures.
The infrastructure market is witnessing a surge of investment in
renewable energy projects such as wind and solar power as
individual countries pursue initiatives to reduce greenhouse gas
emissions by lowering their rate of fossil fuel power generation.
This is becoming a major investment sector as investors can
expect to earn stable revenue through long-term power purchase
agreements and various government support measures.
36GPIF ESG REPORT 2020
Chapter 2 Measuring the Im
pacts of ESG ActivitiesChapter 3 Evaluation and Analysis of Clim
ate Change Risks and OpportunitiesChapter 1 GPIF’s ESG Initiatives
ESG in Alternative Asset Managem
ent

2015
2018
Both the Thirty Percent Coalition in the U.S. and the 30%
Club in the U.K. are initiatives that seek greater diversity in
listed company boards by increasing the proportion of
female board members to 30%. GPIF has participated in
the Thirty Percent Coalition in the U.S. and the Investor
Group of the 30% Club in the U.K. as an observer since
November 2016. Since December 2019, we have also
participated in the 30% Club Japan Investor Group.
Joined the Thirty Percent Coalition and the 30% Club
November 2016
GPIF has been stepping up its ESG initiatives since it signed
the PRI in September 2015. Every year, we report our ESG
initiatives to the PRI and receive a full assessment on how
we are progressing. We also participate in various
committees, including the Asset Owner Advisory Committee,
SDGs Advisory Committee, and Japan Network Advisory
Committee. We received an A+, the highest rating, for
strategy and governance in our 2020 assessment.
Signed the Principles for Responsible Investment
September 2015
Climate Action 100+ is an investor-led climate change initiative
launched in September 2017. Members of this initiative hold
constructive dialogues with companies that have a significant
impact on the resolution of climate change issues. Participants
discuss improving climate change-related governance, making
efforts to reduce greenhouse gas emissions, and enhancing
information disclosure. Currently, 545 investors1 participate in
the initiative, including pension funds and other asset owners
as well as asset managers. GPIF has participated in Climate
Action 100+ as a supporter since October 2018, and also
participates as an asset owner in the Asia Advisory Group
(AAG), which advises the Steering Committee on circumstances
and conditions in the Asia region.
Joined Climate Action 100+October 2018
1 As of June 30, 2021.
In 2018, GPIF and the World Bank Group published a joint
research paper entitled “Incorporating Environment, Social
and Governance (ESG) Factors into Fixed Income
Investment.” Following up on this research, in April 2019,
the International Bank for Reconstruction and Development
(IBRD) and the International Finance Corporation (IFC)
– both members of the World Bank Group– drew up a new
proposal to provide GPIF’s external asset managers with
an opportunity to invest in green bonds. This initiative has
led to partnerships with other international financial
institutions and governmental financial institutions in
various countries.
Published a Joint Research Paper with the World Bank Group
April 2018
2016
Collaboration with Overseas Public Pension Funds and Other InstitutionsGPIF collaborates with a wide range of domestic and foreign institutions. In fiscal 2020, GPIF joined the JPX ESG Knowledge Hub, which
was set up by the Japan Exchange Group (JPX), as a supporter.
Chapter 1 GPIF’s ESG Initiatives
37 GPIF ESG REPORT 2020

20192020
GPIF declared our support for the recommendations of
the Task Force on Climate-related Financial Disclosures
(TCFD) in December 2018. We commenced information
disclosure in accordance with the TCFD
recommendations in August 2019 with our ESG Report
2018 and have done so every year since.
Declared Support for the TCFD
December 2018
The ESG Knowledge Hub, established by the Japan Exchange Group (JPX), is a
platform that aims to encourage listed companies to disclose ESG information by
providing one-stop access to content and information that will assist in
understanding ESG investment. Another goal of the Hub is to eventually form a
community linking listed companies with investors and related organizations. GPIF
joined the ESG Knowledge Hub as a supporter when it was first established in
November 2020.
https://www.jpx.co.jp/corporate/
sustainability/esgknowledgehub/
index.html
Joined JPX ESG Knowledge HubNovember 2020
The International Corporate Governance Network (ICGN) is an
international network of institutional investors and other organizations.
It promotes better corporate governance and stewardship activities
with the aim of advancing efficient markets and sustainable
economies. GPIF joined ICGN in August 2019.
Joined ICGNAugust 2019
The Council of Institutional Investors (CII) is a network of
institutional investors established by U.S. public pension funds,
with the aim of advocating and collaborating in the areas of
shareholder rights and corporate governance in the U.S. GPIF
joined CII in August 2019.
Joined CIIAugust 2019
Joint research with ANU on the diversification and portfolio efficiency effect of ESG investment
In a joint research project with the Australian National University (ANU), GPIF is engaged in studying the efficiency of ESG investment through
time series, cross-country and other quantitative analyses. In particular, this project aims to achieve unique, leading-edge results by using
regime switching models and other sophisticated methods to detect and analyze the conditions of regime changes.
Joint research with Kyoto University on exploration of corporate value in the post-pandemic society
Kyoto University is currently conducting research aimed at the development of methods to measure the social values of diverse stakeholders and the
prediction of future trends in a society in which more emphasis is placed on social value post-pandemic. GPIF is participating in this research as part of
a study of the effectiveness of ESG investment, assisting with questionnaire surveys of stakeholders and data analysis.
Column
38GPIF ESG REPORT 2020
Chapter 2 Measuring the Im
pacts of ESG ActivitiesChapter 3 Evaluation and Analysis of Clim
ate Change Risks and OpportunitiesChapter 1 GPIF’s ESG Initiatives
Collaboration with Overseas Public Pension Funds and Other Institutions

Although ESG indexes remained robust when stock prices
plummeted due to the COVID-19 pandemic at the end of fiscal
2019, they have lagged slightly in the rebound phase since
the beginning of fiscal 2020. We have seen that companies
with high ESG ratings generally have lower risk of declining
sharply, but tend to perform relatively weaker when value
stocks are favored. This trend is fairly consistent with our
intuitive understanding of companies with high ESG ratings.
ESG factors are sources of potential long-term risk and
opportunity, and as a cross-generational investor, GPIF strives
to secure long-term investment returns by taking these into
account when investing. Having said that, allowing our
portfolio to deviate from our current policy benchmarks
unconditionally in order to curb or avoid future ESG risks can
potentially cause greater than expected short-term
performance swings. Balancing both short-term risks and
future ESG risks is enormously difficult, but we will constantly
strive to find the optimal balance between the two.
Fiscal 2020 also witnessed many positive changes for
ESG investment. As reported in this ESG Report, the scope of
ESG rating coverage of Japanese equities is expanding
rapidly, which is an extremely positive development.
Previously, small-cap equities were not included in ESG
indexes because they had not been given ESG ratings, which
lead to small-cap companies being automatically excluded
from ESG indexes and therefore causing unintended
investment risk (size bias). Another more fundamental
problem was that, even though ESG-conscious management
is necessary to enhance sustainability regardless of the size
of the company, inclusion in ESG indexes was not serving as
an incentive for small-cap companies. A larger scope of
companies being given ESG ratings allows us work towards
making improvements in these areas.
On the other hand, high-quality disclosure by companies
is a prerequisite for investors to be able accurately reflect ESG
factors into investment decisions. In recent years, a growing
number of Japanese companies have been producing
integrated reports and disclosing information in line with TCFD
recommendations, and we hope to see the emergence of a
virtuous cycle in which GPIF’s ESG initiatives provide an
incentive for companies to disclose ESG information, leading
in turn to the improvement of the quality of ESG investments.
Regarding ESG-conscious stewardship activities, this
report describes stewardship focused passive investments in
detail, but we also feel that the quality of engagement of other
external asset managers is also steadily improving. We will
continue to support constructive dialogue between external
asset managers and companies and measure the outcomes of
these engagements.
Review of ESG Activities and Future OutlookIn fiscal 2020, positive changes continued to be observed in companies’ ESG initiatives and in ESG ratings agencies in the
improvement of their rating methods. We will continue working to secure long-term investment returns by stepping up our
ESG initiatives in cooperation with a number of different partners.
Executive Managing Director and Chief Investment Officer (CIO)
UEDA Ei j i ,
Chapter 1 GPIF’s ESG Initiatives
39 GPIF ESG REPORT 2020

Global Approaches to Climate Change and Actions Taken by Japanese Companies
Column
As the world’s major nations commit to reducing greenhouse gas
emissions to net zero, central banks, financial institutions, and
companies are also undertaking various initiatives related to
climate change. In June 2020, based on the Action Plan on
Sustainable Finance, the EU released the final version of a
“taxonomy” that provides a clear and common definition of what is
“green.” In March 2021, the EU Sustainable Finance Disclosure
Regulation (SFDR) came into effect, and institutional investors
subject to the regulation will be required to disclose sustainability
information beginning from the end of June 2021.
More than 90 institutions1 have joined the Network of Central
Banks and Supervisors for Greening the Financial System (NGFS)
and are actively engaged in various initiatives such as developing
scenarios for climate change-related analysis.
The TCFD Recommendations published in 2017 are becoming
the standard for the disclosure of climate change risks and
opportunities, and the number of institutions endorsing the TCFD
has climbed to more than 2,300.1 In December 2020, the U.K.’s
Financial Conduct Authority introduced a new rule for commercial
companies with a U.K. premium listing, where subject firms must
disclose in line with the recommendations of the TCFD from 2021.
In Japan, the Stewardship Code was revised a second time in
March 2020, and states that institutional investors should hold
dialogues with companies based on “consideration of sustainability
according to investment strategy.” The second revision of the
Corporate Governance Code was also published in June 2021.
Based on this, companies wishing to be listed on the Prime Market
of the Tokyo Stock Exchange (TSE) will now be required to enhance
the quality and quantity of their climate change-related disclosures
based on the TCFD or an equivalent international framework.
While Japan is believed to have more institutions endorsing the
TCFD than any other country in the world, only 308 of the companies
listed on the First Section of the TSE have TCFD-aligned disclosures.2
The Code sets forth a principle of “comply or explain,” but as most of
the companies listed on the First Section of the TSE are expected to
seek a listing on the Prime Market, how much progress these
companies will make in endorsing and actually disclosing according
to the TCFD Recommendations is a point of high interest.
1 As of June 22, 2021
2 As calculated by GPIF based on TFCD As of June 30, 2021
(Note1) Data as of June 30, 2021; number of companies endorsing TCFD is 308.
(Note2) Small- to large-cap classifications by TOPIX. Industry classifications by GPIF.
(Source) Prepared by GPIF based on data from TCFD.
Based on the number of equities (%)Large-cap equities Medium-cap equities Small-cap equities Total
Utilities 100.0 100.0 9.1 58.3 Financials 100.0 62.5 12.2 31.9 Materials 100.0 55.1 5.5 20.5 Real Estate 100.0 85.7 0.0 18.2 Energy 100.0 50.0 0.0 15.8 Consumer Staples 100.0 37.8 2.3 15.6 Industrials 80.0 41.0 4.9 13.7 Information Technology 85.7 51.1 1.1 9.9 Consumer Discretionary 62.5 41.9 0.9 9.1 Healthcare 61.5 4.0 0.0 8.8 Telecommunications Services 66.7 0.0 1.1 4.2
Grand Total 81.8 43.6 3.2 14.1
Figure1: Companies Listed on the First Section of the Tokyo Stock Exchange (TSE) That Endorse TCFD, by Industry and Capitalization
40GPIF ESG REPORT 2020
Chapter 2 Measuring the Im
pacts of ESG ActivitiesChapter 3 Evaluation and Analysis of Clim
ate Change Risks and OpportunitiesChapter 1 GPIF’s ESG Initiatives
Review of ESG Activities and Future Outlook

ESG Index Performance Attribution Analysis
Figure 1 shows the performance of GPIF’s selected ESG indexes
from April 2017 to March 2021 and during the previous year
from April 2020 to March 2021. Over the past four years, these
indexes generally outperformed both their parent indexes and
market averages (TOPIX for Japanese equities and MSCI ACWI
(excluding Japan) for foreign equities).
Figure 2 shows the performance from April 2017 to March
2021. As GPIF has only invested in the ESG indexes for foreign
equities for a short period, this figure only includes the
performance of five domestic equity ESG indexes: (1) the MSCI
Japan ESG Select Leaders Index (MSCI ESG Select Leaders), (2)
the MSCI Japan Empowering Women Index (MSCI WIN), (3) the
FTSE Blossom Japan Index (FTSE Blossom), (4) the S&P/JPX
Carbon Efficient Index (S&P/JPX Carbon), and a composite ESG
index (an equally-weighted combination of ESG indexes (1) to
(4)). This graph displays the relative performance of these
indexes compared with the market average (TOPIX) by dividing
the value of each index by the price of the TOPIX.
Using the composite ESG index as a proxy for the
performance of ESG indexes overall, the share price for these
indexes relative to the TOPIX fell below 1 during the period from
fiscal 2017 to the first half of fiscal 2018, but from the second
half of fiscal 2018, it exceeded 1 and started to trend upward. In
fiscal 2019, all ESG Indexes continued to rise relative to TOPIX
due to outperformance in quality and growth stocks (stocks with
relatively high-margins and high-growth rates), which have a
relatively strong correlation with ESG Index constituents. In fiscal
2020, some ESG indexes underperformed relative to the TOPIX
as quality and growth stocks pulled back after the sharp rise the
previous fiscal year, while value stocks (relatively cheap stocks)
rose. However, the overall performance of all ESG indexes
remained stable.
In fiscal 2020, some ESG indexes expanded their investment
universe to include small-cap stocks. We look forward to seeing
further efforts to reduce the impact of specific style factors and
size biases on performance.
GPIF believes that in the case of ESG investments, the longer
the investment period, the better the improvement in risk-
adjusted returns. In order to verify this, we calculated the
relationship between the Sharpe Ratio and the ESG rating for the
four domestic equity ESG indexes and the TOPIX index as shown
in Figure 3. The Sharpe Ratio, which is widely used as an
indicator of risk-adjusted returns, is the ratio of portfolio return
rates divided by the portfolio risk (standard deviation of return).
The higher the value, the more efficient the portfolio. Figure 3
confirms that ESG indexes (1) to (4) have higher ESG ratings than
the TOPIX, and that their Sharpe Ratios using risk and return for
the past four years also tend to be higher (i.e. more efficient).
Note that these results only cover a short four-year period
and only examine certain indexes. While the impact of ESG
ratings on risk-adjusted returns needs to be examined over the
long term, we can say that, for at least the past four years, both
improvement in the Sharpe Ratio and the reduction of ESG risks
have been achieved.
ESG Index PerformanceThe ESG indexes selected by GPIF outperformed market averages over the past four years, but we believe that these
types of investments can only be accurately assessed over the long term. We have also confirmed that these ESG indexes
have both improved their Sharpe Ratios and reduced ESG risks over the past four years.
Chapter 2 Measuring the Impacts of ESG Activities
41 GPIF ESG REPORT 2020

April 2017 to March 2021 (past 4 years, annualized) (Reference) April 2020 to March 2021
Return Rates Excess Return Return Rates Excess Return
(a) (b) (c) (a-b) (a-c) (a) (b) (c) (a-b) (a-c)
ESG Index Parent Index TOPIX Parent
Index TOPIX ESG Index Parent Index TOPIX Parent
Index TOPIX
(1) MSCI ESG Select Leaders 10.38% 9.51%
9.07%
0.87% 1.31% 38.90% 43.43%
42.13%
(4.53)% (3.23)%
(2) MSCI WIN 9.89% 9.51% 0.38% 0.82% 37.49% 43.43% (5.94)% (4.65)%
(3) FTSE Blossom 9.65% 9.57% 0.08% 0.58% 43.93% 43.81% 0.12% 1.80%
(4) S&P/JPX Carbon 9.23% 9.07% 0.16% 0.16% 41.95% 42.13% (0.18)% (0.18)%
ESG Index Parent Index
MSCI ACWI ex Japan
Parent Index
MSCI ACWI ex Japan ESG Index Parent
IndexMSCI ACWI ex
JapanParent Index
MSCI ACWI ex Japan
(5) S&P Global Carbon 13.23% 13.41%
13.38%
(0.18)% (0.14)% 58.22% 59.95%
60.21%
(1.73)% (1.99)%
(6) MSCI ESG Universal 13.89% 13.24% 0.65% 0.52% 59.34% 60.10% (0.76)% (0.87)%
(7) Morningstar GenDi 13.91% 13.77% 0.14% 0.53% 58.38% 60.25% (1.87)% (1.83)%
Figure 1. Returns of Seven ESG Indexes Selected by GPIF
(Note1) Index returns include dividends. The periods used to calculate index return rates differ from the terms of GPIF’s actual investments.
(Note2) The parent indexes (constituent universe) for (1) to (7) are as follows: (1) MSCI JAPAN IMI TOP700, (2) MSCI JAPAN IMI TOP700, (3) FTSE JAPAN ALL CAP, (4) TOPIX, (5) S&P
Global Large Mid (ex JP), (6) MSCI ACWI ex Japan ex China A, (7) Morningstar Developed Markets (ex JP) Large-Mid
(Source) Prepared by GPIF based on data from FactSet.
Figure 2. Relative Prices of ESG Indexes for Domestic Equities (1) to (4), Composite ESG Index and TOPIX
Figure 3. Relationship Between Domestic Equity ESG indexes and TOPIX Index ESG Ratings and Sharpe Ratios
(Note1) Relative prices are normalized to 1 as of March 31, 2017.
(Note2) The composite ESG index is an equally-weighted combination of ESG indexes (1) to (4).
(Source) Prepared by GPIF based on data from FactSet.
(Note1) ESG ratings are based on data as of the end of March 2021. Sharpe Ratios are from April 2017 to March 2021 (annualized).
(Note2) ESG ratings are the average of FTSE and MSCI (Refer to page 43 and 44 for the calculation of portfolio ESG rating).
(Source) Prepared by GPIF based on data from FTSE and MSCI.
FTSE Russell. Reproduced by permission of MSCI ESG Research LLC ©2021.
(Relative Price: Multiple)
2017/3 2018/3 2019/3 2020/3 2021/30.96
0.98
1.00
1.02
1.04
1.06
1.08 (1) MSCI ESG Select Leaders
(2) MSCI WIN
(3) FTSE Blossom
(4) S&P/JPX Carbon
Composite ESG Index
(ESG Ratings)
Sharpe Ratio
4.0 4.5 5.0 5.50.55
0.60
0.65
0.70(1) MSCI ESG Select Leaders
(2) MSCI WIN
(3) FTSE Blossom(4) S&P/JPX CarbonTOPIX
42GPIF ESG REPORT 2020
Chapter 2 Measuring the Im
pacts of ESG ActivitiesChapter 3 Evaluation and Analysis of Clim
ate Change Risks and OpportunitiesChapter 1 GPIF’s ESG Initiatives
ESG Index Performance

Analysis of Portfolio ESG Rating
GPIF invests in a broad range of equity and fixed-income assets
in Japan and overseas through external asset management
companies. We have about 2,417 companies in our domestic
equity portfolio and 3,285 companies in our foreign equity
portfolio. Similar to last year, in this year’s report we once again
measured the ESG rating of our equity portfolios as below.
We calculated the weighted average ESG score, E score, S
score and G score for our portfolio based on ESG ratings from
both FTSE and MSCI (excluding stocks for which an ESG rating
was not available). The overall ESG rating, weighted by market
capitalization, represents the sum of the E, S and G ratings.
(MSCI ratings include an industry adjustment factor.)
Figures 1 to 4 show the trend in each ESG rating for GPIF’s
equity portfolios every year from March 31, 2017 to March 31,
2021, as well as the ESG rating for market representative
indexes as of March 31, 2021. In the FTSE evaluation, the ESG
rating for domestic equities increased, but there was a slight fall
in the rating for foreign equities. On the other hand, the MSCI
ESG rating continued to improve for both domestic and foreign
equities. The G score for domestic equities, in particular, shows
significant improvement from 1.34 to 1.58.
The change in scores may be due to changes in FTSE’s and
MSCI’s methodologies. For MSCI, the E and S scores for both
domestic and foreign equities declined, while the G score rose.
This is likely due to a change in MSCI’s ESG rating methodology
in November2020, in which the weight of the G score was
increased to at least 33% of the ESG score.
Figures 5 and 6 show trends over time in each of the E, S,
and G ratings for GPIF’s equity portfolios from March 2017. In
the FTSE evaluation, the E, S and G ratings were all on an
upward trend until March 2020 before leveling off or falling in
March 2021. In the MSCI evaluation, on the other hand, the E
rating for both domestic and foreign equities continued to
decline, the S rating fell after trending upward until March 2020,
and the G score varied from region to region.
We compared the ESG ratings for GPIF’s equity portfolios to
ratings for the whole market by using the same methodology to
calculate the ESG ratings for market representative indexes,
using TOPIX in the case of domestic equities and the MSCI ACWI
(excluding Japan) in the case of foreign equities. As a result, in
the analysis of the TOPIX and MSCI ACWI (excluding Japan),
similar changes in E, S, and G scores to GPIF’s equity portfolios
were observed. These results support the view that the change in
scores was due to changes in methodology by FTSE and MSCI. It
also shows that GPIF’s equity portfolios are outperforming the
market in ESG scores, albeit marginally (Figures 1 to 4). This
result is likely due to the adoption of ESG Indexes and Carbon
Efficient Indexes.
Portfolio ESG RatingGPIF invests in a broad range of equity and fixed-income assets in Japan and overseas through external asset
management companies. In this year’s report, we once again measured the ESG rating of our equity portfolios. Results
confirmed that the portfolio ESG rating continued to improve for both domestic and foreign equities, despite some impact
from methodology changes at FTSE and MSCI.
Chapter 2 Measuring the Impacts of ESG Activities
43 GPIF ESG REPORT 2020
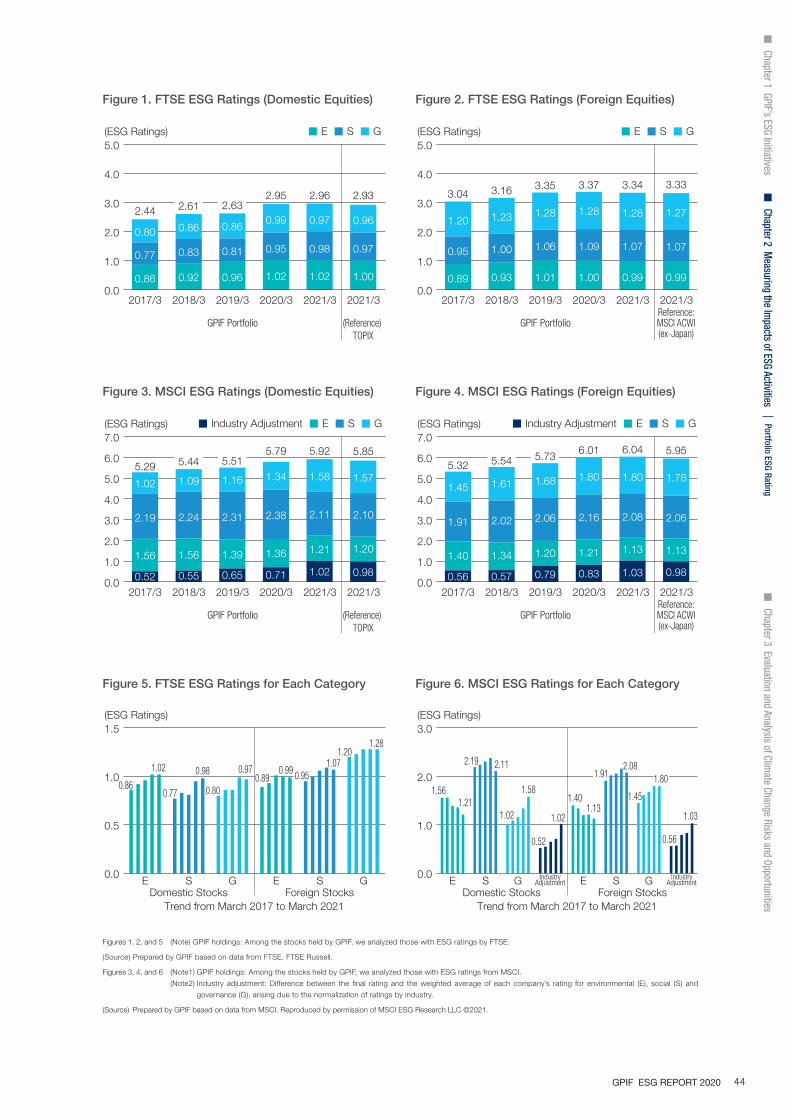
Figure 1. FTSE ESG Ratings (Domestic Equities) Figure 2. FTSE ESG Ratings (Foreign Equities)
Figure 3. MSCI ESG Ratings (Domestic Equities) Figure 4. MSCI ESG Ratings (Foreign Equities)
Figure 5. FTSE ESG Ratings for Each Category Figure 6. MSCI ESG Ratings for Each Category
(ESG Ratings)
0.0
1.0
2.0
3.0
4.0
5.0
0.86 0.92 0.96 1.02 1.02 1.00
0.77 0.83 0.81 0.95 0.98 0.97
0.80 0.86 0.860.99 0.97 0.96
2.442.95 2.96 2.93
2.61 2.63
GPIF Portfolio (Reference) TOPIX
2017/3 2018/3 2019/3 2020/3 2021/3 2021/3
■ E ■ S ■ G
2017/3 2018/3 2019/3 2020/3 2021/3 2021/3
(ESG Ratings)
GPIF PortfolioReference:MSCI ACWI(ex-Japan)
0.0
1.0
2.0
3.0
4.0
5.0
0.89 0.93 1.01 1.00 0.99 0.99
0.95 1.00 1.06 1.09 1.07 1.07
1.20 1.23 1.28 1.28 1.28 1.27
3.043.37 3.34 3.333.16 3.35
■ E ■ S ■ G
(ESG Ratings)
0.52 0.55 0.65 0.71 1.02 0.98
1.56 1.56 1.39 1.36 1.21 1.20
2.19 2.24 2.31 2.38 2.11 2.10
1.02 1.09 1.16 1.34 1.58 1.575.29
5.79 5.92 5.855.44 5.51
GPIF Portfolio (Reference) TOPIX
2017/3 2018/3 2019/3 2020/3 2021/3 2021/30.0
1.0
2.0
3.0
4.0
5.0
6.0
7.0■ Industry Adjustment ■ E ■ S ■ G
2017/3 2018/3 2019/3 2020/3 2021/3 2021/3
(ESG Ratings)
GPIF PortfolioReference:MSCI ACWI(ex-Japan)
0.56 0.57 0.79 0.83 1.03 0.98
1.40 1.34 1.20 1.21 1.13 1.13
1.91 2.02 2.06 2.16 2.08 2.06
1.45 1.61 1.68 1.80 1.80 1.785.32
6.01 6.04 5.95
0.0
1.0
2.0
3.0
4.0
5.0
6.0
7.0
5.54 5.73
■ Industry Adjustment ■ E ■ S ■ G
(ESG Ratings)
0.86
1.02
0.77
0.98
0.80
0.97 0.991.07
1.201.28
Trend from March 2017 to March 2021
E S G E S GDomestic Stocks Foreign Stocks
0.0
0.5
1.0
1.5
0.89 0.95
(ESG Ratings)
1.561.21
2.19 2.11
1.58
1.02
0.52
1.021.13
2.08
1.45
1.03
0.56
Trend from March 2017 to March 2021
E S G IndustryAdjustment
IndustryAdjustmentE S G
Domestic Stocks Foreign Stocks
0.0
1.0
2.0
3.0
1.40
1.91 1.80
Figures 1, 2, and 5 (Note) GPIF holdings: Among the stocks held by GPIF, we analyzed those with ESG ratings by FTSE.
(Source) Prepared by GPIF based on data from FTSE. FTSE Russell.
Figures 3, 4, and 6 (Note1) GPIF holdings: Among the stocks held by GPIF, we analyzed those with ESG ratings from MSCI.
(Note2) Industry adjustment: Difference between the final rating and the weighted average of each company’s rating for environmental (E), social (S) and
governance (G), arising due to the normalization of ratings by industry.
(Source) Prepared by GPIF based on data from MSCI. Reproduced by permission of MSCI ESG Research LLC ©2021.
44GPIF ESG REPORT 2020
Chapter 2 Measuring the Im
pacts of ESG ActivitiesChapter 3 Evaluation and Analysis of Clim
ate Change Risks and OpportunitiesChapter 1 GPIF’s ESG Initiatives
Portfolio ESG Rating

ESG Rating Ranking by Country
FTSE MSCI
March 2017 March 2018 March 2019 March 2020 March 2021 Latest Value March 2017 March 2018 March 2019 March 2020 March 2021 Latest Value
3.89 7.46
3.75 7.18
3.19 6.07
3.06 5.70
2.91 5.34
2.55 4.24
2.54 4.19
2.33 4.07
1.51 2.92
ESG Rating Ranking by Country
(Note) This figure shows the change over the four years from the end of March 2017 to the end of March 2021 and over the most recent year.
(Note) Among the companies included in FTSE’s “FTSE Developed Index” and “FTSE Emerging Index” and MSCI’s “MSCI All Country World Index,” the analysis focused on those
that had an ESG rating.
(Source) Prepared by GPIF based on data from FTSE and MSCI. FTSE Russell. Reproduced by permission of MSCI ESG Research LLC ©2021.
Rate of Improvement in FTSE ESG Ratings by Country
FTSE ESG Rating Distribution for Japanese Companies
Rate of Improvement in MSCI ESG Ratings by Country
MSCI ESG Rating Distribution for Japanese Companies
(Rate of Improvement)
0.78 0.30
0.550.42 0.37
SouthKoreaJapan France
HongKong IndiaCanada U.S.U.K. China
(0.2)
0.0
0.2
0.4
0.6
0.8
1.0 0.900.58
0.10
0.56
(0.14)
0.10
0.90
0.330.43
0.190.29
0.22 0.230.33
0.43
0.190.29
0.22 0.23
Past Four Years Past One Year(Rate of Improvement)
(0.01)
0.62 0.58
0.06
0.47
(0.08)
0.460.38
(0.04)
SouthKorea Japan France
HongKongIndia Canada U.S.U.K. China
(0.2)
0.0
0.2
0.4
0.6
0.8
1.0
Past Four Years Past One Year
0.750.55
0.34
0.50
0.01
(0.00)
0.140.07 0.06
0.140.07 0.06
(Number of Companies)
0-0.9 1-1.9 2-2.9 3-3.9 5-5.94-4.9←Low (ESG Ratings) High →
6-6.9 7-7.9 8-8.9 9-10
March 2017 March 2021
0
10
20
30
40
50
60
70
(Number of Companies)
0-0.4 0.5-0.9 1-1.4 1.5-1.9 2.5-2.92-2.4←Low (ESG Ratings) High→
3-3.4 3.5-3.9 4-4.4 4.5-5
March 2017 March 2021
0
20
40
60
80
100
120
Chapter 2 Measuring the Impacts of ESG Activities
45 GPIF ESG REPORT 2020

Corporate Governance and Corporate Behavior of Japanese Companies
Column
(Source) Prepared by GPIF based on data from MSCI and Sustainalytics.
Reproduced by permission of MSCI ESG Research LLC ©2021. Used with permission by Sustainalytics, a Morningstar company. Copyright 2021.
Figure 1. G score Comparison Between MSCI and Sustainalytics (as of May 31, 2021)
Domestic Equities Foreign Equities(Score)
Corporate Behavior Corporate Governance Corporate Behavior Corporate Governance
2.2 1.5
3.4 4.0
6.1
4.8 4.7 5.5
MSCI Sustainalytics
As shown in “Portfolio ESG Rating” (page 43), in the ESG ratings
for GPIF’s equity portfolio, the G (corporate governance) score of
both Japanese and foreign companies has been improving in
recent years. Over the past year in particular, the G score of
foreign companies, while still higher than that of Japanese
companies, has flattened, while Japanese companies’ scores
have improved significantly from a lower level than their non-
Japanese counterparts. Why are the corporate governance
scores of Japanese companies improving?
In 2020, MSCI changed its ESG rating methodology for the
assessment of G (Governance), adding a “Corporate Behavior”
category as a risk indicator in addition to the existing category of
"Corporate Governance." In this “Corporate Behavior” category,
the company in question is assessed on matters such as
“Business Ethics”, “Corruption & Instability”, and “Tax
Transparency.” Calculation of GPIF’s equity portfolio scores in
terms of corporate behavior found that Japanese companies
scored higher than foreign companies (Figure 1). On the other
hand, Japanese companies scored lower than their foreign
counterparts in the Corporate Governance category, which
assesses the company in question on matters including “Board”,
“Pay,” “Ownership and Control,” and “Accounting.” (Figure 1).
To find out if other ESG rating agencies rate Japanese
companies’ corporate behavior highly as well, we checked
Sustainalytics’ evaluation metrics for “Corporate Governance”
and “Corporate Behavior”, which are similar to those of MSCI. As
with the MSCI results, we found that foreign companies had a
higher rating in “Corporate Governance” than Japanese
companies, while Japanese companies rated higher in
“Corporate Behavior” than foreign companies. Many Japanese
companies have problems with “Corporate Governance,” but if
they can improve them, it will lead to improvement in their G
score from rating agencies, and, as a result, significant
improvement in their overall ESG score can be expected.
(Note1) GPIF evaluated portfolio companies for which data exists from both companies with respect to common criteria in the "Corporate Governance" and "Corporate Behavior"
categories as well as the overall G Pillar score.
(Note2) Weighted average scores according to the market capitalization weight of each issue in GPIF’s portfolio
(Note3) Ratings by Sustainalytics were converted to a scale of 1 (low) to 10 (high).
46GPIF ESG REPORT 2020
Chapter 2 Measuring the Im
pacts of ESG ActivitiesChapter 3 Evaluation and Analysis of Clim
ate Change Risks and OpportunitiesChapter 1 GPIF’s ESG Initiatives
ESG Rating Ranking by Country

Gender Diversity in Japanese Companies
GPIF adopted the MSCI Japan Empowering Women Index (WIN)
in 2017 and the Morningstar Gender Diversity Index (GenDi) in
2020 as passive equity benchmarks. In December 2019, GPIF
joined the “30% Club Japan Investor Group,” a group that aims
to increase the ratio of female executives in Japanese
companies. A large body of evidence shows that companies with
greater gender diversity are able to access a wider pool of talent,
which can potentially lead to more exceptional management
performance. From a macro-economic perspective as well,
higher gender diversity has the potential to boost the economic
performance of individual countries. Based on this
understanding, GPIF invests in companies with greater gender
diversity in order to enhance the sustainable growth of our
investments and the market as a whole for the purpose of
increasing long-term investment returns.
Similar to last year, we reviewed data for the metrics used in
the WIN index scoring methodology to gauge progress in gender
diversity at Japanese companies as shown below.
The WIN index covers, among other things, five criteria ((i) to
(v) in Figure 1) which companies are required to disclose under
the Act on Promotion of Women’s Participation and Advancement
in the Workplace. We examined data for the 700 companies (500
until 2019) eligible for inclusion in this index. Looking at the
median percentage for each criterion, (i) % Female New Hires
and (ii) % Women in the Workforce were both 20-29% , (iv) %
Women in Senior Management was less than 10%, and (v) %
Women on Board was 10-19% (calculated excluding 0% values).
From the perspective of gender diversity, the ratio of men is high
and women remain in the minority for each criterion. On the
other hand, looking at the trend over the past five years, while (i)
% Female New Hires and (iii) Difference in years men and
women are employed by the company have remained steady, (ii)
% Women in Workforce, (iv) % Women in Senior Management,
and (v) % Women on Board are trending upward. Although not a
direct criterion of the WIN index, the percentage of companies
with at least one female director on their board of directors rose
significantly from 40% in 2017 to 72% in 2021 (Figure 1).
Gender Diversity in Japanese CompaniesGender diversity is a central element of the “S” in ESG. This is a major issue for Japanese companies, but at the same
time, it is an area with tremendous potential for improvement. In this chapter, we provide an overview of the current
status of Japanese companies through a comparison with foreign companies and consider their challenges.
2017 2018 2019 2020 2021
(i) % Female New Hires 25.0% 27.9% 28.0% 28.9% 28.1%
(ii) % Women in the Workforce 17.0% 18.6% 18.8% 20.2% 21.2%
(iii) Difference in years men and women are employed by the company (16.6%) (16.5%) (16.5%) (17.5%) (18.2%)
(iv) % Women in Senior Management 3.5% 4.5% 4.6% 5.1% 5.5%
(v) % Women on Board* 10.0% 10.0% 10.0% 11.1% 12.5%
Rate of Disclosure for (i) to (v) 73.6% 72.7% 77.3% 75.4% 74.0%
Reference: % Companies with Female Directors 40% 42% 52% 61% 72%
Figure 1. Actual Values for WIN Index Quantitative Score Items (Median)
(Note) Includes companies evaluated in the WIN index (500 major companies up to 2019, and 700 major companies from 2020). * % Women on Board is calculated excluding
the value of 0%.
(Source) Prepared by GPIF based on data from MSCI. Reproduced by permission of MSCI ESG Research LLC@2021.
Chapter 2 Measuring the Impacts of ESG Activities
47 GPIF ESG REPORT 2020

Comparison of Japanese and Foreign Companies
Advancement of Women into Executive Positions Remains a Challenge
Next, we analyzed how gender diversity in Japanese companies is
evaluated internationally. Every year, the World Economic Forum
(WEF) calculates the Global Gender Gap Index, which measures
the gender gap in individual countries. Among the 156 countries
assessed with this index, Japan ranked 120th in 2021 (121st of
153 countries in the previous year). The Global Gender Gap Index
rates countries based on indicators across the four areas of
Economic Participation and Opportunity, Educational Attainment,
Health and Survival, and Political Empowerment. Japan scored
particularly low in the economic and political rankings, ranking
117th among 156 countries in the economic area. The Global
Gender Gap Report 2021 cited as reasons for Japan’s low ranking
in the “Economy” area its low percentage of female “Legislators,
senior officials and managers” (14.7%), high rate of female
“Workers employed part-time, % of employed people” (50.8%),
and the low average of women’s income (43.7% lower than men).
To compare the situation at Japanese companies with foreign
companies in more detail, we conducted an international
comparison using the Equileap Gender Equality Scorecard used in
the GenDi Index, as shown below.
The Scorecard assigns companies a score ranging from 0 to
100 points in four categories: (1) Gender Balance in Leadership
and Workforce; (2) Equal Compensation & Work-Life Balance; (3)
Policies Promoting Gender Equality; and (4) Commitment,
Transparency, and Accountability. As of March 31, 2021, 3,814
companies based in 25 developed countries have been
researched. Looking at the average scores of these companies by
country, Japan ranked 23rd among the 25 countries surveyed.
We examined the standardized scores for Japanese companies
for each of the 19 criteria included in Equileap’s scoring
methodology to verify which areas had particular room for
improvement (Figure 2). While Japanese companies rank highly
globally in terms of “parental leave” and “flexible work options,”
similar to last year, they continue to lag significantly behind the
global standard in terms of the gender balance of boards of
directors, executive positions and senior management – criteria
that are particularly emphasized in the scoring methodology. For
this reason, the gender balance of directors and executives is
also a major theme in institutional investors’ engagement. Some
asset managers have a policy of opposing proposals for the
appointment of top management if there are no women on
the board. As mentioned above, the ratio of companies with
at least one female director on the board rose significantly in
companies assessed by the WIN Index, and we believe that
this kind of shareholder lobbying is behind this trend.
Nevertheless, even today, approximately 30% of companies
have no female directors. We believe that improving the
gender balance in companies’ employees and managers will
be a major long-term challenge for the improvement of the
gender balance of directors.
Area Criterion Standardized Score Change from previous year
A. GENDER BALANCE IN LEADERSHIP & WORKFORCE
1 Board of Directors 30.5 (0.7) 2 Executives 29.8 (1.2) 3 Senior Management 32.9 (1.7) 4 Workforce 43.7 1.7 5 Promotion & Career Development Opportunities 37.6 (1.6)
B. EQUAL COMPENSATION & WORK LIFE BALANCE
6 Living Wage 47.0 0.7 7 Gender Pay Gap 44.2 0.3 8 Parental Leave 65.0 0.6 9 Flexible Work Style Options 60.1 4.6
C. POLICIES PROMOTING GENDER EQUALITY
10 Training and Career Development 53.1 0.711 Recruitment Strategy 28.2 9.012 Freedom from Violence, Abuse and Sexual Harassment 50.7 1.613 Safety at Work 45.3 3.014 Human Rights 56.9 1.715 Social Supply Chain 45.6 (0.4) 16 Supplier Diversity 29.3 0.717 Employee Protection 38.9 4.0
D. COMMITMENT, TRANSPARENCY & ACCOUNTABILITY
18 Commitment to Women’s Empowerment 51.5 (1.4)19 Audit 45.8 (0.8)
Figure 2. Individual Criteria of Average Gender Scorecard and Standardized Scores of Japanese Companies for Each Criterion
(Note) Standardized scores have been calculated based on the average score for each criterion among companies evaluated in each of the 25 countries. Standardized scores of
40 or lower are shown in red.
(Source) Prepared by GPIF based on data from Equileap.
48GPIF ESG REPORT 2020
Chapter 2 Measuring the Im
pacts of ESG ActivitiesChapter 3 Evaluation and Analysis of Clim
ate Change Risks and OpportunitiesChapter 1 GPIF’s ESG Initiatives
Gender Diversity in Japanese Companies

Chapter 3 Evaluation and Analysis of Climate Change Risks and Opportunities
49 GPIF ESG REPORT 2020
Analysis Expanded to Include Scope 3 Emissions and Inter-Industry Analysis
In this year’s report, in addition to Trucost and MSCI, whom we
partnered with last year, we newly engaged Astamuse Co., Ltd. to
provide analysis support for our climate-related financial
disclosures in line with TCFD recommendations. Astamuse is a
Japan-based research company that excels in the analysis of
intellectual property and patent information and of research and
development investment. As in the previous fiscal year, we
conducted a multifaceted analysis that leveraged these
companies’ respective strengths by dividing up the various areas
to be analyzed by each company (Figure 1).
In particular, we aimed to improve three issues that were
outstanding from the previous fiscal year’s analysis: (1) include
the entire supply chain in our greenhouse gas emissions
analysis; (2) expand the analysis to include not only traditional
asset classes but also alternative asset classes; and (3) provide
an analysis of inter-industry transfer of opportunities and risks
accompanying the transition to a low-carbon society. Our first
aim was to “(1) include the entire supply chain in our
greenhouse gas emissions analysis” by adding Scope 3
emissions. Greenhouse gas emissions across the entire supply
chain can be roughly divided into the following categories: the
company’s direct emissions (Scope 1), indirect emissions
related to purchased electricity (Scope 2), indirect emissions
from procured products and services other than purchased
electricity (upstream Scope 3), and indirect emissions from the
consumption and use of sold products and services
(downstream Scope 3) (Figure 2). Expanding the carbon
footprint measurement of our portfolio to include Scope 3
emissions requires a degree of caution, as problems such as
counting the same greenhouse gas emissions twice may arise
(e.g., the Scope 1 emissions of one company may be included
in the Scope 3 emissions of another company). However, our
priority was to fully understand the situation across the entire
supply chain, and thus we conducted the analysis based on the
total value of Scope 1, 2, and 3 emissions.
The initial Climate Value-at-Risk (CVaR) model used to
measure the impact of climate change risks and opportunities on
the value of equities and corporate bonds was limited to Scope 1
emissions, but has been recently updated to include Scope 2 and
Scope 3 emissions. In this model, the introduction of carbon
pricing causes costs for the company to increase in direct
proportion to Scope 1 emissions, but Scope 2 electricity and
upstream Scope 3 raw materials emissions-related costs are
affected by the share of costs passed down to the company.
Similarly, for greenhouse gas emissions occurring when products
are used in downstream Scope 3, the analysis must reflect the
extent that demand will change if the company passes on carbon
costs to the customer. In general, policy risks tend to increase as
the scope of the analysis expands, resulting in a significant
negative impact to CVaR. This is seen particularly for companies
that produce goods that generate significant greenhouse gas
emissions when used. In the analysis for this report, expanding
the analysis to include Scope 2 and Scope 3 caused CVaR to fall
significantly, predominantly in domestic stocks. (Please refer to
pages 57–58 for details.) While the expanded CVaR analysis
reflects a portion of Scope 1 and 2 pass-through costs, there is a
limit to how far these extremely complex factors, such as price
pass-through and price elasticity of demand, can be accounted
for. As such, the results should be considered to occur within a
certain range.
Disclosure and Analysis of Climate-Related Financial Information: Composition and Key PointsIn this our third year of disclosing in line with TCFD recommendations, we expanded our greenhouse gas emissions analysis to include the entire
supply chain, and newly added a portion of our alternative asset portfolio (domestic real estate) to the scope of assets analyzed. Additionally, for
the first time, we included an analysis of the implications of the shift to a low-carbon society on inter-industry transfers of opportunities and risks.

Figure 1. Analysis of Major Climate Change-Related Risks and Opportunities Conducted for This Report
Figure 2. Greenhouse Gas Emissions by Scope
(Note1) * In the CVaR analysis of government bonds, impact on GDP, not the price of government bonds, was analyzed.
(Note2) ** In the SDGs-related analysis, all opportunities arising from the resolution of the social issues identified in the SDGs were analyzed, not only climate change-related opportunities.
(Source) Prepared by GPIF based on various materials
(Note) The above figure indicates the major sectors included in each scope.
(Source) Prepared by GPIF based on the GHG Protocol, etc.
Contents of Analysis Asset Class Analysis Performed by
Carbon footprint analysis Equities / corporate bonds Trucost
Carbon intensity analysis Equities / corporate bonds / government bonds Trucost
Climate Value-at-Risk (CVaR)-based analysis* Equities / corporate bonds / government bonds / real estate MSCI
Warming potential analysis Equities / corporate bonds / real estate MSCI
Analysis of inter-industry transfer of transition risks and opportunities Industries Astamuse
Total patent asset analysis of decarbonization technologies by country/region Industries / countries Astamuse
SDGs positive impact / additionality analysis** Equities Trucost
Upstream Scope 3
Rawmaterials
Leased assets Waste generated in operations Transportation and distribution Investments
Employee commuting andbusiness travel
Direct emissions associated with the company’s activities
(e.g., emissions associated with fuel combustion,
manufacture of products)
Indirect emissions associated with the use of
electricity and steam
Transportation Use of sold products
End-of-life treatmentof sold products
Processing of sold products
Scope 1 Scope 2 Downstream Scope 3
Upstream activities Reporting company Downstream activities
50GPIF ESG REPORT 2020
Chapter 3 Evaluation and Analysis of Climate Change Risks and Opportunities
Chapter 1 GPIF’s ESG InitiativesChapter 2 Measuring the Im
pacts of ESG Activities
The second issue was to “(2) expand the analysis to include
not only traditional asset classes but also alternative asset
classes.” In this year’s climate-related financial disclosures, we
conducted a CVaR analysis of domestic real estate in which GPIF
invests through private funds. The results of that analysis showed
that, even though real estate in Japan is naturally exposed to risks
such as typhoons and flooding, the risk to the value of GPIF’s
overall portfolio is limited. (Please refer to pages 63–64 for details.)
The third issue was to “(3) provide an analysis of inter-
industry transfer of opportunities and risks accompanying the
transition to a low-carbon society.” In the patent-based CVaR
assessment of opportunities from low-carbon technologies, the
amount of possible revenue from environmental technologies in a
certain sector that can be earned going forward is assumed to
be equal to the cost of climate change policy (cost of reducing
carbon emissions) in that same sector. In other words, in the
transition to a low-carbon society, opportunities and risks will be
redistributed within the same sector or industry. If we consider,
for example, an intra-sector shift in demand from gasoline-
powered vehicles to electric and hydrogen-powered vehicles, this
is not such an unreasonable assumption. However, when viewed
from a more long-term perspective, there are some additional
points that need to be considered in the analysis. They include
(1) the contribution of low-carbon technologies throughout the
supply chain to reductions in carbon emissions beyond sector
boundaries will result in the transfer of benefits and demand
between sectors, and (2) changes in the prices of goods and
services due to carbon pricing, etc. will bring changes to the
overall demand structure. An analysis by Astamuse focusing on
point (1) above found that the opportunities associated with the
transition to a net-zero society greatly exceeded the risks,
especially in the energy and chemical industries, and that Japan
has promising technologies in these industries. (Please refer to
pages 65–68 for details.)
Disclosure and Analysis of Climate-Related Financial Inform
ation: Composition and Key Points

Chapter 3 Evaluation and Analysis of Climate Change Risks and Opportunities
Foreign Stocks
24.89%Domestic Bonds
25.92%
Foreign Bonds
24.61%Domestic Stocks
24.58%
■Domestic Bonds ■Foreign Bonds ■Domestic Stocks ■Foreign Stocks
(Source) GPIF (Note) “Other” includes securitized products.
(Source) GPIF
Figure 1. Breakdown of Portfolio Asset Types (Total for GPIF’s Pension Reserves)
Figure 2. Breakdown by Category in GPIF Bond Portfolio (%)
As of March 31, 2021
89.1 86.2
6.1 7.9 4.8 5.9
Government Bonds, Government-Related Bonds
OthersCorporate Bonds
Domestic Bonds
Foreign Bonds
As of March 31, 2021
51 GPIF ESG REPORT 2020
Features of GPIF’s Portfolio
The analysis looked mainly at four asset classes in GPIF’s
portfolio: domestic bonds, foreign bonds, domestic equities,
and foreign equities. Some alternative assets1 (domestic real
estate in which GPIF invests through private funds) were also
analyzed. In the sections that follow, we analyze greenhouse
gas emission volumes (carbon footprint), transition risks,2
physical risks,3 and opportunities relating to these asset
classes using data as of March 31, 2021. Because analysis
results are heavily influenced by the investment amount and
sector weighting of each asset class, it is important to
understand the characteristics of our portfolio prior to
interpreting these results.
The GPIF portfolio is composed of roughly half bonds and
half equities by overall market value (Figure 1). On the fixed
income side, domestic bonds accounted for 25.92% of all
holdings while foreign bonds accounted for 24.61%. For
equities, domestic issues comprise 24.58% of the total
portfolio and overseas issues 24.89%. The majority of bond
holdings, both domestic and foreign, consist of government
bonds (Figure 2).
Analysis of Portfolio Greenhouse Gas EmissionsThis analysis measures the greenhouse gas emissions (carbon footprint) of the companies held in GPIF’s portfolio, based
on an understanding of the characteristics of the portfolio’s asset classes and sector weightings. Downstream Scope 3
emissions were newly added to the fiscal 2020 analysis.
1 Alternative assets account for around 0.7% of the pension reserve fund. Alternative assets are generally allocated to the four main portfolio asset types according to their
characteristics.
2 Transition risks are risks that arise from policy, technological innovation, demand change, etc. that accompany the transition to a low-carbon economy.
3 Physical risks are risks from direct damage to an asset, supply chain disruption, etc., resulting from climate change.

Financials
Industrials
Utilities
Consumer Discretionary
Materials
Real Estate
Telecomm
unications Services
Healthcare
Information Technology
Consumer Staples
Energy
0
15
10
35
30
45
5
40
%
25
20
Domestic Bonds
Foreign Bonds
As of March 31, 2021
Industrials
Consumer Discretionary
Information Technology
Financials
Healthcare
Consumer Staples
Telecomm
unications Services
Materials
Real Estate
Utilities
Energy
0
15
25%
5
20
10
Domestic Stocks
Foreign Stocks
As of March 31, 2021
(Note) Only corporate issues are analyzed.
(Source) GPIF
(Source) GPIF
Figure 3. Breakdown of GPIF Equity Portfolio by Sector Based on Total Market Value (%)
Figure 4. Breakdown of GPIF Bond Portfolio by Sector Based on Total Market Value (%)
Figure 5. Greenhouse Gas Emissions per Million Yen of Sales (CO2 Equivalent Tons)
Telecommunications Services
Consumer Discretionary
Consumer Staples Energy Financials Healthcare Industrials Information
Technology Materials Real Estate Utilities
DomesticStocks 1.22 10.25 4.77 25.02 0.85 1.13 15.91 5.59 20.20 3.25 23.50
ForeignStocks 1.09 7.57 6.27 35.54 1.28 1.17 18.98 3.08 27.93 5.34 29.46
DomesticBonds 1.30 9.27 9.57 23.31 1.00 1.13 9.91 4.32 25.09 2.77 25.01
ForeignBonds 1.02 9.97 10.07 34.62 1.22 0.88 9.96 3.08 32.15 3.98 31.75
(Note) The aggregate scope of greenhouse gas emissions includes Scopes 1, 2, and 3. In each asset class, the top three sectors by volume of greenhouse gases emitted are shaded.
For bonds, only corporate issues were analyzed. Data are as of March 31, 2021.
(Source) S&P Trucost Limited © Trucost 2021
52GPIF ESG REPORT 2020
Chapter 3 Evaluation and Analysis of Climate Change Risks and Opportunities
Chapter 1 GPIF’s ESG InitiativesChapter 2 Measuring the Im
pacts of ESG Activities
When examining GPIF’s equity portfolio by sector, there is a
difference in the composition of the domestic and foreign
equity portfolios (Figure 3). The domestic equity portfolio has
a higher proportion invested in the high-emitting industrials
and consumer discretionary sectors, while the foreign equity
portfolio has a high proportion in the low-emitting information
technology, financials, and healthcare sectors.
Looking at the corporate bond portfolio, the largest sector
for both domestic and foreign bonds is financials (Figure 4).
Among domestic corporate bonds, the proportion of utilities
and industrials is higher than that for foreign corporate bonds.
Since utilities include electric power companies, this sector is
characterized by higher greenhouse gas emissions than other
sectors. In the foreign corporate bond portfolio, the proportion
of energy companies, which have relatively high greenhouse
gas emission volumes, is greater than that for domestic
corporate bonds. On the other hand, the proportion of corporate
bonds issued by telecommunication services and healthcare
companies, which have lower emissions, is also high.
It is necessary to bear this sector bias in GHG emissions
in mind when examining the results of the analysis presented
in the following sections. Around 90% of stock investments
and 70% of bond investments by GPIF are passive
investments, which means our investment is virtually identical
to the sector ratios of each benchmark.
Analysis of Portfolio Greenhouse Gas Emissions

Chapter 3 Evaluation and Analysis of Climate Change Risks and Opportunities
(Source) S&P Trucost Limited © Trucost 2021
(Note) Numbers in brackets are the percentage of downstream Scope 3 emissions in total emissions.
Figure 6. GHG Emissions by Scope in GPIF Equity Portfolio
20,000
■Scope 1 ■Scope 2 ■Upstream Scope 3 ■Downstream Scope 3
(× 10,000 tCO2e)
0 5,000 10,000 15,000
Industrials (84)
Consumer Discretionary (77)
Materials (56)
Energy (81)
Information Technology (65)
Consumer Staples (28)
Utilities (40)
Financials (63)
Healthcare (21)
Real Estate (63)
Telecommunications Services (35)
53 GPIF ESG REPORT 2020
Major Variations in the Magnitude of Greenhouse Gas Emissions by Sector According to the Scope of Calculation
Carbon Footprint (GHG Emissions) Analysis
In this year’s report, we expanded the calculation scope of
our carbon footprint and other analyses to include indirect
emissions from the consumption and use of sold products
and services (downstream Scope 3) in addition to direct
emissions by the company (Scope 1), indirect emissions
related to purchased electricity (Scope 2), and indirect
emissions from procured products and services other than
purchased electricity (upstream Scope 3). Looking at GPIF’s
equity portfolio emissions by sector and scope, downstream
Scope 3 accounts for 50% or more of total emissions for 7 of
the 11 sectors. This means that analysis result interpretations
vary greatly depending on whether downstream Scope 3
emissions are considered. For portfolios with a higher weight
of industrials, energy, and consumer discretionary companies
in particular, analysis results change dramatically depending
on whether or not Scope 3 is included in the calculation.
This analysis measures the carbon footprint of GPIF’s equity and
corporate bond portfolios for Scopes 1 through 3, based on the
characteristics of downstream Scope 3 emissions.
Looking at total emissions by asset class, domestic equities
were found to have the highest level of emissions, followed by
foreign equities, foreign corporate bonds, and domestic corporate
bonds (Figure 7). This result is roughly the same as last year’s,
but does not necessarily mean that domestic companies have
more or less carbon emissions than foreign companies. Rather, it
reflects the relative size and sector holding of each asset class
within GPIF’s portfolio.
The breakdown of the portfolio’s carbon footprint shows
that the combined emissions of Scopes 2 and 3 account for
65% or more of the total emissions for all assets. As such,
calculating emissions across the entire supply chain and
enhancing the transparency of these emissions and the
potential for reducing them is crucial for companies to take
efficient emission reduction measures.
Figure 8 shows long-term greenhouse gas emission trends
for Scopes 1, 2, and 3, using 100 for fiscal 2017 emissions as a
base . The results indicated that fiscal 2020 saw the largest
reduction of emissions in the four years since fiscal 2017. This
may be attributable to the impact of COVID-19, as well as to
changes in the companies held in GPIF’s portfolio and invested
amounts. Emissions related to foreign bonds increased
significantly between fiscal 2018 and 2019. This is likely due to
the decrease in the weight of domestic corporate bonds in the
portfolio and corresponding increase in the weight of foreign
corporate bonds in fiscal 2019. In fiscal 2020, emissions related
to foreign corporate bonds also fell greatly.

(Source) S&P Trucost Limited © Trucost 2021
(Source) S&P Trucost Limited © Trucost 2021
(Source) S&P Trucost Limited © Trucost 2021
(Note) The aggregate scope of greenhouse gas emissions includes Scopes 1, 2, and 3.
(Note) “Other” represents the cross term of “Corporate Profits,” “Emissions Volume”
and “Portfolio Weighting.”
(Source) S&P Trucost Limited © Trucost 2021
Figure 7. Greenhouse Gas Emissions by Scope
Figure 9. Weighted Average Carbon Intensity (WACI) for Equities and Corporate Bonds
Figure 8. Greenhouse Gas Emission Trends
Figure 10. Analysis of Factors Contributing to Carbon Intensity
Foreign Bonds
(Corporate)
Domestic Bonds
(Corporate)
Reference: MSCI ACWI
(ex Japan and China A-shares)
GPIF PortfolioReference: TOPIX
GPIF Portfolio
Scope 1
Scope 2
Upstream Scope 3
Downstream Scope 3
0
35(× 10 million tCO2e)
5
30
25
20
15
10
Domestic Stocks Foreign Stocks Bonds
60
40
100
120
140
180
80
160
(FY2017 = 100)
Domestic Stocks
MSCI ACWI (ex Japan and China A-shares)
2017 2018 2019 2020
Foreign Stocks
Foreign Bonds (Corporate)
TOPIX
Domestic Bonds (Corporate)
(Fiscal year)
0
12
6
4
8
2
10
Domestic Stocks Foreign Equities Domestic Bonds (Corporate)
Foreign Bonds (Corporate)
(WACI, tCO2e)
■Scope 1 ■Scope 2 ■Upstream Scope 3 ■Downstream Scope 3
9.70
(0.05)0.01
0.74 0.06 10.46
0.0
2.0
4.0
6.0
8.0
10.0
12.0
FY2019 CorporateProfits
EmissionsVolume
PortfolioWeighting
Others FY2020
(tCO2e per million yen of sales)
54GPIF ESG REPORT 2020
Chapter 3 Evaluation and Analysis of Climate Change Risks and Opportunities
Chapter 1 GPIF’s ESG InitiativesChapter 2 Measuring the Im
pacts of ESG ActivitiesCarbon Intensity Analysis
Carbon intensity is calculated by dividing GHG emissions by value
added per unit or some other metric. While carbon intensity can
be calculated in a variety of ways, this analysis adopted the
weighted average carbon intensity (WACI) approach for equities
and bonds, in line with TCFD recommendations. WACI is
calculated by multiplying each company’s carbon emissions to
revenue (C/R) by the weight of that company in the portfolio, then
taking the sum of those products to get the weighted average of
carbon intensity.
Out of GPIF’s equity and corporate bond portfolios, WACI was
particularly high for domestic equities and foreign bonds (Figure
9). For the former, Scope 3 downstream emissions accounted for
around 74% of WACI, largely due to relatively high allocations to
industrials, consumer discretionary and materials – all sectors
with high indirect emissions. Foreign corporate bonds, on the
other hand, in addition to having higher allocations to several
carbon intensive sectors than domestic corporate bonds, also
had a higher level of investment in the financials sector, which
has a low carbon intensity.
Finally, we analyzed the factors contributing to carbon
intensity across the equity and corporate bond portfolio as a
whole (Figure 10). In this analysis, we broke down the factors of
changes in carbon intensity from fiscal 2019 to fiscal 2020 into
(1) corporate profits, (2) companies’ emissions volumes, (3)
weight of each company in the portfolio, and (4) other factors.
The carbon intensity (CO2-equivalent tons per million yen of
sales) of GPIF’s equity and corporate bond portfolio increased by
7.8%, from 9.70 tons to 10.46 tons, in the space of a year. The
largest contribution was from the change in (3) weight of each
company in the portfolio. This may be due to the shift to the new
policy asset mix beginning in fiscal 2020, which saw a decrease
in the weight of domestic bonds, which have a low carbon
intensity, and an increase in the weight of foreign bonds, which
have a high carbon intensity.
Analysis of Portfolio Greenhouse Gas Emissions

Chapter 3 Evaluation and Analysis of Climate Change Risks and Opportunities
55 GPIF ESG REPORT 2020
Revision of CVaR Analysis Model
GPIF first conducted a CVaR analysis of the climate change risks
inherent in its portfolio in the ESG Report 2019. Since then, the
CVaR methodology has been further refined through an
expansion of the analysis to include Scope 3 emissions and
revisions made to the CVaR calculation model itself. This fiscal
year we have continued to conduct climate-change risk analysis
on our portfolio in line with the TCFD recommendations. The
following sections examine the impact of these model changes
on analysis results.
The risks and opportunities considered in the CVaR analysis
are comprised of “transition risks and opportunities” and
“physical risks.” “Transition risks and opportunities” combines
“policy risks,” which indicate the impact from greenhouse gas
(GHG) emission regulations, and “technological opportunities,”
which indicate income opportunities made possible from
technologies that have a competitive advantage under tightened
regulations. “Physical risks,” on the other hand, considers the
impact of changes in the natural environment and disasters
caused by climate change. For each of these components, we
compared the results of three analyses: (1) portfolio analysis as
of March 31, 2020 using the old calculation model, (2) portfolio
analysis as of March 31, 2020 using the new model, and (3)
portfolio analysis as of March 31, 2021 using the new model
(Figure 1).
Under the 2°C scenario, the comparison revealed that the
introduction of the new model (comparison between (1) and (2))
resulted in a reversal of transition risks and opportunities from a
potential upside to corporate value of 8.1% to a potential
downside of 0.4% due to increased policy risks and a decline in
technological opportunities. On the other hand, physical risks
improved slightly from -6.4% to -6.2%. A comparison of last
year’s and this year’s portfolios based on the new model
(comparison between (2) and (3)) showed a decrease in risks and
increase in opportunities for all factors and an improvement in
aggregate CVaR from -6.6% to -5.7%.
This revision of the analysis methodology had a particularly
significant impact on technological opportunities. A breakdown of
the elements of those changes shows that the greatest impact
(-4.3%) was the result of weighting stocks by revenue instead of
market capitalization in the weighted average sector (industry)
profit ratio calculations used in CVaR (Figure 2). As weighted
average market capitalization can change significantly due to
stock price fluctuations, using weighted average revenue instead
provides more consistent analysis results. This method can also
curtail the excessive impact on sector profit margins caused by
some large companies with large market capitalization in certain
industries that have few companies. Results also confirm that
updating the data on environment-related income (-2.3%), which
is the source of technological opportunities for individual
companies, and changes in market capitalization (-2.2%) also
had an impact. Looking at the factors of policy risk changes
reveals that, in addition to the impact of the different
methodology used to calculate sector profit margins (-1.7%)
seen in the case of technological opportunities, the expansion of
the scope of the analysis to Scope 3 (-3.2%) and the refinement
of Scope 2 (-1.6%) also had an impact. In terms of physical
risks, fluvial flooding risks were added to the analysis, but the
impact of that change was only slight, because these risks have
already been incorporated as physical risks in other categories.
As mentioned above, even for the same portfolio, there is a
significant difference in the CVaR analysis results caused by the
revision of the calculation model. Having said that, comparing
this year’s portfolio with the previous fiscal year using the new
model, climate change-related risks were shown to have
decreased, indicating that CVaR this year did not substantially
deteriorate from the previous fiscal year.
Analysis of Equity and Corporate Bond Portfolio Using Climate Value-at-Risk, etc.Climate Value-at-Risk (CVaR) is a method of measuring how climate policy changes and disasters caused by climate
change impact corporate value. CVaR is an integrated approach that assesses both the risks and opportunities vis-à-vis
corporate value stemming from climate change.

Figure 3. CVaR by Temperature Increase Scenario (%)
(Note) Physical risks are analyzed under assumptions corresponding to a 4°C–6°C scenario.
(Source) Reproduced by permission of MSCI ESG Research LLC ©2021
CVaR for 3°C Scenario Equities Corporate Bonds Total Portfolio
(1) Transition Risks and Opportunities 0.07 (0.18) 0.06Policy Risks (1.12) (0.23) (1.07)Technological Opportunities 1.19 0.05 1.13
(2) Physical Risks (6.08) (0.90) (5.82)(3) Aggregate (6.01) (1.08) (5.76)
CVaR for 2°C Scenario Equities Corporate Bonds Total Portfolio
(1) Transition Risks and Opportunities 0.33 (3.68) 0.11Policy Risks (8.42) (3.90) (8.19)Technological Opportunities 8.75 0.22 8.30
(2) Physical Risks (6.08) (0.90) (5.82)(3) Aggregate (5.75) (4.58) (5.71)
CVaR for 1.5°C Scenario Equities Corporate Bonds Total Portfolio
(1) Transition Risks and Opportunities 0.72 (8.11) 0.25Policy Risks (17.54) (8.49) (17.08)Technological Opportunities 18.26 0.38 17.33
(2) Physical Risks (6.08) (0.90) (5.82)(3) Aggregate (5.36) (9.01) (5.57)
(Source) Reproduced by permission of MSCI ESG Research LLC ©2021(Note) Data is current as of March 31, 2020
(Source) Reproduced by permission of MSCI ESG Research LLC ©2021
Figure 1. Changes in GPIF Portfolio CVaR (Total of Equities and Corporate Bonds) Due to Analysis Model Revision
Figure 2. Breakdown of Changes in GPIF Portfolio CVaR (Total of Equities and Corporate Bonds) Due to Analysis Model Revision by Factor
0
(10)
20
15
5
(5)
10
1.7%
(5.7)%(6.6)%
8.1%
0.1%
(0.4)%
14.7%
8.2%8.3%
(6.4)%(6.2)%
(5.8)%
(8.6)%(8.2)%
(6.6)%
■(1) Data as of March 31, 2020 with old model
■(2) Data as of March 31, 2020 with new model
■(3) Data as of March 31, 2021 with new model
(%)
AggregatedCVaR
Transition Risks and Opportunities
Policy Risks Physical RisksTechnologicalOpportunities
16
14
12
10
8
6
4
2
0
(Weighted Average Technological Opportunities CVaR, %)
Old model
Sector profit margin
Market capitalization
Environment-related incom
e
WACC
New m
odel
0
(2)
(4)
(6)
(8)
(10)
(12)
(14)
(16)
(Weighted Average Policy Risk CVaR, %)
Old model
New m
odel
Scope 2 added
Sector profit margin, etc.
Scope 1 cost pass-through
Scope 3 added
14.7%
(2.2)%
8.2%2.3%(4.3)%
(2.3)%
(6.6)%
(1.6)%(8.6)%
4.6%(1.7)%
(3.2)%
56GPIF ESG REPORT 2020
Chapter 3 Evaluation and Analysis of Climate Change Risks and Opportunities
Chapter 1 GPIF’s ESG InitiativesChapter 2 Measuring the Im
pacts of ESG Activities
CVaR by Temperature Increase Scenario
In this report, we calculated CVaR for a scenario in which the
global temperature rise from the pre-industrial period to the end
of this century does not surpass 2°C (the 2°C scenario) and
conducted our analysis based on the result of those calculations.
As CVaR results vary depending on the temperature increase
scenario being assumed, we first confirm the CVaR of GPIF’s
equity and corporate bond portfolio under scenarios in which
policies are implemented to limit temperature increase to 1.5°C,
2°C, and 3°C (Figure 3).
To understand the overall trend represented by each of the
scenarios, we focused first on aggregate CVaR for the total
portfolio and found that the risks to the portfolio are smallest in
the 1.5°C scenario, while the negative impact increases more as
we move toward the 2°C and 3.0°C scenarios (i.e. less policy
restrictions). Compared with last year’s report, the gaps in CVaR
between each scenario are smaller, owing largely to the analysis
model revision. However, for both equities and corporate bonds,
the impact of technological opportunities and policy risks are
higher in the scenarios with greater curbs in temperature rises,
indicating that climate policy trends are likely to have a
significant impact on corporate value. Investors will have to pay
close attention to climate change policy trends going forward as
these will play a pivotal role in investment decisions.
Analysis of Equity and Corporate Bond Portfolio Using Climate Value-at-Risk, etc.

Chapter 3 Evaluation and Analysis of Climate Change Risks and Opportunities
(Note) Reproduced by permission of MSCI ESG Research LLC ©2021 (Note) Reproduced by permission of MSCI ESG Research LLC ©2021
(Note) Reproduced by permission of MSCI ESG Research LLC ©2021 (Note) Reproduced by permission of MSCI ESG Research LLC ©2021
Figure 1. Technological Opportunities: Domestic Equity Portfolio
Figure 3. Technological Opportunities: Domestic Corporate Bond Portfolio
Figure 2. Technological Opportunities: Foreign Equity Portfolio
Figure 4. Technological Opportunities: Foreign Corporate Bond Portfolio
4,0003,500
(Weighted Average Patent Score)
0 500 1,000 1,500 2,000 2,500 3,000
Consumer Discretionary
Information Technology
Industrials
Materials
Utilities
Energy
Real Estate
Consumer Staples
Healthcare
Telecommunications Services
Financials
■Automobiles ■Batteries ■Construction
■Chemicals ■Electric Vehicles ■Energy Supply
■GHG Reduction Technology ■Hydrogen Fuel
■Information Technology ■Solar ■Aircraft
■Wind Power ■Others
400350
(Weighted Average Patent Score)
0 50 100 150 200 250 300
Industrials
Information Technology
Consumer Discretionary
Energy
Materials
Healthcare
Telecommunications Services
Consumer Staples
Financials
Utilities
Real Estate
■Automobiles ■Batteries ■Construction
■Chemicals ■Electric Vehicles ■Energy Supply
■GHG Reduction Technology ■Hydrogen Fuel
■Information Technology ■Solar ■Aircraft
■Wind Power ■Others
2,0001,500
(Weighted Average Patent Score)
0 500 1,000
Consumer Discretionary
Information Technology
Materials
Utilities
Industrials
Energy
Healthcare
Real Estate
Telecommunications Services
Consumer Staples
Financials
■Automobiles ■Batteries ■Construction
■Chemicals ■Electric Vehicles ■Energy Supply
■GHG Reduction Technology ■Hydrogen Fuel
■Information Technology ■Solar ■Aircraft
■Wind Power ■Others
1,000
(Weighted Average Patent Score)
0 200 400 600 800
Consumer Discretionary
Industrials
Energy
Information Technology
Materials
Utilities
Healthcare
Telecommunications Services
Consumer Staples
Real Estate
Financials
■Automobiles ■Batteries ■Construction
■Chemicals ■Electric Vehicles ■Energy Supply
■GHG Reduction Technology ■Hydrogen Fuel
■Information Technology ■Solar ■Aircraft
■Wind Power ■Others
57 GPIF ESG REPORT 2020
Technological Opportunities: Remarkably High Scores for Domestic Equities
We saw on the previous page that technological opportunities
have changed dramatically from the previous year due to
revisions made to the analysis model. Here, we investigate the
patent scores used to calculate technological opportunities for
companies included in GPIF’s equity and corporate bond
portfolios. While analysis results are affected by the amounts
invested in individual companies, the portfolio as of March 31,
2021 examined in this analysis is generally in line with the policy
asset mix. As such, in terms of equities, the portfolios do not
deviate significantly from policy benchmarks. The patent score
calculation tabulates all low-carbon technology patents held by a
given company and reflects any change in the number of such
patents.1 The results of this analysis do not differ greatly from the
previous year, with domestic companies in the automotive and
energy supply sectors scoring exceptionally high. The inter-
industry transfer of transition risks and opportunities analysis
introduced on page 65 employs a different methodology to
assess the patent competitiveness of decarbonization
technologies by county and region.
Looking at patent scores by sector, the consumer
discretionary sector, which includes automotive manufacturers,
scored markedly higher compared with other sectors in the
domestic equities portfolio. Within this sector, “automobiles”
had the highest patent score, followed by “energy supply,”
“electric vehicles,” and “chemicals” (Figure 1). In the
information technology sector, patent scores are high in
“energy supply” and “automobiles.” Meanwhile, in the case of
foreign equities, the scores for industrials are the highest, with
patents related to aircraft, wind power, and automobiles making
major contributions. In the information technology sector,
“information technology” scored highly, while “automobiles”
scored highly in the consumer discretionary sector, similar to
domestic equities (Figure 2).
In the domestic bond portfolio as well, “automobiles” tend to
have higher scores in the consumer discretionary sector as in the
domestic equity portfolio, as does “energy supply” in the
information technology sector. For foreign corporate bonds, there
was an increase in the weighted average patent scores in
“automobiles” and “energy supply” for the consumer
discretionary sector (Figures 3 and 4).
1 The evaluation of patent scores is based on “forward citations,” which is the number of patents cited in other parties’ patent applications, “backward citations,” which is the
number of other parties’ patents cited when filing one’s own patent application, “market coverage,” or the total GDP of countries to which the patent application was filed, and
“cooperative patent classification (CPC) coverage.” Please refer to Analysis of Climate Change-Related Risks and Opportunities in the GPIF Portfolio (a supplementary guide to
the ESG Report 2019) for details.

(Note) Changes from the previous year refers to changes in Scopes 1 + 2
(Source) Reproduced by permission of MSCI ESG Research LLC ©2021
(Note) Changes from the previous year refers to changes in Scopes 1 + 2
(Source) Reproduced by permission of MSCI ESG Research LLC ©2021
(Note) Changes from the previous year refers to changes in Scopes 1 + 2
(Source) Reproduced by permission of MSCI ESG Research LLC ©2021
(Note) Changes from the previous year refers to changes in Scopes 1 + 2
(Source) Reproduced by permission of MSCI ESG Research LLC ©2021
Figure 1. Policy Risk: Domestic Equity Portfolio (%)
Figure 3. Policy Risk: Domestic Corporate Bond Portfolio (%)
Figure 2. Policy Risk: Foreign Equity Portfolio (%)
Figure 4. Policy Risk: Foreign Corporate Bond Portfolio (%)
SectorPolicy Risk
CVaR Scopes 1 + 2 Scope 3
Change from previous year
(percentage points)
HealthcareTelecommunications ServicesFinancialsReal EstateInformation TechnologyConsumer StaplesIndustrialsConsumer DiscretionaryMaterialsUtilitiesEnergy
(1.1)(1.2)(2.1)(2.7)(2.8)(6.5)
(10.0)(11.0)(30.1)(69.7)(95.2)
(0.5)(0.6)(0.8)(1.3)(1.5)(3.5)(6.5)(2.6)
(25.3)(46.8)(63.2)
(0.6)(0.7)(1.3)(1.4)(1.3)(3.0)(3.5)(8.4)(4.8)
(23.0)(32.0)
0.10.30.00.50.50.61.91.69.14.8
11.5
Information TechnologyHealthcareReal EstateFinancialsTelecommunications ServicesConsumer DiscretionaryConsumer StaplesIndustrialsMaterialsUtilitiesEnergy
(0.8)(1.3)(1.6)(1.7)(1.7)(3.6)(6.0)(7.6)
(23.9)(36.8)(46.6)
(0.5)(0.8)(1.3)(1.1)(1.5)(1.3)(4.2)(6.5)
(21.2)(32.9)(31.3)
(0.4)(0.5)(0.3)(0.6)(0.3)(2.3)(1.8)(1.1)(2.6)(3.9)
(15.3)
0.20.10.10.20.30.51.73.5
12.3(3.8)
17.9
SectorPolicy Risk
CVaR Scopes 1 + 2 Scope 3
Change from previous year
(percentage points)
Telecommunications ServicesFinancialsReal EstateInformation TechnologyHealthcareConsumer StaplesConsumer DiscretionaryIndustrialsMaterialsUtilitiesEnergy
0.0(0.1)(0.1)(0.2)(0.3)(0.4)(0.8)(2.2)
(19.3)(24.7)(39.7)
0.00.00.0(0.2)(0.1)(0.2)(0.1)(2.0)
(18.7)(23.6)(11.7)
0.00.0(0.1)0.0(0.2)(0.2)(0.7)(0.2)(0.6)(1.1)
(28.0)
0.00.00.10.10.00.10.11.79.3
(15.2)35.4
SectorPolicy Risk
CVaR Scopes 1 + 2 Scope 3
Change from previous year
(percentage points)
Real EstateInformation TechnologyHealthcareTelecommunications ServicesConsumer DiscretionaryFinancialsConsumer StaplesIndustrialsMaterialsEnergyUtilities
(0.1)(0.2)(0.2)(0.2)(1.0)(1.3)(1.9)(6.7)
(13.5)(17.7)(20.6)
(0.1)(0.2)(0.2)(0.2)(0.5)(1.1)(1.4)(6.6)
(13.2)(13.1)(20.4)
0.00.0(0.1)0.0(0.6)(0.1)(0.6)(0.2)(0.3)(4.6)(0.2)
0.0(0.1)0.00.1(0.1)(1.0)(0.6)(2.8)1.1(0.5)4.2
SectorPolicy Risk
CVaR Scopes 1 + 2 Scope 3
Change from previous year
(percentage points)
58GPIF ESG REPORT 2020
Chapter 3 Evaluation and Analysis of Climate Change Risks and Opportunities
Chapter 1 GPIF’s ESG InitiativesChapter 2 Measuring the Im
pacts of ESG Activities
Policy Risks: Expanding the Scope of Analysis Enables Evaluation of a Wider Variety of Risks
We also analyzed policy risks, which, together with technological
opportunities, constitute transition risks and opportunities. In the
policy risk evaluation conducted in the supplementary guide to
last year’s ESG Report 2019, we analyzed the Scope 1 and
Scope 2 emissions of companies in the portfolio. This year, the
scope of the analysis was expanded to include Scope 3
emissions. These emissions consist of “upstream Scope 3,”
which encompasses the raw materials, services, and labor inputs
to companies’ production activities, and “downstream Scope 3,”
which covers the sale of produced goods and services. In the
analysis, we focused on changes in Scopes 1 and 2 from the
previous year and the magnitude of Scope 3 risks (Figures 1–4).
For overall policy risk CVaR including Scope 3, results for
domestic equities showed that there were greater risks in the
energy sector (which includes companies such as fossil fuel
mining companies), the utilities sector (which includes electric
power and other companies), and the materials sector, while
risks in the healthcare, telecommunications services, and
financial sectors remain low. This was a similar trend to last year.
Scope 1 and 2 risks decreased across all sectors (industries)
from the previous year, including energy (11.5 percentage
points), utilities (4.8 percentage points), and materials (9.1
percentage points). This may be largely attributable to the fact
that a portion of the costs of reducing emissions were passed
through to the corporate value chain as a result of the
introduction of Scope 3 in the current fiscal year. Meanwhile,
Scope 3 risks tend to be smaller than those of Scopes 1 and 2 in
all sectors as a whole. This is due to the fact that, although
absolute Scope 3 greenhouse gas emissions are generally large,
this is not necessarily the case when companies’ assumed
burden rates are taken into account. By sector, energy and
utilities have the highest Scope 3 policy risks, followed by the
consumer discretionary sector, which includes automobiles.
Conversely, for Scopes 1 and 2, risks for the materials sector
exceed those for the consumer discretionary sector.
Foreign equities showed the same trend as last year, with
risks in the utilities, energy, and materials sectors remaining
high. Policy risks in the utilities sector also increased from last
year. Compared with foreign equities, domestic equity policy risks
are greater in the energy sector, because certain companies in
the sector are weighted more heavily than others.
In the corporate bond analysis, the three industries with the
highest risks remain the energy, utilities, and materials industries,
both domestically and overseas. Changes in Scopes 1 and 2
differ from those of equities, however, due to the fact that the
equity portfolio and corporate bond portfolio have different
constituent companies. In terms of Scope 3, we found there to
be meaningful policy risks in the energy sector, which is
impacted greatly by the use of fossil fuels, in both domestic and
foreign portfolios.
Analysis of Equity and Corporate Bond Portfolio Using Climate Value-at-Risk, etc.
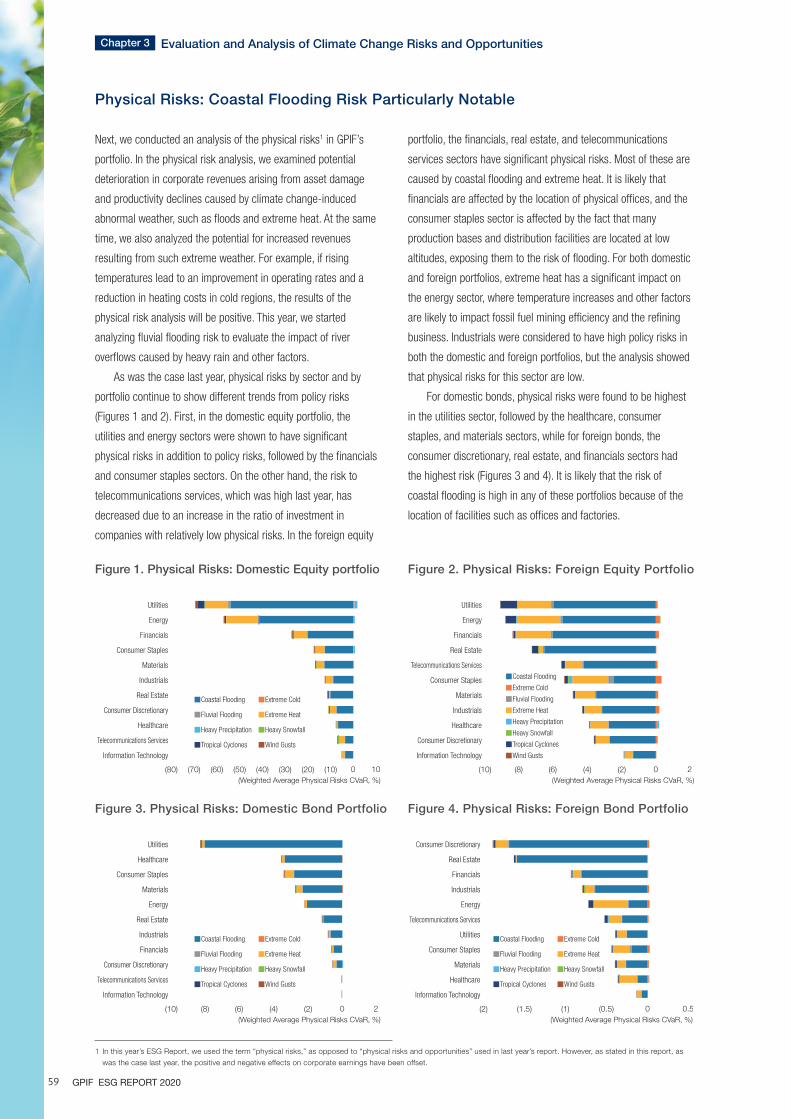
Chapter 3 Evaluation and Analysis of Climate Change Risks and Opportunities
59 GPIF ESG REPORT 2020
Physical Risks: Coastal Flooding Risk Particularly Notable
Next, we conducted an analysis of the physical risks1 in GPIF’s
portfolio. In the physical risk analysis, we examined potential
deterioration in corporate revenues arising from asset damage
and productivity declines caused by climate change-induced
abnormal weather, such as floods and extreme heat. At the same
time, we also analyzed the potential for increased revenues
resulting from such extreme weather. For example, if rising
temperatures lead to an improvement in operating rates and a
reduction in heating costs in cold regions, the results of the
physical risk analysis will be positive. This year, we started
analyzing fluvial flooding risk to evaluate the impact of river
overflows caused by heavy rain and other factors.
As was the case last year, physical risks by sector and by
portfolio continue to show different trends from policy risks
(Figures 1 and 2). First, in the domestic equity portfolio, the
utilities and energy sectors were shown to have significant
physical risks in addition to policy risks, followed by the financials
and consumer staples sectors. On the other hand, the risk to
telecommunications services, which was high last year, has
decreased due to an increase in the ratio of investment in
companies with relatively low physical risks. In the foreign equity
portfolio, the financials, real estate, and telecommunications
services sectors have significant physical risks. Most of these are
caused by coastal flooding and extreme heat. It is likely that
financials are affected by the location of physical offices, and the
consumer staples sector is affected by the fact that many
production bases and distribution facilities are located at low
altitudes, exposing them to the risk of flooding. For both domestic
and foreign portfolios, extreme heat has a significant impact on
the energy sector, where temperature increases and other factors
are likely to impact fossil fuel mining efficiency and the refining
business. Industrials were considered to have high policy risks in
both the domestic and foreign portfolios, but the analysis showed
that physical risks for this sector are low.
For domestic bonds, physical risks were found to be highest
in the utilities sector, followed by the healthcare, consumer
staples, and materials sectors, while for foreign bonds, the
consumer discretionary, real estate, and financials sectors had
the highest risk (Figures 3 and 4). It is likely that the risk of
coastal flooding is high in any of these portfolios because of the
location of facilities such as offices and factories.
1 In this year’s ESG Report, we used the term “physical risks,” as opposed to “physical risks and opportunities” used in last year’s report. However, as stated in this report, as
was the case last year, the positive and negative effects on corporate earnings have been offset.
100(Weighted Average Physical Risks CVaR, %)
(80) (70) (60) (50) (40) (30) (20) (10)
Utilities
Energy
Financials
Consumer Staples
Materials
Industrials
Real Estate
Consumer Discretionary
Healthcare
Telecommunications Services
Information Technology
■Coastal Flooding ■Extreme Cold
■Fluvial Flooding ■Extreme Heat
■Heavy Precipitation ■Heavy Snowfall
■Tropical Cyclones ■Wind Gusts
20(10) (8) (6) (4) (2)
Utilities
Healthcare
Consumer Staples
Materials
Energy
Real Estate
Industrials
Financials
Consumer Discretionary
Telecommunications Services
Information Technology
(Weighted Average Physical Risks CVaR, %)
■Coastal Flooding ■Extreme Cold
■Fluvial Flooding ■Extreme Heat
■Heavy Precipitation ■Heavy Snowfall
■Tropical Cyclones ■Wind Gusts
20(10) (8) (6) (4) (2)
Utilities
Energy
Financials
Real Estate
Telecommunications Services
Consumer Staples
Materials
Industrials
Healthcare
Consumer Discretionary
Information Technology
(Weighted Average Physical Risks CVaR, %)
■Coastal Flooding
■Extreme Cold
■Fluvial Flooding
■Extreme Heat
■Heavy Precipitation
■Heavy Snowfall
■Tropical Cyclones
■Wind Gusts
0.50(2) (1.5) (1) (0.5)
Consumer Discretionary
Real Estate
Financials
Industrials
Energy
Telecommunications Services
Utilities
Consumer Staples
Materials
Healthcare
Information Technology
(Weighted Average Physical Risks CVaR, %)
■Coastal Flooding ■Extreme Cold
■Fluvial Flooding ■Extreme Heat
■Heavy Precipitation ■Heavy Snowfall
■Tropical Cyclones ■Wind Gusts
Figure 1. Physical Risks: Domestic Equity portfolio
Figure 3. Physical Risks: Domestic Bond Portfolio
Figure 2. Physical Risks: Foreign Equity Portfolio
Figure 4. Physical Risks: Foreign Bond Portfolio

(Note) Global warming potential figures do not have emission reduction targets factored in. Figures in parentheses ( ) indicate global warming potential with emissions reduction targets factored in.
(Source) Reproduced by permission of MSCI ESG Research LLC ©2021. All rights reserved.
60GPIF ESG REPORT 2020
Chapter 3 Evaluation and Analysis of Climate Change Risks and Opportunities
Chapter 1 GPIF’s ESG InitiativesChapter 2 Measuring the Im
pacts of ESG Activities
Analysis of Portfolio Global Warming Potential
Global warming potential is a measure of the extent to
which greenhouse gases emitted by the companies
reviewed can potentially contribute to global warming,
expressed as an increase in temperature. Specifically, we
estimate individual companies’ greenhouse gas emission
trends through 2100, and gauge how much global average
temperatures would increase if all greenhouse gas
emissions followed the same path.
In estimating warming potential, we (1) derive a function
linking carbon intensity to warming potential for each sector
based on literature such as the Emissions Gap Report
published by UNEP, (2) estimate the future carbon intensity of
each company, (3) calculate the warming potential for each
company in the portfolio using the function derived in (1) and
the carbon intensity of each company estimated in (2), and
(4) calculate the weighted average warming potential of the
portfolio using the portfolio weight of each company.
In previous years’ reports, we used Scope 1 (direct) and
Scope 2 (indirect) emissions for this analysis, but this year,
we also included Scope 3 emissions in addition to factoring in
companies’ emission reduction targets.
The results of the analysis showed that the warming
potential of GPIF’s portfolio as a whole was 3.40°C for
domestic equities, 3.26°C for domestic bonds, 3.49°C for
foreign equities, and 4.34°C for foreign bonds (Figures 1–4).
In all asset classes, warming potential is well above 2°C.
Looking at domestic and overseas trends, the warming
potential for foreign companies was generally higher than that
for domestic companies.
A breakdown of trends by sector reveals that warming
potential tended to be high in the energy and materials
sectors across all asset classes (Figures 1–4), while a
comparison of the domestic and overseas portfolios shows
that the warming potential of foreign companies is higher
than that of Japanese companies, particularly in the energy
and materials sectors.
In all cases, warming potential is naturally lower when
emission reduction targets are factored in than when they are
not. To bring the global warming potential closer to 2°C, it is
critical for companies to set reduction targets and take action
to achieve them.
Figure 1. Domestic Equities
Global Warming Potential in GPIF Portfolio by Sector
Figure 3. Foreign Equities
Figure 2. Domestic Bonds
Figure 4. Foreign Bonds
Total
Energy
Consumer
Discretionary
Consumer Staples
Real Estate
Financials
Telecomm
unications Services
Materials
Healthcare
Information
Technology
Industrials
Utilities
0
10℃
(5)
5
■Scope 1 + 2 Warming Potential ■Scope 3 Warming Potential■Cooling Potential ●Aggregate Warming Potential
3.40(3.28)
6.13(5.69)
4.26(4.16)
4.11(3.89)
4.04(3.86)
3.63(3.63)
3.66(3.32)
3.30(3.28)
3.05(2.94)
3.01(2.88)
2.71(2.62)
2.56(2.53)
Total
Energy
Consumer
Discretionary
Consumer Staples
Real Estate
Financials
Telecomm
unications Services
Materials
Healthcare
Information
Technology
Industrials
Utilities
0
10℃
(5)
5
3.26(3.19)
5.24(4.74)
3.61(3.47)
3.97(3.60)
4.17(3.96)
3.34(3.34)
3.59(3.51)
4.03(4.02)
2.64(2.58)
3.18(2.91)
2.41(2.35)
2.76(2.71)
■Scope 1 + 2 Warming Potential ■Scope 3 Warming Potential■Cooling Potential ●Aggregate Warming Potential
0
10℃
(5)
5
3.49(3.38)
7.34(7.28)
4.06(3.99)
4.07(3.83)
4.88(4.77)
3.23(3.17)
2.80(2.50)
5.27(5.18)
3.10(3.07)
2.80(2.66)
3.02(2.93)
3.54(3.41)
Total
Energy
Consumer
Discretionary
Consumer Staples
Real Estate
Financials
Telecomm
unications Services
Materials
Healthcare
Information
Technology
Industrials
Utilities
■Scope 1 + 2 Warming Potential ■Scope 3 Warming Potential■Cooling Potential ●Aggregate Warming Potential
0
10℃
(5)
5
4.34(4.25)
8.49(8.46)
4.17(4.10)
4.51(4.21)
4.76(4.67)
4.20(4.16)
4.31(3.77)
6.14(6.07)
2.97(2.95)
2.73(2.69)
3.29(3.16)
3.42(3.15)
Total
Energy
Consumer
Discretionary
Consumer Staples
Real Estate
Financials
Telecomm
unications Services
Materials
Healthcare
Information
Technology
Industrials
Utilities
■Scope 1 + 2 Warming Potential ■Scope 3 Warming Potential■Cooling Potential ●Aggregate Warming Potential
Analysis of Equity and Corporate Bond Portfolio Using Climate Value-at-Risk, etc.

Chapter 3 Evaluation and Analysis of Climate Change Risks and Opportunities
(Source) GPIF, S&P Trucost Limited © Trucost 2021 (Source) GPIF, S&P Trucost Limited © Trucost 2021
(Note) Greenhouse gas emissions are categorized as “domestic” or “imports” for
demand inside a region, and as “exports” for emissions associated with
domestic production to meet overseas demand.
Figure 1. Weight by Country in GPIF Government Bond Portfolio Figure 2. Carbon Intensity of Government Bond Portfolio
Japan 47.5%
U.S. 22.7%
France 5.4%
Italy 5.3%
Germany 3.6%
Spain 3.3%
U.K. 3.0%
Others 9.4%
As of March 31, 2021
0
4
3
1
2
■Domestic ■Exports ■Imports
GPIF Portfolio Benchmark
(tCO2e/million yen)
61 GPIF ESG REPORT 2020
Analysis of Government Bond Greenhouse Gas Emissions, etc.
The greenhouse gas emissions and other analyses covered so
far have examined the equities and corporate bonds issued by
companies in which GPIF invests. This section, meanwhile,
analyzes sovereign bonds issued by national governments.
There are basically two ways of analyzing climate change risk
for government bonds: one is to consider only greenhouse gas
emissions produced by the government sector of the nation
issuing the bond, while the other takes into account the entire
sphere of influence of the nation as a whole, including
greenhouse gas emissions generated by the activities of that
country’s corporations and individuals. The analysis conducted
for this report adopts the latter approach.
In the analysis of government bonds, just as when
analyzing equities and corporate bonds, it is important to
understand that results are greatly influenced by factors such
as which specific sovereign bonds make up the portfolio. The
overall GPIF portfolio of foreign and domestic government
bonds (hereinafter, “GPIF’s overall government bond portfolio”)
is made up of about half foreign and half domestic government
bonds (Figure 1). In addition, when we examined the difference
between the country weights of GPIF’s overall government bond
portfolio versus a weighted average benchmark of foreign and
Japanese government bonds derived from the ratios in the
policy asset mix, GPIF’s overall government bond portfolio was
shown to be similar to the benchmark, albeit with slightly lower
holdings in Japanese bonds.
Based on the concept of weighted average carbon intensity
(WACI), we compared greenhouse gas emissions per million
yen of gross domestic product (GDP) for countries in the
government bond portfolio against the GPIF’s overall
government bond portfolio and the benchmark. In this analysis,
WACI for GPIF’s overall government bond portfolio was found to
be slightly higher than the benchmark (Figure 2). This was
partly because the portfolio is overweight in bonds issued by
countries where greenhouse gas emissions are relatively high,
such as Indonesia and South Africa.
Greenhouse Gas Emission and Climate Value-at-Risk Analysis of Government Bond PortfolioUnderstanding how the many risks related to climate change will affect government bond prices is an extremely complex problem.
These risks, however, undeniably have the potential to affect GPIF’s portfolio considering the fiscal burden and other impacts from the
response to climate change-related transition and physical risks. In this report, we conducted an analysis based on several assumptions
to gauge the potential impact of climate change risks to GDP for the countries in which we invest.

Figure 3. Analysis of GPIF Government Bond Portfolio: Difference in GDP between Immediate 2°C Scenario and Delayed 2°C Scenario
(Note) Delayed 2°C scenario set at 0%. Some estimates at the time of publication of the model (June 2019) are used in the figures for 2020.
(Source) MSCI ESG Research LLC, REMIND-MAgPIE 1.7-3.0, NGFS Phase I Scenarios of June 2020, IIASA 2020
2010 2020 2030 2040 2050 (Year)(0.6)(0.4)(0.2)0.00.20.40.60.8(%) Japan Europe U.S.
Country/RegionImmediate 2°C Scenario vs Delayed 2°C Scenario (%)
2030 2040 2050
Japan (0.4) 0.1 0.4
U.S. 0.2 0.6 0.3
Europe 0.2 0.3 0.6
62GPIF ESG REPORT 2020
Chapter 3 Evaluation and Analysis of Climate Change Risks and Opportunities
Chapter 1 GPIF’s ESG InitiativesChapter 2 Measuring the Im
pacts of ESG Activities
CVaR Analysis of Government Bonds
Last year, we conducted a CVaR analysis of equities and
corporate bonds only, but this year, we also conducted the
same analysis for government bonds. While the analysis for
equities and corporate bonds estimates the impact on
securities values, the CVaR methodology for government bonds
assesses how the implementation of policies to achieve the
2°C target would affect GDP trends for individual countries
through 2050.
For this analysis, we used the REMIND model developed by
the Potsdam Institute for Climate Impact Research and adopted
by the Network of Central Banks and Supervisors for Greening
the Financial System (NGFS).1 There is no one single path to
achieving the 2°C target by the end of this century; for this
analysis, we assumed (1) an immediate 2°C scenario, in which
proactive climate action is taken immediately, and (2) a delayed
2°C scenario, in which climate action is delayed.
For (1) the immediate 2°C scenario, we assume that the
power generation capacity from renewable energy will rapidly
expand in the 2020s, carbon prices will surge throughout the
world in the 2030s, and decarbonization efforts will accelerate
across the entire economy. Meanwhile, for (2) the delayed 2°C
scenario, we assume that by 2030 each country will achieve
the national targets set in 2016 at the conclusion of the Paris
Agreement, but conversely that environmentally friendly energy
technologies will not become widespread until that year. The
analysis also assumes that carbon prices will not rise
significantly until 2030 and will increase sharply thereafter.
In this report, we analyzed the impact on GDP in Japan, the
United States, and Europe in each of these two scenarios. Each
region showed a decline in GDP when climate measures were
taken, although the magnitude of the impact varies by scenario
and region.
Figure 3 shows the difference in the impact on GDP
between the immediate 2°C scenario and the delayed 2°C
scenario (difference in GDP between the two scenarios). If the
value on the graph is positive (negative), it can be interpreted
as a positive (negative) impact on GDP if the immediate 2°C
scenario is implemented.
In the case of Japan, the immediate 2°C scenario has a
negative impact on GDP as of 2030, but a positive impact on
GDP as of 2040 and 2050. In the United States and Europe,
the immediate 2°C scenario has a positive impact on GDP at all
time points—2030, 2040, and 2050. The result of this analysis
shows that the immediate 2°C scenario can be expected to
have a positive impact on GDP in the long term compared with
the delayed 2°C scenario.
1 Please refer to page 40 for information about the NGFS. Of NGFS Phase 1’s three models, we used the REMIND model (REMIND 1.7-MagPIE 3.0 Integrated Assessment Model) only.
Greenhouse Gas Emission and Clim
ate Value-at-Risk Analysis of Government Bond Portfolio

Chapter 3 Evaluation and Analysis of Climate Change Risks and Opportunities
Features and Physical Risks of GPIF’s Real Estate Portfolio
GPIF’s portfolio includes traditional assets such as equities and
bonds, as well as alternative assets such as infrastructure,
private equity, and real estate. In this year’s climate-related
financial disclosures, we conducted a quantitative analysis of
climate change risk for domestic real estate in which we invest
through private equity funds. Among these, we are able to
analyze the impact of physical risks and transition risks on the
value of real estate assets. Breaking down domestic real estate
properties included in the analysis by type, industrial properties
such as logistics facilities account for the largest share at 61%,
followed by rental housing (15%), retail (12%), and offices (10%).
In the physical risk analysis, we assessed the risks of (1)
coastal flooding, (2) fluvial flooding, (3) tropical cyclones, (4)
extreme heat, and (5) extreme cold, as well as comprehensive
physical risks covering all of those risks by sector. If available,
information on countermeasures against physical risks for each
property is partially included in the analysis, but in general, we
use methods that emphasize information on the location and
topography of the property. Results are expressed in terms of
physical risk CVaR and classified into six levels: very high, high,
medium, low, very low, and no risk.
The results of the analysis indicate a high risk from (3)
tropical cyclones across all sectors. Risks from (4) extreme heat
were relatively high as well, except for rental housing. On the
other hand, risks posed to the overall portfolio by (1) coastal
flooding and (2) fluvial flooding, which are of particular concern
in Japan, are low despite the inclusion of a very small number of
properties with a particularly high risk of coastal and other
flooding (Figure 1). As a result, comprehensive physical risks
covering (1) to (5) are generally “low” or “very low” in each
sector. However, when we looked at the distribution of physical
risks for each property, we found that there were a small number
of properties with high risks, such as coastal flooding (Figure 2).
Global Warming Potential and Transition Risks
Analysis of Real Estate Portfolio Using Climate Value-at-RiskIn last year’s report, GPIF conducted an analysis of climate-related financial information for traditional asset classes only. This
fiscal year, however, we are including a new analysis of domestic real estate included in alternative assets. CVaR enables us
to analyze the physical risks, transition risks, and global warming potential of our domestic real estate portfolio.
This analysis also confirmed that the warming potential of the
entire portfolio analyzed is currently 2.78°C, which is higher than
the 2°C and 1.5°C targets set by the Paris Agreement (Figure 3).
In the analysis of transition pathways, we measured the carbon
intensity (greenhouse gas emissions per area) of each property
and estimated the required reduction in carbon intensity by 2034
needed to reach the 1.5°C, 2°C, and 3°C targets. Data on
environmental performance and the energy usage for each
property is included in the analysis if available, but in general, we
use methods that emphasize information on the location and
topography of the property if such information has not been
disclosed. The analysis results showed that portfolio emissions
need to decline by a total of 32.8 CO2-equivalent kilograms per
square meter over the next ten years or so in order to achieve
the 1.5°C target (Figure 4).
As described above, by analyzing climate-related financial
information on the real estate portfolio using CVaR, we were able
to evaluate physical risks from natural disasters, global warming
potential, and the distance to the achievement of the 1.5°C
target. However, unlike climate-related risk and opportunity
63 GPIF ESG REPORT 2020

Coastal Flooding Fluvial Flooding Tropical Cyclones Extreme Heat Intense Cold Aggregate Physical Risks
Industrial Very Low Low High High No Risk Low
Offices Very Low No Risk High High No Risk Very Low
Rental Housing Very Low No Risk High No Risk No Risk Low
Retail No Risk No Risk High High No Risk Very Low
Others No Risk No Risk High High No Risk Very Low
Figure 1. Physical Risks by Sector
(Source) Reproduced by permission of MSCI ESG Research LLC ©2021
(Source) Reproduced by permission of MSCI ESG Research LLC ©2021
Coastal Flooding
Fluvial Flooding
Tropical Cyclones
Extreme Heat
Extreme Cold
AggregatePhysical Risks
■ No Risk ■ Very Low ■ Low ■ Medium ■ High ■ Very High
0% 20% 40% 60% 80% 100%
Figure 2. Distribution of Properties by Physical Risk
Figure 4. Reduction in GHG Emissions Required to Achieve 1.5°C Scenario
(Source) Reproduced by permission of MSCI ESG Research LLC ©2021
analysis for traditional asset classes, there is still a great deal of
room for further development in the analysis for alternative
assets. There are several reasons for this, such as data
limitations that restrict the scope of analysis for alternative
assets, and the fact that results differ at the portfolio level
depending on whether the weighted average is calculated using
gross floor area or asset price.
Figure 3. Global Warming Potential: Domestic Real Estate Portfolio
(Source) Reproduced by permission of MSCI ESG Research LLC ©2021
0
50
40
30
10
20
Present 1.5°C Scenario■ Carbon Intensity of Portfolio ■ Reduction Required to Achieve Targets
(kg CO2e/square meters)
13.0
32.8
45.8
64GPIF ESG REPORT 2020
Chapter 3 Evaluation and Analysis of Climate Change Risks and Opportunities
Chapter 1 GPIF’s ESG InitiativesChapter 2 Measuring the Im
pacts of ESG ActivitiesAnalysis of Real Estate Portfolio Using Clim
ate Value-at-Risk
012_8221379102110.indd 64012_8221379102110.indd 64 2021/09/24 10:23:202021/09/24 10:23:20

Chapter 3 Evaluation and Analysis of Climate Change Risks and Opportunities
65 GPIF ESG REPORT 2020
Inter-Industry Risk and Opportunity Transfer Visualization Process
The analyses presented in previous sections of this report adopt
a bottom-up approach to explore the impact of climate risks on
GPIF’s portfolio. This approach begins by measuring and
analyzing the carbon footprint, CVaR, and other factors of
individual companies and securities, then aggregating the results
across all of GPIF’s equity and bond holdings.
This section departs from the perspective of the direct
impact on GPIF’s portfolio to examine how climate change-
related risks and opportunities will shift between industries over
the long term to 2030 and 2050, according to an analysis
performed by Astamuse. Specifically, this analysis uses data on
industry-level required greenhouse gas (GHG) reductions,
expected GHG reduction contributions of individual
decarbonization technologies, and projections for the rate at
which they will be implemented in society. As opposed to the
CVaR analysis, which assumes that the transfer of risks and
opportunities occur within the same industry, the purpose of this
analysis is to focus more on the opportunities inherent in
decarbonization and appraise different GHG reduction
technologies by understanding the transfer of risks and
opportunities that occur between industries. We reveal the
potential for certain industries to boost growth by turning risks
for other industries into opportunities for themselves.
The first step in this analysis is to identify the emissions
reductions required in each industry by 2030 and 2050 to
achieve the target of limiting global warming to “well below 2,
preferably to 1.5 degrees Celsius, compared to pre-industrial
levels” (Step 1 of Figure 1) as agreed in the Paris Agreement.
Next, we identified the technologies that contribute to the
reduction of GHG, estimated emissions reduction rates for each
technology compared with existing technologies, and forecast the
implementation of each in 2030 and 2050. We then use these
figures to calculate the GHG reduction contributions of individual
technology fields (Step 2 of Figure 1, and Figure 2). By
aggregating emissions reduction contributions for each
technology by industry, we can estimate GHG reduction
contributions by industry for 2030 and 2050. The analysis
performed by Astamuse is unique in that its estimation of the
implementation rate of GHG reduction technologies uses not only
the number of global patent applications, but also competitive
research and development investments (grants), such as Japan’s
Grants-in-aid for Scientific Research (kakenhi), as well as trends
in the number of research papers published as a way to analyze
the future life cycle of those technologies.
Finally, the analysis identifies potential inter-industry
transfers of risks and opportunities by calculating the gap
between required GHG reductions and reduction contributions for
each industry. A positive value indicates a net opportunity –
where the opportunity is greater than the risk – and a negative
value indicates a net risk (Step 3 of Figure 1). For reference, we
also multiplied these values by the carbon price forecast for
2030 and 2050 to convert them into monetary values.
Analysis of Inter-Industry Transfer of Transition Risks and OpportunitiesAs the world transitions to a net-zero society, we expect a large-scale transfer of risks and opportunities between industries to
occur. Our analysis shows that the opportunities associated with the transition to a net-zero society greatly exceed the risks,
particularly in the energy and chemical industries. We also discover that Japan has promising technologies in these industries.

Figure 1. Inter-Industry Risk and Opportunity Transfer Visualization Process
Figure 2. Top Ten Technology Fields Expected to Contribute to GHG Reductions in 2050
Step 1:Risk Analysis
Estimate (1) Required GHG reductions by industry for 2030/2050.* The Sustainable Development Scenario (SDS) developed by the International Energy Agency (IEA) is used to estimate required GHG
reduction rates for 2030/2050 for each industry.
Step 2:Opportunity Analysis
Identify technologies with the potential to contribute to GHG reductions by industry and estimate (2) GHG Reduction Contributions (= current GHG emissions × GHG reduction rate × implementation rate) in 2030/2050 for individual decarbonization technologies.
Step 3: Risk and Opportunity Transfer Visualization
Net Opportunities of GHG Reduction = (2) GHG Reduction Contributions – (1) Required GHG Reductions* As a reference, the values were converted into monetary amounts using the carbon price based on the scenario of keeping the rise in
global mean temperature to within 2°C in 2100 with a probability of 66%, which was proposed by the International Energy Agency and International Renewable Energy Agency.
(Source) Prepared by GPIF based on Astamuse analysis
Industries Technology Fields
Present 2030 2050GHG Emissions of Target Segment
(a)
GHG Reduction Rate (b)
Implementation Rate (c)
GHG Reduction Contributions (a × b × c)
GHG Reduction Rate (d)
Implementation Rate (e)
GHG Reduction Contributions (a × d × e)
billion tons % % billion tons % % billion tons
EnergyHydropower energy, small and medium hydroelectric power generation
10.02 100% 65% 6.51 100% 65% 6.51
Chemicals CCS from large emitters 8.00 90% 5% 0.36 90% 85% 6.12Energy Marine energy 6.64 100% 15% 1.00 100% 85% 5.65
EnergySolar power generation, solar cells, solar thermal power generation
6.64 99% 50% 3.29 99% 85% 5.59
Energy Bioenergy(power generation, fuel) 11.48 55% 15% 0.95 55% 85% 5.37
Telecommunications Power semiconductors 7.27 71% 50% 2.58 71% 100% 5.16Chemicals Methanol production 8.83 65% 15% 0.86 65% 85% 4.88Social Infrastructure
Power generation by anaerobic digestion of waste biomass 6.64 15% 15% 0.15 85% 85% 4.80
Energy Green hydrogen 8.43 100% 0% 0.00 100% 50% 4.21
Energy Hydrogen/ammonia power generation 10.02 79% 5% 0.40 79% 50% 3.96
(Source) Prepared by GPIF based on Astamuse analysis
Inter-Industry Demand Shift Forecast
The risk and opportunity profile for each industry in 2030 and
2050 as determined by the above process is shown in Figure
3. In 2050, opportunities will outweigh risks in nine industries,
including energy, chemicals, and social infrastructure, while
risks will outweigh opportunities in four industries, including
construction, civil engineering, and construction-related
products. The energy industry, which is considered to have the
greatest net opportunities in 2030 and 2050. While this
industry is required to reduce GHG emissions the most in both
target years, it is also expected to contribute greatly to
decarbonization in other industries through a wide range of
technologies, including hydrogen systems and infrastructure,
hydropower energy and small and medium hydroelectric power
generation (proliferation of small and medium hydroelectric
power generation, optimization of weather forecasting and
power generation, and improvement of flow control), and solar
power generation and solar cells (weight reduction and cost
reduction through the use of new materials). These GHG
reduction contributions are expected to far exceed the level of
reductions required for the industry.
For chemicals, although decarbonization opportunities in
2030 are not as great, from 2030 to 2050, technological
developments in Carbon Capture and Storage (CCS) from
large-scale sources of CO2 emissions and Direct Air Capture
(DAC) are forecast to accelerate, and, as costs come down and
efficiency improves, these technologies are expected to be more
widely adopted. In the social infrastructure industry, progress in
the utilization of useful biogases through the treatment of waste
and sewage sludge and the implementation of underground and
submarine carbon storage will lead the reduction of GHG
emissions in a variety of different sectors, including agriculture,
forestry and fisheries.
On the other hand, the construction, civil engineering, and
construction-related products industry is expected to have
negative net opportunities in both 2030 and 2050. While the
required GHG reduction in this sector is just as high as that of
the energy sector, unlike that and other industries, the
technologies in construction and civil engineering, such as
low-energy housing, are seen as making limited GHG reduction
contributions to other industries.
66GPIF ESG REPORT 2020
Chapter 3 Evaluation and Analysis of Climate Change Risks and Opportunities
Chapter 1 GPIF’s ESG InitiativesChapter 2 Measuring the Im
pacts of ESG ActivitiesAnalysis of Inter-Industry Transfer of Transition Risks and Opportunities

Chapter 3 Evaluation and Analysis of Climate Change Risks and Opportunities
Figure 3. Transfer of Risks and Opportunities by Industry in 2030 and 2050
Industries
2030 2050年
Reduction Contributions
(a)
Required Reduction (b)
GHG Reduction Net Opportunity Reduction
Contributions (a)
Required Reduction
(b)
GHG Reduction Net Opportunity
Volume (a - b)
(Reference) Monetary Amount
Volume (a - b)
(Reference) Monetary Amount
billion tons billion tons billion tons US $billion billion tons billion tons billion tons US $billion
Energy 16.22 3.82 12.4 1,302.1 42.74 7.97 34.77 6,258.5
Chemicals, etc. 2.20 0.53 1.67 175.7 14.92 2.95 11.97 2,154.5
Social Infrastructure 1.61 0.26 1.35 142.0 12.36 0.54 11.82 2,126.9
Electrical Equipment 2.45 0.01 2.44 256.1 5.25 0.08 5.17 930.3
Automobiles 2.18 0.17 2.02 211.9 5.75 0.92 4.83 869.4
Machinery 0.75 0.11 0.64 67.1 5.22 0.63 4.59 826.1
Telecommunications 2.58 0.34 2.24 235.2 5.16 1.34 3.82 687.4
Transportation 0.24 0.20 0.04 4.6 1.97 0.95 1.02 184.0
Durable Consumer Goods 0.60 0.09 0.52 54.3 0.86 0.49 0.38 67.9
Food 0.04 0.19 (0.15) (16.2) 0.37 1.07 (0.7) (126.6)
Agriculture, Forestry and Fisheries 0.32 1.39 (1.07) (112.3) 1.85 2.77 (0.92) (166.3)
Metals, Mining / Paper Products 1.52 0.64 0.87 91.7 2.48 3.57 (1.09) (196.7)
Construction, Civil Engineering and Construction-Related Products
0.19 1.49 (1.3) (136.1) 0.83 8.27 (7.43) (1,337.9)
(Note) Carbon price is a reference value converted at US $105/ton in 2030 and US $180/ton in 2050.
(Source) Prepared by GPIF based on Astamuse analysis
Analysis of Patent Competitiveness of Decarbonization Technologies by Country/Region
This analysis also examined the patent competitiveness of
decarbonizing and low-carbon technologies by country and
region. In MSCI’s CVaR analysis of low-carbon technologies,
“forward citations,” “backward citations,” “market coverage,”
and “cooperative patent classification coverage” were
factored into the estimation of patent value. The analysis
performed by Astamuse, on the other hand, assigns each
patent a “Patent Impact Score,” which evaluates the patent’s
impact in terms of its exclusivity rights, in addition to factors
such as the geographical scope (countries of application, etc.)
and remaining term of these rights. Next, each company’s
“Total Patent Assets” is obtained by calculating the sum of all
Patent Impact Scores for each individual company. The
competitiveness of each country’s patents is calculated using
the Total Patent Asset indicator.
The results of this analysis indicate that the areas where
Japan’s technological competitiveness is highest include the
energy technology field (hydropower energy, small and
medium hydroelectric power generation, hydrogen/ammonia
power generation, etc.) the chemical technology field (fuel
cells and storage batteries), and the metal, mining and paper
product technology field (low-carbon steelmaking). On the
other hand, the analysis found that the United States is
superior in bioenergy and marine energy within the energy
technology field, the social infrastructure technology field,
and the transportation technology field (Figure 4).
This analysis shows that socioeconomic trends and the
evolution of technologies toward net-zero will bring about a
shift in supply and demand among industries and among
countries, and that many companies in Japan have the
potential to benefit from this shift.
67 GPIF ESG REPORT 2020

68GPIF ESG REPORT 2020
Chapter 3 Evaluation and Analysis of Climate Change Risks and Opportunities
Chapter 1 GPIF’s ESG InitiativesChapter 2 Measuring the Im
pacts of ESG Activities
Areas for Improvement in Analysis
While many different techniques were employed to make the
estimates as sound as possible, several points still need to be
refined to improve the accuracy of these assessments. In
particular, we recognize room for improvement in the
following areas.
The first has to do with the competitive relationship between
different decarbonization technologies. For example, in the
energy field, hydropower energy and solar power generation
compete with each other; as one technology becomes more
widely adopted, the other technology will have less room to grow.
This point, however, is not considered in the analysis.
The other issue beyond the scope of this analysis is
investment. Although investment in research and development
is taken into account in estimating the future implementation
rates of decarbonization technologies, the enormous
expenditures required for implementation toward 2030 and
2050 has not been factored into this analysis. Some of that
investment may be covered by government expenditure, but the
majority will be borne by the industries concerned. In the
energy and chemical sectors in particular, it is evident that
aggressive investment will be necessary going forward if major
opportunities are to be gained.
Technology Fields Technology Japan U.S. Europe U.K. South KoreaEnergy Bioenergy 26.3 100.0 49.4 6.7 22.5
Hydropower energy, small and medium hydroelectric power generation
100.0 39.3 51.3 4.3 33.6
Smart grid / smart city 100.0 81.8 38.5 4.4 43.7Hydrogen/ammonia power generation 100.0 42.0 38.5 2.2 12.7Hydrogen systems and infrastructure 100.0 68.2 36.7 9.4 54.1Solar power generation 100.0 78.4 69.5 5.7 76.2Wind Power 27.7 54.6 100.0 3.4 15.2Marine energy 39.0 100.0 70.2 15.7 52.9High-efficiency thermal power generation 59.0 100.0 21.3 3.0 20.3Geothermal power 100.0 98.4 65.4 12.1 89.4Nuclear power, nuclear fusion 34.7 100.0 31.6 21.4 29.5
Social Infrastructure Underground and submarine carbon storage 25.3 100.0 28.7 13.1 28.2Underground injection, submarine storage 72.0 100.0 37.4 11.4 34.9Waste and sewage sludge treatment 42.7 100.0 95.8 3.1 72.9
Chemicals Bio materials 50.7 100.0 46.9 1.9 41.2Materials capable of CO2 absorption/adherence/separation/condensation/long-term storage
78.6 100.0 39.4 11.6 37.4
Fuel cells 100.0 32.0 18.0 4.1 36.5Batteries 100.0 31.6 18.8 2.0 57.3Reduction of CFC emissions, green refrigerants 46.4 100.0 5.2 0.0 2.7Carbon reuse 65.4 100.0 46.2 13.4 30.4
Metal, Mining, and Paper Products Low-carbon steelmaking 100.0 48.0 20.9 1.3 43.9Construction, Civil Engineering and Construction-Related Products
Energy-efficient housing 100.0 96.1 97.6 8.2 62.9
Electrical Equipment Electrification of industrial equipment, energy management
69.2 100.0 67.4 8.1 50.0
Energy harvesting 100.0 97.0 92.2 11.6 65.4Reducing losses in power transmission 100.0 88.1 25.0 5.4 25.8
Machinery Electric drive, power supply equipment 99.7 100.0 48.2 7.9 12.0Ammonia drive 99.7 100.0 43.6 9.2 22.7Heat storage, heat transport technology, heat pumps
100.0 60.7 57.7 10.3 29.4
Automobiles Hydrogen/fuel cell vehicles 100.0 34.1 29.1 3.2 62.1Clean energy vehicles 92.7 56.9 8.1 3.2 100.0Electric Vehicles 100.0 39.8 32.4 1.6 36.1
Durable Consumer Goods Energy-efficient home appliances and lighting 25.2 100.0 17.0 3.1 20.0Transportation Smart transport, MaaS 69.1 100.0 35.2 2.3 23.1
Modal shift 23.5 100.0 16.3 4.7 40.3Agriculture, Forestry and Fisheries Advanced uses of wood 90.6 94.5 100.0 18.9 26.7
Smart agriculture 58.2 100.0 66.6 28.3 15.8Cultured meat/meat substitutes/dairy substitutes 20.4 99.0 100.0 9.9 14.0Afforestation, desert greening 81.0 87.3 19.7 0.0 100.0
Food Reducing byproducts and food waste in manufacture of food products
100.0 70.1 49.4 7.8 59.5
Telecommunications Power semiconductors 86.1 100.0 49.2 1.7 9.3
(Notes1) Indexed with the country with the highest total patent asset score in each technology domain assigned a score of 100.
(Notes2) “Europe” refers to EU member countries.
(Notes3) Chinese patents are not included in the analysis because it is difficult to compare them with patents from other countries from a quality perspective.
(Source) Prepared by GPIF based on Astamuse analysis
Figure 4. Comparison of Total Patent Assets of Decarbonization Technologies by Country/Region
Analysis of Inter-Industry Transfer of Transition Risks and Opportunities

Chapter 3 Evaluation and Analysis of Climate Change Risks and Opportunities
(Source) GPIF, S&P Trucost Limited © Trucost 2021
Figure 1. SDGs Positive Impact by Individual Goal (%)
0 5 10 15
SDG 1. No Poverty
SDG 2. Zero Hunger
SDG 3. Good Health and Well-Being
SDG 4. Quality Education
SDG 5. Gender Equality
SDG 6. Clean Water and Sanitation
SDG 7. Affordable and Clean Energy
SDG 8. Decent Work and Economic Growth
SDG 9. Industry, Innovation and Infrastructure
SDG 10. Reduced Inequalities
SDG 11. Sustainable Cities and Communities
SDG 12. Responsible Consumption and Production
SDG 13. Climate Action
SDG 14. Life below Water
SDG 15. Life on Land
SDG 16. Peace, Justice and Strong Institutions
SDG 17. Partnerships for the Goals
■Foreign Stocks
■Domestic Stocks
69 GPIF ESG REPORT 2020
SDGs Positive Impact Analysis
SDGs Additionality Analysis
In previous sections, we analyzed the risks and opportunities
in the context of climate change, but this section expands the
discussion beyond climate change by presenting an analysis
of the indirect contributions of GPIF’s equities portfolio to the
resolution of social issues identified in the Sustainable
Development Goals (SDGs) defined by the United Nations.
In this analysis, we determine the percentage of total
revenue generated by products and services that contribute
to the SDGs for the companies in GPIF’s equities portfolio
based on definitions by Trucost. We then measure the
exposure of companies contributing to the SDGs by using
portfolio holding weights to calculate the weighted average
revenue exposure, or “SDGs Positive Impact,” of the portfolio.
In a comparison of the SDGs Positive Impact of GPIF’s
domestic and foreign equities portfolios for each SDG, the
foreign equities portfolio generally tends to have a greater
positive impact. This result suggests that, from the
perspective of contributing to the SDGs and securing profit
opportunities thereby, Japanese companies have much room
for growth (Figure 1).
Each year, the Sustainable Development Solutions Network
(SDSN), launched in 2012 by the UN Secretary-General, releases
the Sustainable Development Report. The report includes the
“SDGs Performance Gap,” which estimates the distance to the
achievement of each target of the SDGs. The gap for each
country is expressed as the contribution rate of the country to the
global gap (Figure 2). For SDG 1: No Poverty and SDG 4: Quality
Education, for example, the G20 nations’ total contribution to the
gap is only around 30%, indicating that, if the SDGs are to be
achieved, improvement will be needed in non-G20 countries,
especially African nations. On the other hand, for SDG 13:
Climate Action, the G20 nations’ total contribution to the gap is
over 80%, indicating that this is a challenge particularly for the
developed nations and China.
Analysis of Revenue Opportunities Through Contributions to SDGsIn this section, we expanded the discussion beyond climate change and analyzed the opportunities that will arise for
individual companies with the resolution of the social issues identified by the Sustainable Development Goals (SDGs)
defined by the United Nations, as well as the contributions those companies make to resolve the issues.

(Note) Only includes constituents of MSCI ACWI. Graph shows the top ten
countries/regions by composition weight in order of highest to lowest
weighted average additionality.
(Source) MSCI, S&P Trucost Limited ©Trucost 2021
Figure 3. GPIF Portfolio Weighted Average SDGs Additionality
Figure 4. Comparison of Weighted Average SDGs Additionality by Major Countries and Regions
Weighted Average Additionality (%)
Domestic Stocks
GPIF Portfolio 59.9
TOPIX 57.5
Foreign Stocks
GPIF Portfolio 77.4
MSCI ACWI ex Japan 77.1
(Source) GPIF, S&P Trucost Limited ©Trucost 2021
1401200 20 40 60 80 100
Taiwan
Switzerland
China
U.S.
Canada
Australia
Japan
Germany
U.K.
France
(%)
70GPIF ESG REPORT 2020
Chapter 3 Evaluation and Analysis of Climate Change Risks and Opportunities
Chapter 1 GPIF’s ESG InitiativesChapter 2 Measuring the Im
pacts of ESG Activities
In the SDGs Positive Impact Analysis mentioned above, we linked
the SDGs targets with companies’ products and services. Even if
two companies provide the same products and services, their
degree of contribution to the SDGs will increase if the products and
services are provided in countries that are a long way from
achieving the SDGs. For example, marketing a certain drug in
emerging countries that have poor sanitation and high morbidity
rates is likely to make a greater contribution to the SDGs than if the
same drug were marketed in developed countries with low
morbidity rates. From this perspective, the SDGs Additionality
Analysis uses the SDGs Performance Gap to examine which
products and services marketed in which countries and regions
are able to contribute to what extent to the achievement of the
SDGs. These contributions are aggregated for each company
according to the composition of their net sales to determine their
SDGs Additionality.
Comparing the weighted average SDGs additionality and the
benchmark for GPIF’s portfolio reveals that both domestic and
foreign equities slightly exceeded the benchmark, showing that the
portfolio makes a relatively large contribution to the SDGs (Figure 3).
Among equities in major economies (top ten countries and
regions by MSCI ACWI composition weight), we calculated the
weighted average SDGs additionality by constituent country and
ranked them by country and region. Taiwan came out on top, far
ahead of the others, while Japan ranked seventh (Figure 4). In
Taiwan, semiconductor-related companies, which have an
extremely high weight in the index, are making significant
contributions to SDG 9: Industry, Innovation and Infrastructure and
SDG 17: Partnerships for the Goals, which seems to be largely
attributable to individual company attributes.
Japan U.S. EU China India G20 Total
SDG 1. No Poverty 0.1 0.2 0.3 1.8 21.8 33.3
SDG 2. Zero Hunger 1.0 3.5 4.6 10.5 23.8 57.8
SDG 3. Good Health and Well-Being 0.3 1.5 1.5 11.7 24.5 50.8
SDG 4. Quality Education 0.0 0.1 1.1 5.4 17.3 30.2
SDG 5. Gender Equality 1.6 2.6 3.1 10.7 29.2 58.7
SDG 6. Clean Water and Sanitation 0.7 2.1 2.6 17.2 23.1 56.3
SDG 7. Affordable and Clean Energy 0.4 1.0 1.4 20.1 19.7 49.7
SDG 8. Decent Work and Economic Growth 0.9 2.8 4.7 10.3 14.0 49.2
SDG 9. Industry, Innovation and Infrastructure 0.3 0.5 2.1 10.5 21.5 47.6
SDG 10. Reduced Inequalities 0.8 5.0 3.1 16.0 17.6 62.4
SDG 11. Sustainable Cities and Communities 1.2 1.4 2.7 13.5 27.2 56.8
SDG 12. Responsible Consumption and Production 3.3 12.5 14.7 13.7 8.8 74.7
SDG 13. Climate Action 4.7 16.3 14.6 17.2 5.2 81.9
SDG 14. Life below Water 2.0 3.9 6.1 23.2 16.6 66.3
SDG 15. Life on Land 1.4 4.3 2.9 18.7 22.0 66.3
SDG 16. Peace, Justice and Strong Institutions 0.4 2.9 3.1 18.2 18.7 57.9
SDG 17. Partnerships for the Goals 1.2 3.0 4.7 22.8 20.8 65.1
(Source) Prepared by GPIF based on Sustainable Development Report 2020
Figure 2. SDGs Performance Gap
Analysis of Revenue Opportunities through Contributions to SDGs

Importance of Disclosure Within the External Management Framework
Risks and Opportunities of Climate Change Transforming into Financial Information
Editor’s Note
Final Observations and Future Challenges
This is GPIF’s fourth ESG Report since it was first published in
2018 – one year after we began passive investment based on
ESG indexes. The reason we started creating this report was
because we believe that the effect of ESG investments cannot be
measured by short-term investment performance alone; in
addition to risk and return, many other different aspects need to
be evaluated. In this report, we once again focus on whether
GPIF’s ESG investments are, as we hope, leading to the
improvement of ESG evaluations and the enhancement of
individual companies’ ESG initiatives.
As such, compared with other pension funds and investment
companies, our ESG report inevitably focuses more heavily on
ESG scores and other quantitative evaluations and analyses. It is
also frustrating that we are unable to convey how corporate
engagement is progressing from a front-line perspective due to
restrictions on in-house equity investment. In an effort to partially
overcome these shortcomings, this ESG Report includes
commentary from ESG rating officers at ESG rating companies
and engagement officers at asset managers. We believe that,
while paying due attention to fairness and neutrality as a public
institution, communicating the state of GPIF’s ESG investment
and engagement is important not only to enhance transparency
but also to improve the effectiveness of our ESG investment. We
feel that further efforts and innovation are needed to make the
more specialized contents easier for beneficiaries and companies
to read and understand.
The introduction of carbon pricing is continuing apace around
the world, and discussions and deliberations on carbon pricing
are also progressing in Japan. In addition, the European
Commission, which is at the forefront of climate change policy,
has announced the introduction of a “carbon border tax” on
imports from countries with less stringent environmental
regulations. This tax targets five high-emitting product
categories—steel, cement, fertilizer, aluminum and electricity.
We have now entered an era in which identifying and reducing
greenhouse gas emissions associated with companies’
business activities are directly connected to corporate profits
and value. In other words, for companies, climate change risks
and opportunities are transforming from non-financial
information into financial information.
While ESG information is currently considered one element of non-financial information, the time is fast approaching when it
will transform into financial information, particularly for information on the risks and opportunities associated with climate
change. On the other hand, current analysis methods are still limited in terms of identifying the extent to which climate change
will impact future corporate value and industry structure. As a cross-generational investor, GPIF believes that it needs to
address this issue head on.
71 GPIF ESG REPORT 2020

This can also be applied to investors. We have entered an
era in which measuring the carbon footprint and carbon
intensity of portfolios is not only part of being accountable to
beneficiaries, but is also considered an element of risk
management and investment strategy from the perspective of
assessing the impact on investee company and portfolio asset
values. This understanding lead us to begin analyzing the
impact of climate change on corporate value using the Climate
Value-at-Risk (CVaR) method in last year’s ESG Report 2019. In
this ESG Report 2020, we expanded the scope of greenhouse
gas emissions used in the CVaR analysis to include Scope 31.
While this raises the fundamental question of whether
greenhouse gas emissions in the supply chain can be
measured appropriately, there is another equally if not more
difficult issue: how to assess the change in demand associated
with cost burden and price changes.
In the new CVaR analysis, we analyzed the impact of climate
change on corporate value throughout the supply chain using the
assumed burden rate (assumed price pass-through rate) for the
increase in costs associated with climate change. However, while
the assumed burden rate is roughly set for each product
transported or used, the CVaR model does not assume that price
control is greatly affected in the real world by the brand power of
the product or by the presence or absence of substitute
products. Neither does it assume that demand structure changes
as the sales price of the product or service changes. To
supplement the CVaR analysis, therefore, we also conducted an
analysis of inter-industry transfer of transition risks and
opportunities. The relationship between the required reduction
and the reduction contributions discussed in this analysis can
also be summarized in the relationship between Scopes 1 + 2
and Scope 3. Although in the energy and chemical sectors,
business activities themselves have a large environmental
impact, their greenhouse gas reduction technologies are
expected to contribute significantly to greenhouse gas reductions
in downstream industries. At first glance, the introduction of
carbon pricing may seem to be a major drawback for the
performance of these industries, but the growing need for
greenhouse gas reduction technologies and increased price
competitiveness of low-carbon products can result in significant
growth opportunities. Socio-economic systems and industrial
structures could see major changes between 2030 and 2050
that are far more drastic than those analyzed in this report.
Although we feel that the content of our analysis is improving
year by year, there is still much room for improvement before we
can properly identify the impact of climate change on future
corporate value and industrial structure – it is not a simple
problem that we will be able to answer in just a year or two. As a
cross-generational investor, however, we believe that this is an
issue that we need to address head on.
For a more detailed report of the results of the analysis
conducted for TCFD disclosure, please see the Analysis of
Climate Change-Related Risks and Opportunities in the GPIF
Portfolio, scheduled for publication around the fall of 2021. (*The
photo above is an artist’s rendition of the cover.)
1 Emissions from procured products and services other than purchased electricity (upstream Scope 3) and indirect emissions from the consumption and use of sold products and
services (downstream Scope 3)
For All Generations
2020年度 ESG活動報告 別冊
GPIFポートフォリオの気候変動リスク・機会分析
005_8221379682110.indd 全ページ005_8221379682110.indd 全ページ 2021/07/30 11:06:052021/07/30 11:06:05
Kenji ShiomuraEditor-in-Chief, ESG Report (ESG Team Head)
72GPIF ESG REPORT 2020
Chapter 3 Evaluation and Analysis of Climate Change Risks and Opportunities
Chapter 1 GPIF’s ESG InitiativesChapter 2 Measuring the Im
pacts of ESG ActivitiesEditor’s Note

Annual Report 2020 ESG Illustrated
Disclaimer
Equileap
This report contains certain data sourced from Equileap Investment Services Support or its affiliates (hereafter “Equileap”).
Equileap is a third-party data provider and does not accept any direct or indirect liability for the accuracy, completeness or use of
the information it provided. The Equileap data and information contained herein: (a) is proprietary to Equileap; (b) may not be
copied or distributed without Equileap’s express written consent; and (c) is not warranted to be accurate, complete or timely.
Copyright 2021 Equileap. All Rights Reserved.
FTSE
London Stock Exchange Group plc and its group undertakings (collectively, the “LSE Group”). © LSE Group2021. FTSE Russell
is a trading name of certain of the LSE Group companies. “FTSE®”, “FTSE Russell®”, “Beyond Ratings®” are trademarks of the
relevant LSE Group companies and are used by any other LSE Group company under license. All rights in the FTSE Russell
indexes or data vest in the relevant LSE Group company which owns the index or the data. Neither LSE Group nor its licensors
accept any liability for any errors or omissions in the indexes or data and no party may rely on any indexes or data contained in
this communication. No further distribution of data from the LSE Group is permitted without the relevant LSE Group company’s
express written consent. The LSE Group does not promote, sponsor or endorse the content of this communication.
MSCI
Although GPIF’s information providers, including without limitation, MSCI ESG Research LLC and its affiliates (the “ESG
Parties”), obtain information from sources they consider reliable, none of the ESG Parties warrants or guarantees the originality,
accuracy and/or completeness, of any data herein and expressly disclaim all express or implied warranties, including those of
merchantability and fitness for a particular purpose. None of the Information is intended to constitute investment advice or a
recommendation to make (or refrain from making) any kind of investment decision and may not be relied on as such, nor should
it be taken as an indication or guarantee of any future performance, analysis, forecast or prediction. None of the ESG Parties
shall have any liability for any errors or omissions in connection with any data or Information herein, or any liability for any direct,
indirect, special, punitive, consequential or any other damages (including lost profits) even if notified of the possibility of such
damages.
S&P Trucost
Certain data and information contained herein has been supplied by S&P Trucost Limited. All rights in and to the Trucost data,
information and reports (including any and all intellectual property contained therein) vest in Trucost and/or its licensors or
affiliates. Neither Trucost, nor its affiliates, nor its licensors accept any liability for any errors, omissions or interruptions in the
Trucost data, information and/or reports. No further distribution of the data, information and/or reports is permitted without
Trucost’s express written consent. S&P Trucost Limited and/or its licensors or affiliates do not in any manner warrant or
represent that its’ respective data, information and reports contained herein are appropriate or available for use in any particular
location. Your access and use of the relevant data and reports shall be done so in compliance with all applicable laws.
73 GPIF ESG REPORT 2020

Investment Principles
Our overarching goal should be to achieve the investment returns required for the public
pension system with minimal risks, solely for the benefit of pension recipients from a
long-term perspective, thereby contributing to the stability of the system.1
2Our primary investment strategy should be diversification by asset class, region, and
timeframe. While acknowledging fluctuations of market prices in the short term, we shall
achieve investment returns in a more stable and efficient manner by taking full
advantage of our long-term investment horizon. At the same time, we shall secure
sufficient liquidity to pay pension benefits.
3We formulate the policy asset mix and manage and control risks at the levels of the
overall asset portfolio, each asset class, and each investment manager. We employ both
passive and active investments to attain benchmark returns (i.e., average market
returns), while seeking untapped profitable investment opportunities.
4Based on the idea that sustained growth of companies being invested in and the market as
a whole is required for long-term investment returns on assets under management, we
promote investments that take into account the non-financial elements of environmental,
social and governance (ESG), in addition to financial elements, with a view to ensuring
long-term returns for the benefit of pension recipients.
5We promote a variety of activities (including ESG-conscious initiatives) that fulfill our
stewardship responsibility of promoting long-term aims and sustainable growth of our
investments and the market as a whole with a view to increasing long-term
investment returns.
GPIF ESG REPORT 2020 74

Planning and Communication Division,
Planning and Communication Department
Government Pension Investment Fund
Toranomon Hills Mori Tower 7th Floor, 1-23-1
Toranomon, Minato-ku, Tokyo 105-6377, Japan
TEL: +81-3-3502-2486 (direct dial)
FAX: +81-3-3503-7398
Website: https://www.gpif.go.jp/en/
Inquiries:
GPIF Homepage GPIF Tw i t te rGPIF YouTube channel